Download to read offline
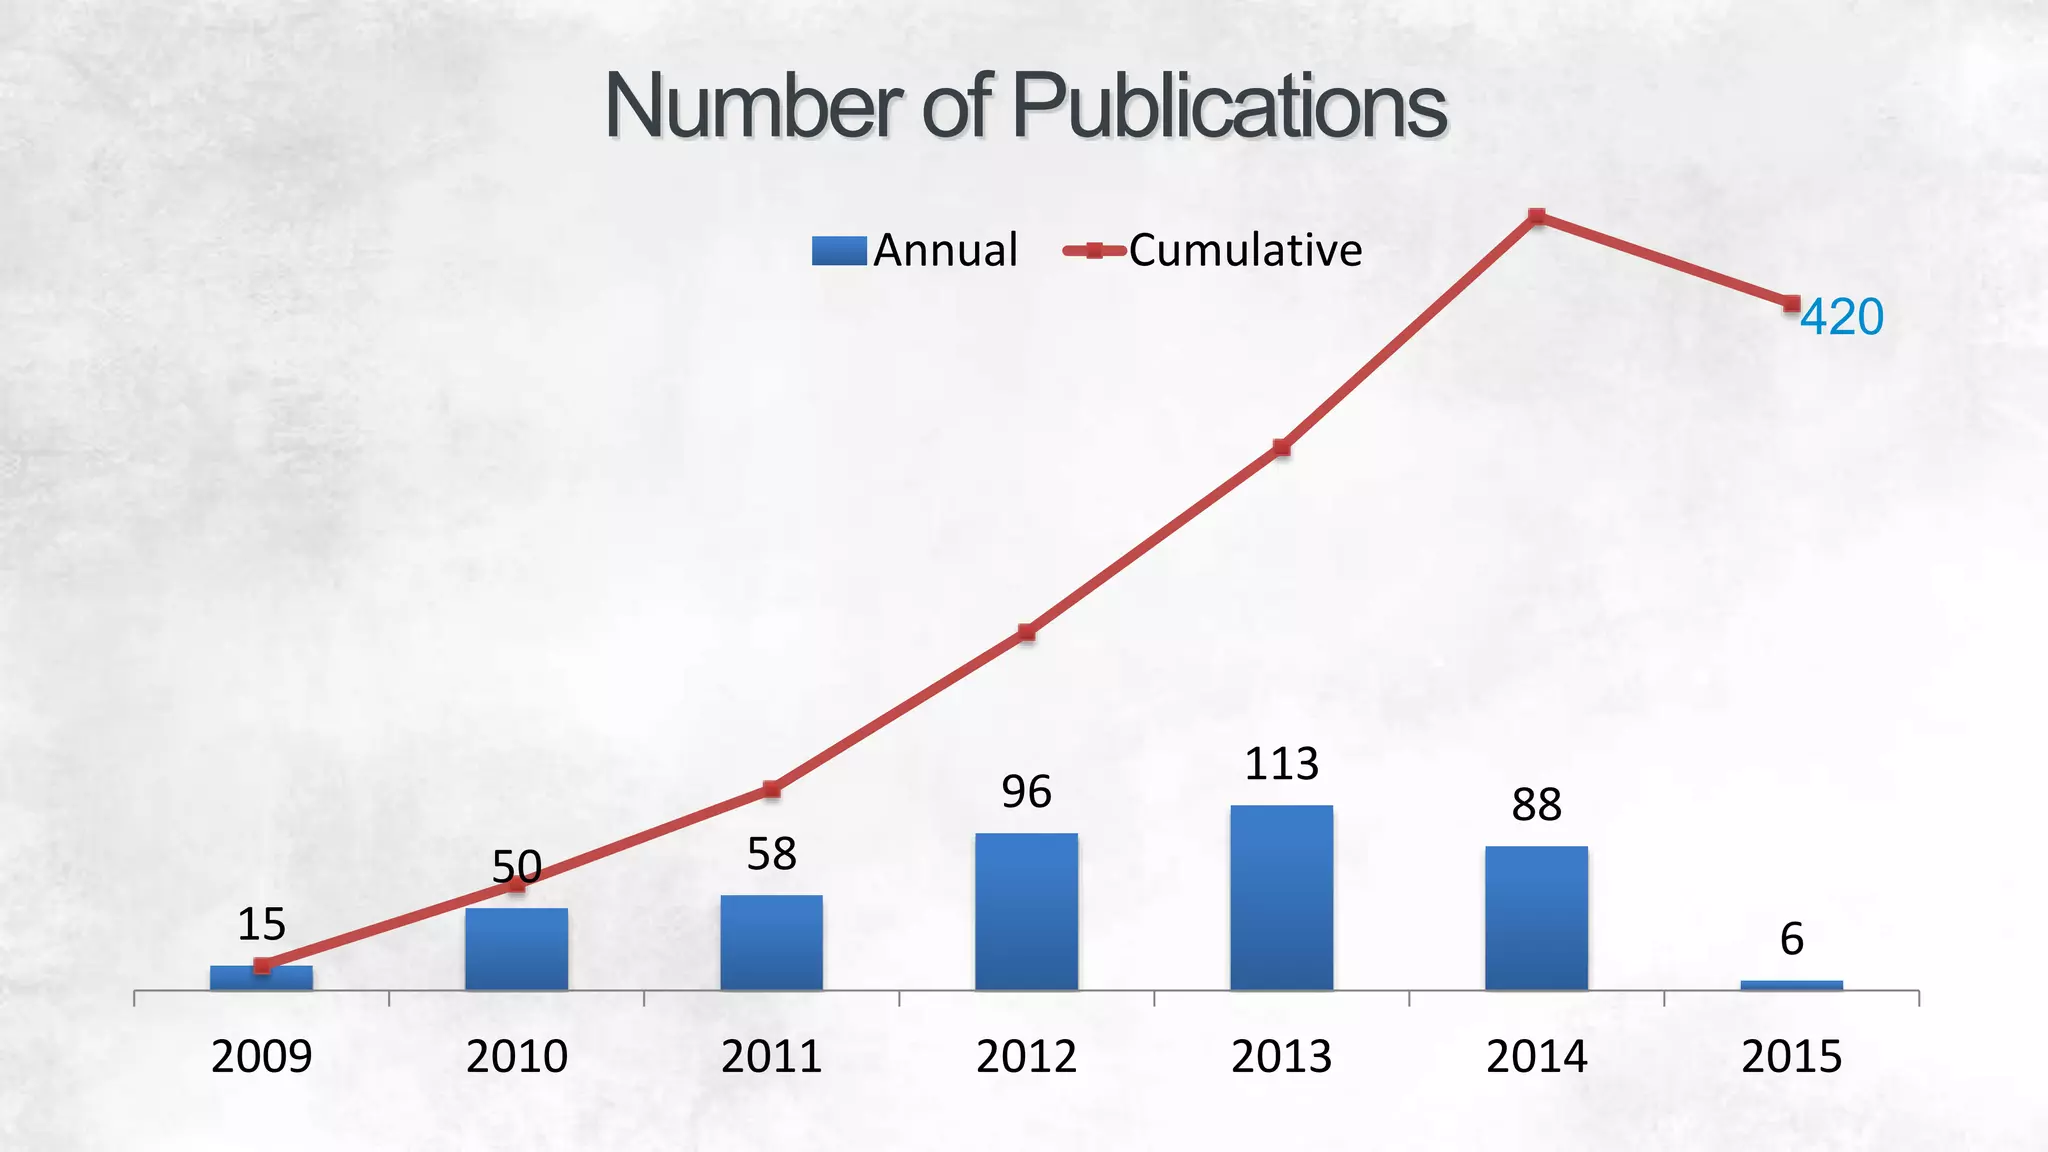
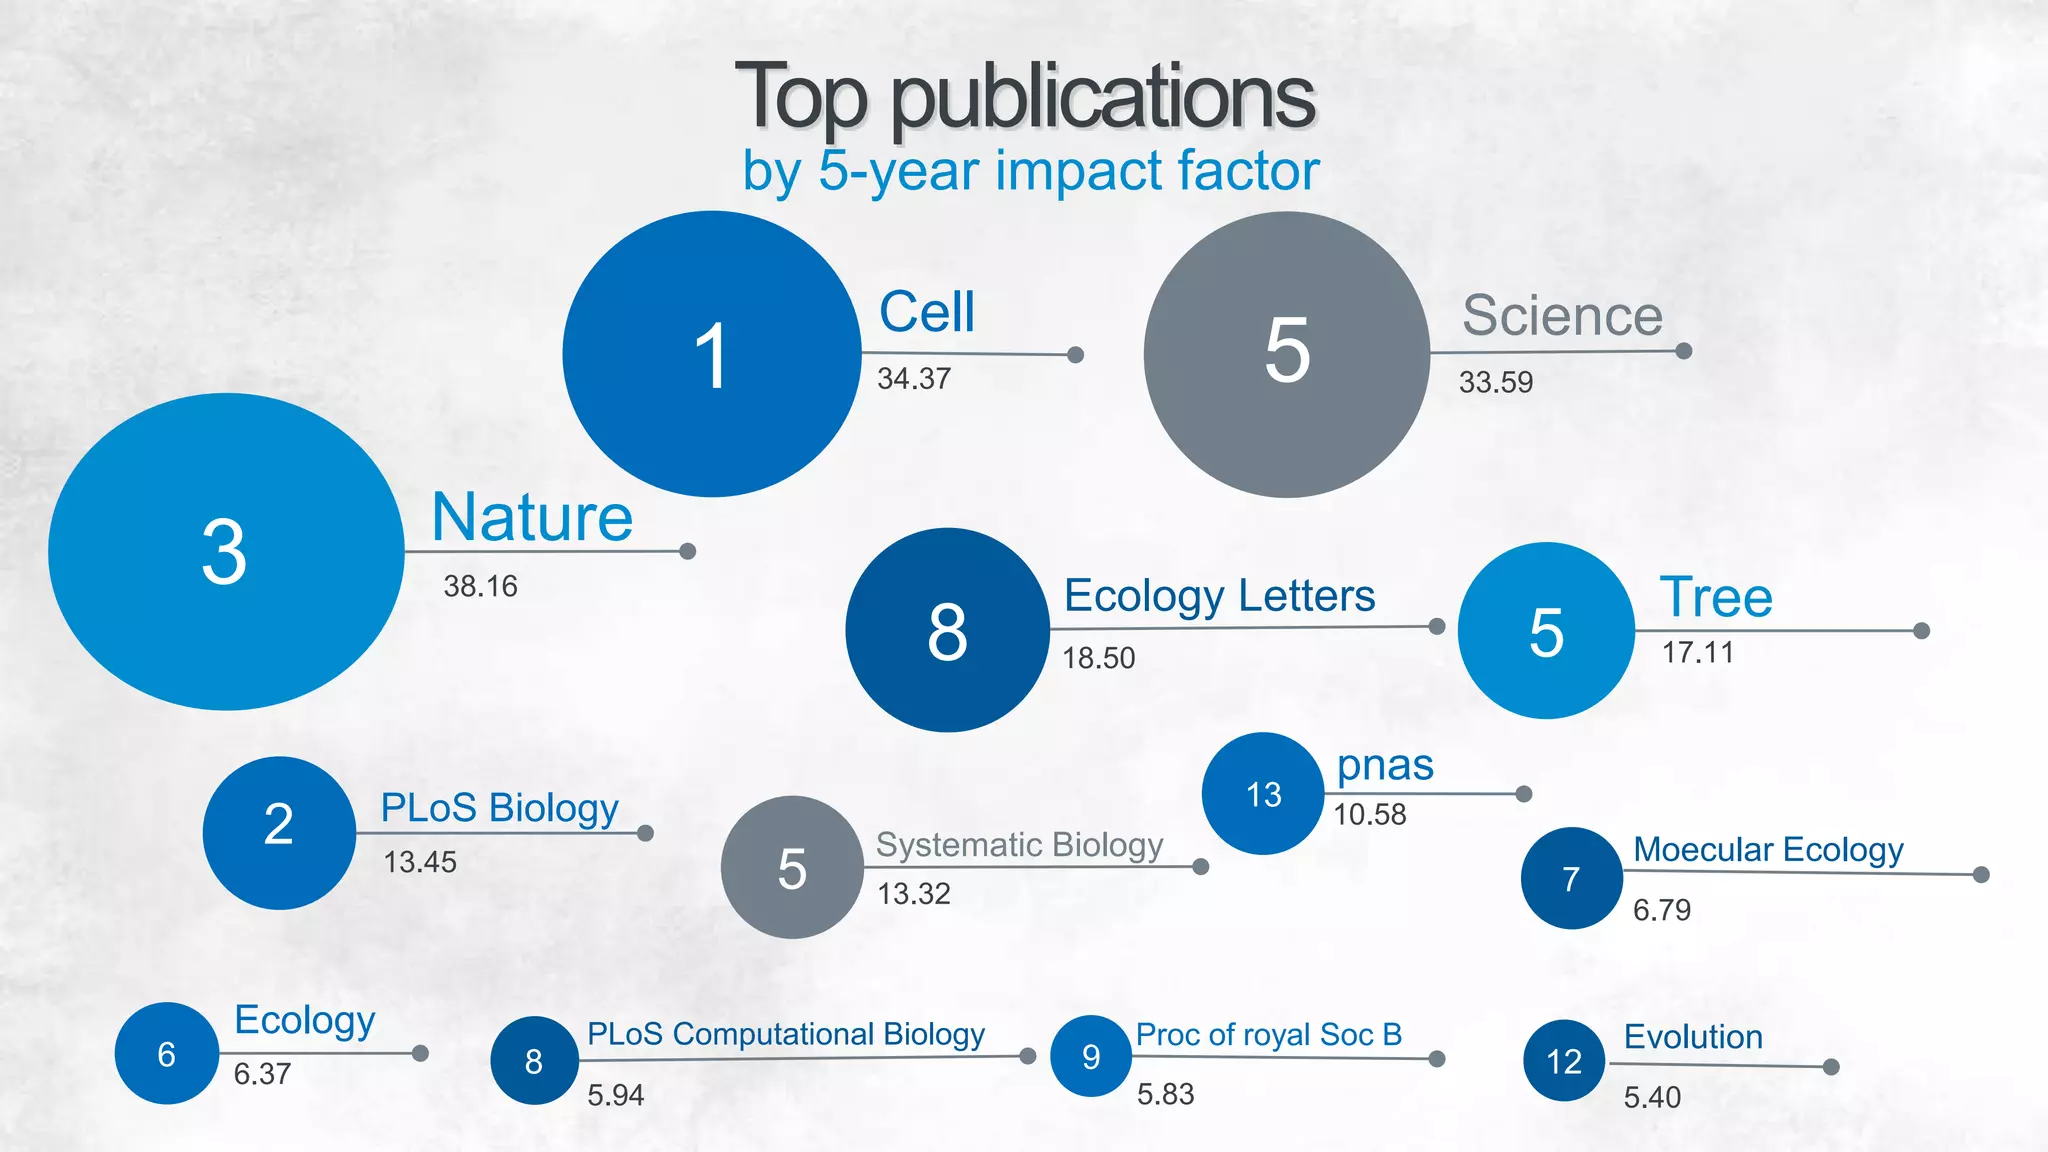
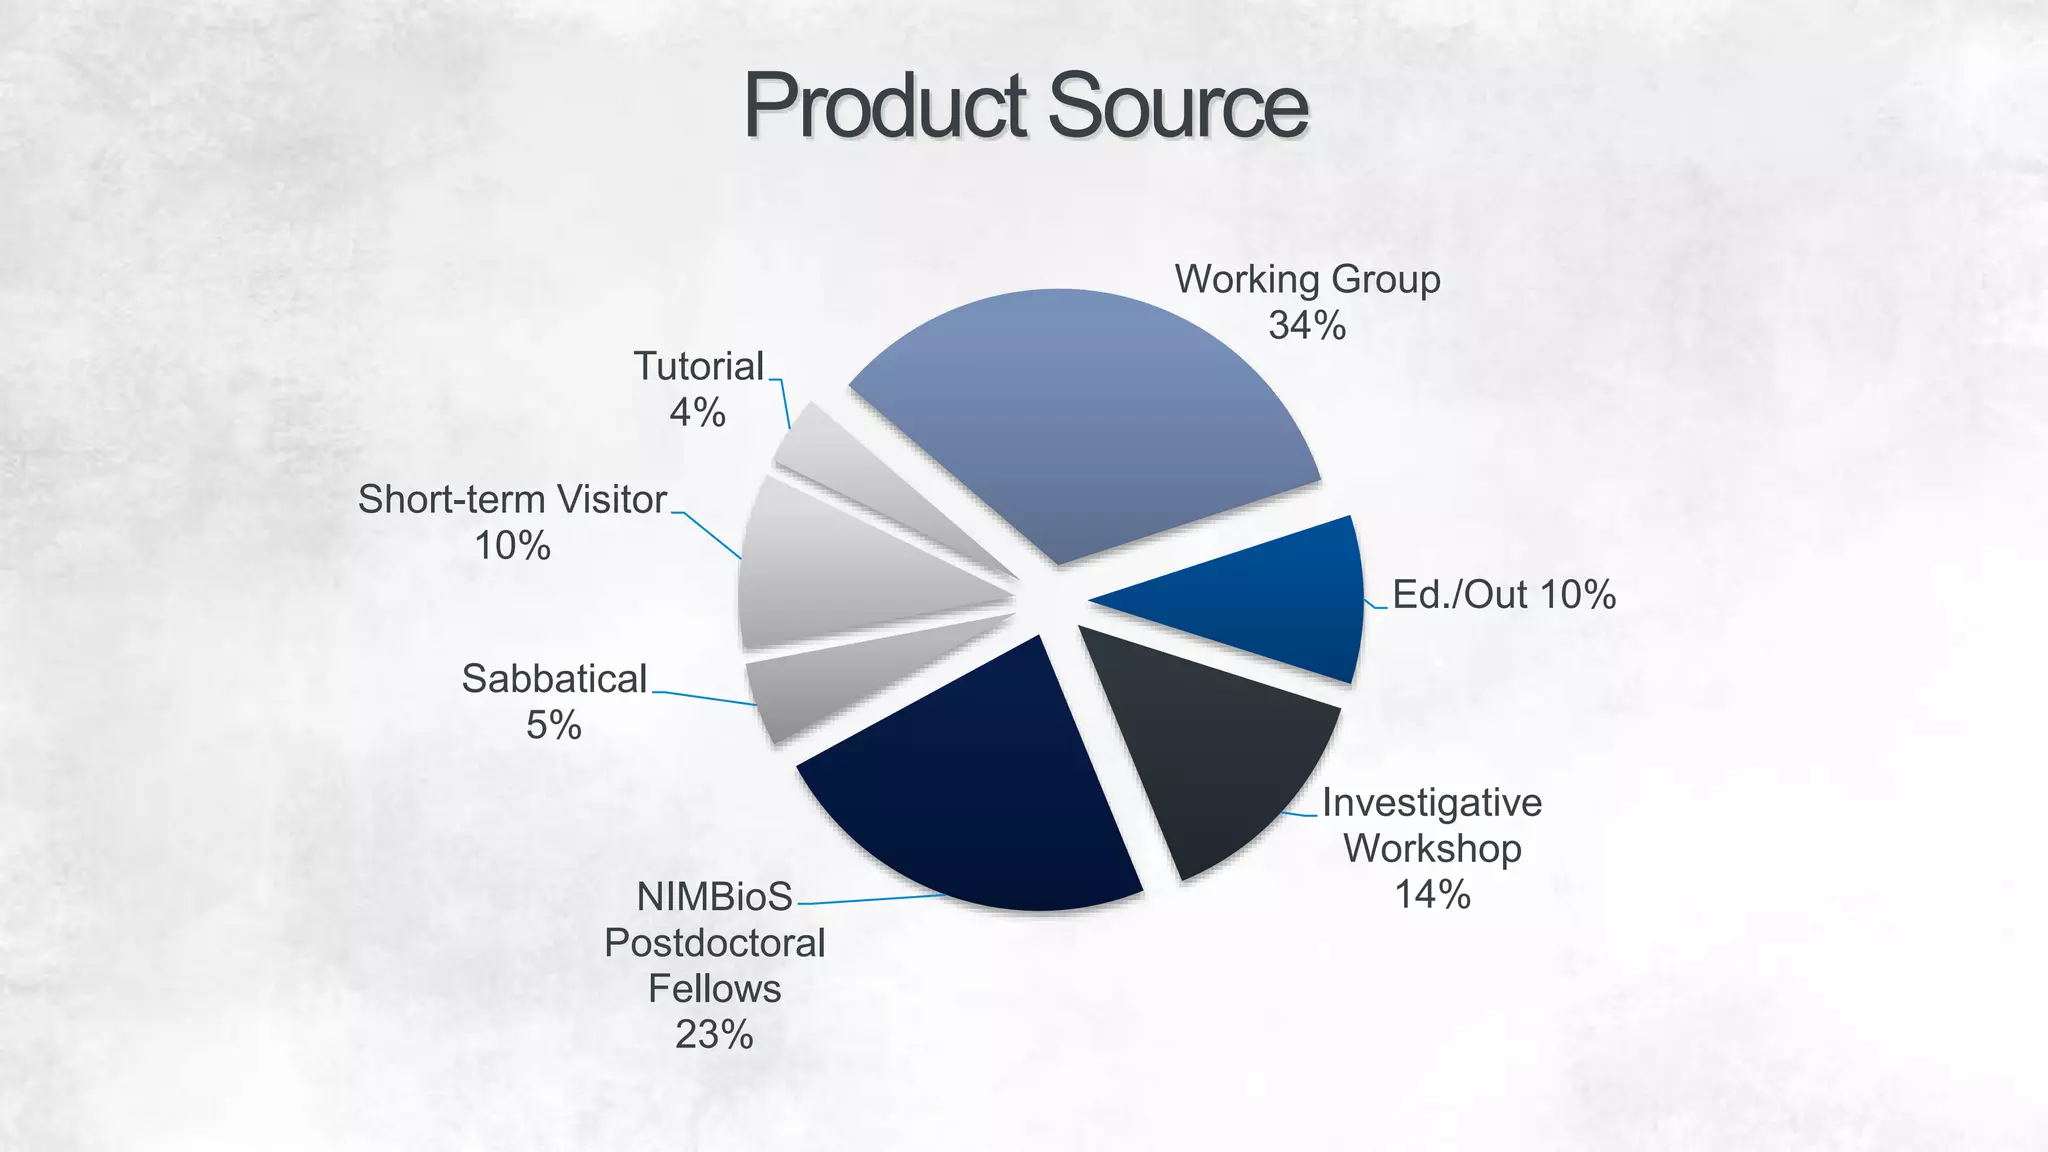
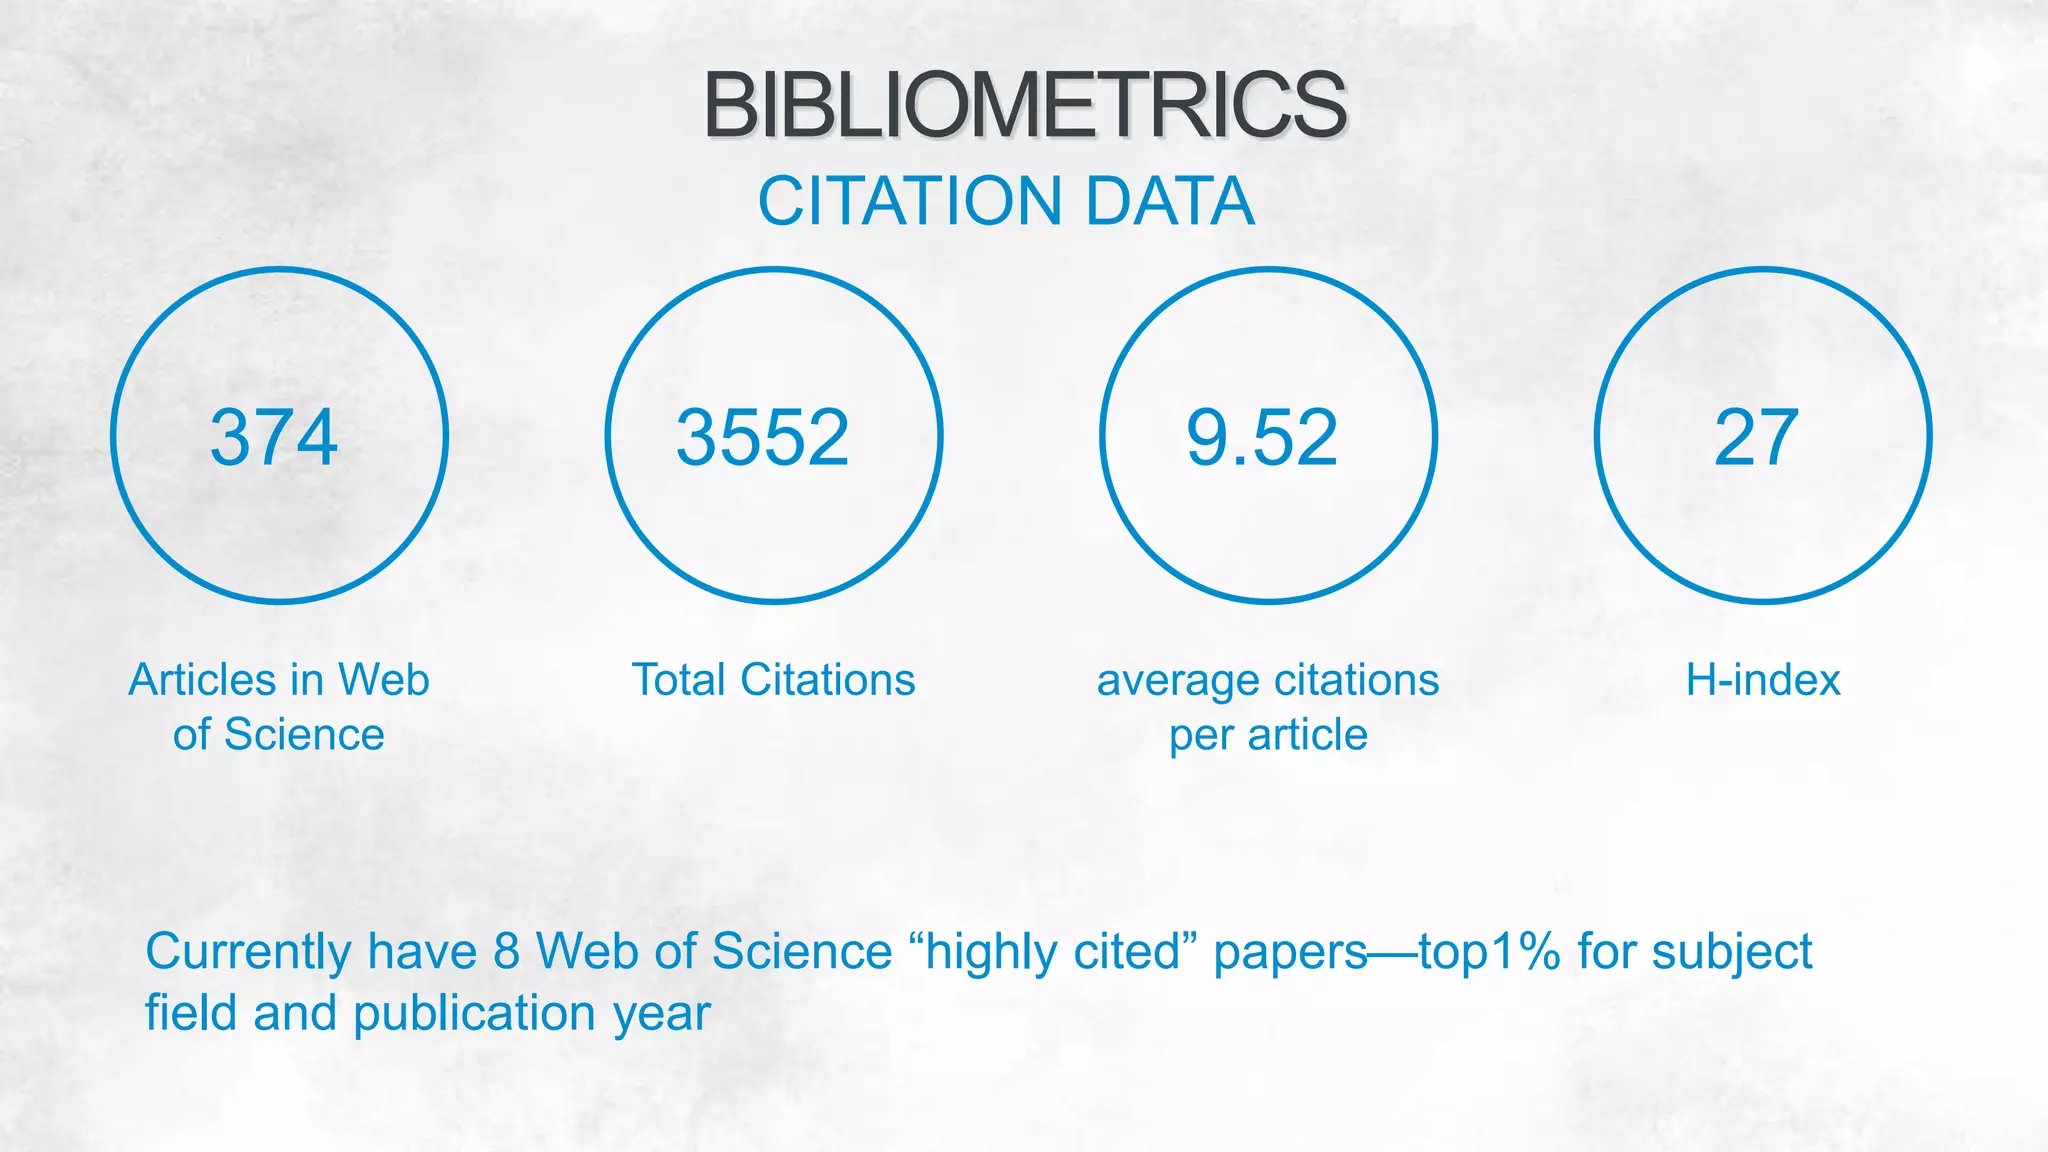
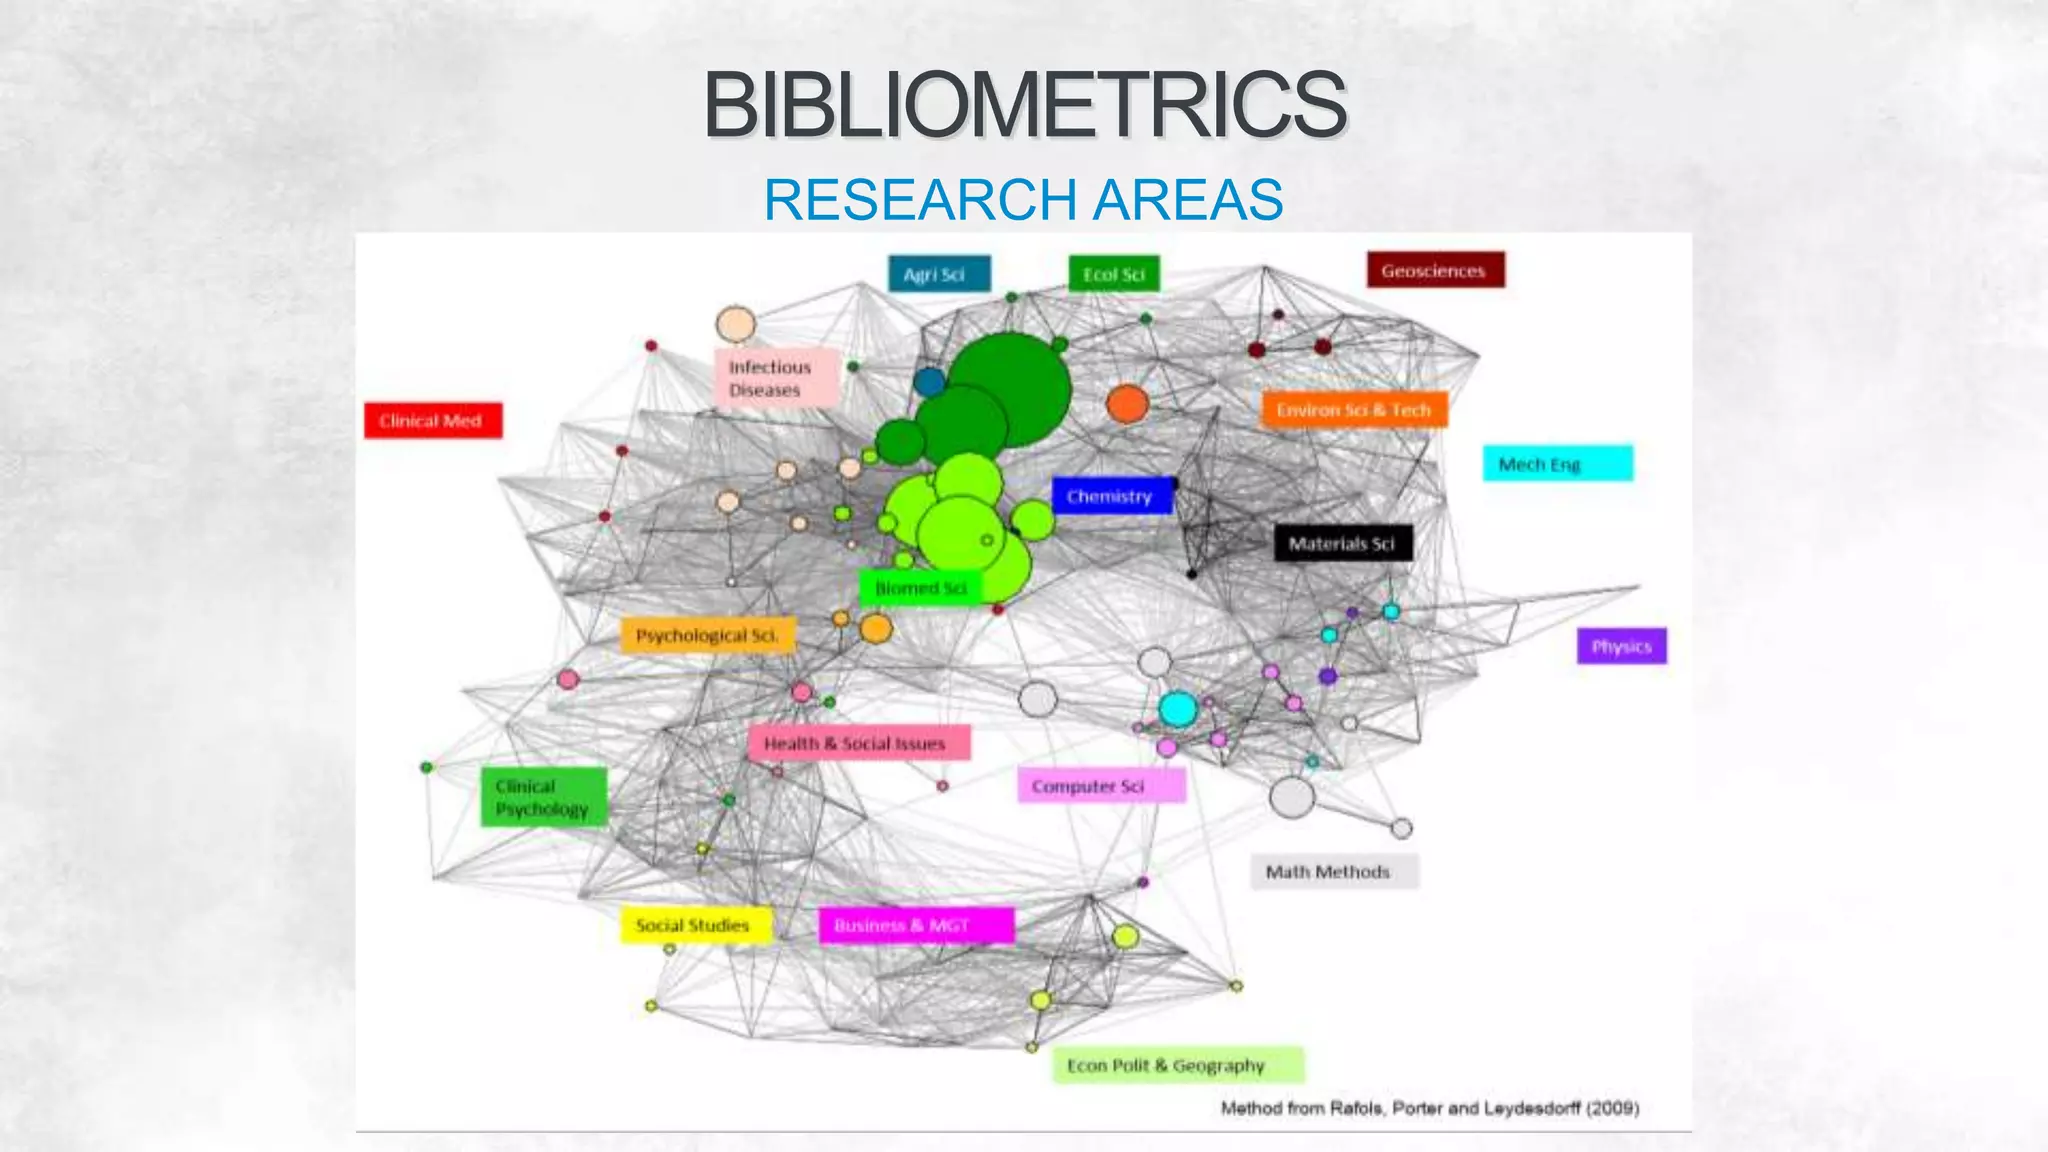
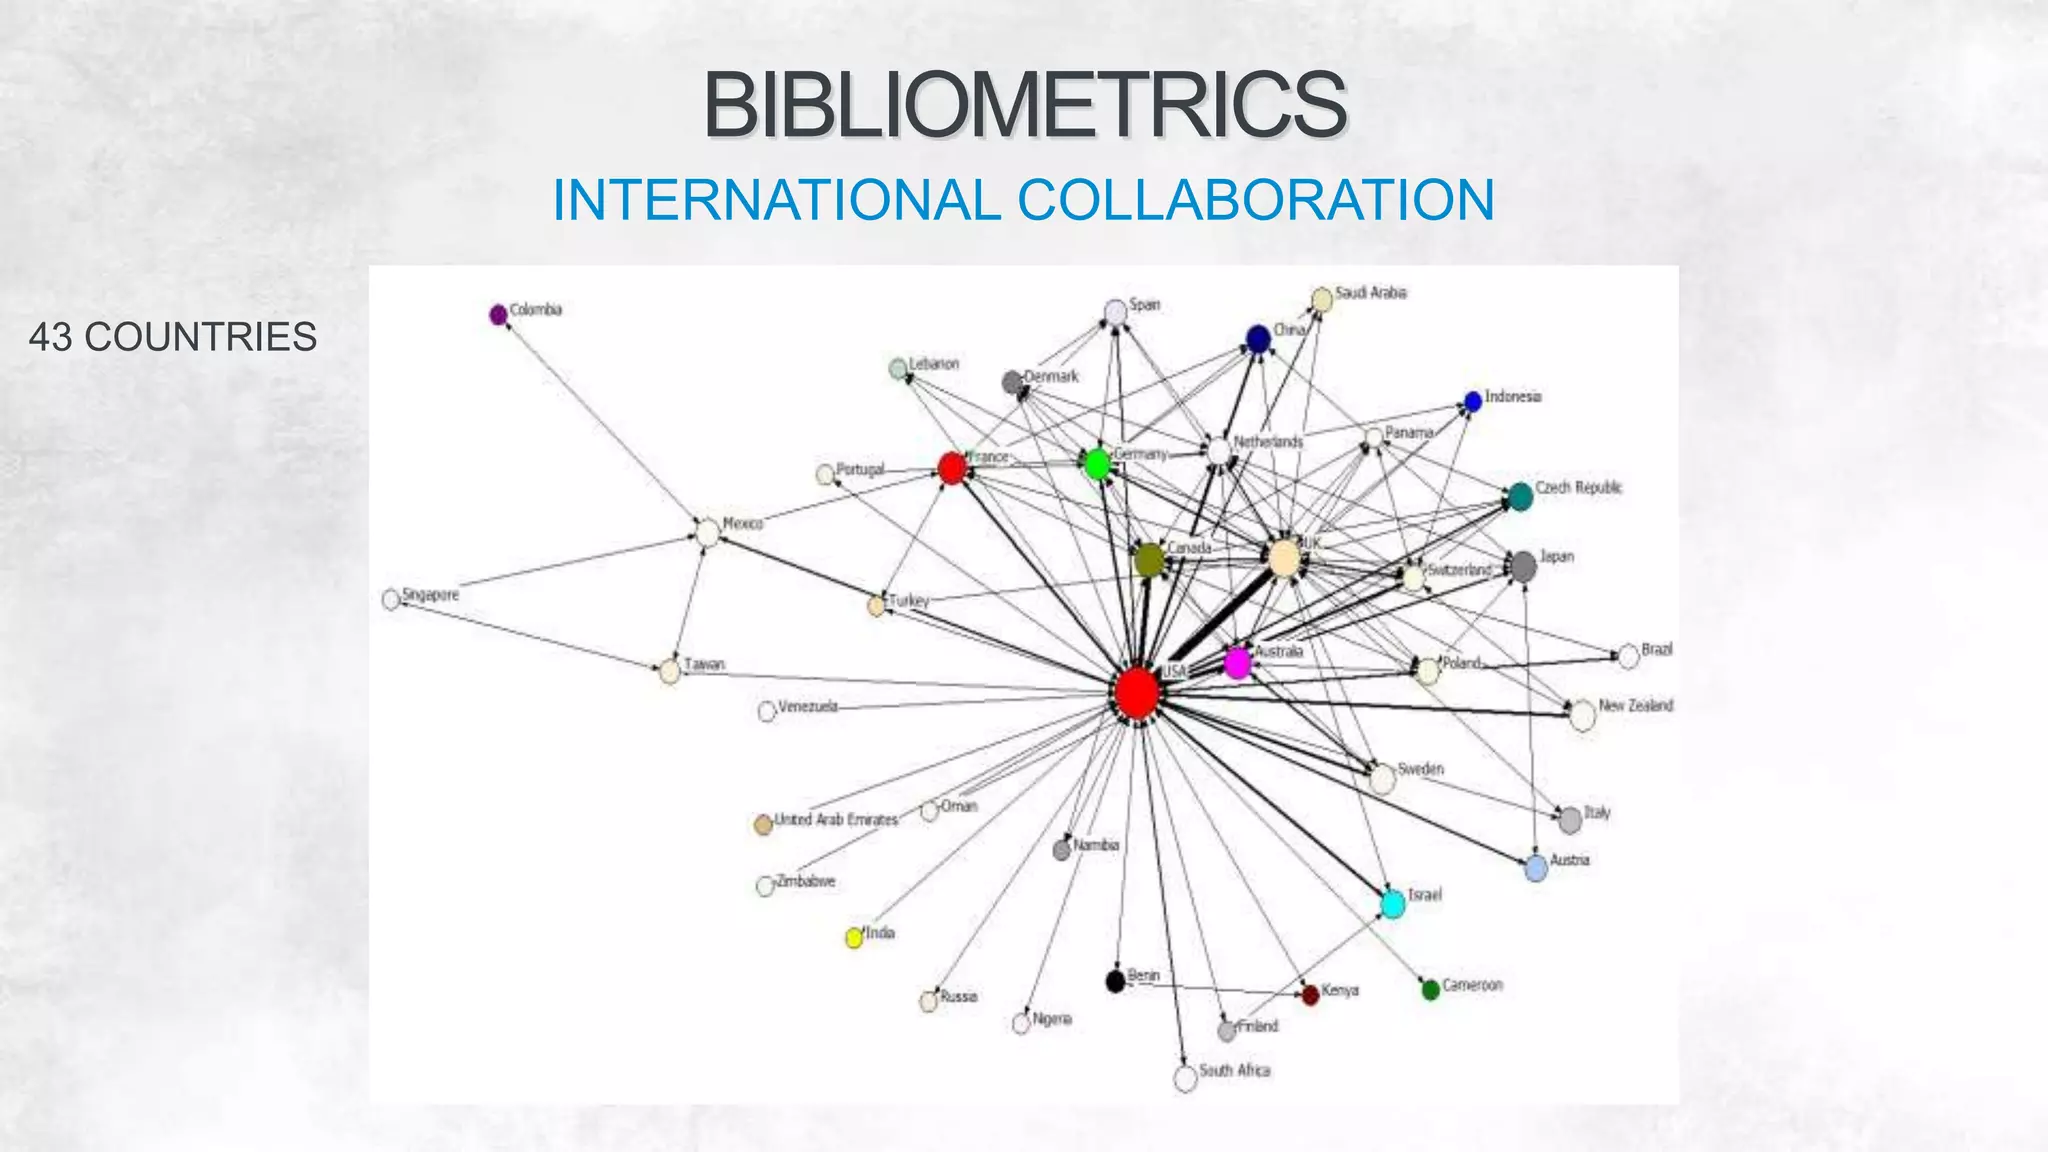
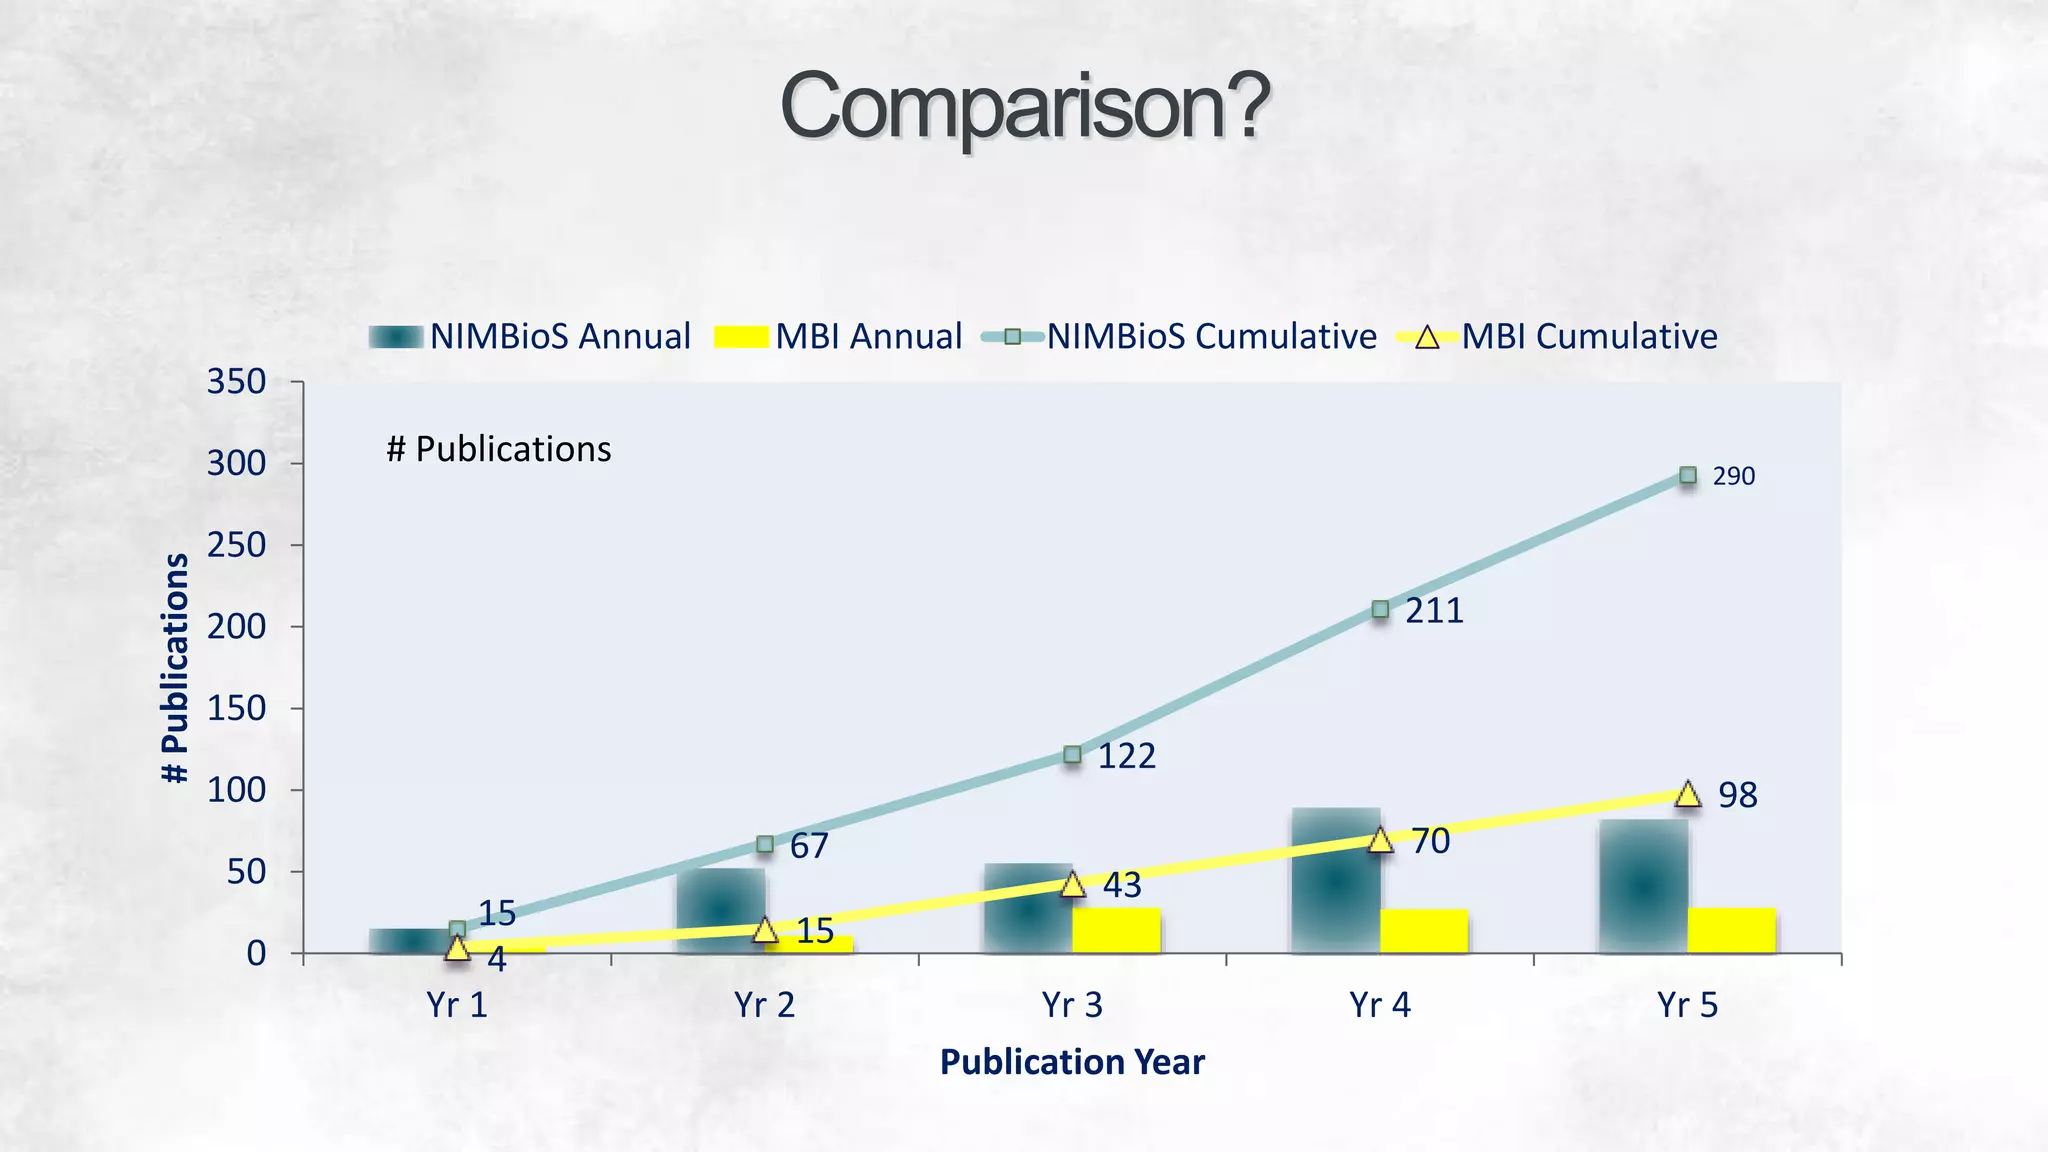
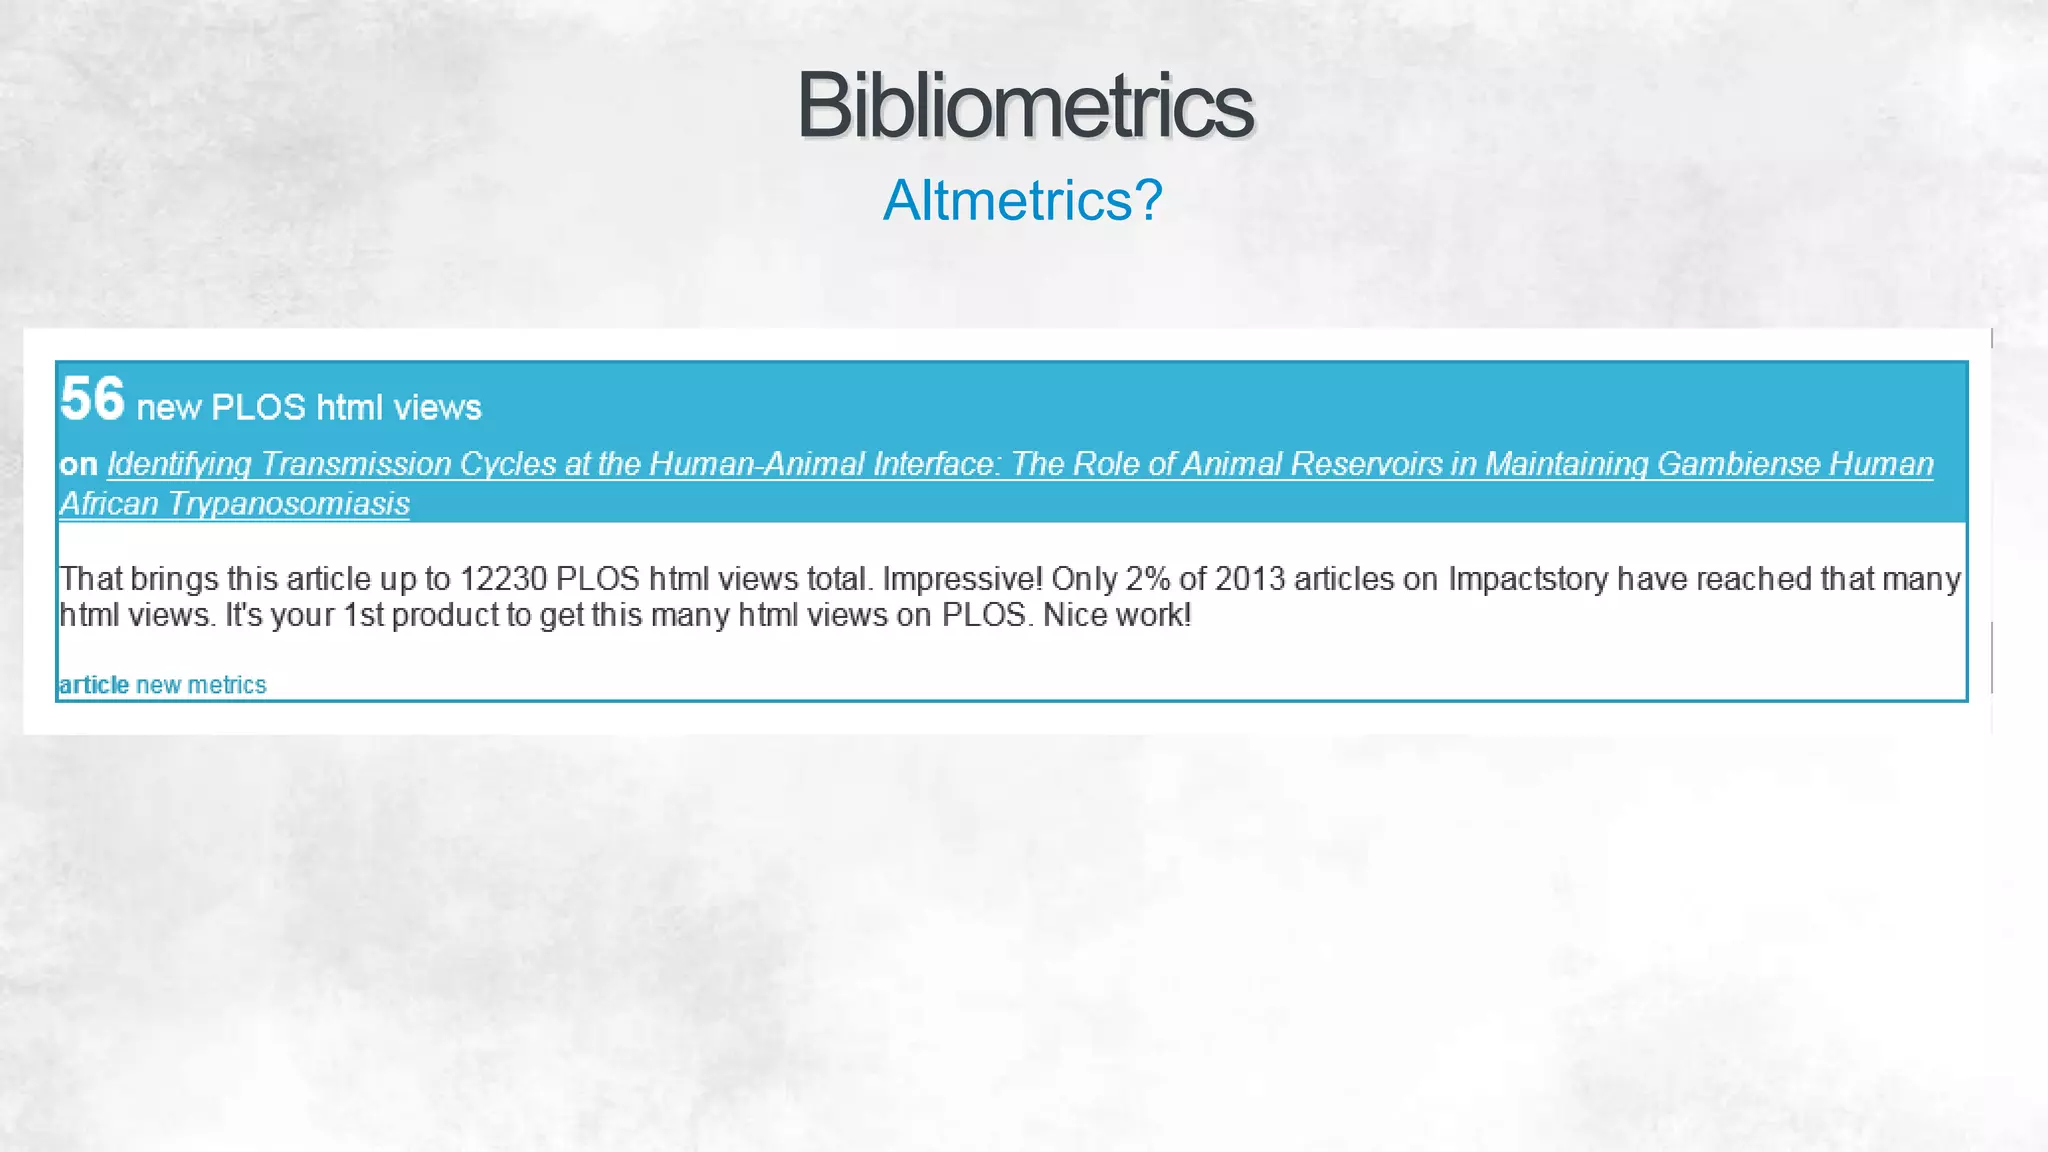
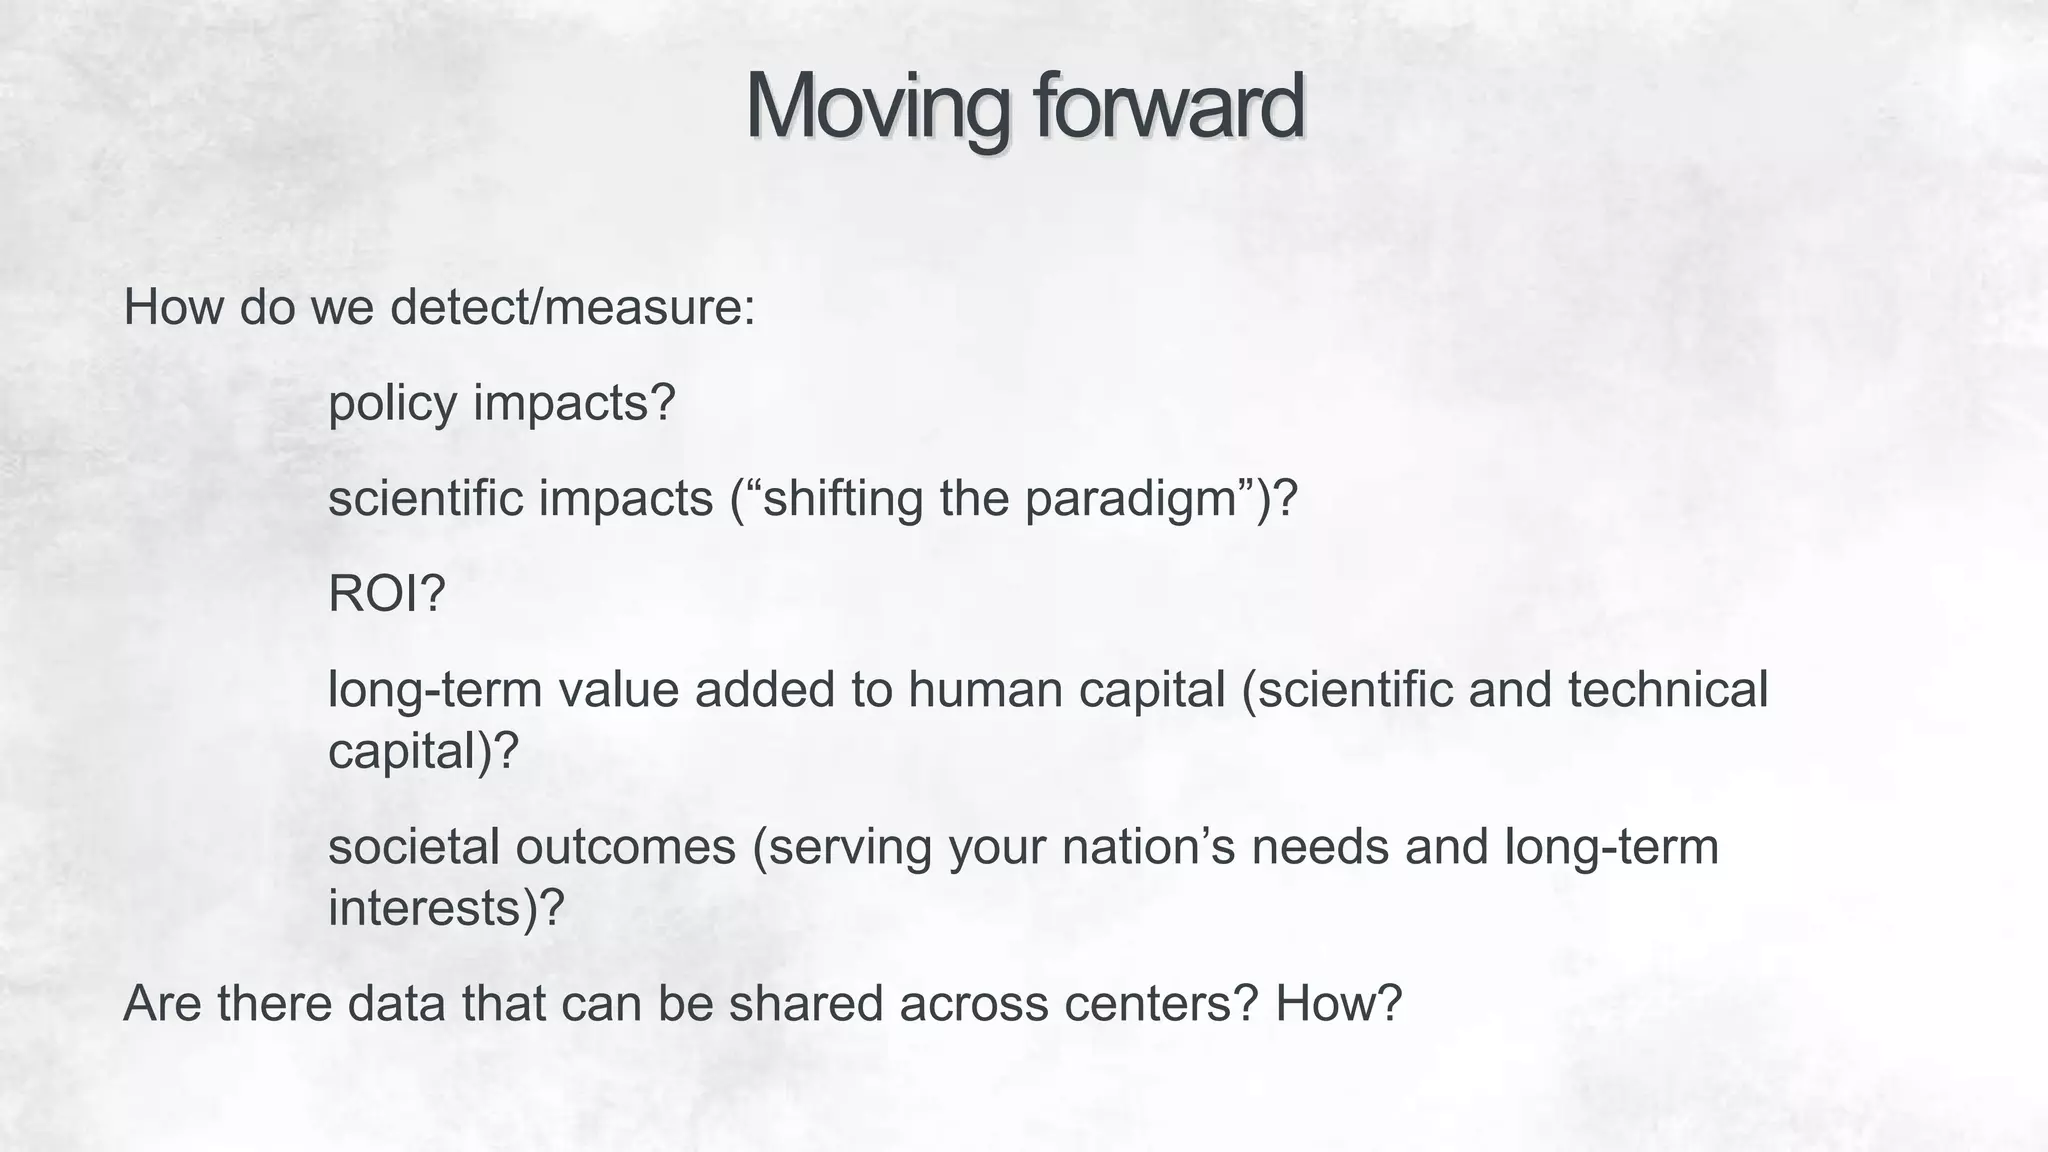
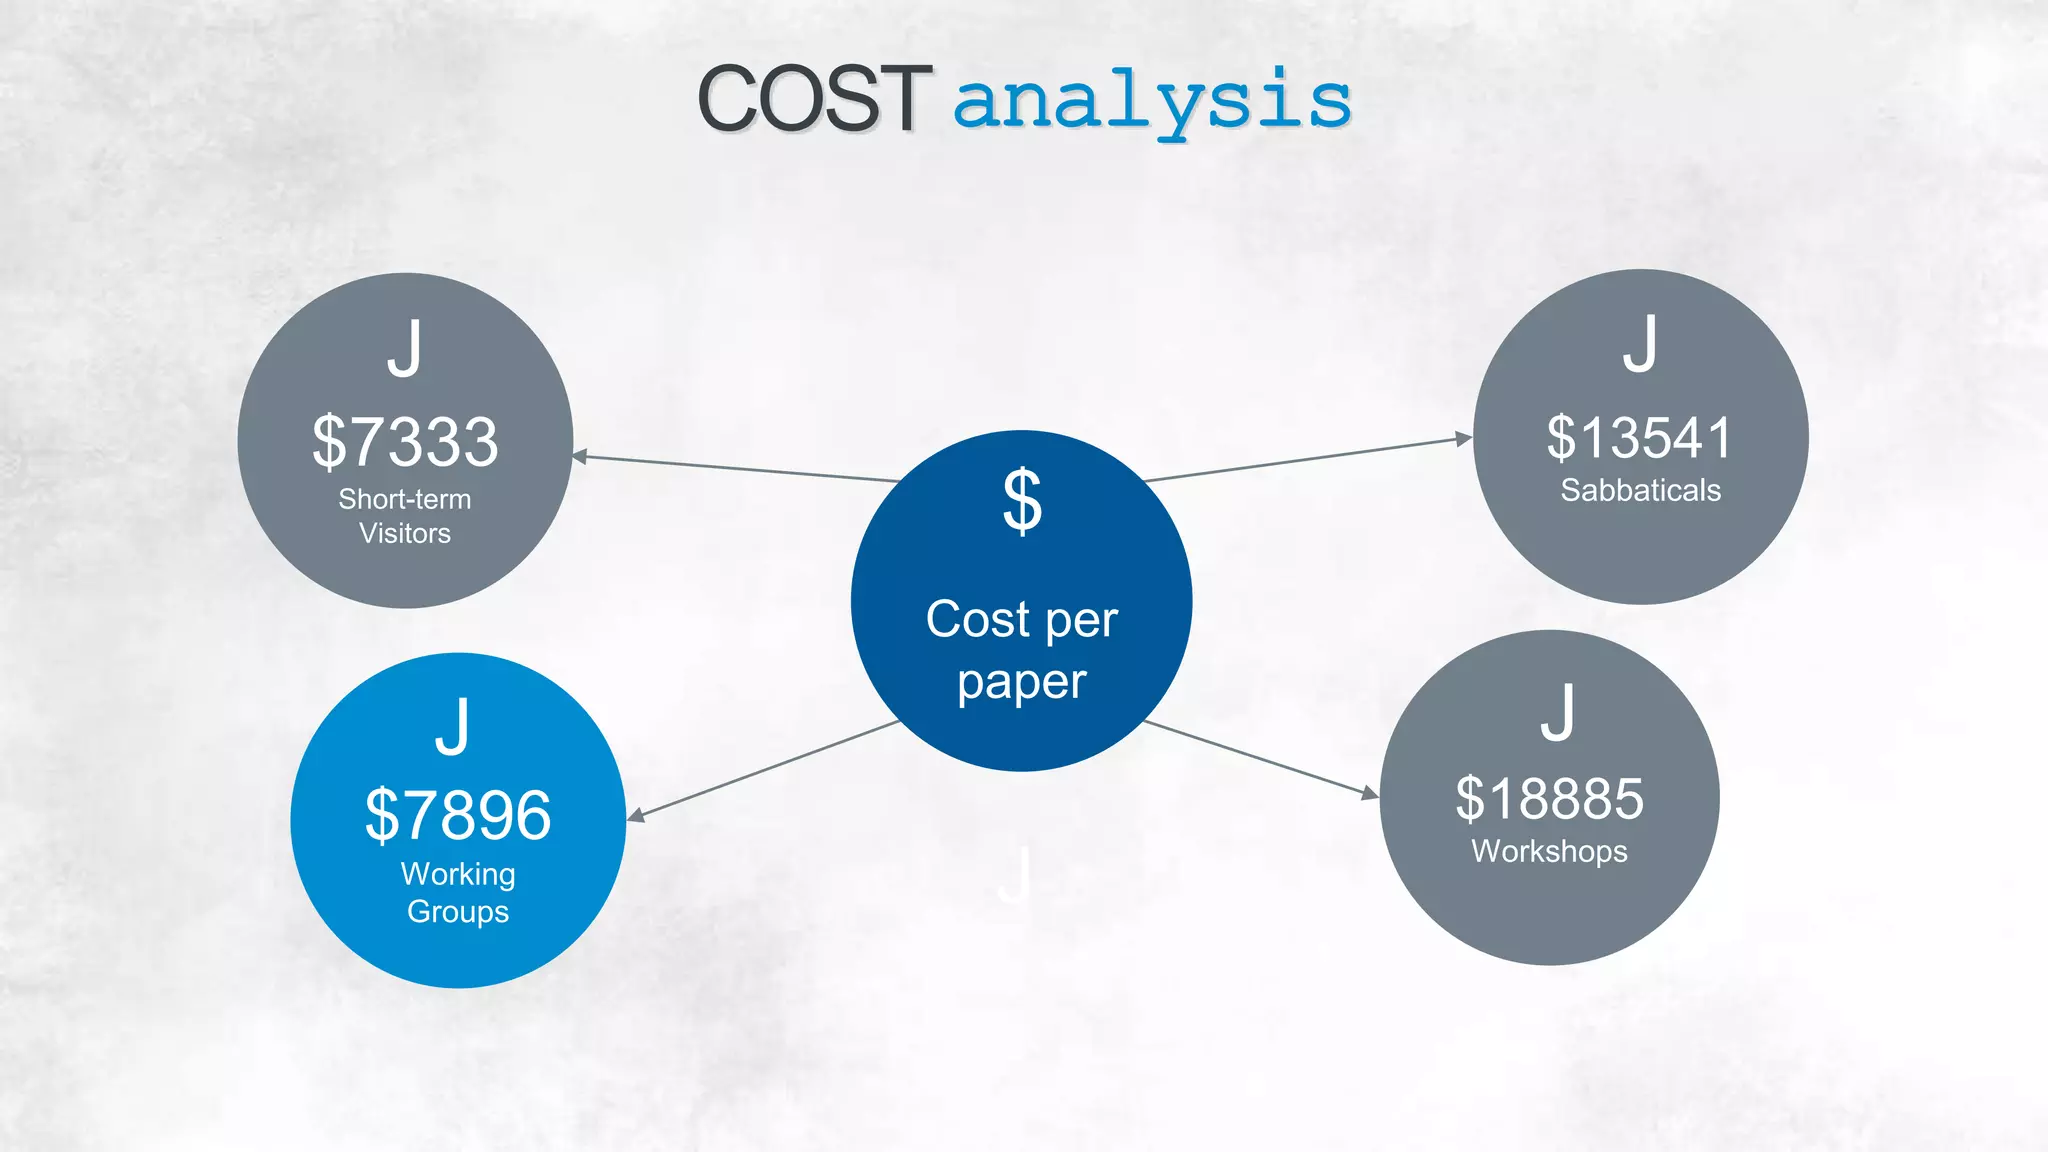

This document provides bibliometric and publication data for NIMBioS (National Institute for Mathematical and Biological Synthesis). It shows that the number of annual publications has increased each year from 2009 to 2015. It also lists the top publications by 5-year impact factor and identifies the sources of NIMBioS research products. Charts show international collaboration between 43 countries and increases in co-authored publications over 5 years. Additional data includes altmetrics, research areas, participant experiences in working groups, and social media presence. Cost analyses are also presented for different NIMBioS programs.


