More Related Content
Similar to Bioluminescence Resonance Energy Transfer (BRET) ARTUCLO 1.pdf
Similar to Bioluminescence Resonance Energy Transfer (BRET) ARTUCLO 1.pdf (20)
Bioluminescence Resonance Energy Transfer (BRET) ARTUCLO 1.pdf
- 1. NATURE PROTOCOLS | VOL.1 NO.1 | 2006 | 337
PROTOCOL
INTRODUCTION
What is BRET?
BRET is a naturally occurring phenomenon used in the labora-
tory for real-time monitoring of protein-protein interactions
in live cells, cell extracts or purified preparations1−3. The nonra-
diative (dipole-dipole) transfer of energy from donor enzyme to
complementary acceptor fluorophore occurs after substrate oxida-
tion, and its efficiency is inversely proportional to the sixth power
of the distance between donor and acceptor dipoles. This energy
only excites the acceptor fluorophore if it is in close proximity to
the donor, resulting in light emission at a longer wavelength that
can be detected and expressed relative to the donor light emission.
By generating cDNA fusion constructs, which are transfected into
cells within a suitable expression vector4, fusion proteins consist-
ing of proteins of interest linked to donor or acceptor molecules
are expressed. Donor to acceptor energy transfer and consequent
emission from the acceptor generally indicates separation of less
than 10 nm, thus indicating that the proteins of interest are likely
to be interacting with each other (directly or as part of a complex)5.
Indeed, this high distance dependence means that various combi-
nations of fusion proteins with donor or acceptor molecules in dif-
ferent positions should be tested to establish the best combination
for BRET. The BRET procedure is summarized in Figure 1.
Diversity of proteins investigated
BRET has been used to study a wide range of protein-protein inter-
actions in bacterial6, plant7 and mammalian cells8,9. The first use
of BRET studied KaiB circadian clock protein dimerization6. Since
then, well over a hundred protein-protein interaction studies have
used BRET,with approximately half monitoring interactions involv-
ing G protein−coupled receptors (GPCRs), particularly dimeriza-
tion or oligomerization, but also interactions with both membrane
and cytosolic proteins10. The other half of studies that have used
BRET covers a diverse range of interactions too large to mention
here, but includes those involving other membrane-bound recep-
tors11,12, cytosolic receptors13,14, integrins11,15, enzymes15,16, endo-
philins17 and nuclear cofactors18. This diversity illustrates that any
protein-protein interaction can potentially be observed using BRET
provided that the proteins can be suitably labeled and expressed in a
functionally relevant manner1.
Suitability of BRET
The BRET technique is most suited to investigating ligand-modu-
lated (or reagent-modulated) interactions as changes in BRET sig-
nal after reagent addition provide good evidence for interaction
specificity, provided that the reagent is not cytotoxic and does not
inhibit substrate oxidation. Changes in BRET signal may repre-
Bioluminescence resonance energy transfer (BRET)
for the real-time detection of protein-protein
interactions
Kevin D G Pfleger, Ruth M Seeber & Karin A Eidne
7TM Laboratory/Laboratory for Molecular Endocrinology, Western Australian Institute for Medical Research (WAIMR) and UWA Centre for Medical Research, University
of Western Australia, Nedlands, Perth, Western Australia 6009, Australia. Correspondence should be addressed to K.D.G.P. (kpfleger@waimr.uwa.edu.au).
Published online 27 June 2006; doi:10.1038/nprot.2006.52
A substantial range of protein-protein interactions can be readily monitored in real time using bioluminescence resonance
energy transfer (BRET). The procedure involves heterologous coexpression of fusion proteins, which link proteins of interest to
a bioluminescent donor enzyme or acceptor fluorophore. Energy transfer between these proteins is then detected. This protocol
encompasses BRET1, BRET2 and the recently described eBRET, including selection of the donor, acceptor and substrate combination,
fusion construct generation and validation, cell culture, fluorescence and luminescence detection, BRET detection and data analysis.
The protocol is particularly suited to studying protein-protein interactions in live cells (adherent or in suspension), but cell extracts
and purified proteins can also be used. Furthermore, although the procedure is illustrated with references to mammalian cell culture
conditions, this protocol can be readily used for bacterial or plant studies. Once fusion proteins are generated and validated, the
procedure typically takes 48–72 h depending on cell culture requirements.
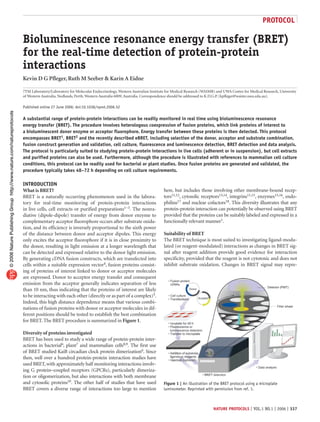
Figure 1 | An illustration of the BRET protocol using a microplate
luminometer. Reprinted with permission from ref. 1.
©
2006
Nature
Publishing
Group
http://www.nature.com/natureprotocols
- 2. 338 | VOL.1 NO.1 | 2006 | NATURE PROTOCOLS
PROTOCOL
sent an increase or decrease in the number and/or rate of inter-
actions between the proteins of interest, but they may also result
from conformational changes that influence the relative position-
ing of the donor and acceptor molecules. This needs to be taken
into account when interpreting the data. Studies of constitutive
interactions using BRET must provide evidence for interaction
specificity1, typically using saturation or competition assays as dis-
cussed below. In particular, suitable negative controls are required,
such as similar proteins expressed at similar levels in the same cel-
lular compartment. Positive controls should also be included when
possible. The donor covalently fused to the acceptor is a useful
construct for checking that the protocol is working and to com-
pare between assays. A better positive control is to use a combi-
nation of fusion proteins, which are known to interact, and are
expressed at similar levels and in the same cellular compartment
as the proteins under investigation. The BRET technology is most
suited to studying protein-protein interactions in live cells where
they are expressed in a near-physiological environment in the cor-
rect cellular compartment. Cell extracts or purified proteins can
be used to increase protein expression levels, but these situations
are less likely to provide physiologically relevant data and are par-
ticularly prone to the problems associated with overexpression and
artifactual interactions. The BRET technique is not suitable for
investigating endogenous proteins because of the need for fusion
proteins. Furthermore, unless cells are fractionated19, BRET can-
not currently provide information about subcellular location.
Saturation assays
The use of saturation assays to provide evidence for the specificity
of constitutive interactions has been put forward by Bouvier and
coworkers20. Using the procedure described in this protocol, sev-
eral samples that coexpress a constant amount of donor-labeled
protein with increasing amounts of acceptor-labeled protein are
assayed. Ideally, the lowest level of donor-labeled protein expres-
sion that results in a reliable luminescence signal should be used.
It is thought that specific interactions result in BRET signal satu-
ration at high concentrations of acceptor-labeled protein. By con-
trast,nonspecific interactions are believed to result in BRET signals
that increase with increasing concentrations of acceptor-labeled
protein in a quasi-linear manner20. Relative acceptor fluorescence
and donor luminescence levels should be established in addition to
the BRET signals. Consequently, saturation curves can be gener-
ated using nonlinear regression, plotting BRET signal against the
ratio of acceptor fluorescence over donor luminescence.
Competition assays
Evidence for specificity can also be provided by showing com-
petitive inhibition of interactions. Using the procedure described
in this protocol, donor- and acceptor-labeled proteins are coex-
pressed with unlabeled protein that competes for interactions
with the labeled proteins. Unlabeled protein can be expressed
at a single concentration (usually excess)9 or at increasing con-
centrations21. In parallel, a negative control sample coexpressing
TABLE 1 | Comparison of BRET1, eBRET and BRET2.
BRET1 eBRET BRET2
Donor Renilla luciferase Renilla luciferase Renilla luciferase
Acceptor YFP (or EGFP) YFP (or EGFP) GFP2 or GFP10
Substrate Coelenterazine h EnduRen DeepBlueC
Example filters
‘Short-wavelength emission’ (nm): 440−500 (YFP)
400−475 (EGFP)
440−500 (YFP)
400−475 (EGFP)
370−450
‘Long-wavelength emission’ (nm): 510−590 (YFP)
500−550 (EGFP)
510−590 (YFP)
500−550 (EGFP)
500−530
Characteristics
Donor and acceptor emission peak separation
(nm)
∼55 (YFP)
∼35 (EGFP)
∼55 (YFP)
∼35 (EGFP)
∼115
Substrate relative quantum yield >100 >100 1
Possible detection duration Up to 1 h Several hours Few seconds
Substrate injection required No No Yes
Substrate preincubation 0 1.5 h 0
Possible in live cells Yes Yes Yes
Possible in cell extracts or purified proteins Yes No Yes
Optimal final substrate concentration (µM) 5 60 5
Typical assay buffer D-PBS with CaCl2, MgCl2 and D-
glucose
HEPES-buffered phenol
red−free medium
D-PBS with CaCl2, MgCl2 and D-
glucose
YFP, yellow fluorescent protein (includes Topaz, Venus and Citrine); EGFP, enhanced green fluorescent protein. See ref. 1 for a detailed
discussion.
©
2006
Nature
Publishing
Group
http://www.nature.com/natureprotocols
- 3. NATURE PROTOCOLS | VOL.1 NO.1 | 2006 | 339
PROTOCOL
donor- and acceptor-labeled proteins with unlabeled protein that
does not compete for interactions with the labeled proteins is includ-
ed. It is important to measure relative protein expression levels (as
determined by fluorescence or luminescence detection) to ensure
that an attenuated BRET signal is not a consequence of reducing
labeled-protein expression as the unlabeled protein is introduced.
The different BRET derivations
Three BRET derivations, BRET1, BRET2 and eBRET, are now avail-
able for general laboratory use and their characteristics are summa-
rized in Table 1. The advantage of BRET2 over BRET1 and eBRET
is the superior donor and acceptor emission peak separation when
using the substrate DeepBlueC. This enables donor and acceptor
emissions to be distinguished much more easily, thereby reducing
the background22. But the low quantum yield and rapid decay of
DeepBlueC mean that more cells are needed to achieve sufficiently
high luminescence levels for BRET detection, and highly sensi-
tive instrumentation is required22. Furthermore, BRET2 assays are
effectively impractical without injection of substrate into samples.
The advantage of eBRET over both BRET1 and BRET2 is the
capacity to monitor a particular interaction in real time over
several hours or measure multiple samples on the scale of high-
throughput screening without the need for frequent substrate
addition23. The limitation with both scenarios is cell viability, but
by assaying cells in HEPES-buffered medium, cell viability does
not appear to be compromised substantially for at least 6 h at
37 °C (ref. 23). eBRET should be carried out using live cells at 37
°C. It cannot be used for assaying cell extracts or purified proteins
because of its dependence on endogenous esterases.
BRET imaging
The use of an intensified charge-coupled device (CCD) camera to
image BRET is an exciting technological derivation. BRET from
single cells can be visualized21 and the potential for detecting BRET
in whole animals has recently been demonstrated by imaging trans-
fected cells injected intravenously or subcutaneously into mice24.
Furthermore, the development of higher-quantum-yield donors
may well allow subcellular BRET detection in the near future. The
specialized instrumentation required for BRET imaging clearly
necessitates a considerably different protocol to that needed for
BRET detected by luminometry or spectroscopy. Consequently, this
derivation is beyond the scope of the protocol described herein.
Fluorescence and luminescence detection
It is desirable to detect relative fluorescence and luminescence
levels for evaluating relative expression levels, and this is par-
ticularly important when carrying out saturation and competi-
tion assays20. Fluorescence can be detected using a fluorometer,
scanning spectrometer or flow cytometer. Using a fluorometer
is the most rapid and straightforward method, with scanning
spectrometry providing additional spectral information, should
that be required. Both of these methods allow subsequent lumi-
nescence measurements to be made on the same aliquot of cells,
which enables relative fluorescence over luminescence ratios to
be established for the same sample. Flow cytometry addition-
ally allows evaluation of the percentage of cells expressing fluo-
rophore and the mean fluorescence. Subsequent measurement
of luminescence on the same aliquot of cells, however, is less
practical.
BRET detection
BRET can be detected using a luminometer (microplate or sin-
gle-tube) or scanning spectrometer. The luminometer must have
the capacity to sequentially or simultaneously detect filtered light
within two distinct wavelength windows and ideally include tem-
perature control and kinetics software (required for eBRET).
Injectors are required for BRET2 and are desirable for BRET1 and
eBRET. Single-tube luminometers are more sensitive than micro-
plate luminometers, but they are clearly less practical for assay-
ing multiple samples. Scanning spectroscopy provides additional
spectral information, but the time required to complete each scan
limits the number of repeats per sample, the number of samples
that can be measured and the ability to generate time courses. The
rapid decay of DeepBlueC limits the use of scanning spectroscopy
for BRET2.
Donor-only controls
When investigating constitutive interactions, cells expressing only
the donor-labeled proteins should be included to establish the
background signal. There is a second option for analyzing BRET
data if investigating a ligand-induced interaction23. This does not
require ‘donor-only’ samples and is theoretically more accurate
as aliquots of the same preparation containing the same protein
expression are used to assess the ‘interacting protein’ and ‘back-
ground’ emissions.
MATERIALS
REAGENTS
• cDNA for functionally validated fusion proteins in suitable expression vectors
• Suitable cells for transfection (e.g.,HEK293 and COS-7)
• 6-well cell culture plates (BD Falcon,cat.no.351146)
• Suitable growth medium,such as Complete Medium (Dulbecco’s modified
Eagle’s medium (DMEM; Gibco,cat.no.11960-044) containing 0.3 mg ml−1
glutamine (Gibco,cat.no.25030-081),100 IU ml−1 penicillin,100 µg ml−1
streptomycin (Gibco,cat.no.15140-122) and 10% fetal calf serum (Gibco,cat.
no.16000-044)) for HEK293 and COS-7 cells
• Transfection system or reagent; examples of reagents include Genejuice
(Novagen,cat.no.70967) and Polyfect (Qiagen,cat.no.301 107)
! CAUTION Wear suitable protective clothing,gloves and safety glasses.
• 96-well white cell culture plate (Nunc,cat.no.136101) for assaying adherent
cells
• Phenol red−free medium,such as the Complete Medium described above,but
containing DMEM without phenol red (Gibco,cat.no.31053-028); requires 25
mM HEPES (Sigma,cat.no.H-3034) when used as eBRET assay buffer
• 0.05% trypsin−0.53 mM EDTA (Gibco,cat.no.15400-054) ! CAUTION Wear
suitable protective clothing,gloves and safety glasses.
• Dulbecco’s phosphate-buffered saline (D-PBS) containing 0.1 g l−1 CaCl2,
0.1 g l−1 MgCl2·6H2O and 1 g l−1 D-glucose (Invitrogen,cat.no.14287-080)
• 96-well isoplates: white for BRET (Perkin Elmer,cat.no.1450-581) and black
for fluorescence detection (OptiPlate-96F; Perkin Elmer,cat.no.6005270)
• For BRET1 only: 500 µM coelenterazine h (Molecular Probes,cat.no.C-6780)
in methanol as luciferase substrate stock solution (Sigma,cat.no.10158.6B)
! CAUTION Wear suitable protective clothing,gloves and safety glasses.
▲ CRITICAL Store at -20 °C protected from light.
• For BRET2 only: 1 mM DeepBlueC (PerkinElmer,cat.no.6310-100C) in
©
2006
Nature
Publishing
Group
http://www.nature.com/natureprotocols
- 4. 340 | VOL.1 NO.1 | 2006 | NATURE PROTOCOLS
PROTOCOL
anhydrous or absolute ethanol as luciferase substrate stock solution (Merck,cat.
no.1.00986) ! CAUTION Wear suitable protective clothing,gloves and safety
glasses.▲ CRITICAL Store at –20 °C protected from light.
•For eBRET only: 60 mM EnduRen (Promega,cat.no.E6482) in
dimethylsulfoxide (DMSO) as luciferase substrate stock solution (Sigma,
cat.no.D-2650) ! CAUTION Readily absorbed through skin.Wear suitable
protective clothing,gloves and safety glasses.▲ CRITICAL Store at –20 °C
protected from light.
•Ligand or other modulating reagent depending on interaction being assayed
! CAUTION Wear suitable protective clothing,gloves and safety glasses.
EQUIPMENT
•Standard cell culture facility including Class II biological safety cabinet,such
as BH2000 series (Clyde-Apac),and 37 °C incubator with 5% CO2,such as the
Heracell (Heraeus)
•Microplate luminometer; examples include theVICTOR Light (PerkinElmer,
cat.no.1420-060),Mithras LB 940 (Berthold Technologies) and FLUOstar
Optima or POLARstar Optima (BMG Labtech)
•(Optional) Single-tube luminometer with filter switch capability such as the
Sirius C (Berthold Detection Systems,cat.no.11040050)
•(Optional) Scanning spectrometer with 96-well plate capability; examples
include the Spex fluorolog or fluoromax (JobinYvon),the Cary Eclipse
(Varian) and the FlexStation II (Molecular Devices)
•(Optional) Fluorometer; examples include the EnVision (Perkin Elmer,cat.no.
2102-0010),Mithras LB 940 (Berthold Technologies) and FLUOstar Optima or
POLARstar Optima (BMG Labtech)
•(Optional) Flow cytometer,such as the FACS Calibur (Becton Dickinson,cat.
no.1641)
PROCEDURE
Preparation
1| Select the donor, acceptor and substrate combination, and consequently the filter combination if using a luminometer for
BRET detection1 (Table 1).
2| Generate fusion constructs in a suitable expression vector consisting of the cDNA for the protein of interest inserted in-
frame with the cDNA for the donor or acceptor molecule, incorporating the cDNA for a suitable linker region, if appropriate.
Remove the stop codon separating the cDNA sequences by mutagenesis so that a single fusion protein is expressed after
transfection.
3| Validate the labeling of proteins of interest, including suitable control proteins, by comparing labeled and wild-type
proteins in functional assays. Check that luminescence or fluorescence is detectable. If possible, use confocal microscopy to
visualize correct cellular localization of acceptor-labeled protein.
▲ CRITICAL STEP Establish that protein function is not compromised by the addition of donor or acceptor molecules.
Insufficient demonstration of correct cellular function must be taken into account when interpreting data.
? TROUBLESHOOTING
4| Reconstitute and store the luciferase substrate stock solution containing coelenterazine h for BRET1 or DeepBlueC for
BRET2 (both option A), or EnduRen for eBRET (option B).
(A) For BRET1 or BRET2:
(i) Allow the vial of lyophilized coelenterazine h or DeepBlueC to equilibrate to ambient temperature before opening to
avoid condensation.
▲ CRITICAL STEP Protect from light.
(ii) Reconstitute coelenterazine h with methanol, and DeepBlueC with anhydrous or absolute ethanol. Coelenterazine h can
also be reconstituted in ethanol.
▲ CRITICAL STEP Do not dissolve in dimethylsulfoxide (DMSO).
(iii) Agitate gently until resuspended, potentially a few minutes.
(iv) Aliquot (volumes depend on expected rate of use) and store desiccated and protected from light at –20 °C.
(B) For eBRET:
(i) Allow the vial of lyophilized EnduRen to equilibrate to ambient temperature before opening to avoid condensation.
▲ CRITICAL STEP Protect from light.
(ii) Reconstitute in tissue-culture grade dimethylsulfoxide (DMSO).
(iii) Vortex to resuspend.
▲ CRITICAL STEP Repeated vortexing may be required. Resuspension may take up to 10 min and may require warming to 37 °C.
(iv) Aliquot and store protected from light at –20 °C.
Cell culture
5| Aliquot cells into a 6-well cell culture plate in a suitable growth medium. The number of cells required in each well will
depend on size, growth rate and transfection system to be used, but typically they should be 50–80% confluent after 24 h
if being transiently transfected. For example, COS-7 cells are typically plated out at a density of 120,000 cells per well. Cells
stably expressing fusion proteins can also be used, with clonal stable cell lines having the advantage of homogeneous protein
expression levels. Maintain at 37 °C, 5% CO2 (for mammalian cells).
©
2006
Nature
Publishing
Group
http://www.nature.com/natureprotocols
- 5. NATURE PROTOCOLS | VOL.1 NO.1 | 2006 | 341
PROTOCOL
6| Typically 24 h after plating, coexpress the donor- and acceptor-labeled proteins of interest in cells using a suitable
transfection or expression system if these proteins are not already stably expressed. If required, produce a population of
cells expressing only the donor-labeled proteins at similar expression levels to those in the samples coexpressing donor- and
acceptor-labeled proteins. This requirement depends on the form of analysis to be used. Aim to achieve a physiologically
relevant expression level that still provides a detectable BRET signal. Samples with various combinations of protein expression
levels may be required if saturation or competition assays are being carried out. Express suitable positive- and negative-control
proteins in parallel. Maintain a population of untransfected cells in parallel for establishing background levels of fluorescence
and luminescence.
? TROUBLESHOOTING
7| If pretreating with ligand or other reagent, add these at an appropriate time between transfection and BRET detection.
Include vehicle-treated samples in parallel.
8| Interactions can be monitored in adherent cells (option A), in cell suspension (option B), in cell extracts or between
purified proteins (option C). The optimal expression time for transiently transfected fusion proteins should be established as it
varies from 24 to 72 h.
(A) In adherent cells:
(i) Detach the cells (e.g., using trypsin-EDTA) typically 24 h after transfection.
(ii) Resuspend the cells in phenol red−free medium (HEPES-buffered if eBRET is to be carried out in this medium) and
aliquot into a 96-well white tissue culture plate (40−100 µl per well). Initially titrate cells to establish a suitable
dilution. Higher cell concentrations are required for BRET2 compared with BRET1 or eBRET.
(iii) Incubate at 37 °C, 5% CO2 (mammalian cells) for an additional 24 h to allow attachment, and either assay in the
existing phenol red−free medium or remove medium and replace with assay buffer.
▲ CRITICAL STEP Extreme care must be taken not to detach cells. If removing the medium, washing is not recommended.
? TROUBLESHOOTING
(B) In cell suspension:
(i) Detach the cells (e.g., using trypsin-EDTA) immediately before the assay (24–48 h after transfection) and resuspend in
assay buffer.
(ii) Aliquot cells into a 96-well white isoplate (40–100 µl per well).
(C) Cell extracts or purified proteins:
(i) Typically prepare cell extracts or purified proteins 24−48 h after transfection.
(ii) Aliquot into a 96-well white isoplate (40–100 µl per well).
Fluorescence and luminescence detection
9| Fluorescence can be measured in a fluorometer or scanning spectrometer (both option A), or flow cytometer (option B).
Use a fluorometer or scanning spectrometer with 96-well capability if subsequent detection of unfiltered luminescence is to be
carried out using the same aliquots (Step 10).
(A) Fluorometer or scanning spectrometer:
(i) Measure the relative fluorescence from aliquots of each sample in D-PBS (40−100 µl per well in a 96-well black
isoplate), directly exciting the acceptor fluorophore with laser light of a suitable wavelength.
(ii) Filter the emission to avoid detection of excitation light and correct for background fluorescence from
untransfected cells.
? TROUBLESHOOTING
(B) Flow cytometer:
(i) Dilute aliquots of samples in D-PBS to achieve an appropriate volume.
(ii) Measure the relative fluorescence, directly exciting the acceptor fluorophore with laser light of a suitable wavelength.
(iii) Filter the emission to avoid detection of excitation light and correct for background fluorescence from untransfected
cells.
? TROUBLESHOOTING
10| Taking the same aliquots as assessed in the fluorometer or scanning spectrometer, add coelenterazine h or DeepBlueC and
measure unfiltered luminescence in a luminometer such as that used for BRET detection. Correct for background luminescence
from untransfected cells unless this is shown to be negligible.
? TROUBLESHOOTING
©
2006
Nature
Publishing
Group
http://www.nature.com/natureprotocols
- 6. 342 | VOL.1 NO.1 | 2006 | NATURE PROTOCOLS
PROTOCOL
BRET detection
11| Dilute the substrate stock (coelenterazine h, DeepBlueC or EnduRen) to a working concentration in assay buffer, typically
10× final concentration (Table 1).
▲ CRITICAL STEP Dilute immediately before adding to samples and protect from light. For EnduRen, preincubate the assay
buffer at 37 °C to avoid precipitation.
12| Add the luciferase substrate to the samples. For eBRET, use option A; for BRET1 use option B; and for BRET2 use option C.
(A) For eBRET, add EnduRen to live cells at least 1.5 h before BRET detection1. Substrate addition can be verified by
luminescence detection. Counts are low at this pre-equilibrium stage, but they are substantially higher than background. For
mammalian cells, incubate at 37 °C, 5% CO2.
(B) For BRET1, add coelenterazine h to the samples immediately before BRET detection. As BRET1 data are generally reliable
for 30–60 min after coelenterazine h addition (depending on the initial signal), injection of the substrate is optional.
(C) For BRET2, add DeepBlueC to each well immediately before detecting emission from that well.
▲ CRITICAL STEP In practical terms, this requires the use of injectors.
13| Detect the light emissions using either a luminometer (option A) or scanning spectrometer (option B). The rapid decay of
DeepBlueC limits the use of scanning spectroscopy for BRET2.
▲ CRITICAL STEP eBRET should be carried out at 37 °C to avoid EnduRen precipitation.
(A) If using a luminometer with the appropriate filter combination (Table 1), detect the light emission through both
filters (simultaneously or sequentially, typically 0.5–5 s per filter) before proceeding to the next sample. Simultaneous
detection reduces measurement times and is potentially more accurate, particularly for BRET2 because of the rapid decay
of DeepBlueC.
? TROUBLESHOOTING
(B) If using scanning spectrometry for BRET1 or eBRET, detect light emission from 400–600 nm, typically using a 10 nm slit
width and 2 s per increment.
? TROUBLESHOOTING
14| Repeat readings as required, within the timeframe allowed by substrate stability (Table 1) and cell viability. BRET2 repeats
require re-addition of DeepBlueC. Repeats can be automated with appropriate kinetics software.
15| Add ligands or other reagents, if desired, and continue collecting readings. Use a luminometer and inject these agents if
early post-addition time points are required (<1 min). Include vehicle-treated samples in parallel.
● TIMING
Preparation (Steps 1–4): potentially several weeks depending on the complexity of cloning and validation required.
Cell culture (Steps 5–8): typically 48–72 h (less if stable cell lines, cell extracts or purified proteins have already been prepared).
Fluorescence and luminescence detection (steps 9–10): a few minutes (depending on the number of samples).
BRET detection (Steps 11–15): minutes to hours depending on the number of samples, number of repeats and length of time
course. eBRET requires addition of EnduRen at least 1.5 h before commencing BRET detection.
? TROUBLESHOOTING
For troubleshooting guidance see Table 2.
TABLE 2 | Troubleshooting table.
STEP PROBLEM POSSIBLE REASON SOLUTION
3 Fusion protein is not
functioning correctly
There was an error in construct
generation
Sequence and check entire fusion protein cDNA
Label is interfering with protein
function
Reposition the label to the other end of the protein (or
possibly an internal peripheral loop or linker region), or
increase linker length between protein of interest and label
6 Cells are dying after
transfection
Cytotoxicity of transfection reagent Refer to the manufacturer’s guidelines, or consider using
alternative reagents
Cytotoxicity of GFP fusion proteins Titrate down expression of GFP fusion proteins
©
2006
Nature
Publishing
Group
http://www.nature.com/natureprotocols
- 7. NATURE PROTOCOLS | VOL.1 NO.1 | 2006 | 343
PROTOCOL
ANTICIPATED RESULTS
Calculate the BRET signals using option A (below) if a luminometer was used or option B if a scanning spectrometer was used.
If autoluminescence from untransfected cells is not negligible, this should be subtracted from emissions before calculating the
BRET signal.
(A) If a luminometer was used, calculate the BRET signal using the following equation:
For BRET1 and eBRET, note that light is emitted through the ‘long-wavelength emission’ filter, even in the absence of
acceptor expression or ligand addition. This is ‘bleed-through’ from the donor emission1.
There are two options for using the equation. All interactions can be analyzed using option (i), but ligand-induced interactions
can also be analyzed using option (ii). Option (ii) eliminates the need for ‘donor-only’ samples and is theoretically more
accurate as aliquots of the same preparation containing the same amount of protein are used to assess the ‘interacting protein’
and ‘background emissions’23.
(i) The ‘emissions from interacting proteins’ are from samples coexpressing donor and acceptor fusion proteins and the
‘background emissions’ from samples expressing only donor fusion proteins.
(ii) If the interaction is ligand-induced, the ‘emissions from interacting proteins’ can be from ligand-treated samples and
the ‘background emissions’ from vehicle-treated samples.
(B) Data derived using scanning spectroscopy can be analyzed using option (i) or (ii):
(i) Normalize the emission spectra by defining the donor peak emission intensity as 1. Calculate the BRET signal as the
area under the curve to which the acceptor emission contributes (typically 500−550 nm) minus the corresponding area
observed when only the donor is present.
(ii) Alternatively, establish areas under the curve within wavelength windows that correspond to the luminometer filters and
calculate the BRET ratio as described for luminometer-derived data (option A).
TABLE 2 | Troubleshooting table (continued).
STEP PROBLEM POSSIBLE REASON SOLUTION
8 Cells are detaching despite
extreme care.
Cells are not sufficiently adherent Consider using different plastics or coating wells (e.g., with
poly(L-lysine))
9, 10 and 13 There are low relative
luminescence or
fluorescence counts
There is poor protein expression Optimize or consider an alternative transfection strategy
The cell number is low Increase cell concentratio
Substrate was not added Add substrate to each well
Substrate is not viable Check expiry and storage conditions. Consider using new
aliquot of substrate
Reducing agent present Ensure buffers do not include reducing agents such as ascorbic
acid
Instrumentation is not functioning
correctly
Check instrument setup and consider recalibration
10 and 13 Luminescence signal is
detected from untransfected
cells upon substrate addition
There is spontaneous
autoluminescence
Correct for signal from untransfected cells
Consider removing serum or BSA if present in assay buffer
Problem should be reduced or alleviated by using EnduRen
Results BRET signal is not detected
despite validated fusion
proteins generating
high luminescence or
fluorescence counts
Distance between donor and
acceptor is too great
Test alternative combinations of fusion proteins with labels in
different positions
Relative orientation of donor and
acceptor is unsuitable for BRE
Increase linker length between protein of interest and label
May be due to ligand if interaction
is ligand-induce
Check and optimize potency of ligand required
BRET signal (or BRET radio) =
‘long-wavelength emission from interacting proteins’
‘short-wavelength emission from interacting proteins’
‘background long-wavelength emission’
‘background short-wavelength emission’
–
©
2006
Nature
Publishing
Group
http://www.nature.com/natureprotocols
- 8. 344 | VOL.1 NO.1 | 2006 | NATURE PROTOCOLS
PROTOCOL
An example of raw BRET data is shown in Table 3 and is derived from data generated in three independent experiments. Two
aliquots of the same cell sample were treated with ligand or vehicle and monitored in real-time. The data shown was observed
20 min after ligand or vehicle addition. In this example, option A(ii) has been used for data analysis. Emissions were detected
through the two filters and the ‘long-wavelength emission’ over ‘short-wavelength emission’ ratios calculated. The BRET ratio
was then calculated as: Ligand-treated emission ratio - vehicle-treated emission ratio = 2.3429 - 2.1396 = 0.203.
Statistical analysis of BRET data should be carried out using ANOVA with suitable post-tests, or using Student’s t-tests
where appropriate. One method is to determine the ‘long-wavelength emission’ over ‘short-wavelength emission’ ratio for the
interacting proteins and background separately. The variance in these ratios can then be compared to establish whether they
are significantly different. For the example shown in Table 3, the ligand-treated and vehicle-treated emission ratios were found
to be significantly different (P = 0.0086) using an unpaired Student’s t-test.
Anticipated results for ligand- (or reagent-) modulated interactions are illustrated in Figure 2. eBRET is particularly suitable
if kinetic profiles beyond 30−60 min are required.
Anticipated results for constitutive interactions should not only exhibit significantly higher BRET signals than
appropriate negative controls, but also
demonstrate interaction specificity
by incorporating competition or
saturation data generation into the
experimental design (see ref. 1 for
extensive discussion).
It is important to note that a
negative BRET result is not conclusive
evidence for a lack of protein-protein
interaction. The extremely high
dependency on distance between donor
and acceptor means that functionally
validated fusion proteins may interact
without a BRET signal being detectable.
See Table 2 for troubleshooting
guidance.
TABLE 3 | An example of raw BRET data and its analysis.
Experiment Ligand-treated Vehicle-treated
Long-wavelength
emission
Short-wavelength
emission
Long:short
wavelength ratio
Long-wavelength
emission
Short-wavelength
emission
Long:short
wavelength ratio
1 313,159 134,012 2.3368 404,242 191,367 2.1124
2 154,900 65,013 2.3826 130,677 59,082 2.2118
3 256,707 111,166 2.3092 353,669 168,849 2.0946
Mean 2.3429 2.1396
s.d. 0.0371 0.0632
a b
Figure 2 | Examples of theoretical BRET data from ligand (reagent) modulated interactions.
(a) Dose-response curves can be generated by nonlinear regression, permitting calculation of EC50
(half-maximal effective concentration) values. (b) Changes in BRET ratio can be monitored over time
before and after addition of ligand and/or other modulators (the dashed line denotes data produced
upon addition of vehicle instead of ligand). Apparent association (or dissociation) rate constants can
be calculated from such data.
COMPETING INTERESTS STATEMENT The authors declare competing financial
interests (see the HTML version of this article for details).
Published online at http://www.natureprotocols.com/
Reprints and permissions information is available online at http://npg.nature.
com/reprintsandpermissions/
1. Pfleger, K.D. & Eidne, K.A. Illuminating insights into protein-protein
interactions using bioluminescence resonance energy transfer (BRET). Nat.
Methods 3, 165−174 (2006).
2. Milligan, G. & Bouvier, M. Methods to monitor the quaternary structure of
G-protein−coupled receptors. FEBS J. 272, 2914−2925 (2005).
3. Boute, N., Jockers, R. & Issad, T. The use of resonance energy transfer in
high-throughput screening: BRET versus FRET. Trends Pharmacol. Sci. 23,
351−354 (2002).
4. Pfleger, K.D.G. & Eidne, K.A. New technologies: bioluminescence resonance
energy transfer (BRET) for the detection of real time interactions involving G-
protein coupled receptors. Pituitary 6, 141−151 (2003).
5. Wu, P. & Brand, L. Resonance energy transfer: methods and applications.
Anal. Biochem. 218, 1−13 (1994).
6. Xu, Y., Piston, D.W. & Johnson, C.H. A bioluminescence resonance energy
transfer (BRET) system: application to interacting circadian clock proteins.
Proc. Natl. Acad. Sci. USA 96, 151−156. (1999).
7. Subramanian, C. et al. The Arabidopsis repressor of light signaling, COP1,
is regulated by nuclear exclusion: mutational analysis by bioluminescence
resonance energy transfer. Proc. Natl. Acad. Sci. USA 101, 6798−6802 (2004).
8. Angers, S. et al. Detection of beta 2-adrenergic receptor dimerization in
living cells using bioluminescence resonance energy transfer (BRET). Proc.
Natl. Acad. Sci. USA 97, 3684−3689 (2000).
9. Kroeger, K.M., Hanyaloglu, A.C., Seeber, R.M., Miles, L.E. &
Eidne, K.A. Constitutive and agonist-dependent homo-oligomerization
of the thyrotropin-releasing hormone receptor. Detection in living cells
using bioluminescence resonance energy transfer. J. Biol. Chem. 276,
12736−12743 (2001).
10. Pfleger, K.D.G. & Eidne, K.A. Monitoring the formation of dynamic
G-protein-coupled receptor-protein complexes in living cells. Biochem. J.
©
2006
Nature
Publishing
Group
http://www.nature.com/natureprotocols
- 9. NATURE PROTOCOLS | VOL.1 NO.1 | 2006 | 345
PROTOCOL
385, 625−637 (2005).
11. Scaffidi, A.K. et al. α(v)β(3) Integrin interacts with the transforming growth
factor β (TGFβ) type II receptor to potentiate the proliferative effects of
TGFβ1 in living human lung fibroblasts. J. Biol. Chem. 279, 37726−37733
(2004).
12. Brown, R.J. et al. Model for growth hormone receptor activation based on
subunit rotation within a receptor dimer. Nat. Struct. Mol. Biol. 12, 814−821
(2005).
13. Michelini, E., Mirasoli, M., Karp, M., Virta, M. & Roda, A. Development of a
bioluminescence resonance energy-transfer assay for estrogen-like compound
in vivo monitoring. Anal. Chem. 76, 7069−7076 (2004).
14. Garside, H. et al. Glucocorticoid ligands specify different interactions with
NF-kappaB by allosteric effects on the glucocorticoid receptor DNA binding
domain. J. Biol. Chem. 279, 50050−50059 (2004).
15. de Virgilio, M., Kiosses, W.B. & Shattil, S.J. Proximal, selective, and dynamic
interactions between integrin alphaIIbbeta3 and protein tyrosine kinases in
living cells. J. Cell. Biol. 165, 305−311 (2004).
16. Yung, T.M., Sato, S. & Satoh, M.S. Poly(ADP-ribosyl)ation as a DNA damage-
induced post-translational modification regulating poly(ADP-ribose)
polymerase-1-topoisomerase I interaction. J. Biol. Chem. 279, 39686−39696
(2004).
17. Trevaskis, J. et al. Src homology 3-domain growth factor receptor-bound
2-like (endophilin) interacting protein 1, a novel neuronal protein that
regulates energy balance. Endocrinology 146, 3757−3764 (2005).
18. Germain-Desprez, D., Bazinet, M., Bouvier, M. & Aubry, M. Oligomerization
of transcriptional intermediary factor 1 regulators and interaction with
ZNF74 nuclear matrix protein revealed by bioluminescence resonance energy
transfer in living cells. J. Biol. Chem. 278, 22367−22373 (2003).
19. Terrillon, S. et al. Oxytocin and vasopressin V1a and V2 receptors from
constitutive homo- and heterodimers during biosynthesis. Mol. Endocrinol.
17, 677−691 (2003).
20. Mercier, J.F., Salahpour, A., Angers, S., Breit, A. & Bouvier, M. Quantitative
assessment of β1- and β2-adrenergic receptor homo- and heterodimerization
by bioluminescence resonance energy transfer. J. Biol. Chem. 277,
44925−44931 (2002).
21. Ayoub, M.A. et al. Monitoring of ligand-independent dimerization and
ligand-induced conformational changes of melatonin receptors in living
cells by bioluminescence resonance energy transfer. J. Biol. Chem. 277,
21522−21528 (2002).
22. Hamdan, F.F., Audet, M., Garneau, P., Pelletier, J. & Bouvier, M. High-
throughput screening of G protein-coupled receptor antagonists using a
bioluminescence resonance energy transfer 1−based β-arrestin2 recruitment
assay. J. Biomol. Screen. 10, 463−475 (2005).
23. Pfleger, K.D. et al. Extended bioluminescence resonance energy transfer
(eBRET) for monitoring prolonged protein-protein interactions in live cells.
Cell. Signal; Advance online publication 21 February 2006 (doi: 10.1016/
j.cellsig.2006.01.004).
24. De, A. & Gambhir, S.S. Noninvasive imaging of protein-protein interactions
from live cells and living subjects using bioluminescence resonance energy
transfer. FASEB J. 19, 2017−2019 (2005).
©
2006
Nature
Publishing
Group
http://www.nature.com/natureprotocols