M2-Cinical Immunology
•
0 likes•9 views

Following is my journal documentation during Master's in Biotechnology completed in 2015. I do understand many changes would've occurred in the curriculum since then, but the basics seldom change. Kindly absorb as per your need.

Recommended
More Related Content
Similar to M2-Cinical Immunology
Similar to M2-Cinical Immunology (20)
More from Mayur D. Chauhan
More from Mayur D. Chauhan (20)
Recently uploaded
Recently uploaded (20)
M2-Cinical Immunology
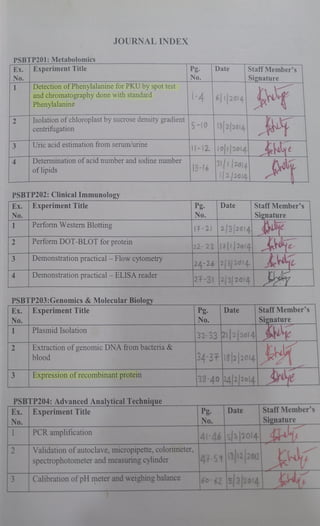
- 1. JOURNAL INDEX PSBTP201:Metabolomics Ex. ExperimentTitle No. Detection ofPhenylalanine for PKU by spot test and chromatography done with standard Phenylalanine Staff Member's Pg. No. Date Signature 1 -4 6 2014 Isolation of chloroplast by sucrose density gradient centrifugation 5-10 13 22014 1-12 1o1|2014 e Uric acid estimation from serum/urine Determination of acid number and iodine number 13-16 1 |2014 /2/2014 4 of lipids PSBTP202: Clinical Immunology Ex. Experiment Title Pg Date Staff Member's Signature 17-21 2/3|2014 ulye 22-23 17|2014 ye 24-26 23)2014 de No. No. Perform Western Blotting Perform DOT-BLOT for protein Demonstration practical - Flow cytometry Demonstration practical - ELISA reader 24-31 P3/2014 PSBTP203:Genomics&MolecularBiology Ex. ExperimentTitle No. Pg. No. StaffMember's Signature Date Plasmid Isolation 32-3321/22014 N Extraction of genomic DNA from bacteria & blood 3431eblao14 Expression of recombinant protein 38-40 2422o14| PSBTP204: Advanced AnalyticalTechnique Ex. ExperimentTitle Date Staff Member's Pg. No. No. Signature PCR amplification 41-46 5/320l4 Validation of autoclave, micropipette, colorimeter, spectrophotometer and measuring cylinder 47-59 131220 Calibration of pH meter and weighing balance 60-62 3 2014
- 3. Experiment No. 1 Date: 2/3 2014 WESTERN BLOTTING AIM To perform western blotting technique THEORY Western blotting is a powerful technique used in the protein detection& characterization. This technique exploits the inherent specificity of antigen & antibody interaction to identify specific antigen by polyclonal or monoclonal antibody. The technique involves following steps: 1. Separation ofproteins using SDS-PAGE. 2. Transfer of proteins from SDS-gel to a nitrocellulose membrane (electric transfer). 3. Binding of primary antibody on the membrane. 4. Use of secondary antibody (this antibody is an antibody-enzyme conjugate, e.g horseradish peroxidase). 5. Reaction with a substrate. SDS-PAGE technique is used to separate molecules based on size, shape or isoelectric point. SDS-PAGE coupled with western blotting is typically used to determine the presence and/or relative abundance of a given protein. The gel is a cross linked polymer matrix used to support & separate molecules. The gel density can be controlled by varying the monomer concentration. Gel can be of constant density or they can be variable i.e. gradient gels. After cross linking has taken place, the samples are loaded in wells in the gel & the assembly undergoes electrophoresis. Electrophoresis involves applying an electric current to the gel and allowing the proteins to migrate through the matrix. In order for proteins to migrate through the gel, they are first denatured & negatively charged by exposure to detergent such as sodium dodecyl sulphate (SDS). The amount of bound SDS is relative to the size of protein, and proteins have similar charge to mass ratio. Bands in different lanes separate based on the individual component sizes. A molecular weight marker that produces bands ofknown size is used to help identify proteins of interest. After the protein components have been separated by electrophoresis, they can be transferred to a PVDF or nitrocellulose membrane. The transfer process uses the same principle as SDS-PAGE but this time the electric current is applied at 90 degrees to the gel & proteins migrate out of the gel onto the membrane. Once the proteins are separated &bound to membrane support, immunoblottingcan begin. Western blotting is used to detect a target protein in a sample of mixture of proteins by using a polyclonal or monoclonal antibody specific to the protein. 1 7 ~
- 5. PRINCIPLE Western blotting is a rapid & sensitive assay for detection & characterization of proteins. This technique exploits the inherent specificity of antigen-antibody interaction to identify specific antigens by polyclonal or monoclonal antibodies. The proteins are separated by SDS-PAGE. The gel is placed in contact with nitrocellulose membrane. The transferred proteins are detected using immunological reagents. The membrane is then probed with a primary antibody specific to the protein of interest. The antigen-antibody complex formed on the membrane which is then identified using an enzyme labelled secondary antibody & a suitable substrate to the enzyme which results in a coloured band on the nitrocellulose membrane. APPROACH Firstly, the proteins are separated by carrying out SDS-PAGE. Blotting is transfer ofresolved proteins from the gel onto a surface ofa suitable membrane carried out electrophoretically, referred to as Electroblotting. The gel is placed in contact with nitrocellulose membrane which is then sandwiched between filter paper, sponge in a cassette. The entire set is electrophoretically run using the blotting buffer. The proteins get transferred to the corresponding position on the membrane as resolved on the gel forming a mirror image of the gel. The transferred proteins bound to the surface of the nitrocellulose membrane are detected using immunological reagents. This is known as Immunodetedion. All the unoccupied sites on the membrane are first blocked with an inert protein, a detergent or any other suitable blocking agent. The membrane is then probed with a primary antibody specific to the protein of interest. The antigen-antibody complex formed on the membrane which is then identified using an enzyme labelled secondary antibody & a suitable substrate to the enzyme which results in a coloured band on the nitrocellulose membrane. PROCEDURE Blocking: The membrane is blocked in order to reduce non-specific protein interactions between the membrane and the antibody. This is achieved by placing the membrane in a solution of bovine serum albumin (BSA) or non-fat dry milk (NFDM). Primary Antibody: The first antibody to be applied (specific for protein of interest) 1s incubated with the membrane. The antibody is diluted in a buffer solution (PBS) containing a carrier protein (BSA or NFDM) along with some detergent. The primary antibody is specific for protein ofinterest&at appropriate concentrations should not bind to any other protein on the membrane. The membrane is then rinsed. Secondary Antibody: After rinsingthe membrane to remove unbound primary antibody, a secondary antibody is incubated with the membrane. It binds to the primary antibody. This secondary antibody is typically linked to an enzyme that allows for visual identification by producing fluorescence. An alternative is to use radioactive label. Developing: The unbound secondary antibody is washed away & the enzyme substrate is incubated with the membrane so that the positions of membrane bound secondary 18
- 7. antibodies will emit light. Bands corresponding to the detected protein of interest appear as dark regions on the developed film. Band densities in different lanes can be compared providing information on relative abundance of protein of interest. REQUIREMENTS SDS-PAGE Solutions: 1. Stock Acrylamide solution: Acrylamide 30 gm Bis-Acrylamide 0.08 gm Water 100 ml 2. 2X Sample buffer: Tris-HCl, ph 8.0 Glycerol 130mM 20% (v/v) 4.6% (w/v) SDS 0.02% Bromophenol blue 3. 8X Resolving gel buffer: 100 ml 0.8 gm (add last) 36.3 gm SDS Tris base (3M) Adjust pH to 8.9 with conc. HCl. 4X Stacking gel buffer: 100 ml 4. 0.4 gm (add last) 6.05 gm SDS Tris base (0.5 M) Adjust pH to 6.8 10X Running buffer:1 litre Tris base (0.25 M) 5. 30.3 gm 144 gm Glycine SDS (1% add last) Do not adjust pH. 10 gm Western blotting Solutions: 10X Blotting buffer: 1 litre Tris base (0.25 M) Glycine (1.92 M) pH should be 8.3, do not adjust. To make 2 Litre of 1X Blotting 1. 30.3 gm 144 gm buffer: 400 ml Methanol 200 ml 10X Blotting buffer 1400 ml water 2. Blocking buffer: 0.5 litre 3% bovine serum albumin Make up in PBS & Sterile filter. Then add 0.05% Tween 20. Keep at 4 degree Celsius to prevent bacterial contamination. ~19~
- 9. 3. Phosphate-Buffered Saline, ph 7.4, 1000ml 8gm 0.2 gm 1.44 gm 0.24 gm Adjust pH to 7.4 with HC1 NaCl KCI Na2HP04 KH2P04 4. Phosphate -Free, Azide-Free Blocking Solution, 1000 ml 150 mM NaC1 8.766 gm 6.0657 gm 50 mM Tris-HCl (ph 7.5) 5% (w/v) nonfat dried milk Adjust pH with 12N HCI PROTOCOL SDS-PAGE A. Preparation of Gel: 1. Assemble the glass plates & spacers (1.5mm thick). 2. Pour an agarose plug (1-2mm) 3. Pour the running gel to about 1 cm below the wells of the comb (approx 20 ml). 4. Seal with 1 ml water saturated 1-butanol. 5. When gel has set, pour off the butanol &rinse with deionized water. 6. Pour the stacking gel (approx 5 ml) and insert the comb immediately. 7. When the stacking gel has set, place in gel rig and immerse in buffer. 8. Prior to running the gel, flush the wells out thoroughly with running buffer. B. Running the Gel: 1. After flash spinning the samples, load into wells. 2. Be sure to use markers. Run with constant current (30 mA). C. Preparation of membrane: 1. Cut a piece ofPVDFmembrane/nitrocellulose membrane. 2. Wet for about 10 mins in Ix blotting buffer on a rocker at room temp. D. Membrane transfer: 1. Assemble "sandwhich" for transblot. 2. Pre-wet the sponges, filter papers (slightly bigger than gel) in lx blotting buffer. Sponge-filterpaper-gel-membrane-filterpaper-sponge. 3. Transfer for 1 hour at 34 mA. Bigger proteins might take long for transfer. 4. When finished, immerse membrane in blocking buffer & block overnight. E. Antibodies & Detection: 1. Incubate with primary antibody diluted in blocking buffer for 60 min at RT 2. Wash 3x lo min with 0.05% Tween in PBS. 3. Incubate with secondary antibody diluted in blocking buffer for 45 min at RT. 20
- 10. 4. Wash 3x 10 mins with 0.05% Tween 20 in PBS. 5. Incubate with TMB H202 for 10-15 mins. RESULT CONCLUSIONS The technigue of Weptenn Blotting was demanstraded 21
- 11. Experiment No. 2 Date: 17/12014 DOT-BLOT FOR PROTEIN AIM To perform the DOT blot technique for the separation of proteins. THEORY DOT-BLOT is a technique for detecting analysing and identifying proteins, similar to the western blot technique but differing in that proteins samples are not separated by electrophoresis but are spotted through circular templates directly onto the membrane or paper substrate. Concentration of proteins in crude preparation (such as culture supernatant) can be estimated semi quantitatively by using DOT BLOT method if both purified protein and the specific antibody against it is available. PRINCIPLE Dot blot is a simple, convenient method for detection of proteins in crude lysates or solution without the need for separation by electrophoresis. This method is especially useful as a simple control because it eliminates problems encountered in Western blotting like components that interfere with binding or non-specific binding, improper separation of the proteins and signal interference. Nitrogen cellulose is type of membrane most commonly used for protein blotting due to its high binding capacity and low background staining. Nitrocellulose membrane are however rather brittle and many nylon membranes have been promoted for protein blotting on the strength of their high flexibility and greater binding capacity. However, problems with background staining make them less advantageous. Among the various brands of nitrocellulose available today, Schleicher & Schuell's BA 85, pore size 0.45 um shows consistently first-rate quality, although it is somewhat more brittle than a similar product available from Millipore. Millipore has a polyvinyldifluoridene membrane, Immobilon PVDF, which combines great mechanical strength with high binding capacity and low background, whereas its wetting properties are less favourable. APPROACH The protein sample is spotted on a nitrocellulose membrane and detected by mixing it With a primary antibody which is further treated with a secondary antibody conjugated with an enzyme. On addition of the enzyme specific substrate colour development takes place indicating the presence of the protein, the intensity of the colour depending on the concentration ofthe protein present. REQUIREMENTS a) TBS (20mM Tris-HCI ,150 mM NaCL,pH7.5) b) TBS-T (0,05% Tween 20 in TBS) c) BSA/TBS-T (0.1%BSA in TBS-T) 22
- 12. hotorol Take Iml o IX ASsay bufel and 5ul eadh oantigeng 1 and 2 in tuo &cponate vialb ix dhohoughly by invenhing Jns ent the ELISA Bip on in eadh Vial and incubate at RT tor 20 mins wlh intelmitent haking Wash dhe sthips 3 times by dipping hem in imt ol Ix fresh washing bufek for about 3 min(Replace dhe buffek aftel each Wabh) Il o Assay bufe in a hesh vial, add Syl anthb ody HRP Coojugate and mix thoeoughly Dip the 6ips sepatately into ials onrtaunung enzume soluhion and allow the Leation to take plate for 20 minb with intemettent&haking LWash 4he Siips n Lwashing buffe o0 Atep 4 (lhnce) me+H, 02 60uthioo by dliluching, 100d o 10x substvate solurbion Lwith 90ul DW Dip the sbps Sepanalcly nto Vlals Contaunin4 soletion and leaue it for minb Loith hking Stop Ahe heaction by washing he ips in D and obseAue the heaction for 8ue colowed 3pot5
- 13. d) Nitrocellulose membrane (BIO-RAD, Trans-Blot, etc) e) Protein sample PROCEDURE 1 Have nitrocellulose membrane ready drow grid by pencile to indicate the region to be blotted. Used narrow mouth pipette tip, spot 2 micro liter of sample onto the nitrocellulose membrane at the center of the grid, minimize the area that the solution penetrates (usually 3-4 diameter) by applying it slowly. Let the membrane dry. 4 2. 3. Block nonspecific sites by soaking in 5%BSA in TBS-T(0.5-1 hr,RT). Use 10 cm petri dish for reaction chamber. Incubate with primary antibody (0.1-10 microgram/ml for purified antibody, 1:1000 to 1:100000 dilution for antis era, 1:100 to 1:10000 for hybridoma supernatant) 5. dissolved in BSA/TBS-T for 30 mines at RT. 6. Wash three times with TBS-T(3x 5 min) Incubate with secondary antibody conjugated with HRP (for optimum dilution) for 30 7 min at RT. 8 Wash three times with TBS-T (15 minx 1,5min x2), then once with TBS (5 min) 9 Incubate with ECL reagent for 1 min, cover with saran wrap (remove excessive solution from the surface), and expose X-ray film in the dark room. Try several different lengths of exposure. 10. Compare the signal from unknown sample to that of the standard and estimate the concentration. RESULTS: esence opot jn the positive zone and no spot in heqative Z0ne Js an indiuation o prope petoemance olest Absence Spot in tebt z0ne jpditates that antigen ointexest is absent in qiveh 6ample CONCLUSTONS omnle 1 howed no (oloued Spot Which n dilales that the sample does not haue the antiqen bound to irmrnobilised anibgdy whetal dhcltest ofSample 2 showed the ptebeneea 4pot in clikepting dhe pesence oantiqen bound to imo abilised 23
- 14. Kesut Barmple 1 Larople 2 one Negatiive Test fosithive Neqative - Negaive Jut pot Jat (Spot) Posit've PositVe, Sauiple Soupe 1 2
- 15. Experiment No. 3 Date: 2/3/2014 FLOW CYTOMETRY AIM To perform Flow Cytometry THEORY Flow cytometry is a technique for counting, examining and sorting microscopic particles suspended in a stream of fluid. It allows simultaneous multiparametric analysis of the physical and/ or chemical characteristic of the single cell flowing through an optical and electronic detection apparatus. PRINCIPLE A beam of light( usually laser light) is directed towards onto hydrodynamically focused stream of fluid a number of detectors are aimed at the point where the stream passes though the light beam, one in line with the light beam forward scatter( FSC) and several perpendicular to it [Side scatter (SSC)] and one or more florescent detector each suspended particle passing through the beam scatters the lightin some way, and fluorescent chemicals found in the particle or attached to the particle may be excited into emitting light of higher wavelength than the light source. This combination of scattered and fluorescent light picked up by the detectors and by analyzing fluctuation in brightness at each detector ( one each fluorescent peak) it is then possible to derive various type of information abqut the physical and chemical structure of each individual particle FSC correlates with the cell volume and SSC depends on the inner complexity of the particle ( i.e. shape of the nucleus ,amount and type of cytoplasmic granules or the membrane roughness)some flow cytometers in the market have eliminated the need for fluorescence and use of only light scatter for measurement. Other flow cytometers form images of the cell's fluorescence scattered light and transmitted light. CONSTRUCTION Modern flow cytometers are able to analyze several thousand particles every second in "real time" and can actively separate and isolate particles having specified properties. a flow cytometry is similar to a microscope except that instead of producing an image of the cell, flow cytometer provides a "high throughput" (for a large number of cells) automation quantification of set parameters. To analyze solid tissues single cell suspension must first be prepared. A flow cytometerhas five main components 1. A flow cell- liquid stream (sheath fluid) carries and align the cell so that they pass single through the light beam for sensing 2. A light source- commonly used are lamps( mercury, xenon); high power water cooled laser(argon krypton, dye laser); low powered air cooled lasers [argon (488 nm), red HeNe (633 nm), green HeNe , HeCd (U V); diode laser ( blue, green, red, violet). 3. A detector and a analogue to digital conversion system- generating FSC and SSC as a fluorescence signal. 2 24
- 16. Flow Cytometer Scheme Laser Forward scatter detector Mirrors Side scatter detector Source of liquids to keep the flow Waste container Direction offluid flow Tube with cells or other analysed particles (a) Phinciple of Flow aytomcthy Fluidics system Filters Detectors 635 nm 4 8 8 n m Lens PMT FL-1) Lasers PMT FL-2 Filters PMT FL-3 FL- Screen Detector 6)Dedection ystem in a low aytontheh suojp010p J0uO
- 17. 4. An amplification system- linear or logarithmic. 5. A computer for analysis of the signals. SPECIMEN ANALYSIS Specimen Preparation Specimens are often whole blood but may be other tissues. For analysis, the specimen must contain greater than 95%% single cells for accurate interpretation of the data. Whole blood is a single cell suspension, but tissues must be disaggregated into single cells before analysis. Often antibodies are used to stain cells and select subpopulations or evaluate protein exDression. In most cases, these antibodies are commercial products with robust staining Droperties. However, the staining pattens should be confirmed in the laboratory on each new lot of antibody using appropriate control materials. Unknown antibodies must be carefully evaluated for specificity and efficacy of staining. This is best done under a microscope initially because nonspecific staining or unusual patterns can be better distinguished with a microscope than with a flow cytometer. Once approximate staining characteristics are determined, the procedure can be fine-tuned for the flow cytometer. Data Processing The initial light signal is first converted by the detectors into an electric current, which is amplified and measured as an analog quantity, such as 5 V of a maximum of 10 V. Because this signal is analog, it must be converted into a digital signal for computer processing. The signal then becomes an event with a specific digital channel value such 512 on a 1,024- channel scale. The digital data can be displayed as 1-parameter histograms or as 2-parameter The information on a l-parameter histogram is described either as the percentage of plots cells within a set of markers or as the mean fluorescence intensity of a population. For logarithmically amplified signals, the geometric mean fluorescence is used, since it is less influenced by the extreme ends of the distribution. parameter plot is usually divided into 4 quadrants, each containing distinguish between fluorescent and non fluorescent cells. It also defines expression and non expression of a cell molecule marked by a fluorescent antibody or other fluorochrome. Because the specimen that is analyzed may be complex with several populations plus debris, Such as lysed whole blood, analysis of the total specimen would give variable and confusing results. Therefore, it is often necessary to analyze a single population, such as lymphocytes. Electronic gating allows separation of the total population into parts, which can be individually analyzed. percentage ofthe total population. This division is used to
- 18. 8.1% FL1-H3)s FL2-H(4) 45 5% 1 FL1-H(3) vs FL2-H(4 10 21 1% 0 8% 25.6% 25.6% 0.8% 44 5 FL1-H3)vsFL2-H(4) IUngatedtotal particl Ga 10 10 FL1-H U 0.f 28.1%% FSC-H(1)vsSSC-H(2) FL1-H (3) vs FL2-H (4) 24 % 0 % Granulocytes :Monocytes 11 Debris 65 % Lymphocytes 023 0 10 RESULT CONCLUsION The tecbrdque oHouw utomethuy Lwab &tudied dheonchjcalli 26
- 19. Experiment No. 4 Date: 2/3 2014 PREPARATION OF ELISA PLATE AIM To perfornm Enzyme Linked Immunosorbent Assay (ELISA) THEORY Enzyme Linked Immuno Sorbent Assay also called ELISA, is a biochemical technique used mainly in immunology to detect the presence of an antibody or an antigen in a sample. It has been used as a diagnostic tool in medicine and plant pathology, as well as a quality control check in various industries. In simple terms, in ELISA an unknown amount of antigen is affixed to a surface, and then a specific antibody is washed over the surface so that it can bind to the antigen. This antibody is linked is linked to an enzyme, and in the final step a substance is added that the enzyme can convert to some detectable signal. Thus in the case of fluorescence ELISA, when light of the appropriate wavelength is shone upon the sample, any antigen/antibody complexes will fluoresce so that the amount of antigen in the sample can be inferred through the magnitude of the fluorescence. Types of ELISA 1. "Indirect"ELISA: In this the antigen to be tested is coated on a microtiter plate. A primary antibody specific for this antigen is then added which could be serum of the patient to be tested. A secondary antibody labeled with an enzyme is added which binds to the primary antibody. Substrate which gives a coloured product on enzyme interaction is added. 2. Sandwich ELISA: This technique is used to detect sample antigen. A surface is prepared to which a known quantity of capture antibody is bound. The antigen- containing sample is applied to the plate. A specific antibody is added that binds to antigen. Enzyme-linked secondary antibodies are applied as detection antibodies. A substrate is added to be converted by the enzyme into a color or fluorescent signal which can be measured. 3. CompetitiveELISA: Unlabeled antibody is incubated in the presence of its antigen. These bound antibody/antigen complexes are then added to an antigen-coated well. The more antigen in the sample, the less antibody will be able to bind to the antigen in the well, hence "competition". A secondary antibody, specific to the primary antibody, is added. This second antibody is coupled to the enzyme. A substrate is added, and remaining enzymes elicit a chromogenic or fluorescent signal. ELISA can be performed to evaluate either the presence of antigen or the presence of antibody in a sample and hence is a useful tool for determining serum antibody concentrations eg. HIV test. It can also be used to detect potential food allergens. ELISA can also be used in toxicology as a rapid presumptive screen for certain classes of drugs. ELISA test can also be used to detect various diseases, such as malaria, Chagas disease, and Johne's disease. ELISA tests also are used as in in vitro diagnostics in medical laboratories. 27
- 20. ) Indirect ELSA wash wash wash Add enzyme conjugated secondary antibody Add substrate (S) Antigen coated well Add speciic antibody to be measured and measure color b) Sandwich ELSA wash wash wash Add substrate Add enzyme conjugated secondary antibody Addantigen Antibody- coated well and measure to be measured color (O Competitve ELISA Y wash wash Incubate antibody with antigen to be Add substrate Add Ag-Ab Add enzyme and measure Conjugated secondary measured mixture to color antigen-coated well antibodv () ypes of ELISA dechniques () (6) ELISA mionotitre plate
- 21. PRINCIPLE As a heterogenous assay, ELISA separates some component of the analytical reaction mixture by adsorbing certain components onto a solid phase which is physically immobilized. In ELISA, a liquid sample is added onto a stationary solid phase with special binding properties and is followed by multiple liquid reagents that are sequentially added, incubated and washed followed by some optical change (e.g. color development by the product of an enzymatic reaction) in the final liquid in the well from which the quantity of the analyte is measured. The qualitative "reading" usually based on detection of intensity of transmitted light by spectrophotometry, which involves quantitation of transmission of some specific wavelength of light through the liquid. The sensitivity of detection depends on amplification of the signal during the analytic reactions. Since enzyme reactions are very well known amplification processes, the signal is generated by enzymes which are linked to the detection reagents in fixed proportions to allow accurate quantification - thus the name "enzyme linked". The analyte is also called the ligand because it will specifically bind or ligate to a detection reagent, thus ELISA falls under the bigger category of ligand binding assays. The ligand-specific binding reagent is "immobilized", i.e., usually coated and dried onto the transparent bottom and sometimes also side wall of a well, which is usually constructed as a multiple-well plate known as the "ELISA plate". Conventionally, like other forms of immunoassays, the specificity of antigen-antibody type reaction is used because it is easy to raise an antibody specifically against an antigen in bulk as a reagent. Alternatively, if the analyte itself is an antibody, its target antigen can be used as the binding reagent. Dilution scheme for various solutions 1IX PBST (phosphate buffer saline-tween) Take Iml of 10X PBST provided in kit and distilled water upto 10 ml a. 2. Dilution buffer To 1ml of blocking buffer, add 29ml of 1X PBST to make final volume 30ml. Use the solution for dilution ofantigen and antigen HRP conjugates. a. Dilution of standard antigen 3 The concentration ofantigen provided in kit is 1000 ul/ml a.
- 22. b. Dilution table Final Designation of Antigen Dilution buffer Totalvolume concentration dilution (ul) (ul) (ul) (uI)/ml) From stock 20 480 500 40 From A -200 800 1000 8 From B-500 500 1000 From C-500 S00 1000 E From D-500 500 1000 From E-500 500 1000 0.5 From F-500 500 1000 0.25 From G-500 500 1000 0.125 I Dilution of test sample Dilute the 5 micro lit of sample in Iml of dilution buffer IXTMB/H202 To 0.6 ml of 10XTMB in 5.4ml of distilled water I. 1X stop solution To 12 ml 5X stop solution add 48 ml of distilled water III. PROCEDURE A. Coating of antibody on wall of microtitre plate 1. Concentration of reconstituted antibody of coating is 0.Img/ml, dilute to Imicrogram/ml with coating buffer i.e. 50 ul of sample in 4.95 ml of coating buffer. 2. Pipette 200 ul of diluted antibody into each well of micro titre plate allow it spread eventually. 3. Incubate the 96 well micro titre plate at 4 Covernight. B. Blocking residual binding site 1. Discard the content. Rinse with distilled water three times 2 Fill each well with 200 ul of blocking buffer and incubate at room temperature for 3. Rinse with distilled water three times drain out the water completely by aping on blotting paper 1 hour. C. Addition of antigen to the well 1. Add 100 ul ofdiluted sample as shown in table along with PBST Dilute 1000X HRP-conjugate to 1X using diluent i.e. 3 ul ofstock in 3 ml diluents 1 D. Addition of HRP-conjugate antigen solution. Add 100 ul of 1XHRP-conjugate to each well 29
- 23. Discard the content. rinse with distilled water three times E. Addition of substrate and measurement of absorbance 1. Add 200 ul of 1X TMB/H202 to each well 2. Incubate at room temp for 10 minute 3. Add 100 ul of 1X stop solution to each well 4. Transfer content of each well into individual tube containing 2ml of 1X stop solution 5. Prepare substrate blank by adding 200ul of 1X TMB/HO2 in 2.1 ml of stop solution. Take O.D. at 450 nm. F. Preparation of blank Add 100 ul of 1X substrate and 2.1ml of 1X stop solution to a test tube Measure O.D at 450nm RESULTs cONCLUSIONS Reparation o ELI6A plate was shudied theoNeically 30
- 24. Experiment No. 5 Date: 2132014 ELISA READER AIM Demonstration of ELISA THEORY Enzyme Linked Immuno Sorbent Assay also called ELISA. Enzyme Immuno Assay or ElA is a biochemical technique used mainly in immunology to detect the presence of an antibody or an antigen in a sample. The ELISA has been used as a diagnostic tool in medicine and plant pathology, as well as a quality control check in various industries. In simple tems, in ELSA an unknown amount of antigen is affixed to a surface, and then a specific antibody is washed over the surface so that it can bind to the antigen. This antibody is linked is linked to an enzyme, and in the final step a substance is added that the enzyme can convert to some detectable signal. Thus in the case offluorescence ELISA, when light of the appropriate wavelength is shone upon the sample, any antigen/antibody complexes will fluoresce so that the amount of antigen in the sample can be inferred through the magnitude ofthe fluorescence. PRINCIPLE Performing an ELISA involves atleast one antibody with specificity for a particular antigen. The sample with an unknown amount of antigen is immobilized on a solid support i.e on microtiter plate either non-specifically or specifically. After the antigen is immobilized the detection antibody is added, forming a complex with the antigen. The detection antibody can be convalently linked to an enzyme, or can itself be detected by a secondary antibody which is linked to an enzyme through biconjugation Between each step the plate is typically washed with a mild detergent solution to remove any proteins or antibodies that are not specifically bound. After the final wash step the plate is developed by adding an enzymatic substrate to produce a visible signal, which indicates the quantity ofantigen in the sample. ELISA READER Main features -Flexibility and precision in microplate strip washing, Top loading: provides easy handling and operation, Low noise pump, Aspiration Time: continuous aspiration reduces risk ofwell to well overflow and cross, Compact size RESULTs CONCLUSIONS he technigpue of ElISA Lwas demonsirated