Downloaded 192 times


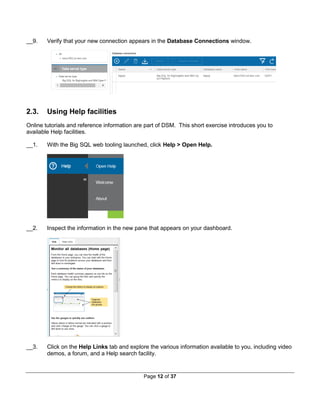
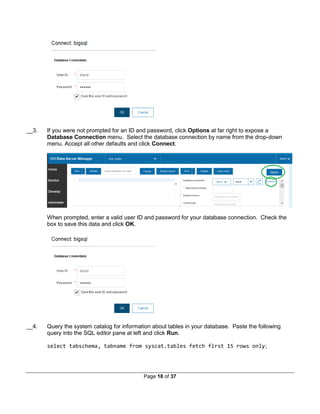
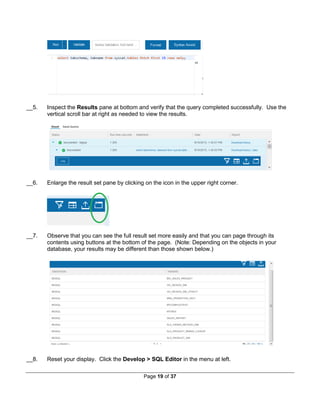
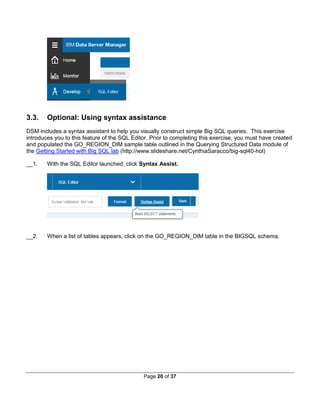
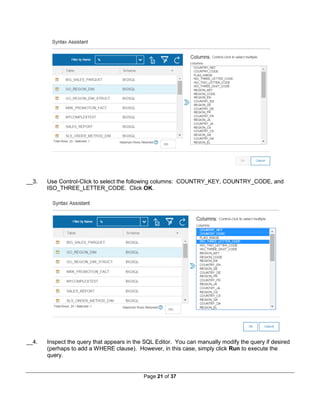
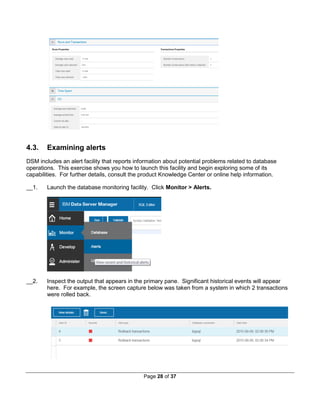

This document is a comprehensive lab guide for using IBM's Data Server Manager (DSM) with Big SQL, providing step-by-step instructions on launching the web tooling, connecting to databases, executing queries, and monitoring database metrics. The guide includes multiple labs that cover key concepts, such as exploring database tables, collecting statistics, and utilizing online help features. It emphasizes the importance of having a properly configured environment and provides resources for obtaining additional support.


