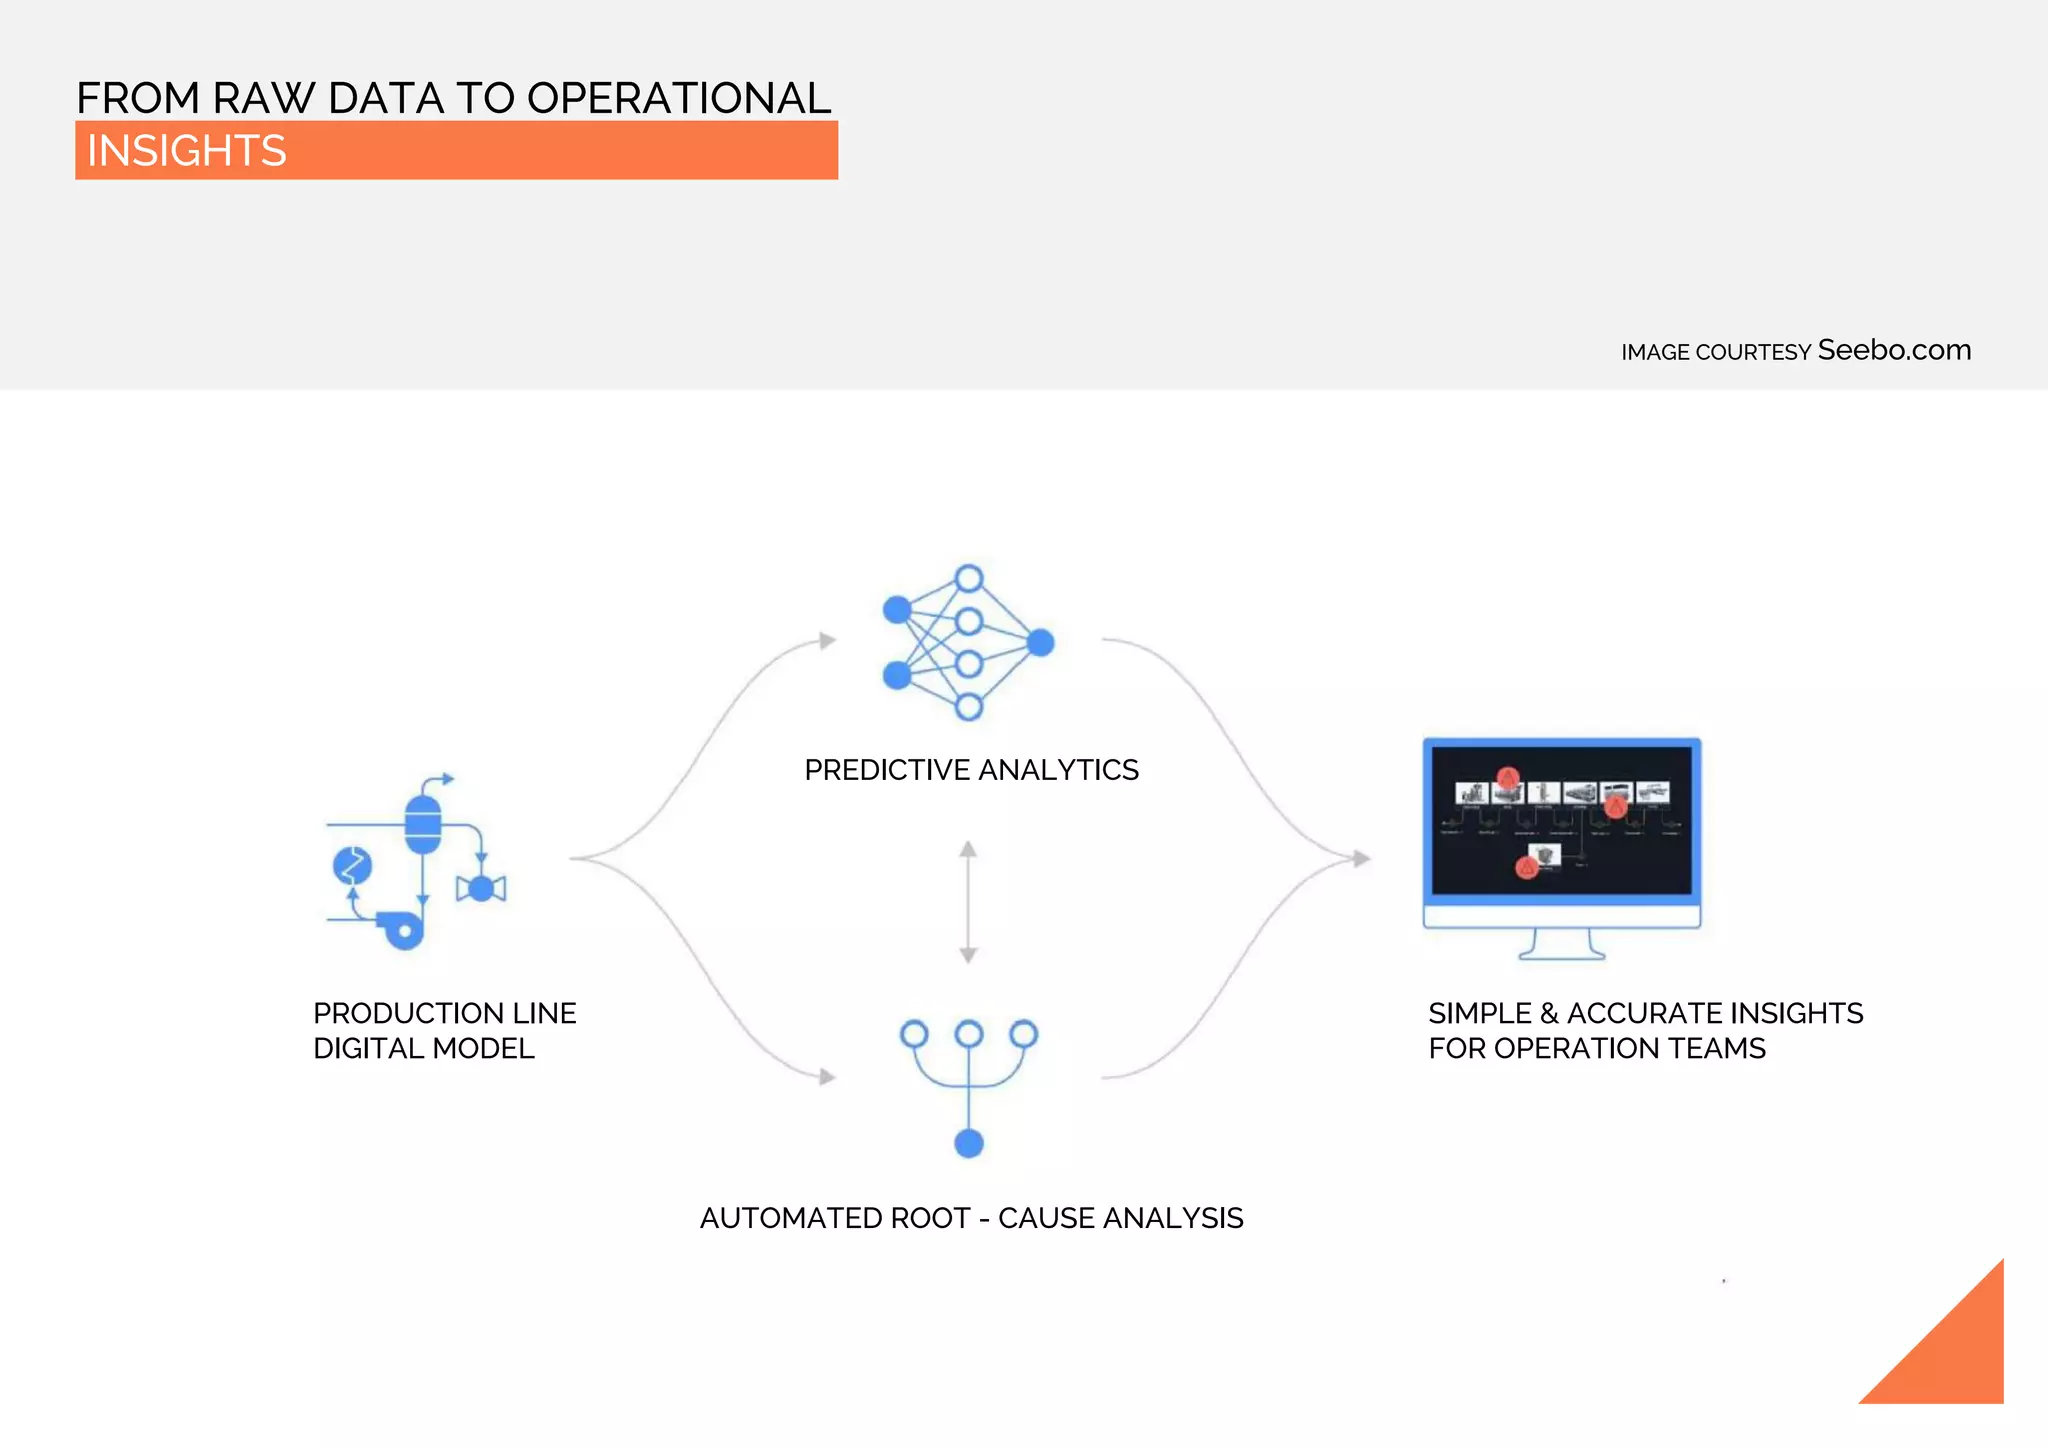
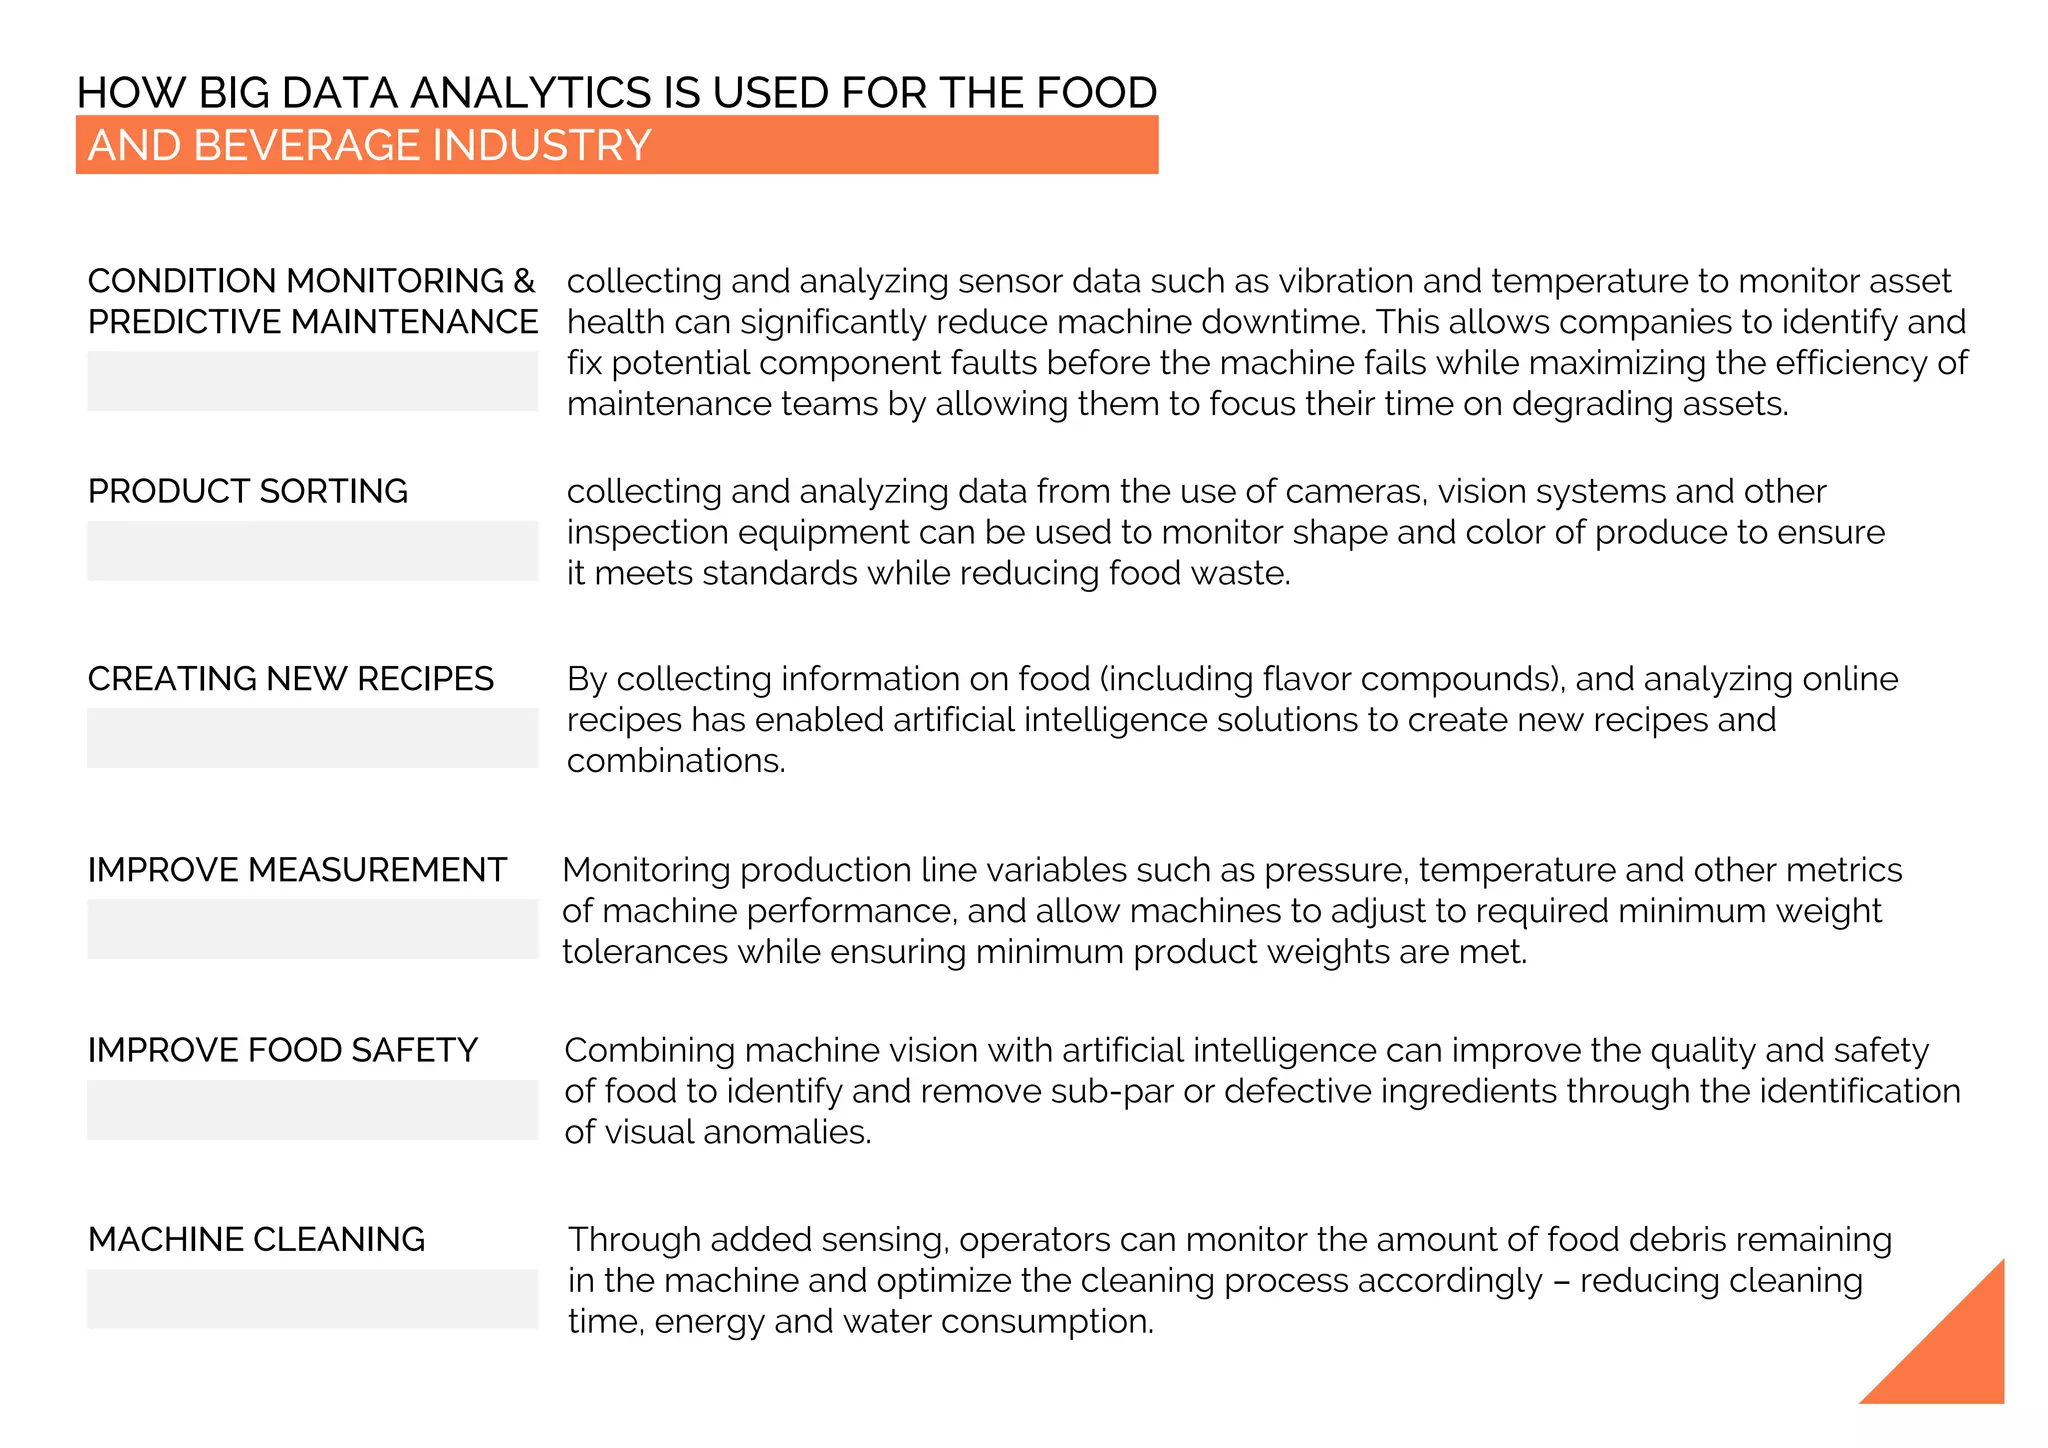
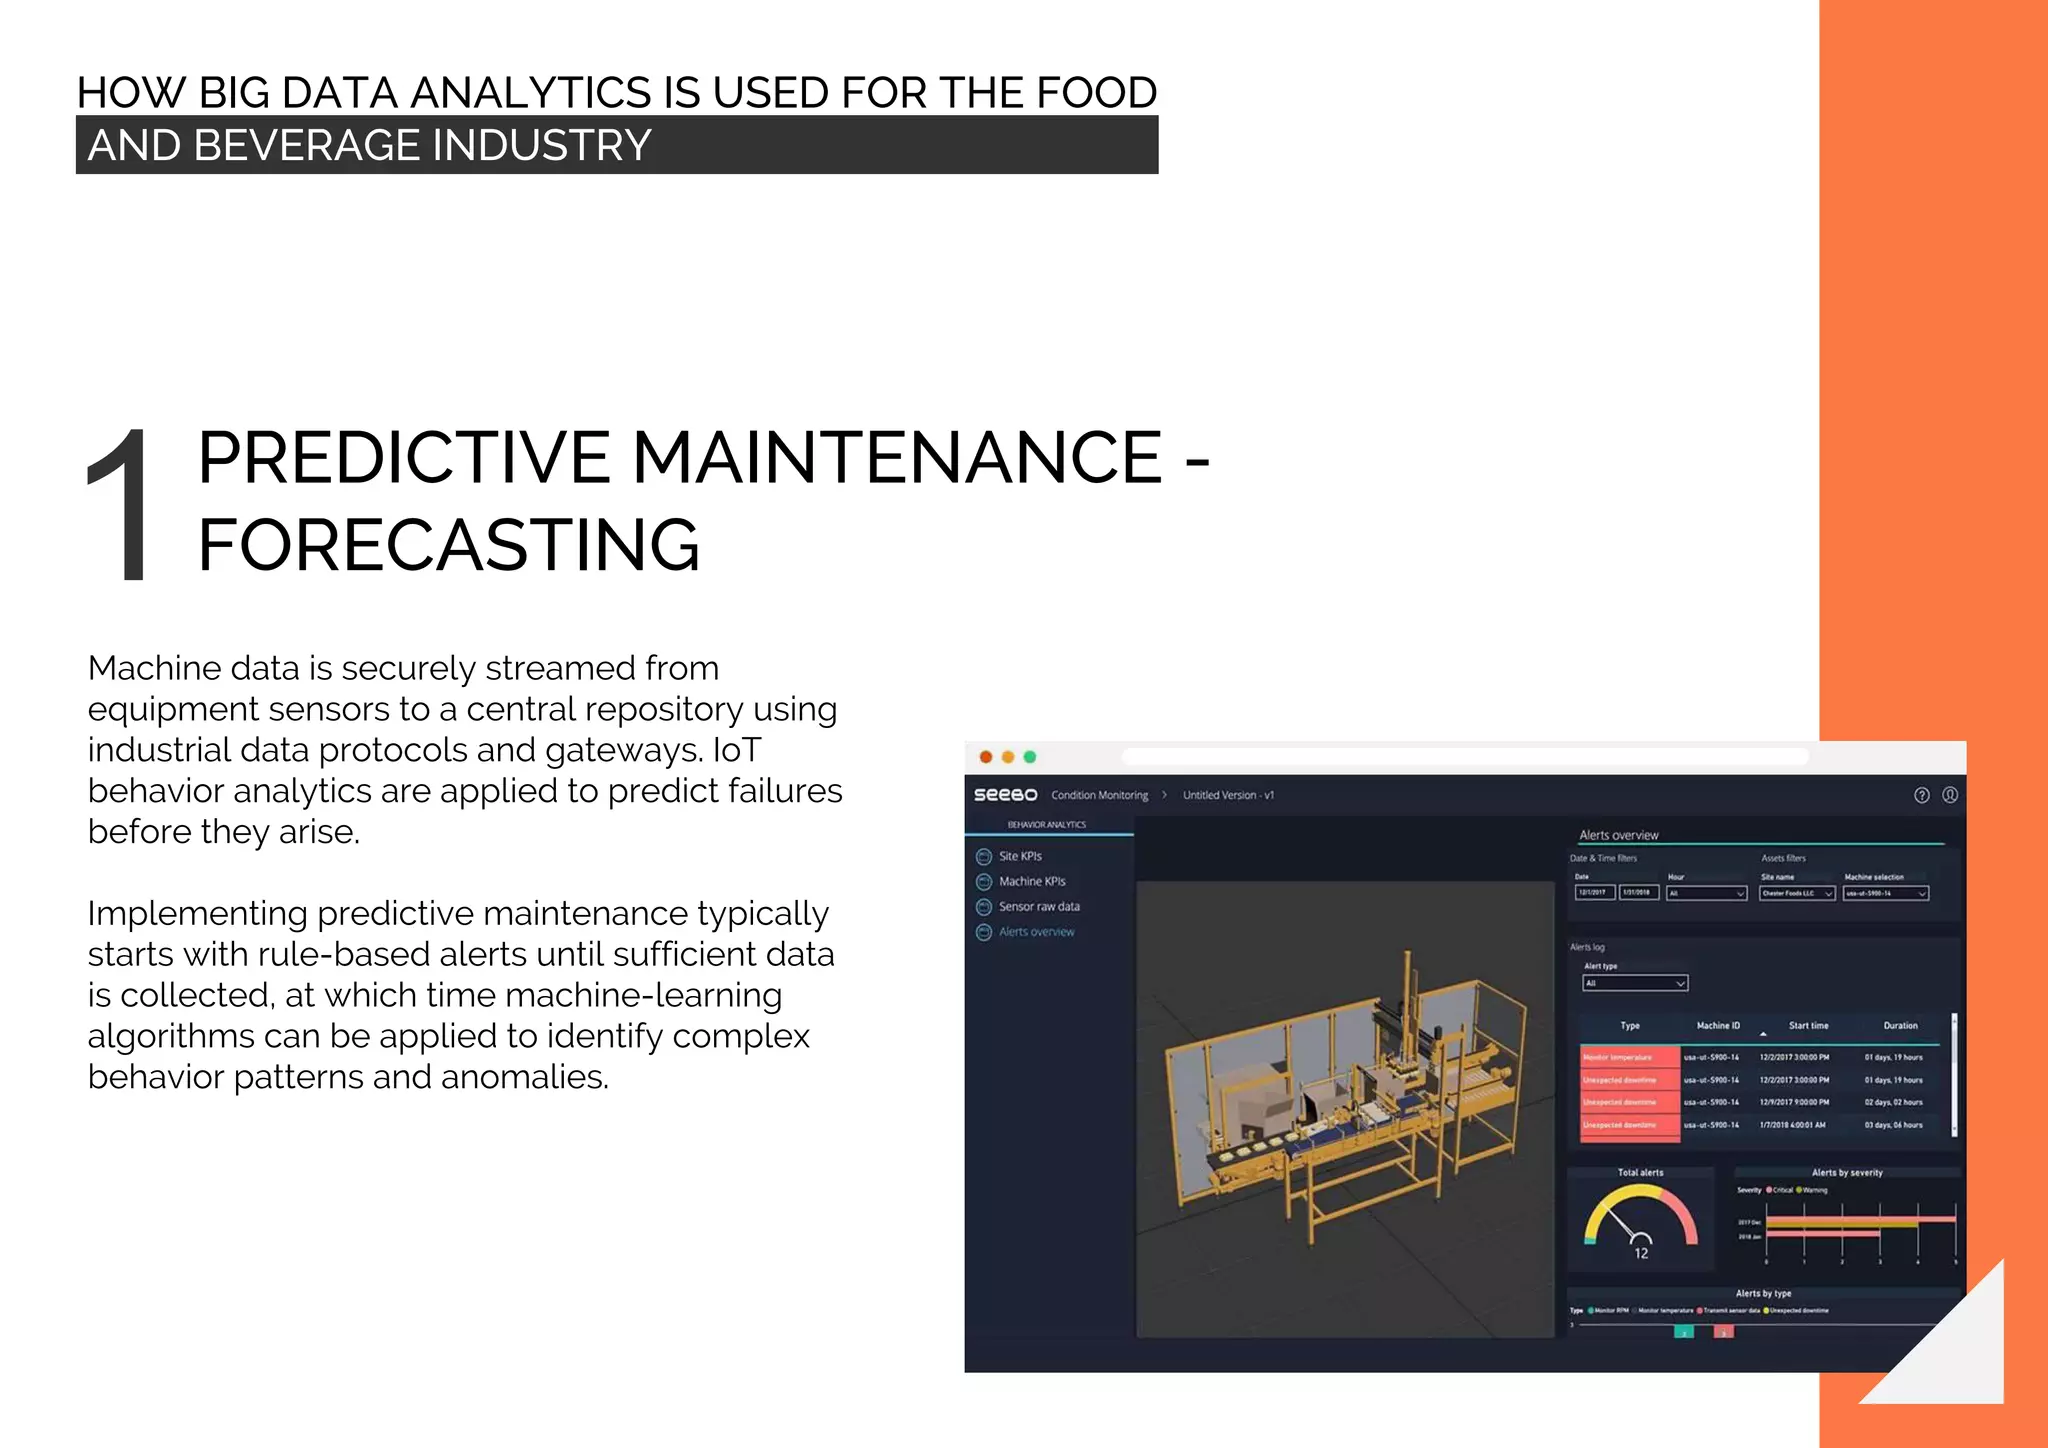
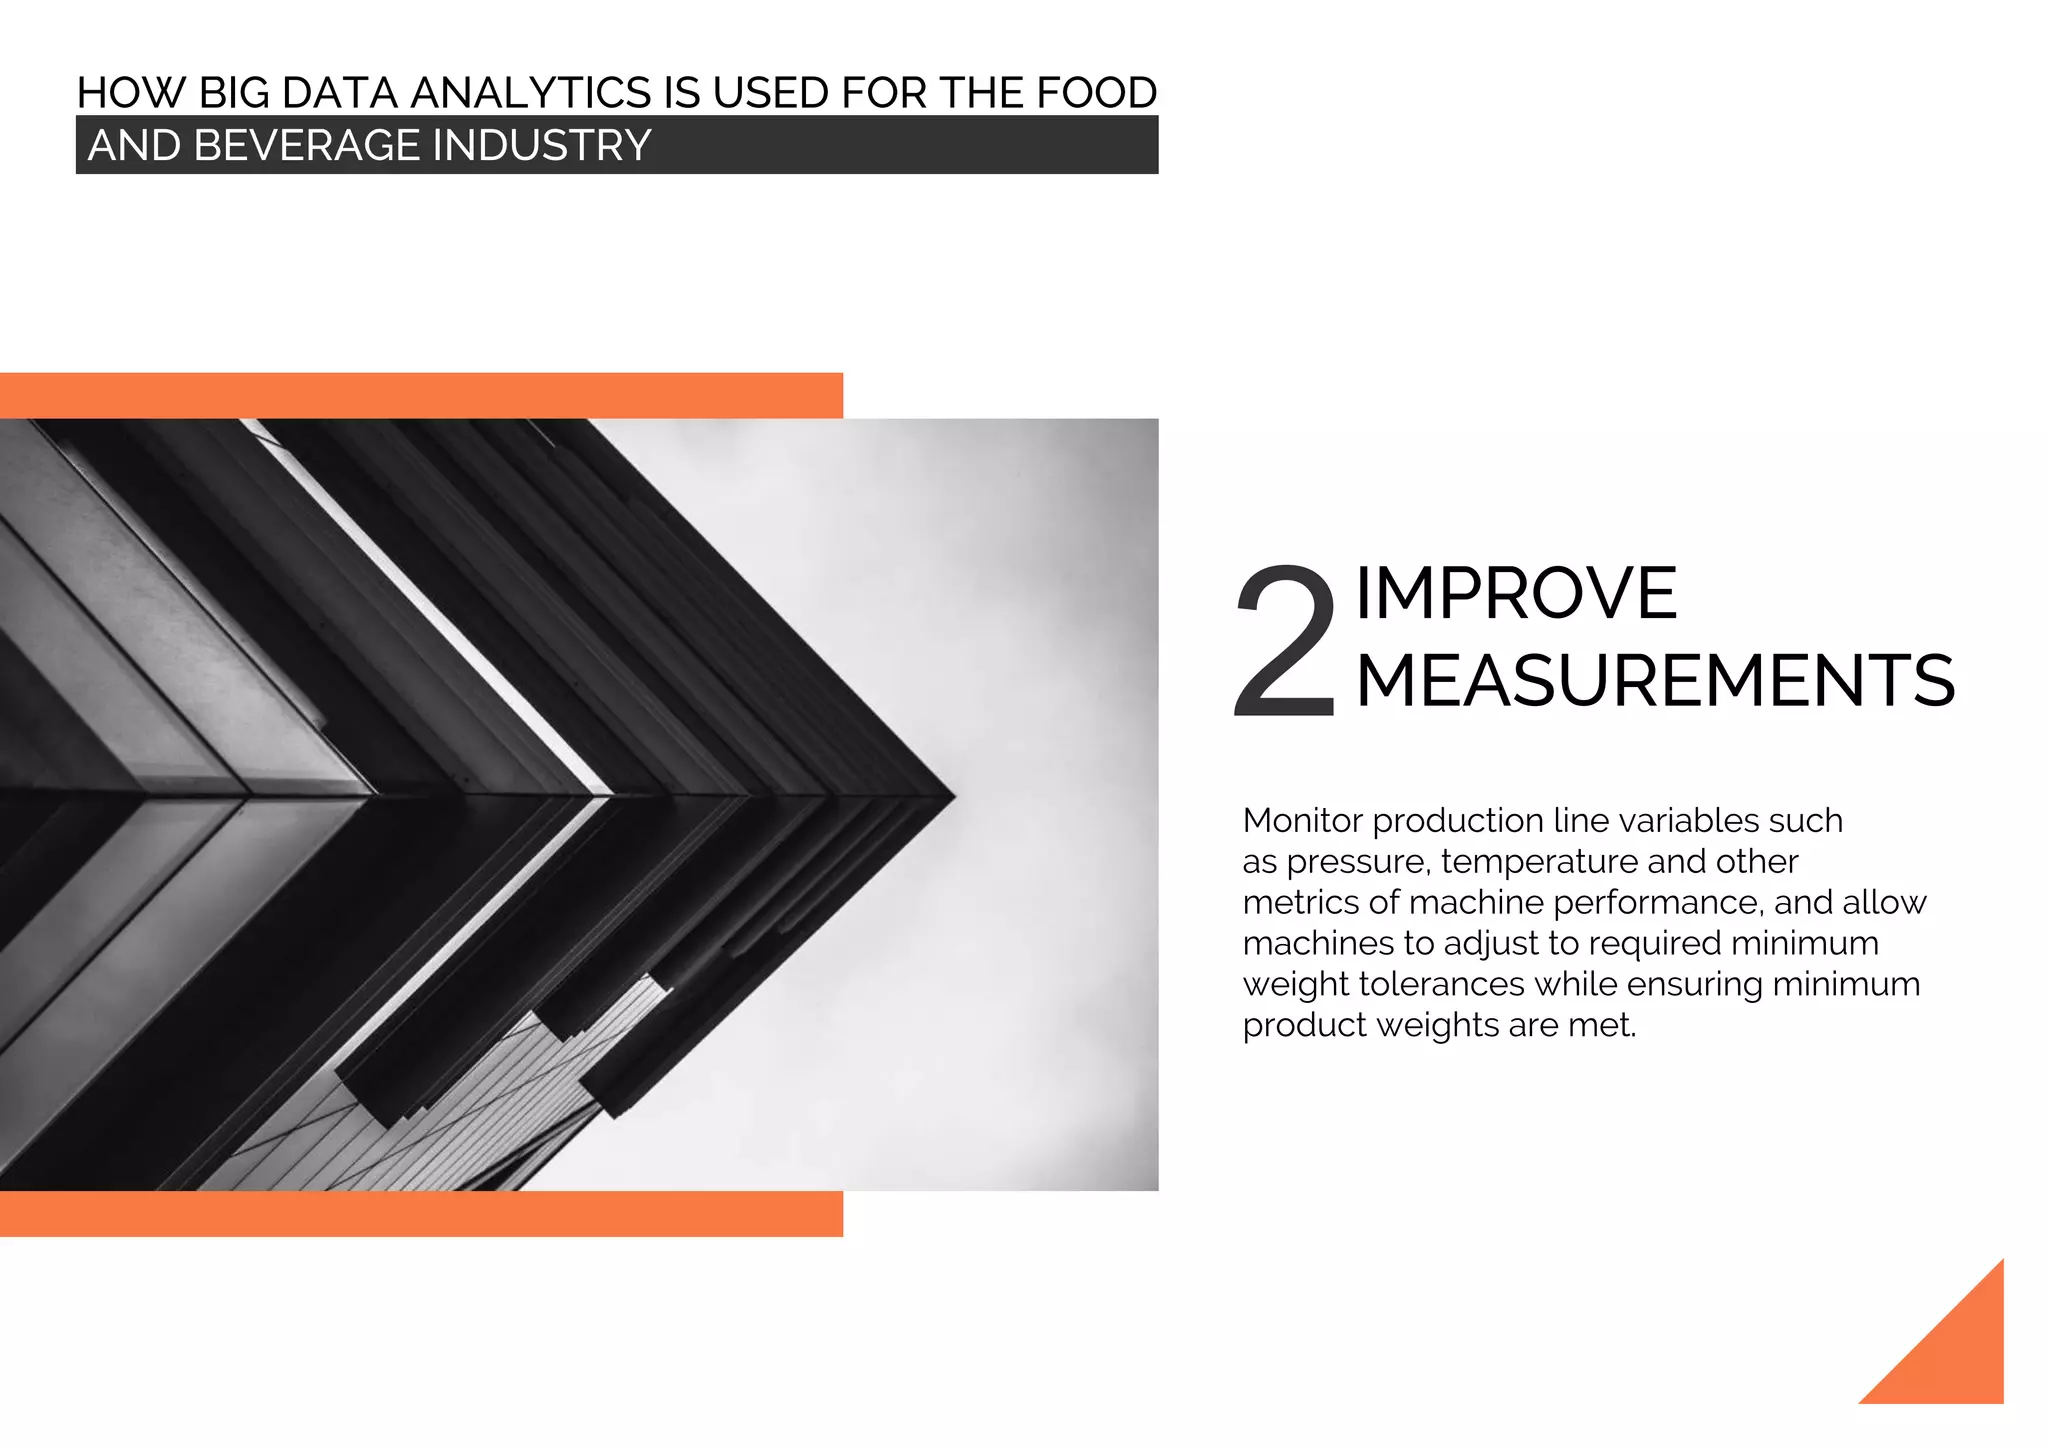
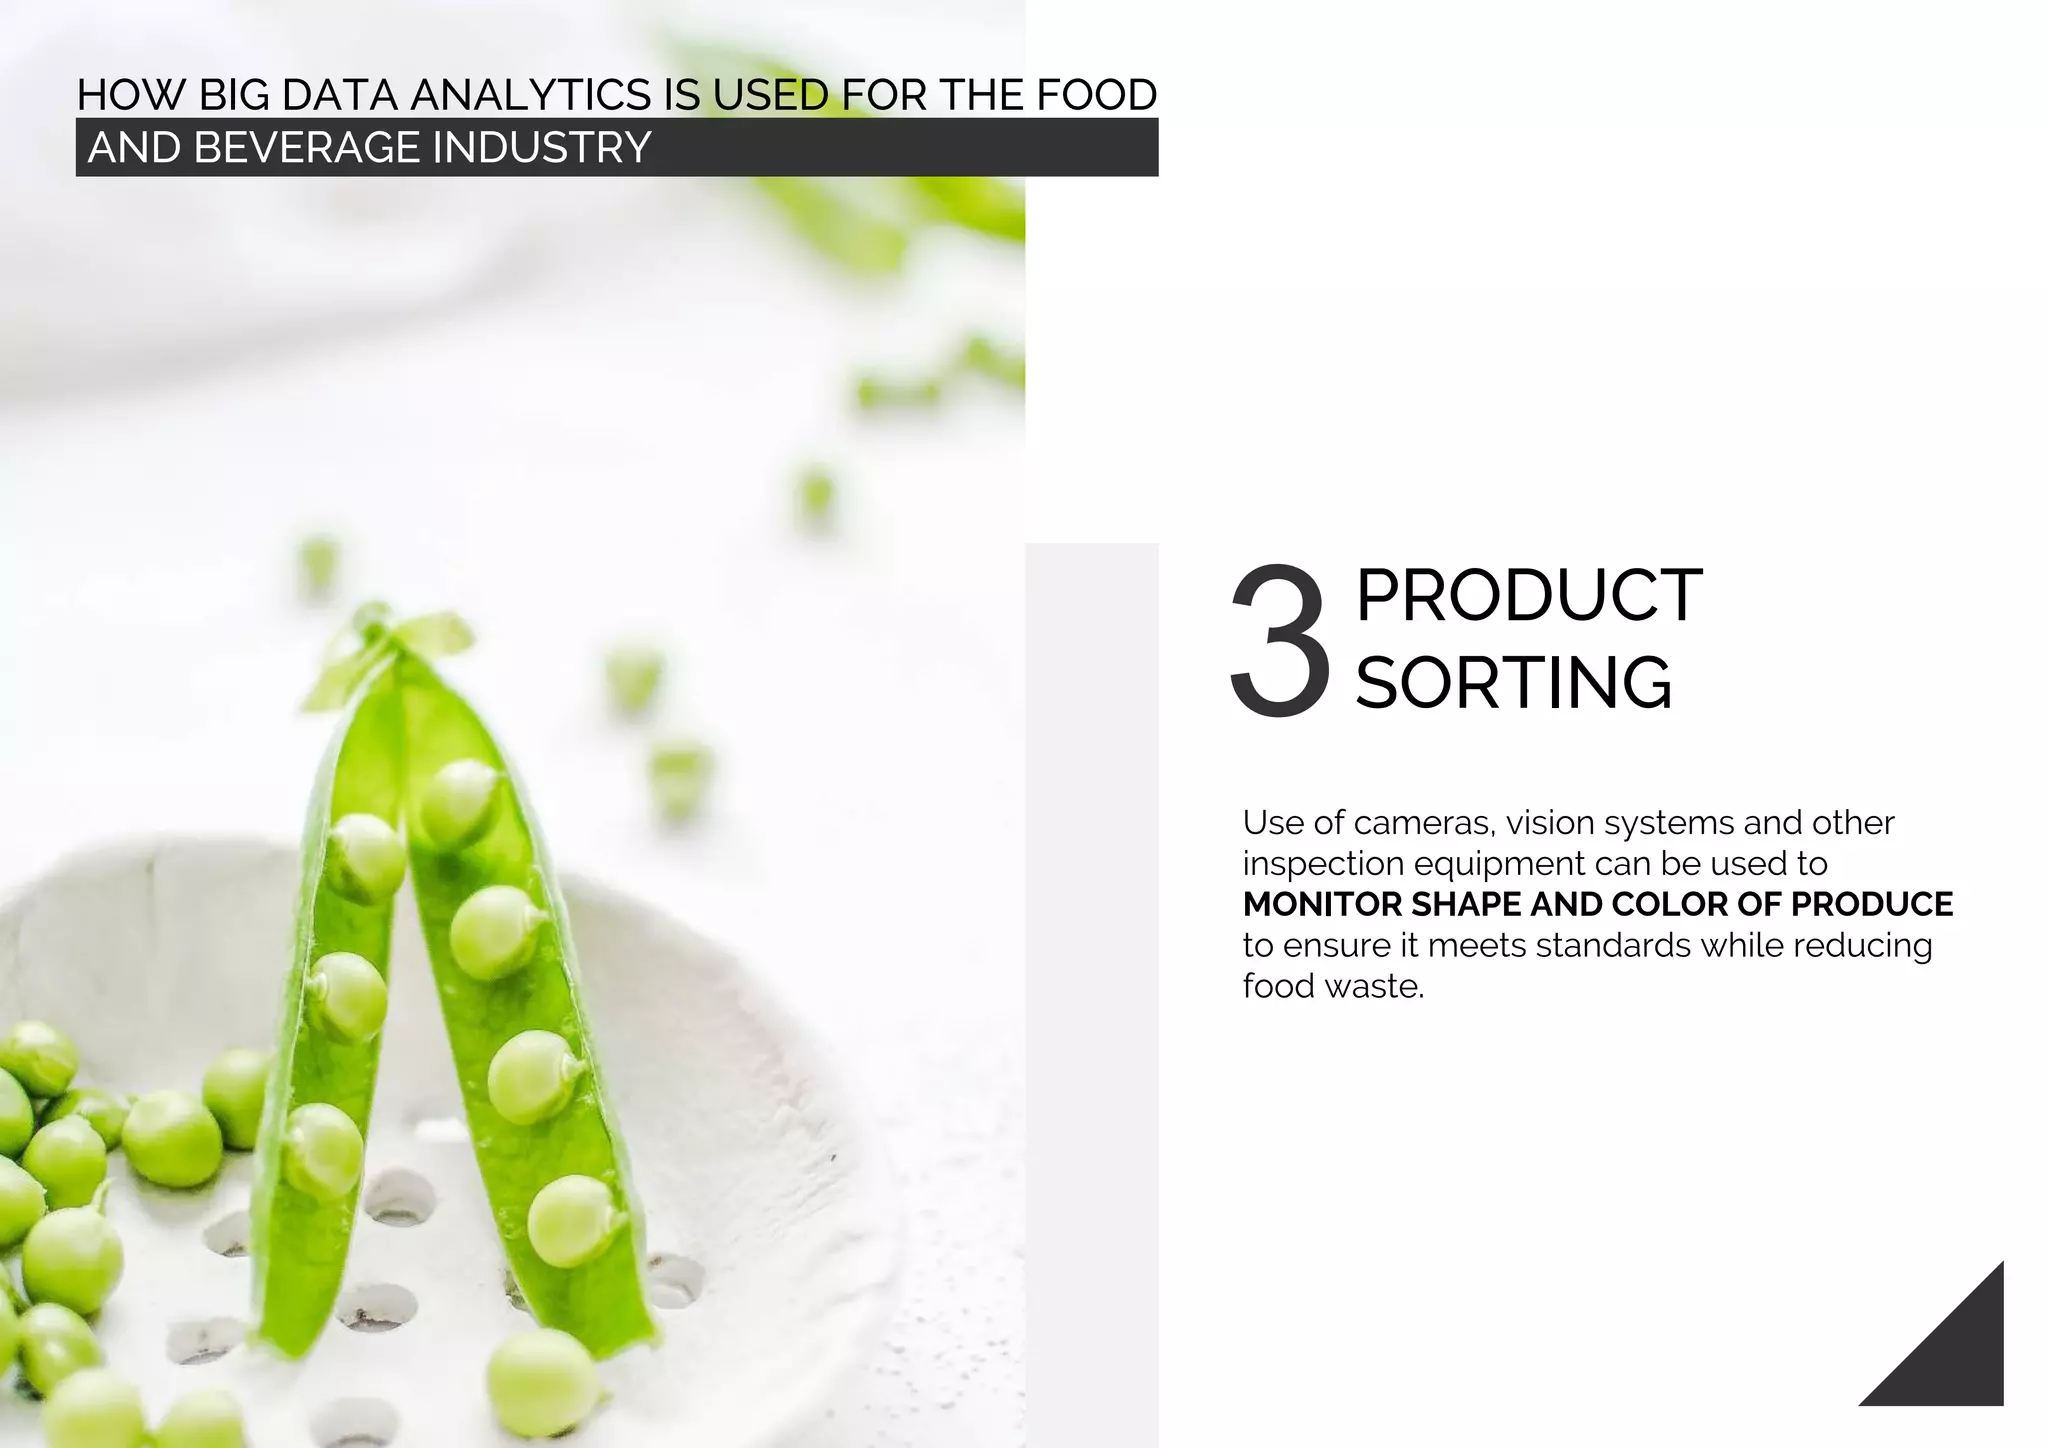
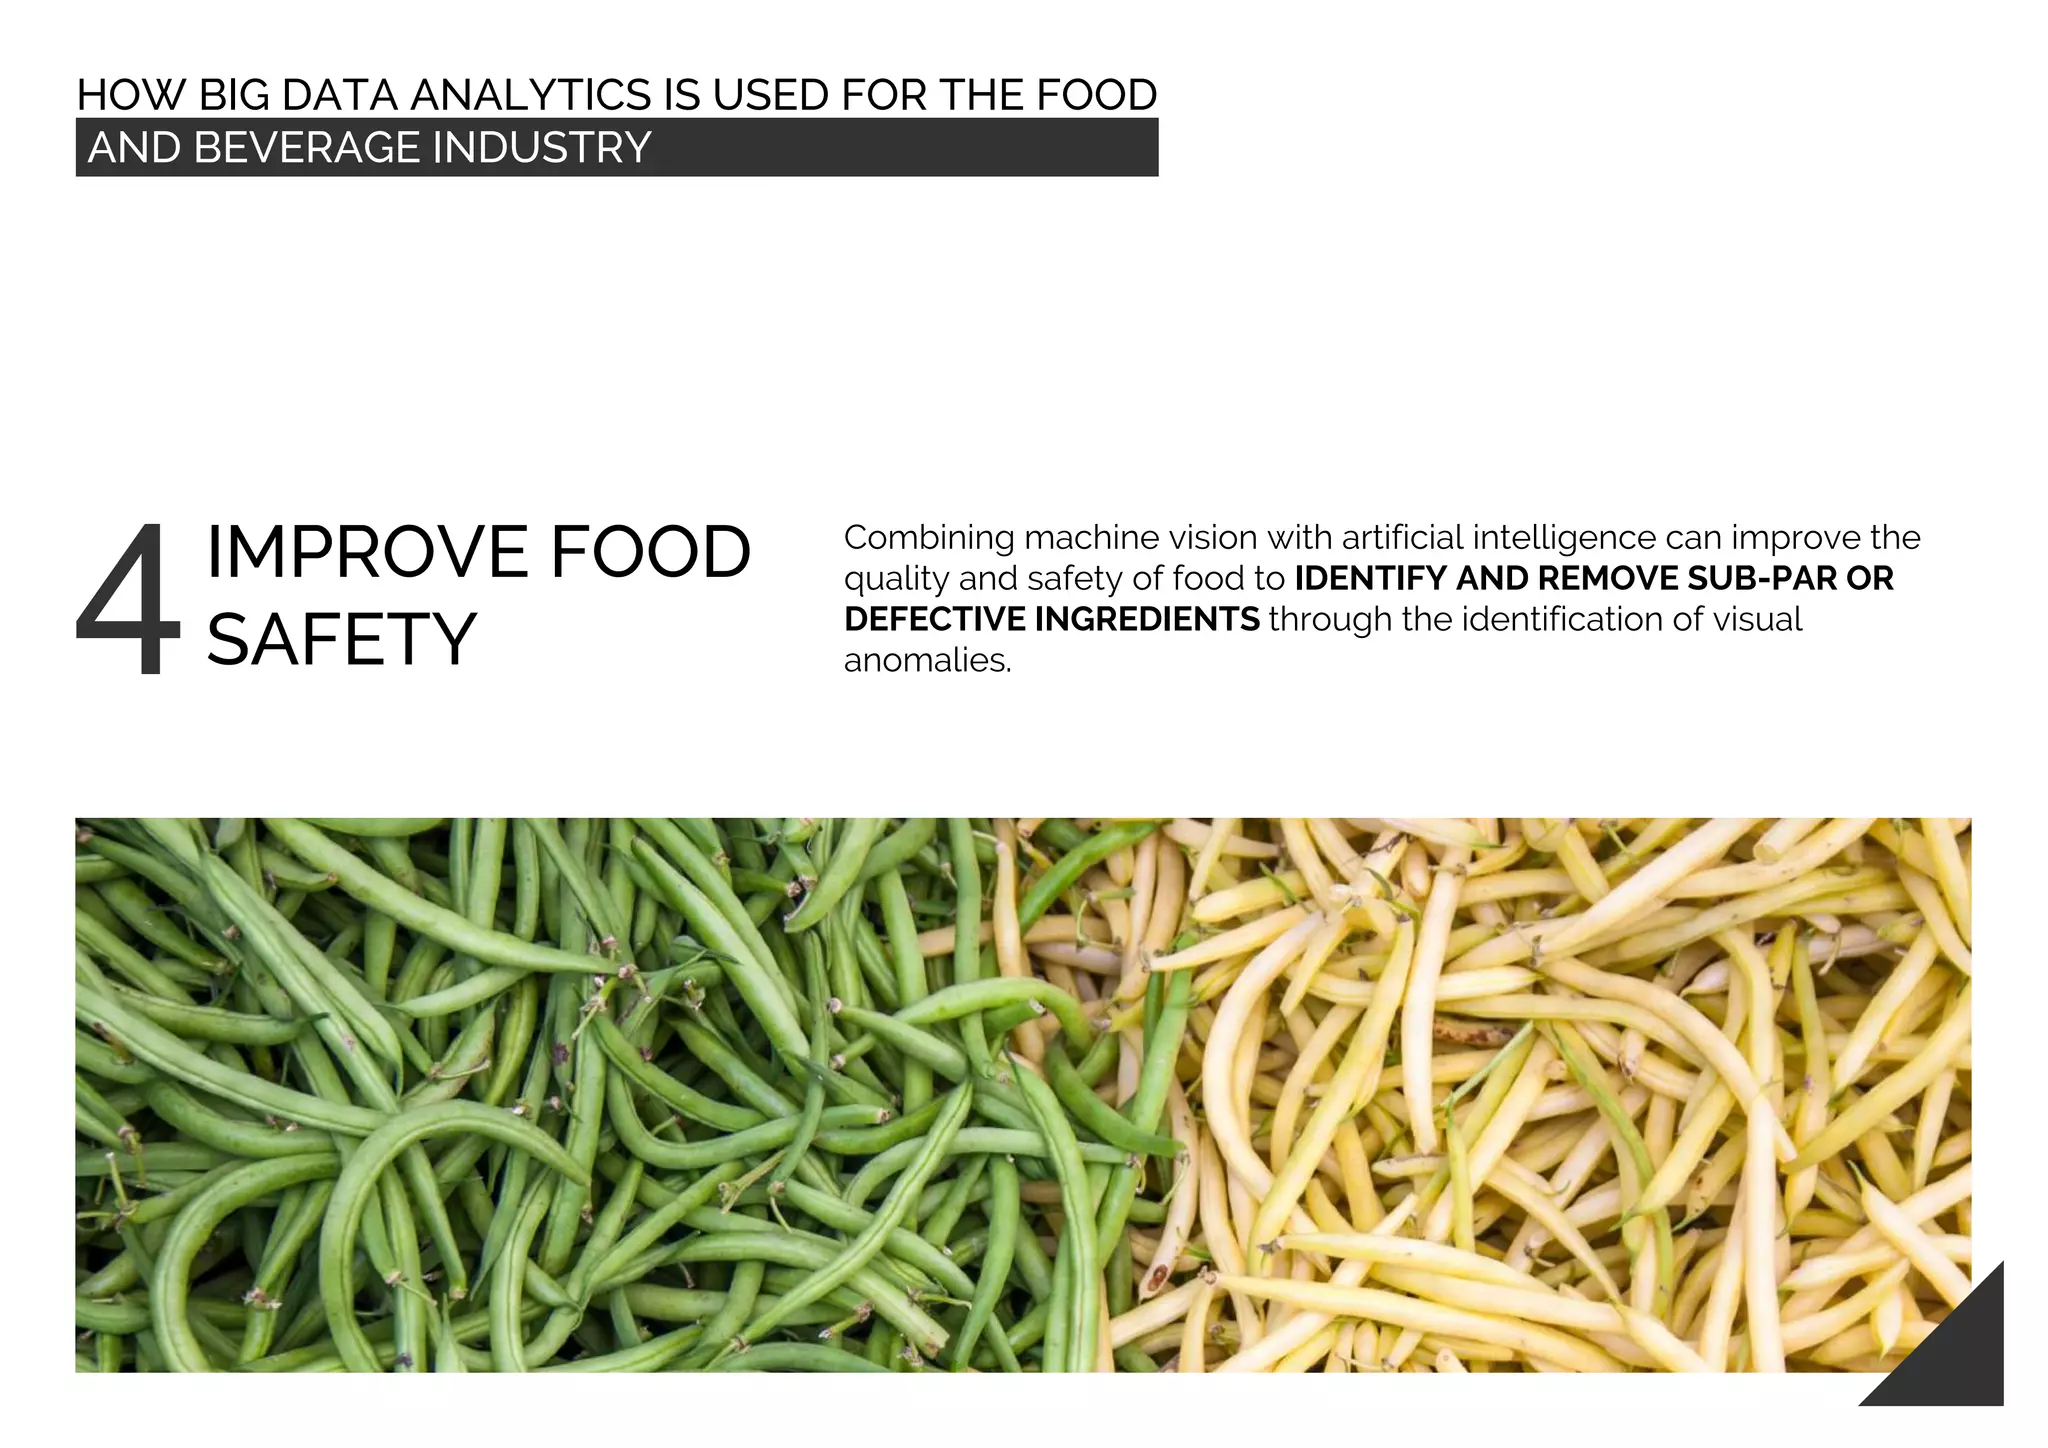
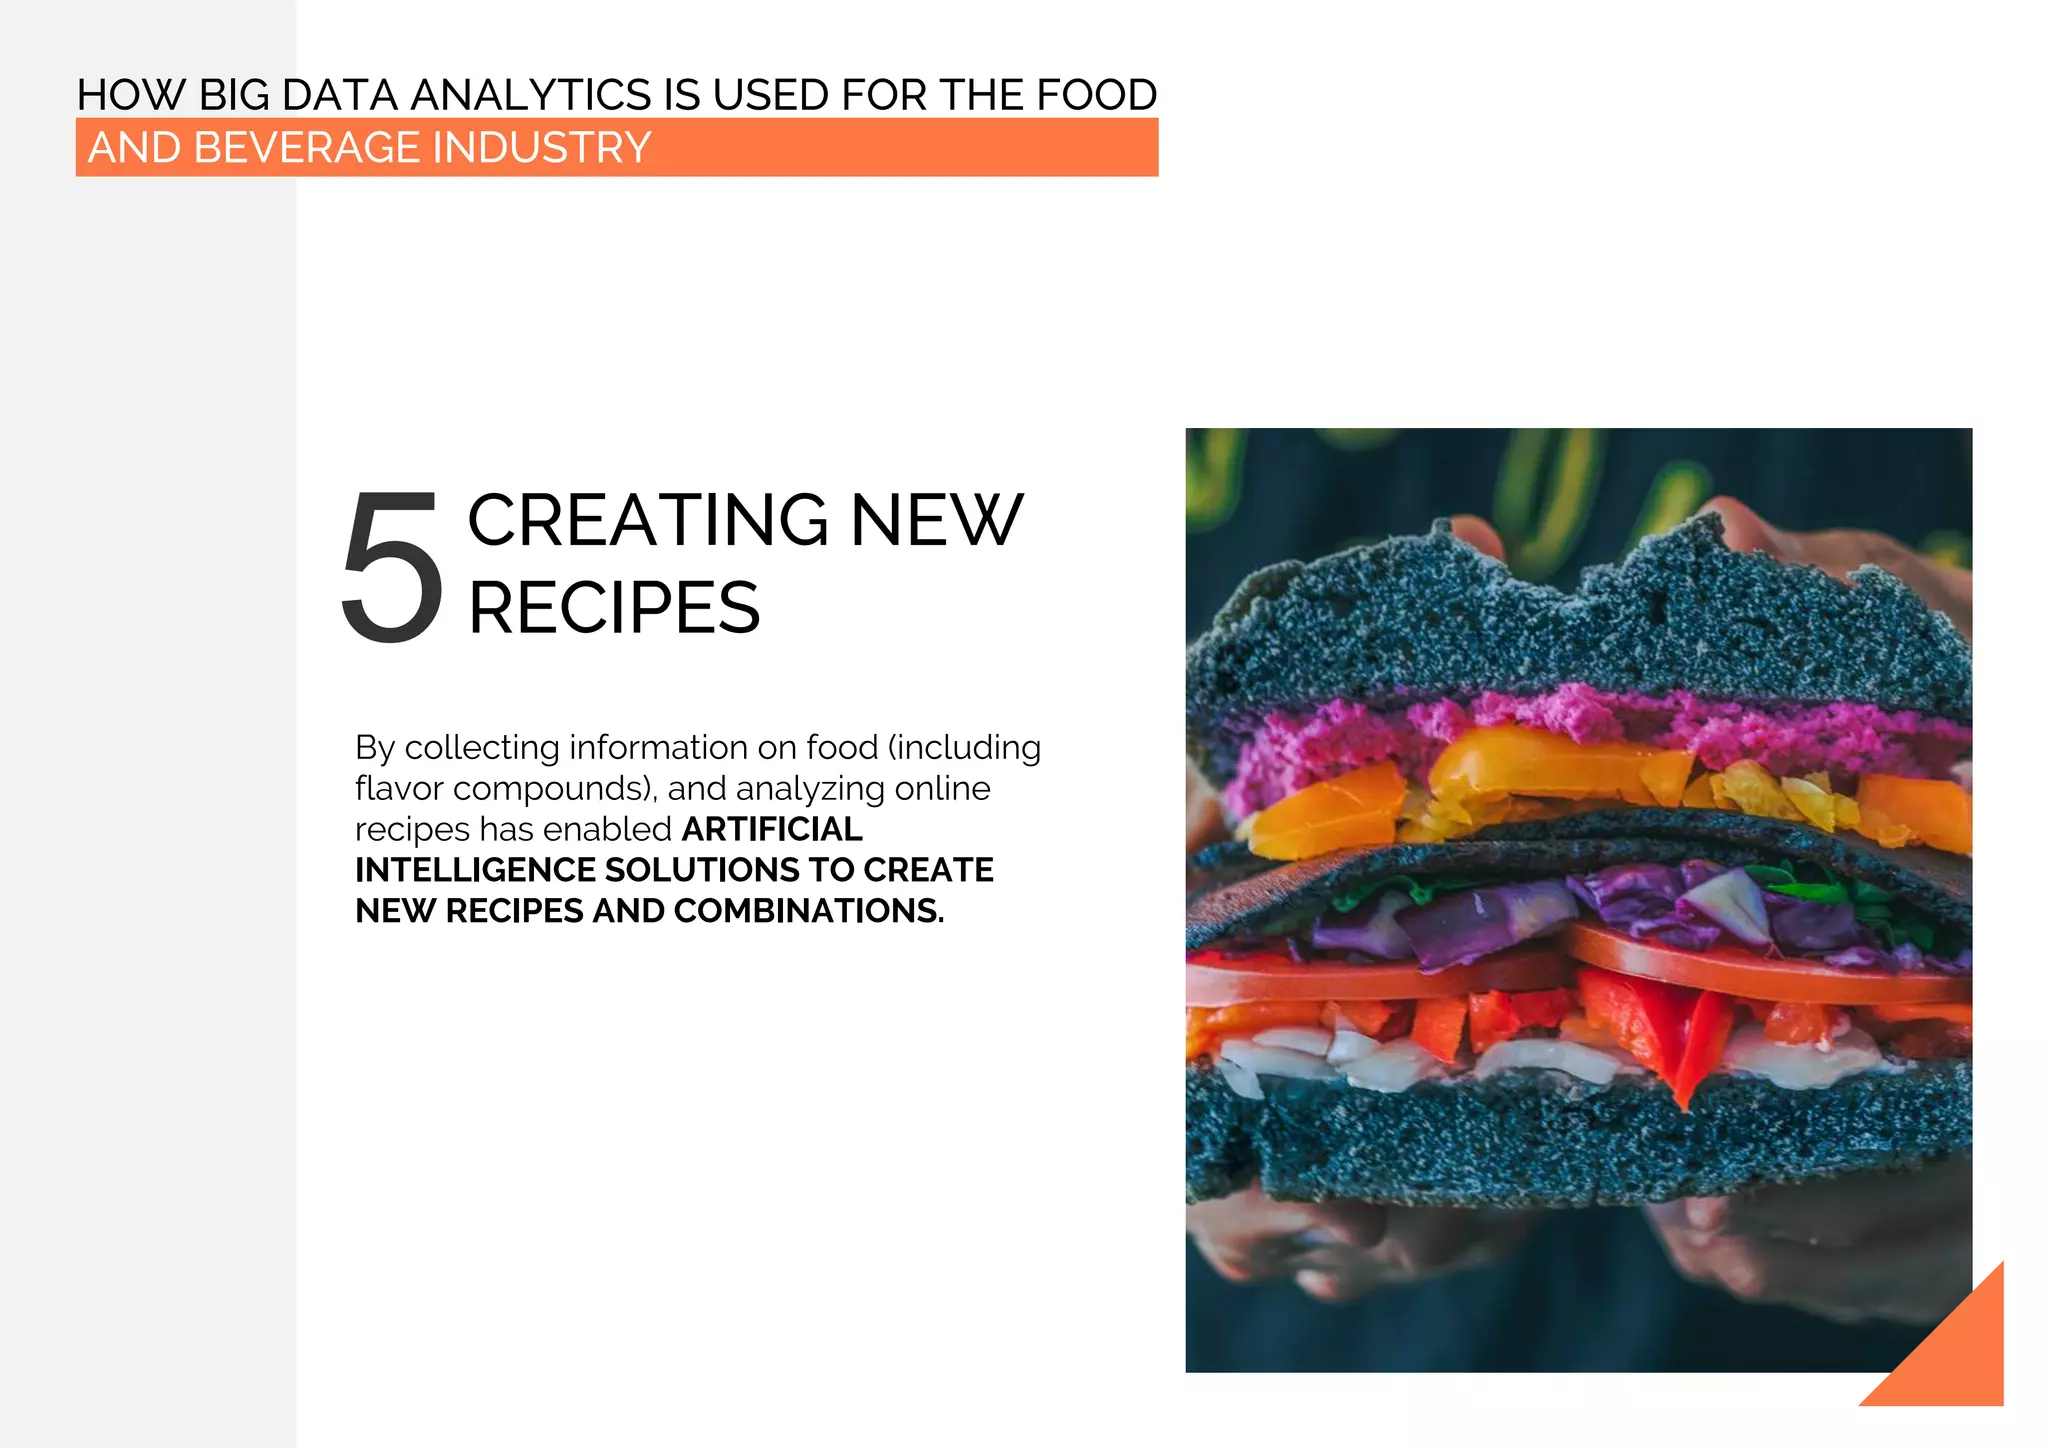
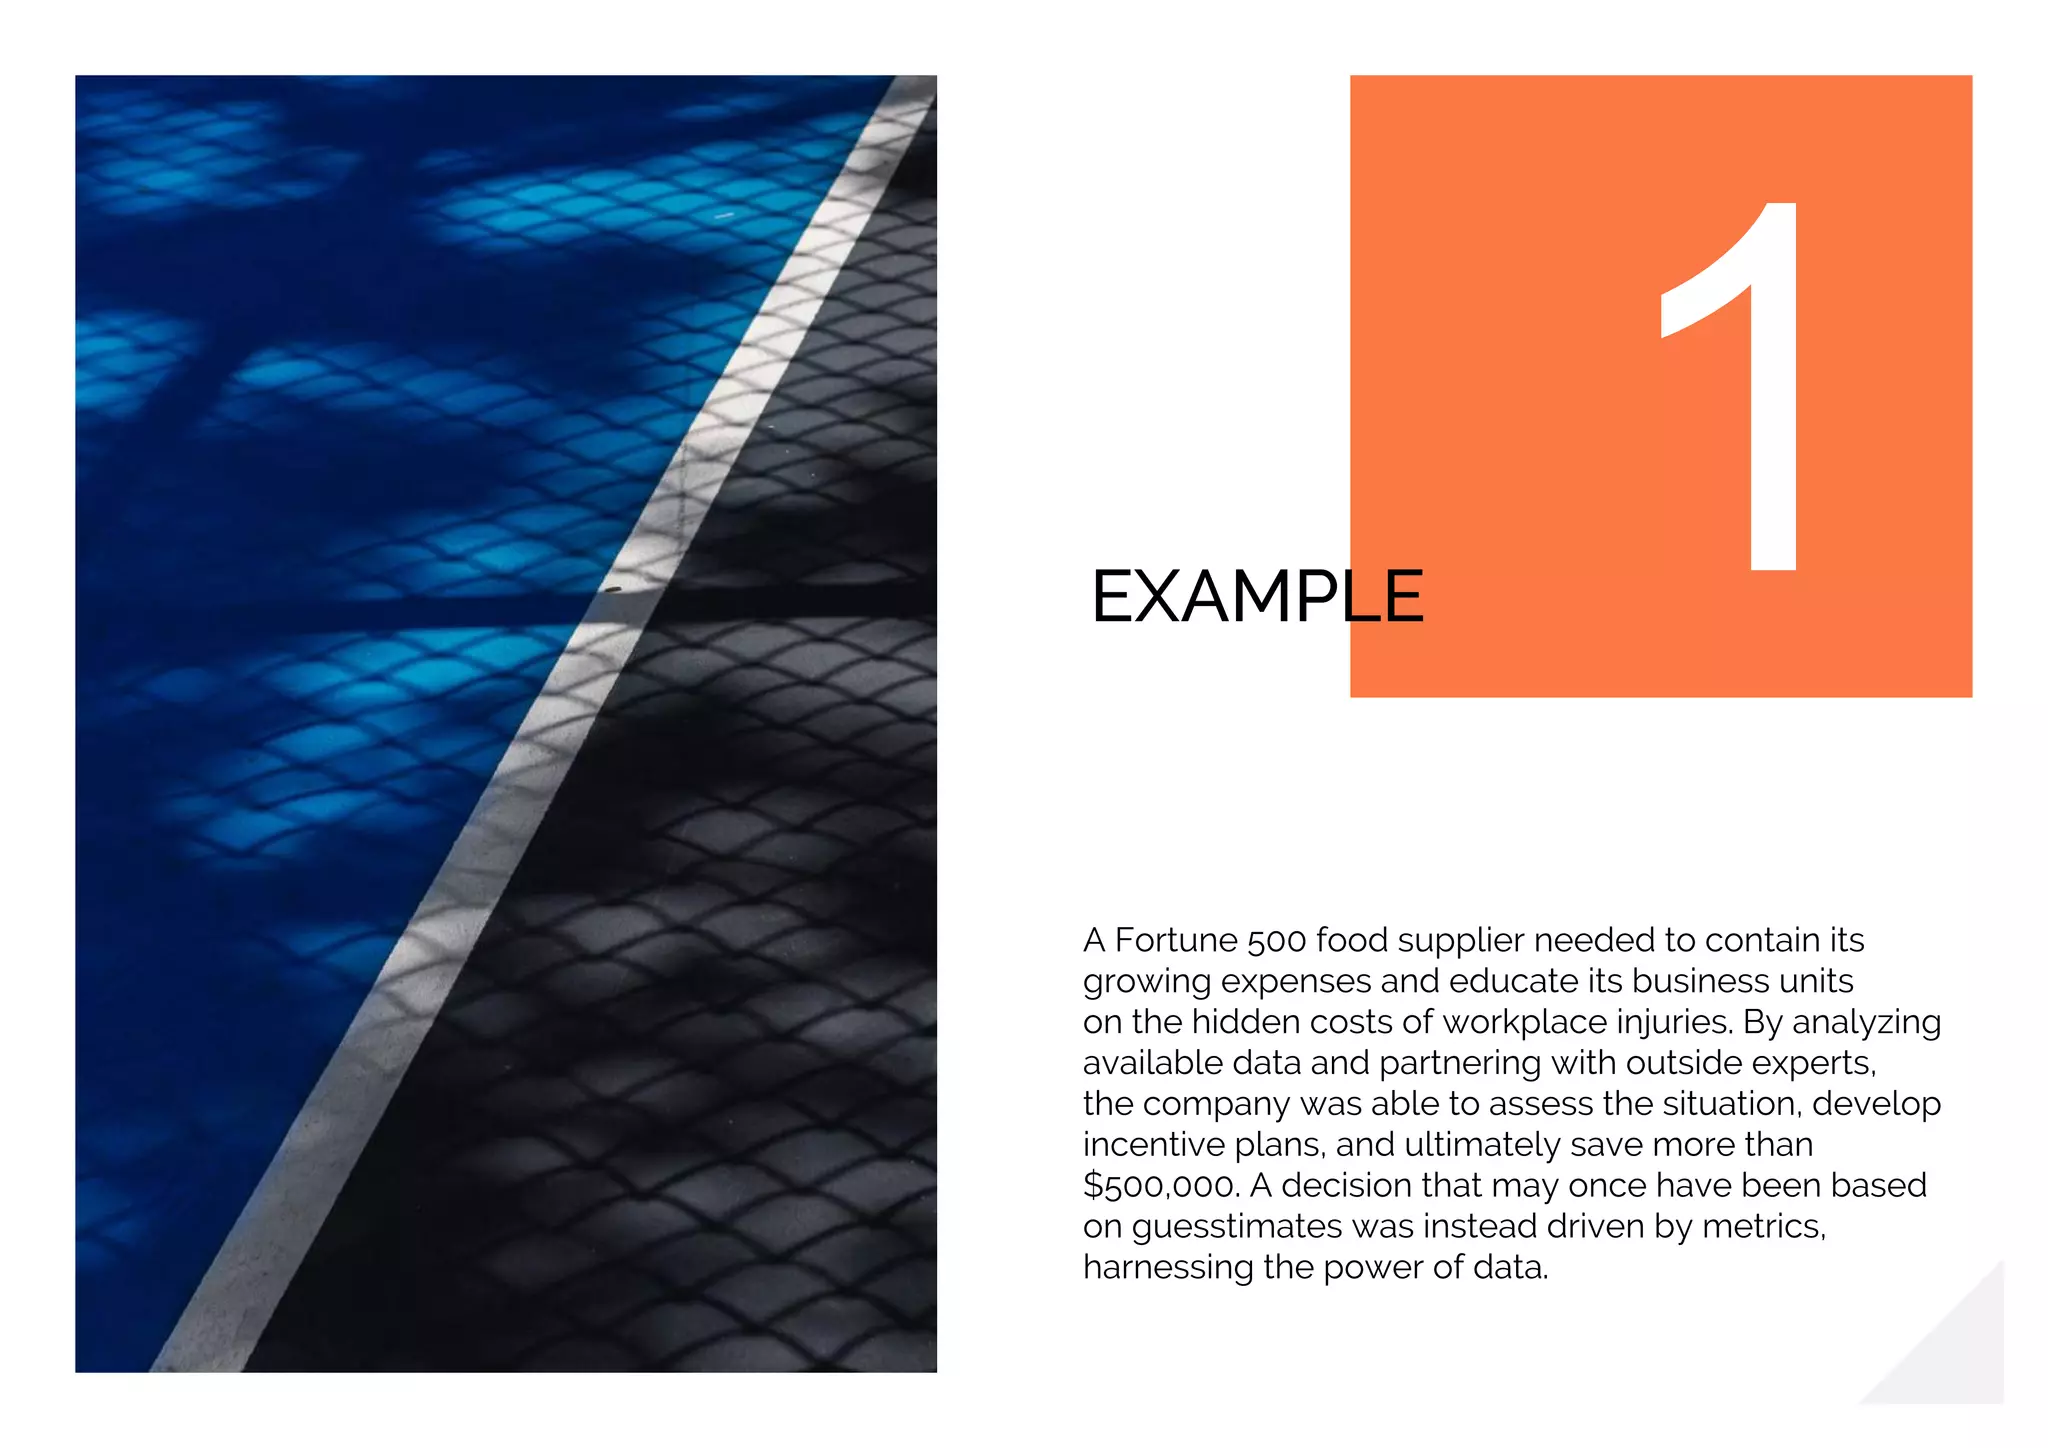
Food and beverage manufacturers use big data analytics to optimize processes, improve efficiency, increase quality, and ship products on schedule. By analyzing real-time sensor data from manufacturing equipment, manufacturers can identify patterns and relationships to optimize factors like yields. Manufacturers also use big data analytics to analyze supplier and logistics data to optimize supply chains and logistics. The key takeaway is that by quantifying risks using big data tools, food and beverage companies can make more intelligent business decisions.
Detailed description of big data, with the characteristics of it. What are the limitations of the traditional systems? Where we are using big data? And also the applications of big data.
Facts About Big Data, How it is stored . How Big Data is being Proceed And What is the tools and Techniques which is used for handling BigData. All are coverd in these Slides
It has been said that Mobiles +Cloud + Social + Big Data = Better Run The World. IBM has invested over $20 billion since 2005 to grow its analytics business, many companies will invest more than $120 billion by 2015 on analytics, hardware, software and services critical in almost every industry like ; Healthcare, media, sports, finance, government, etc.
It has been estimated that there is a shortage of 140,000 – 190,000 people with deep analytical skills to fill the demand of jobs in the U.S. by 2018.
Decoding the human genome originally took 10 years to process; now it can be achieved in one week with the power of Analytic and BI (Business Intelligence). This lecture’s Key Messages is that Analytics provide a competitive edge to individuals , companies and institutions and that Analytics and BI are often critical to the success of any organization.
Methodology used is to teach analytic techniques through real world examples and real data with this goal to convince audience of the Analytics Edge and power of BI, and inspire them to use analytics and BI in their career and their life.
Big data Analytics is a process to extract meaningful insight from big such as hidden patterns, unknown correlations, market trends and customer preferences
Big Data presence in the high volume in the data storages can help in various ways to learn more about the need and trends of the current market which will be useful for all type of organizations. Modern information technology used to analyze the relationship between social trends and market insights is a useful way to have indirectly interlinked to customers and their interests from unstructured and semi-structured data. Such analysis will give organizations a broader view towards the practical needs of customers and once banking industry or any industry could know the customers, they can serve better and with more flexibility. In this presentation, team has primarily created the platform and designed the architecture in big data technology for banking industry to maximize the users of credit card.
Big data is a term that describes the large volume of data – both structured and unstructured – that inundates a business on a day-to-day basis. But it’s not the amount of data that’s important. It’s what organizations do with the data that matters. Big data can be analyzed for insights that lead to better decisions and strategic business moves.
Big Data Analytics and its Application in E-CommerceUyoyo Edosio
Abstract-This era unlike any, is faced with explosive
growth in the size of data generated/captured. Data
growth has undergone a renaissance, influenced
primarily by ever cheaper computing power and
the ubiquity of the internet. This has led to a
paradigm shift in the E-commerce sector; as data is
no longer seen as the byproduct of their business
activities, but as their biggest asset providing: key
insights to the needs of their customers, predicting
trends in customer’s behavior, democratizing of
advertisement to suits consumers varied taste, as
well as providing a performance metric to assess the
effectiveness in meeting customers’ needs.
This paper presents an overview of the unique
features that differentiate big data from traditional
datasets. In addition, the application of big data
analytics in the E-commerce and the various
technologies that make analytics of consumer data
possible is discussed.
Further this paper will present some case studies of
how leading Ecommerce vendors like Amazon.com,
Walmart Inc, and Adidas apply Big Data analytics in
their business strategies/activities to improve their
competitive advantage. Lastly we identify some
challenges these E-commerce vendors face while
implementing big data analytic
Driving Data Intelligence in the Supply Chain Through the Data Catalog at TJXDATAVERSITY
Roles and responsibilities are a critical component of every Data Governance program. Building a set of roles that are practical and that will not interfere with people’s “day jobs” is an important consideration that will influence how well your program is adopted. This tutorial focuses on sharing a proven model guaranteed to represent your organization.
Join Bob Seiner for this lively webinar where he will dissect a complete Operating Model of Roles and Responsibilities that encompasses all levels of the organization. Seiner will detail the roles and describe the most effective way to associate people with the roles. You will walk out of this webinar with a model to apply to your organization.
In this session Bob will share:
- The five levels of Data Governance roles
- A proven Operating Model of Roles and Responsibilities
- How to customize the model to meet your requirements
- Setting appropriate role expectations
- How to operationalize the roles and demonstrate value
Predictive Analytics enables organisations to forecast future events, analyse risks and opportunities, and automate decision making processes by analysing historic data.
Big Data Analytics | What Is Big Data Analytics? | Big Data Analytics For Beg...Simplilearn
The presentation about Big Data Analytics will help you know why Big Data analytics is required, what is Big Data analytics, the lifecycle of Big Data analytics, types of Big Data analytics, tools used in Big Data analytics and few Big Data application domains. Also, we'll see a use case on how Spotify uses Big Data analytics. Big Data analytics is a process to extract meaningful insights from Big Data such as hidden patterns, unknown correlations, market trends, and customer preferences. One of the essential benefits of Big Data analytics is used for product development and innovations. Now, let us get started and understand Big Data Analytics in detail.
Below are explained in this Big Data analytics tutorial:
1. Why Big Data analytics?
2. What is Big Data analytics?
3. Lifecycle of Big Data analytics
4. Types of Big Data analytics
5. Tools used in Big Data analytics
6. Big Data application domains
What is this Big Data Hadoop training course about?
The Big Data Hadoop and Spark developer course have been designed to impart an in-depth knowledge of Big Data processing using Hadoop and Spark. The course is packed with real-life projects and case studies to be executed in the CloudLab.
What are the course objectives?
This course will enable you to:
1. Understand the different components of the Hadoop ecosystem such as Hadoop 2.7, Yarn, MapReduce, Pig, Hive, Impala, HBase, Sqoop, Flume, and Apache Spark
2. Understand Hadoop Distributed File System (HDFS) and YARN as well as their architecture, and learn how to work with them for storage and resource management
3. Understand MapReduce and its characteristics, and assimilate some advanced MapReduce concepts
4. Get an overview of Sqoop and Flume and describe how to ingest data using them
5. Create database and tables in Hive and Impala, understand HBase, and use Hive and Impala for partitioning
6. Understand different types of file formats, Avro Schema, using Arvo with Hive, and Sqoop and Schema evolution
7. Understand Flume, Flume architecture, sources, flume sinks, channels, and flume configurations
8. Understand HBase, its architecture, data storage, and working with HBase. You will also understand the difference between HBase and RDBMS
9. Gain a working knowledge of Pig and its components
10. Do functional programming in Spark
11. Understand resilient distribution datasets (RDD) in detail
12. Implement and build Spark applications
13. Gain an in-depth understanding of parallel processing in Spark and Spark RDD optimization techniques
14. Understand the common use-cases of Spark and the various interactive algorithms
15. Learn Spark SQL, creating, transforming, and querying Data frames
Learn more at https://www.simplilearn.com/big-data-and-analytics/big-data-and-hadoop-training
Big Data in Industry
Many believe that Big Data is a new asset which will help companies catapult others to become the best in class.
What is it about Big Data that is so appealing across industries? Simply, data is intertwined into every sector and function in the global economy and much of modern economic activity would not be able to take place without data.
Big Data relates to large meres of data which can be brought together and then analyzed to inform decision making and discern patterns. The insights which Big Data brings, will become the basis of competition and growth for companies worldwide through further enhancing productivity as well as generating significant value for the global economy by increasing the quality of goods and services.
Previous trends in IT investment and innovation such as cloud adoption and the impact of this on competitiveness and productivity can be mirrored by Big Data which serves as a crucial way for large companies to outperform their competition. Across industries, time-honored competitors and new entrants to the market will use data-driven strategies to compete, innovate and seize value. The knowledge that big data brings informs the creation of new services and the design of future products. In fact, some companies are using Big Data to conduct controlled experiments to inform better management decisions.
http://www.extentia.com/service/big-data
www.extentia.com/contact-us
Getting real-time analytics for devices/application/business monitoring from trillions of events and petabytes of data like companies Netflix, Uber, Alibaba, Paypal, Ebay, Metamarkets do.
Data Warehouse Process and Technology: Warehousing Strategy, Warehouse management and Support Processes.
Warehouse Planning and Implementation.
H/w and O.S. for Data Warehousing, C/Server Computing Model & Data Warehousing, Parallel Processors & Cluster Systems, Distributed DBMS implementations.
Warehousing Software, Warehouse Schema Design.
Data Extraction, Cleanup & Transformation Tools, Warehouse Metadata
,data warehouse process and technology: warehousing ,warehouse management and support processes. wareh ,c/server computing model & data warehousing ,parallel processors & cluster systems ,distributed dbms implementations. warehousing sof ,warehouse schema design. data extraction ,cleanup & transformation tools ,warehouse metadata
Now companies are in the middle of a renovation that forces them to be analytics-driven to
continue being competitive. Data analysis provides a complete insight about their business. It
also gives noteworthy advantages over their competitors. Analytics-driven insights compel
businesses to take action on service innovation, enhance client experience, detect irregularities in
process and provide extra time for product or service marketing. To work on analytics driven
activities, companies require to gather, analyse and store information from all possible sources.
Companies should bring appropriate tools and workflows in practice to analyse data rapidly and
unceasingly. They should obtain insight from data analysis result and make changes in their
business process and practice on the basis of gained result. It would help to be more agile than
their previous process and function.
Accenture Labs details a five-stage journey to data industrialization and unlocking new opportunities. Read more: https://www.accenture.com/us-en/insights/technology/data-industrialization
What is data analytics services? -ChainpulseChain Pulse
Chain Pulse delivers cutting-edge data analytics services, unraveling the power of information for businesses. Our expert team transforms raw data into actionable insights, guiding informed decision-making. From data collection to sophisticated analysis, we leverage advanced techniques to uncover hidden patterns and trends. Our commitment to precision and innovation empowers organizations to enhance efficiency, gain a competitive edge, and thrive in the dynamic landscape of data-driven decision-making. Trust Chain Pulse to unlock the full potential of your data, propelling your business towards unparalleled success.
BIG DATA has to be the hottest topic in the boardrooms of blue chip companies - organizations with access to vast amounts of data that promises to have a massive impact on their businesses... But if you're not Amazon, Google, Walmart and Tesco what does it mean to your business? What about MOTOR DEALERS for example?
Bigdata analysis in supply chain managmentKushal Shah
big data is larger, more complex data sets, especially from new data sources. These data sets are so voluminous that traditional data processing software just can’t manage them. But these massive volumes of data can be used to address business problems you wouldn’t have been able to tackle before.
supply chain industry need this type of data to survive in every situations.
Big Data is the lastest cashcow. Data Analytics has now a crucial role for industries. This article describes as to what is Big Data and Analytics and how a Chartered Accountant will be able to provide value in this field.
Certus Accelerate - Building the business case for why you need to invest in ...Certus Solutions
Becoming an analytically driven or cognitive business is a journey.
Businesses will be able to rapidly capitalize on new opportunities if they have invested in the foundations of their information management systems.
Data Analytics has become a powerful tool to drive corporates and businesses. check out this 6 Reasons to Use Data Analytics. Visit: https://www.raybiztech.com/blog/data-analytics/6-reasons-to-use-data-analytics
Techniques to optimize the pagerank algorithm usually fall in two categories. One is to try reducing the work per iteration, and the other is to try reducing the number of iterations. These goals are often at odds with one another. Skipping computation on vertices which have already converged has the potential to save iteration time. Skipping in-identical vertices, with the same in-links, helps reduce duplicate computations and thus could help reduce iteration time. Road networks often have chains which can be short-circuited before pagerank computation to improve performance. Final ranks of chain nodes can be easily calculated. This could reduce both the iteration time, and the number of iterations. If a graph has no dangling nodes, pagerank of each strongly connected component can be computed in topological order. This could help reduce the iteration time, no. of iterations, and also enable multi-iteration concurrency in pagerank computation. The combination of all of the above methods is the STICD algorithm. [sticd] For dynamic graphs, unchanged components whose ranks are unaffected can be skipped altogether.
Chatty Kathy - UNC Bootcamp Final Project Presentation - Final Version - 5.23...John Andrews
SlideShare Description for "Chatty Kathy - UNC Bootcamp Final Project Presentation"
Title: Chatty Kathy: Enhancing Physical Activity Among Older Adults
Description:
Discover how Chatty Kathy, an innovative project developed at the UNC Bootcamp, aims to tackle the challenge of low physical activity among older adults. Our AI-driven solution uses peer interaction to boost and sustain exercise levels, significantly improving health outcomes. This presentation covers our problem statement, the rationale behind Chatty Kathy, synthetic data and persona creation, model performance metrics, a visual demonstration of the project, and potential future developments. Join us for an insightful Q&A session to explore the potential of this groundbreaking project.
Project Team: Jay Requarth, Jana Avery, John Andrews, Dr. Dick Davis II, Nee Buntoum, Nam Yeongjin & Mat Nicholas
Adjusting primitives for graph : SHORT REPORT / NOTESSubhajit Sahu
Graph algorithms, like PageRank Compressed Sparse Row (CSR) is an adjacency-list based graph representation that is
Multiply with different modes (map)
1. Performance of sequential execution based vs OpenMP based vector multiply.
2. Comparing various launch configs for CUDA based vector multiply.
Sum with different storage types (reduce)
1. Performance of vector element sum using float vs bfloat16 as the storage type.
Sum with different modes (reduce)
1. Performance of sequential execution based vs OpenMP based vector element sum.
2. Performance of memcpy vs in-place based CUDA based vector element sum.
3. Comparing various launch configs for CUDA based vector element sum (memcpy).
4. Comparing various launch configs for CUDA based vector element sum (in-place).
Sum with in-place strategies of CUDA mode (reduce)
1. Comparing various launch configs for CUDA based vector element sum (in-place).
Levelwise PageRank with Loop-Based Dead End Handling Strategy : SHORT REPORT ...Subhajit Sahu
Abstract — Levelwise PageRank is an alternative method of PageRank computation which decomposes the input graph into a directed acyclic block-graph of strongly connected components, and processes them in topological order, one level at a time. This enables calculation for ranks in a distributed fashion without per-iteration communication, unlike the standard method where all vertices are processed in each iteration. It however comes with a precondition of the absence of dead ends in the input graph. Here, the native non-distributed performance of Levelwise PageRank was compared against Monolithic PageRank on a CPU as well as a GPU. To ensure a fair comparison, Monolithic PageRank was also performed on a graph where vertices were split by components. Results indicate that Levelwise PageRank is about as fast as Monolithic PageRank on the CPU, but quite a bit slower on the GPU. Slowdown on the GPU is likely caused by a large submission of small workloads, and expected to be non-issue when the computation is performed on massive graphs.
Big Data Analytics in the Food and Beverage Industry
1. HOW BIG DATA IS
TRANSFORMING THE FOOD
AND BEVERAGE INDUSTRY
2. Find new business insights by
combining data from
multiple outside streams.
TABLE OF CONTENTS
Introduction
What is Big Data?
Challenges with Data Today
When to Know if You Need Big Data Analytics?
How It Works
Benefits in the Food and Beverage Industry
Examples
Tool Box: Big Data Analytics Platforms
3. INTRODUCTION
In order to keep pace with consumers’
fickle buying habits, food and beverage
companies need to begin by gathering
all the different data streams into one
system. Analytical capabilities then can
transform this data into meaningful
intelligence that can inform
management decisions. Those
decisions will boost sales and improve
overall bottom-line performance.
5. BIG DATA ANALYTICS
REFERS TO THE
STRATEGY OF
ANALYZING LARGE
WHAT IS BIG DATA ANALYTICS
WHAT IS BIG DATA?
This big data is gathered from a wide
variety of streams, including
sensors,
devices,
networks,
videos,
digital images,
sensors,
sales transaction records.
The aim in analyzing all this data together
is to uncover patterns and connections that
might otherwise be invisible, and that
might provide valuable insights about the
users who created it. Through this insight,
businesses may be able to gain an edge
over their rivals and make superior
business decisions.
6. WHAT IS BIG DATA? VOLUME
How much data are you dealing with?
With big data, you’ll have to process high
volumes of low-density, unstructured data.
This can be data of unknown value, such
as your SENSOR-ENABLED EQUIPMENT.
1
VARIETY
If you are receiving data from multiple
sources, such as in your supply chain, then
this is considered high variety.
2
VELOCITY
How quickly is the data streaming in? This is
usually always the case for the foodservice
industry.
3
terabytes
petabytes
realtime or
near-realtime
social networks
blog posts
logs
sensors, etc.
VOLUME
VARIETY
VELOCITY
8. DIFFICULT TO FIND INSIGHTS
The huge volumes of raw, streaming data from all different sources
make it extremely difficult to pull out insights needed to become more
efficient.
9. BIG DATA CHALLENGES
“Data silos are the reason you have to number
crunch to produce a monthly sales report.
They’re the reason that C-level decisions are
made at a snail’s pace. They’re the reason your
sales and marketing teams simply don’t get
along. They’re the reason that your customers
are looking elsewhere to take their business
because they don’t feel
their needs are being met and a smaller, more
nimble company, is offering something
better, according to
B2C.com.
DATA SILOS
This is when an organization stores its
information in silos, whether in individual
departments, regional offices, different
channels and sometimes even in different
management levels within an organization
10. The data doesn't reside in a database. Documents, photos,
audio, videos and other unstructured data can be difficult to
search and analyze.
UNSTRUCTURED DATA
BIG DATA CHALLENGES
11. BIG DATA CHALLENGES
Social Media
Sensor Data
Temperature Data
Quantity Data
Warehouse Data
Tons more real-time data streams
STEMS FROM MULTIPLE
SOURCES
14. FROM RAW DATA TO OPERATIONAL
INSIGHTS
PRODUCTION LINE
DIGITAL MODEL
PREDICTIVE ANALYTICS
AUTOMATED ROOT - CAUSE ANALYSIS
SIMPLE & ACCURATE INSIGHTS
FOR OPERATION TEAMS
IMAGE COURTESY Seebo.com
15. HOW IT WORKS
INTEGRATE
Big data brings together data from many
disparate sources and applications.
Traditional data integration mechanisms, such as
ETL (extract, transform, and load) generally aren’t up
to the task.
It requires new strategies and technologies to
analyze big data sets at terabyte, or even petabyte,
scale.
During integration, you need to bring in the data,
process it, and make sure it’s formatted and
available in a form that your business analysts can
get started with.
16. HOW IT WORKS
MANAGE
Big data requires storage. Your storage
solution can be in the cloud, on premises,
or both. You can store your data in any
form you want and bring your desired
processing requirements and necessary
process engines to those data sets on an
on-demand basis. Many people choose
their storage solution according to where
their data is currently residing. The cloud is
gradually gaining popularity because it
supports your current compute
requirements and enables you to spin
up resources as needed.
17. HOW IT WORKS
ANALYZE
Your investment in big data pays off when
you analyze and act on your data. Get new
clarity with a visual analysis of your varied
data sets. Explore the data further to make
new discoveries. Build data models with
machine learning and artificial intelligence.
Put your data to work.
19. HOW BIG DATA ANALYTICS IS USED FOR THE FOOD
AND BEVERAGE INDUSTRY
collecting and analyzing sensor data such as vibration and temperature to monitor asset
health can significantly reduce machine downtime. This allows companies to identify and
fix potential component faults before the machine fails while maximizing the efficiency of
maintenance teams by allowing them to focus their time on degrading assets.
CONDITION MONITORING &
PREDICTIVE MAINTENANCE
collecting and analyzing data from the use of cameras, vision systems and other
inspection equipment can be used to monitor shape and color of produce to ensure
it meets standards while reducing food waste.
PRODUCT SORTING
By collecting information on food (including flavor compounds), and analyzing online
recipes has enabled artificial intelligence solutions to create new recipes and
combinations.
CREATING NEW RECIPES
Monitoring production line variables such as pressure, temperature and other metrics
of machine performance, and allow machines to adjust to required minimum weight
tolerances while ensuring minimum product weights are met.
IMPROVE MEASUREMENT
Combining machine vision with artificial intelligence can improve the quality and safety
of food to identify and remove sub-par or defective ingredients through the identification
of visual anomalies.
IMPROVE FOOD SAFETY
Through added sensing, operators can monitor the amount of food debris remaining
in the machine and optimize the cleaning process accordingly – reducing cleaning
time, energy and water consumption.
MACHINE CLEANING
20. HOW BIG DATA ANALYTICS IS USED FOR THE FOOD
AND BEVERAGE INDUSTRY
PREDICTIVE MAINTENANCE -
FORECASTING
Machine data is securely streamed from
equipment sensors to a central repository using
industrial data protocols and gateways. IoT
behavior analytics are applied to predict failures
before they arise.
Implementing predictive maintenance typically
starts with rule-based alerts until sufficient data
is collected, at which time machine-learning
algorithms can be applied to identify complex
behavior patterns and anomalies.
21. HOW BIG DATA ANALYTICS IS USED FOR THE FOOD
AND BEVERAGE INDUSTRY
IMPROVE
MEASUREMENTS
Monitor production line variables such
as pressure, temperature and other
metrics of machine performance, and allow
machines to adjust to required minimum
weight tolerances while ensuring minimum
product weights are met.
22. HOW BIG DATA ANALYTICS IS USED FOR THE FOOD
AND BEVERAGE INDUSTRY
PRODUCT
SORTING
Use of cameras, vision systems and other
inspection equipment can be used to
MONITOR SHAPE AND COLOR OF PRODUCE
to ensure it meets standards while reducing
food waste.
23. HOW BIG DATA ANALYTICS IS USED FOR THE FOOD
AND BEVERAGE INDUSTRY
IMPROVE FOOD
SAFETY
Combining machine vision with artificial intelligence can improve the
quality and safety of food to IDENTIFY AND REMOVE SUB-PAR OR
DEFECTIVE INGREDIENTS through the identification of visual
anomalies.
24. HOW BIG DATA ANALYTICS IS USED FOR THE FOOD
AND BEVERAGE INDUSTRY
CREATING NEW
RECIPES
By collecting information on food (including
flavor compounds), and analyzing online
recipes has enabled ARTIFICIAL
INTELLIGENCE SOLUTIONS TO CREATE
NEW RECIPES AND COMBINATIONS.
26. EXAMPLE
A Fortune 500 food supplier needed to contain its
growing expenses and educate its business units
on the hidden costs of workplace injuries. By analyzing
available data and partnering with outside experts,
the company was able to assess the situation, develop
incentive plans, and ultimately save more than
$500,000. A decision that may once have been based
on guesstimates was instead driven by metrics,
harnessing the power of data.
27. EXAMPLE
Ben and Jerry’s recognized the need for dairy-free ice
cream options and are capitalizing on this under-served
segment of the market with the release of seven
non-dairy flavors, much to the delight of vegan
and lactose intolerant ice cream lovers everywhere.
Listening to what your customers want will help you to
retain them and build customer loyalty, reducing the
risk of losing them to specialty brands or other
companies.
ACCORDING TO A QUANTZIG REPORT
30. SUMMARY
Food and Beverage Manufacturers use big data
analytics to identify patterns and relationships
among discrete process steps and inputs, and then
optimize the factors that improve Efficiency.
By using big data analytics on a growing flow
of real-time sensor and machine data,
manufacturers can improve yields, increase
quality and ship products on Schedule.
Manufacturers optimize supply chains and
logistics with big data analytics by analyzing
supplier and logistics tracking data with cost
and historical logistics data.
TAKEAWAY
By using big data-based tools to quantify their risk, food and beverage companies
are assigning values to the unknown, forecasting the extent of potential financial damage,
and assessing possible mitigation opportunities to manage their exposures. In short,
they’re using data and analytics to drive intelligent business decisions and change.
31. CHD Expert – Americas
130 S. Jefferson Street
Suite 250
Chicago, IL 60661
1-888-CHD-0154
CHD Expert – France
15 Rue Claude Tillier,
75012 Paris
+33 1 73 73 42 00
CHD Expert – EMEA &
Global Innovation Center
41 Montefiore St
6520112 Tel-Aviv
972 54-332-9690
www.chd-expert.com