Downloaded 25 times


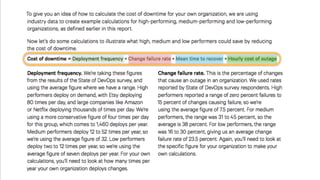


![DEPLOYMENT
FREQUENCY
How many times per year your own org
deploys changes1
High performers = 1,460/year
Low performers = 7/year
1
State of DevOps [2016] - Puppet labs.
37 — @jasonhand](https://image.slidesharecdn.com/beyondmttr-170526143900/85/Beyond-The-Mean-Time-To-Recover-37-320.jpg)

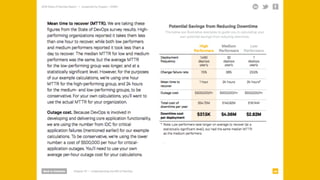


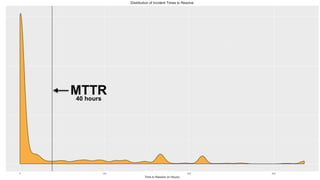


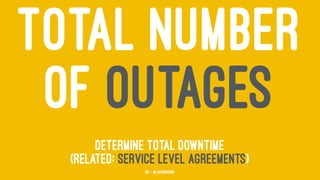


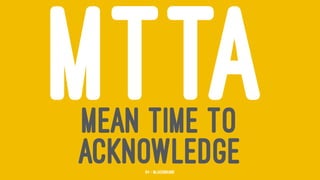
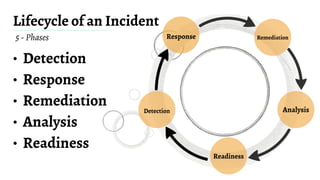
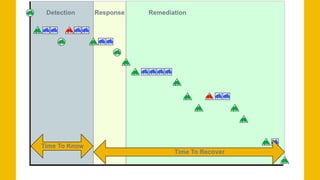


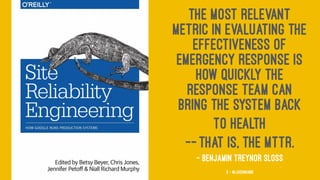
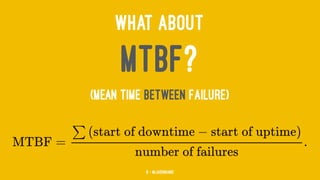
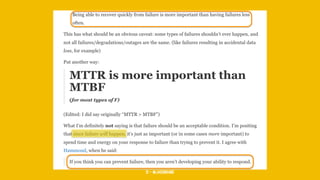
The document discusses Mean Time To Repair (MTTR) as an important metric for measuring how quickly teams respond to service disruptions, but notes that MTTR is simply an average and does not provide insight into the variability of individual incident response times. It argues that additional metrics are needed beyond MTTR to fully understand system reliability and incident response performance. These could include metrics like median response time, number of incidents, alert volumes and types, and time to acknowledge alerts. Taking a more holistic view of reliability data can help teams better identify areas for improvement compared to relying solely on MTTR.


