Download to read offline


![!
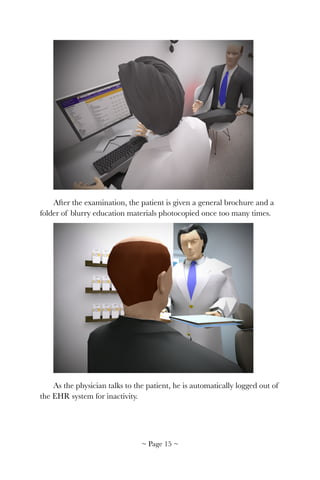
The usability, workflow, and cognitive support problems in this
scenario are barriers to EHR meaningful use. Although many of these
problems have been addressed by the EHR community, many others
remain and prevent optimal use of EHRs by physicians. A worldwide
2014 KLAS survey of healthcare physicians shows usability is the
number one criterion when choosing an EHR, with nearly 75% of the
responders reporting usability more important than any other criteria [1].
This book is a subset of work from SHARPC, an Office of the
National Coordinator for Health Information Technology funded project
focusing on patient-centered cognitive support issues of EHRs. SHARPC
is a sizable project ($15 million funding over a four-year period), yet it
only touches some of the usability, workflow, and cognitive support issues
of EHRs. We hope EHR designers, developers, implementers, users,
patients, and policy makers will find this book informative and useful.
~ Page ! ~17](https://image.slidesharecdn.com/betterehr-151223134030/85/Better-ehr-18-320.jpg)

![1: Cognitive Support for
Health Information
Technology
Jiajie Zhang, PhD
The University of Texas Health Science Center at Houston School of Biomedical Informatics
Muhammad F. Walji, PhD
The University of Texas Health Science Center at Houston School of Dentistry
ABSTRACT
This chapter provides an overview of the SHARPC project—how
SHARPC was started, conceptualized and funded, what goals it tried to
achieve, and how it approached patient-centered cognitive support
challenges. Research and products resulting from SHARPC are described
in following chapters.
INTRODUCTION
The Health Information Technology for Economic and Clinical
Health (HITECH) Act of 2009 provided $19 billion to support a multi-
pronged approach to increase nationwide adoption and meaningful use
of electronic health records by 2014. As part of the HITECH Act, four
centers were funded by the Office of the National Coordinator for
Health Information Technology (ONC) as Strategic Health IT Advanced
Research Projects (SHARP). The goal was to "address well-documented
problems that impede the adoption of health IT" [2]. Security and health
information technology problems (SHARPS) were addressed by the
University of Illinois at Urbana-Champaign. The University of Texas
Health Science at Houston (UTHealth) focused on patient-centered
cognitive support (SHARPC) issues. Better health care application and
network design (SMART) was studied by Harvard University. Work on
secondary use of electronic health record (EHR) information (SHARPN)
was undertaken by Mayo Clinic.
~ Page ! ~19](https://image.slidesharecdn.com/betterehr-151223134030/85/Better-ehr-20-320.jpg)
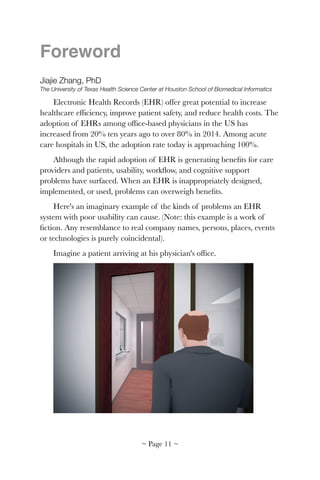
![APPROACH
SHARPC studied usability, workflow, and cognitive support issues of
health information technology (HIT). Work was performed through
UTHealth's National Center for Cognitive Informatics and Decision
Making in Healthcare (NCCD). NCCD is a collaborative center with key
investigators from eight institutions and consultants, and advisors from
other institutions, organizations and corporations across the country.
NCCD's vision is to become a national resource providing strategic
leadership in research and applications for patient-centered cognitive
support in healthcare. It's mission:
1. Bring together a collaborative, interdisciplinary team of researchers
across the nation with the highest level of expertise in patient-
centered cognitive support research from biomedical and health
informatics, cognitive science, computer science, clinical sciences,
industrial and systems engineering, and health services research.
2. Conduct short-term research that addresses the urgent usability,
workflow, and cognitive support issues of HIT as well as long-term,
breakthrough research that can fundamentally remove the key
cognitive barriers to HIT adoption and meaningful use.
3. Translate research findings to the real world through a cooperative
program involving researchers, patients, providers, HIT vendors,
and other stakeholders to maximize the benefits of HIT for care
quality, efficiency, and safety.
SHARPC considered "patient-centered cognitive support" to be HIT
specifically designed to support problem solving and decision making for
the highest quality of care as measured by the Institute of Medicine's
(IOM) six dimensions of quality (safe, effective, timely, efficient, equitable,
and patient-centered) [3]. SHARPC's characterization of cognitive
challenges for HIT adoption and meaningful use is shown in Figure 1.
~ Page ! ~20](https://image.slidesharecdn.com/betterehr-151223134030/85/Better-ehr-21-320.jpg)
![centered task performance [4]. HIT systems with poor cognitive support
often have disconnected, redundant, tedious, and unclear user models
based on billing and legal requirements, which can interfere with task
performance.
Cognitive Support Issues
Observations Consequences Opportunities
Patient records are
fragmented
• Computer and paper
records co-exist
• Computer records
divided among task-
specific transaction
processing systems
• Users have to know
where to look
• Synthesis depends on
intra-team conversation
• Problem recognition left to
chance
• Team members waste
time getting information in
the form they want to use
• Techniques to synthesize
and summarize
information about patient
in and across systems
with drill-downs for detail
• Mechanisms to focus on a
constellation of related
factors
Clinical user interfaces
mimic paper
• Flow sheet is
predominant display
• Font size is challenging
User interfaces do not
reflect human factors and
safety design
• Improperly structured
pull-down lists
• Inconsistent use of
location, symbol, and
color
• Important information and
trends are easily
overlooked
• Cognitive burden of
absorbing information
detracts from thinking
about what the
information means
• Systems intended to
reduce error but create
new errors
• Design reflecting human
and safety factors
• Automatic capture and
use of context
• Techniques to represent
and capture data at
multiple levels of
abstraction
Support for evidence-
based medicine and
computer-based advice is
rare
• Lost opportunity to
provide patient-specific
decision support
• Peer to peer techniques
for developing guidelines
and decision support
content
• Mass customization
techniques for practice
guidelines
~ Page ! ~22](https://image.slidesharecdn.com/betterehr-151223134030/85/Better-ehr-23-320.jpg)
![Table 3. ONC's six cognitive challenges and their mapping to SHARPC's five projects
These gaps result from multiple cognitive problems with HIT, as
identified in the 2009 National Research Council [5] (Table 1). SHARPC
was funded to address many of these cognitive problems. Under
SHARPC, five projects were developed, each focusing on a set of short
and long-term tools and methods to address major cognitive problems
(Table 2). Each cognitive problem was covered by more than one project
and each project covered more than one problem (Table 3). Collectively,
SHARPC's collaborative, interwoven, and integrative projects delivered a
suite of tools and methods to improve HIT cognitive support.
RESULTS
The tools and methods developed from SHARPC are described in
following chapters as high level summaries. Detailed list of tools,
methods, and other products can be found at SHARPC's website
www.sharpc.org.
ONC-Identified Six Cognitive Challenges
for Patient-Centered Cognitive Support
1 2A 2B 3 4
Creating models that support dynamic
abstraction of clinical information
X X X X
Techniques for parsimonious information
display that simplifies, while capturing
essential features of a clinical decision
problem
X X X
Understanding decision making under
stress and time pressure, and its
implications for cognitive support
X X
Communication to clinicians, addressing
message content and delivery, that
blends with workflow
X X X X
Methods to support decisions that
involve multiple stakeholders, taking into
account their preferences and utilities
X
Methods for minimizing and simplifying,
when it is necessary, manual data input
by clinicians
X X
~ Page ! ~24](https://image.slidesharecdn.com/betterehr-151223134030/85/Better-ehr-25-320.jpg)
![DISCUSSION
SHARPC elevated the awareness and importance of EHR usability
and patient-centered cognitive support. ONC added Safety-Enhanced
Design to the 2014 edition of "Health Information Technology:
Standards, Implementation Specifications, and Certification Criteria for
Electronic Health Record Technology" [6]. Test Procedure §170.314(g)(3)
for Safety-Enhanced Design was developed to emphasize the importance
EHR usability safety and includes eight use cases:
1. Computerized provider order entry (CPOE)
2. Drug and allergy interaction checks
3. Medication list
4. Medication allergy list
5. Clinical decision support
6. Electronic medication administration record (inpatient setting only)
7. Electronic prescribing (medication order entry), and
8. Clinical information reconciliation (patient problems, medications,
and allergies)
Including safety-enhanced design in EHR certification is a major step
toward improving EHR usability. However, much more needs to be done
to improve the usability, safety, workflow, and other cognitive issues of
EHRs. HIT usability is a key research and development topic requiring
systematic and sustained efforts by vendors, users, patients, researchers,
professional organizations, and federal agencies to achieve meaningful
outcomes.
~ Page ! ~25](https://image.slidesharecdn.com/betterehr-151223134030/85/Better-ehr-26-320.jpg)

![Foundations of Usability
While slow to be adopted in healthcare, usability principals are
common in other industries, including computer hardware and software
design. Computer usability is often described in vague terms, such as
"convenience," "ease-of-use," and "user friendliness." A more precise
definition is needed for EHRs, such as "how useful, usable and satisfying
a system is for its intended users to accomplish goals in a work domain by
performing certain sequences of tasks" [7].
Usefulness is a critical component of an EHR system, and it's a
quality that can be objectively analyzed and measured. SHARPC
developed the TURF EHR Usability Framework (Chapter 2) specifically
for this purpose.
Another key issue of EHR usability is balance. There's an inherent
challenge designing useful EHR systems that are both systematic and
flexible. SHARPC studied tradeoffs when users adapt to EHR systems
versus a system adapting to user needs. Chapter 3: The Systematic Yet
Flexible Systems Analysis (SYFSA) proposes how to determine an
appropriate mix.
~ Page ! ~27](https://image.slidesharecdn.com/betterehr-151223134030/85/Better-ehr-28-320.jpg)

![2: TURF Unified Framework
of EHR Usability
Jiajie Zhang, PhD
The University of Texas Health Science Center at Houston School of Biomedical Informatics
Muhammad F. Walji, PhD
The University of Texas Health Science Center at Houston School of Dentistry
ABSTRACT
We present a unified framework for evaluating electronic health
records system usability. TURF is a theory for describing, explaining and
predicting usability differences; an objective method for defining,
evaluating and measuring usability; a process for designing in good
usability; and a potential principle for developing EHR usability
guidelines and standards. TURF defines usability as how useful, usable,
and satisfying a system is for intended users to accomplish goals in a work
domain by performing sequences of tasks. TURF provides a set of
measures for useful, usable, and satisfying dimensions of usability. TURF
stands for Task, User, Representation, and Function, four components
that determine usability of an EHR system. These components are
described with theoretical descriptions and examples of how usability is
measured in several case studies.
How TURF can be used to improve usability through redesign is
also demonstrated. We conclude that usability can not only be defined
scientifically under a coherent, unified framework, but also objectively
and systematically measured.
INTRODUCTION
Electronic Health Records (EHR) systems have great potential to
increase care quality, efficiency and safety through wide adoption and
meaningful use [8-14], a major rationale behind the national HIT
Initiative started by President Bush in 2004 and strengthened by
President Obama in 2009. The $19 billion HITECH Act's goal under
the American Recovery and Reinvestment Act is for every American's
~ Page ! ~29](https://image.slidesharecdn.com/betterehr-151223134030/85/Better-ehr-30-320.jpg)
![medical records to be on computers by 2014. However, there are huge
gaps between the status quo and the potential of EHR, primarily due to
cognitive, financial, security/privacy, technological, social/cultural, and
workforce challenges [15-18]. The cognitive challenge is mainly
concerned with usability issues, which have not receive significant
attention in the EHR community until recently [5, 18-23]. Unlike many
other industries (e.g., aviation, nuclear power, automobile, consumer
software, and consumer electronics) where usability is the norm in
product design, the practice of usability in EHR has been sporadic,
unsystematic, casual and shallow, partly due to lack of sufficient attention
to usability and lack of EHR-specific usability frameworks and methods.
Designing and implementing an EHR system is not so much an IT
project as a human project about usability, workflow, patient safety and
organizational change [15, 18, 21, 24-26]. To facilitate adoption and
meaningful use of EHR, an EHR-specific usability framework is needed
to increase efficiency and productivity, increase ease of use and ease of
learning, increase user retention and satisfaction, decrease human errors,
decrease development time and cost, and decrease support and training
costs. We present here the initial form of a unified framework of EHR
usability, TURF, for: 1) describing, explaining, and predicting usability
differences; 2) defining, evaluating, and measuring usability objectively;
and 3) designing in good usability. Once fully developed, TURF could
also be used as a principle for developing EHR usability guidelines and
standards.
DEFINITION OF USABILITY
Under TURF, usability refers to how useful, usable and satisfying a
system is for its intended users to accomplish goals in a work domain by
performing certain sequences of tasks. Useful, usable, and satisfying are
the three major dimensions of usability under TURF (see Table 1).
~ Page ! ~30](https://image.slidesharecdn.com/betterehr-151223134030/85/Better-ehr-31-320.jpg)
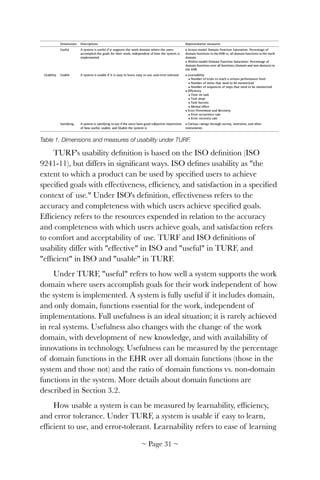
![when both are considered is usability evidence-based. Satisfaction alone
should never be used as the complete measure of EHR usability.
TURF considers usefulness a major dimension of usability because
TURF takes a work-centered approach [27-31]. Usefulness is also often
referred to as utility or functionality. Its importance in successful
applications is long acknowledged. For example, Landauer argued
successful applications should be not only usable, their functionality
should also be useful [32]. Goransson and colleagues [33] compiled a list
of applications that failed for lack of useful functionality, even though
they were usable. If the functionality or utility of an application is not
useful, whether it is usable or not is irrelevant. On the other hand, if
functionality is chosen effectively and usable, then even poor user
interfaces might be acceptable. Successful applications should be both
useful and usable, and they should be considered together because they
are not independent, as demonstrated by Butler et al. [27] who developed
a work-centered framework on how to allocate functionality across
machines and users. If a system does not have a desired function, users
may have to find a workaround that could complicate usableness of the
system. Thus, choice of functionality will not only determine how useful
a system is, but also how usable [34]. For this reason, under TURF,
usefulness (functionality or utility) is an integral component of usability.
TURF
The essence of usability is representation effect. Representation effect is
the phenomenon that different representations of a common abstract
structure (e.g., a work domain ontology, see Section 3.2.1 for details) can
generate dramatically different representational efficiencies, task
difficulties and behavioral outcomes [35-39]. Form of representation is so
important that it often determines what information can be perceived,
what processes are activated, what structures can be discovered, what
errors are generated, and what strategies are learned and adopted [40].
Usability differences between two products for the same work
domain, such as Arabic numerals vs. Roman numerals for calculation, or
DOS vs. Windows operating systems for computer tasks, are prototypical
examples of the representation effect. For EHR systems, whether one
EHR has better usability than another for a display, a module, or the
~ Page ! ~33](https://image.slidesharecdn.com/betterehr-151223134030/85/Better-ehr-34-320.jpg)
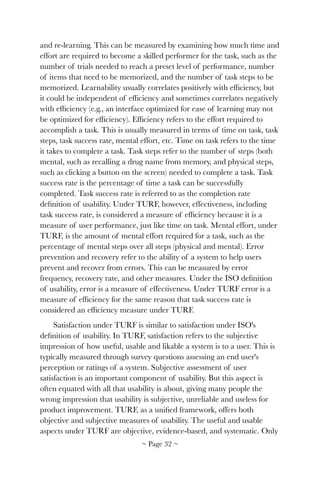
![Figure 1. The TURF framework of EHR usability. See text for details.
TURF is an expansion of the UFuRT framework developed earlier
in our research [28, 41, 42] and based on work-centered research [27, 28,
41, 43]. TURF is proposed as a framework for: 1) describing, explaining,
and predicting usability differences in terms of the representation effect;
2) defining, evaluating, and measuring usability objectively; 3) designing
built-in good usability; and 4) developing EHR usability guidelines and
standards. We focus here on the first three aspects. We are in the process
of developing a software application that implements a subset of TURF
features to partially automate usability evaluation processes, measure
usability along several metrics, and analyze usability and patient safety
patterns. In the future, we plan to use TURF to develop EHR usability
guidelines and standards.
3.1. User analysis
User analysis is the first step in applying TURF to the design and
evaluation of usability, providing user information to conduct function,
representation, and task analyses. User analysis is the process of
identifying types of users and their characteristics. For EHR, types of
users include physicians at various levels (e.g., attending, fellow, resident,
medical student, etc.) and in various specialty areas (family practice,
intensive care, dermatology, surgery, etc.), nurses with different
specializations, medical technicians, medical staff, patients and family
~ Page ! ~35](https://image.slidesharecdn.com/betterehr-151223134030/85/Better-ehr-36-320.jpg)
![members, and so on. User characteristics include experience and
knowledge of EHR, knowledge of computers, education background,
cognitive capacities and limitations, perceptual variations, age-related
skills, cultural background, personality, etc. User analysis can help design
systems that have the right knowledge and information structure that
match its users. There are many established methods for user analysis
(e.g., [44]), which we will not duplicate here.
3.2. Function analysis
3.2.1. Work domain ontology
Function analysis is the process of identifying a work domain's
abstract structure: its ontology [27, 31]. Ontology is the basic structure of
the work a system and its human users performs. It is an explicit,
abstract, implementation-independent description of the work,
describing essential requirements independent of technology systems,
strategies, or work procedures. Work domain ontology describes the
inherent complexity of the work, separates work context (physical, social,
organizational, etc.) from the inherent nature of the work. It also
supports identification of overhead activities non-essential for the work
but introduced due to the way the system is implemented. Work domain
ontology is inherent to the work's context, application technology, and
cognitive mechanisms. If the system does not support the ontology of the
work, the system will fail, regardless of a large collection of functions,
fancy and cutting-edge features, and purely technical merits.
Work domain ontology has four components: goals, objects,
operations, and constraints. Operations are performed on objects under
constraints to achieve goals. Consider the following example: Dr.
Townshend prescribes a 90-day supply of Metformin 500 mg tablets by
mouth twice daily to patient John Joe, who is pre-diabetic with a glucose
level of 110. In this example, the goal is "treating high glucose level in a
pre-diabetic patient." The operation is "writing a medication prescription."
The objects for this operation include the patient's name, doctor's name,
diagnosis, medication name, dosage, frequency, duration, route, etc.
Constraints include dependency relations between operation and objects
(e.g., the operation "write a medication prescription" and objects
"Metformin" and "500 mg"), between objects (e.g., "glucose level" and
~ Page ! ~36](https://image.slidesharecdn.com/betterehr-151223134030/85/Better-ehr-37-320.jpg)
![three models as part of her doctoral dissertation [45]. She described
function discrepancy as seven areas in the Venn diagram of Figure 2.
Figure 2. A conceptual model of function discrepancies [45].
~ Page ! ~38](https://image.slidesharecdn.com/betterehr-151223134030/85/Better-ehr-39-320.jpg)
![Figure 3. The left Venn diagram of an Electronic Dental Records system shows the number of
functions in each area defined in Figure 2. The right Venn diagram shows the percentage of
functions in each area on the left included in the work domain ontology (defined by the set of
functions rated 3 or above for usefulness and criticality on a 1–5 Likert scale by users) [45].
The left side of Figure 3 shows the number of functions in each area
of the Designer, User, and Activity Models of a small Electronic Dental
Records (EDR) system. The Designer Model has 60 functions and was
obtained through a complete system walkthrough. The User Model has
80 functions and was developed by conducting interviews and surveys
with end users. The Activity Model has 97 functions and was developed
by doing a field study involving many sessions of shadowing and
observation (for details, see [45] of the end users in the clinics. The
Activity Model includes 23 clinical functions (e.g., injecting medication)
that were not directly relevant for the EDR. Functions in the three
models were matched and merged into 190 functions in an Integrated
Model (167, excluding the 23 clinical functions) and given in a survey to
end users who rated each function on a 1-to-5 Likert scale for usefulness
and criticality. Eighty functions received an average rating of 3 or above
for both usefulness and criticality (see the right side of Figure 3),
operationally defined as domain functions—functions in the work
~ Page ! ~39](https://image.slidesharecdn.com/betterehr-151223134030/85/Better-ehr-40-320.jpg)
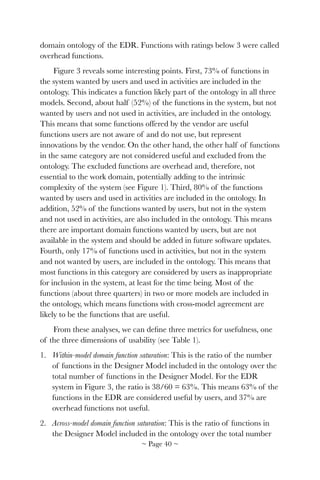
![of functions in all three models (Designer, User, and Activity Models)
included in the ontology. For the system in Figure 3, the ratio is
38/80 = 48%. This means the EDR system implemented about 48%
of all domain functions considered useful by users.
3. Across-model function saturation: This is the ratio of all functions in the
Designer Model over the total number of functions in all three
models (Designer, User, and Activity Models). For the system in
Figure 3, the ratio is 60/190 = 32%. This ratio means the EDR
system implemented about 32% of all functions proposed by its
designers, wanted by users, and used in activities. This ratio does not
exclude non-domain (overhead) functions in the three models
considered not useful by users. This ratio is similar to the second one,
although is not as direct a measure of usefulness. The advantage of
this third ratio is that it does not require the additional work of
integrating the functions of all three models and conducting a survey
among users to determine which functions should be included in the
ontology.
There are a few points about these usefulness metrics that warrant
further discussion. First, function saturations in the User and Activity
models are empirical data collected from interviewing, surveying, and
observing users. Second, whether a function is useful is determined by
two ratings on 1 to 5 Likert scales by users: usefulness of the function and
criticality of the function. The threshold for inclusion as a domain
function in the work domain ontology in Chen's study [45] is the
midpoint of 3 on the scale. This threshold can be adjusted to either
exclude more functions, or include more functions into domain functions.
In addition, the threshold could be based on either the usefulness or the
criticality measure alone, or it could be based on additional measures
depending on purpose of the evaluation.
3.2.3. Domain vs. overhead functions through expert review
In the last section we discussed the relationship of functions in the
three models: functions available in an EHR system, functions wanted by
users, and functions actually used in real activities. The method used to
conduct the analysis described in the previous section is based on
empirical data, usually requiring significant effort and resources. In the
next section, we focus on the functions in the Designer Model only and
~ Page ! ~41](https://image.slidesharecdn.com/betterehr-151223134030/85/Better-ehr-42-320.jpg)
![describe a relatively more efficient expert review method developed
evaluating the Armed Forces Health Longitudinal Technology
Application (AHLTA) EHR system [46].
The method started with identification of the hierarchy of the EHR
system. System hierarchy was created by visually inspecting user interface
items from top to bottom and left to right. Each interface item (label,
field, drop-down menu etc.) was coded with a unique identifier, such as
2.3.1 for the first item on Level 3 of the third item on Level 2 of the
second item on Level 1. AHLTA has six levels and almost two thousand
items. The first three levels of the AHLTA system hierarchy are shown in
Figure 4.
Each interface item was classified as an Object or Operation (i.e.,
function). An object was defined as an interface item on which no user
actions could be performed. An operation was defined as an interface
item on which a user action could be performed. Each operation was
further classified as either a Domain Function or Overhead Function. A
domain function was an operation inherent in and necessary for the work
domain rather than dependent on artifacts or interfaces. An overhead
function was an operation introduced to deal with specific
implementations of user interface rather than the work domain. Figure 5
shows that among 1,996 interface items identified in the AHLTA
hierarchy, 61% were Operations and 39% as Objects (kappa > 0.6 for
inter-rater reliability between the two evaluators). Of 1,218 items
classified as Operations, 76% were identified as Domain functions and
24% as Overhead functions (kappa > 0.6 for inter-rater reliability
between the two evaluators).
From this study we can obtain usefulness metrics in a more efficient
manner: percentage of domain functions in the Designer Model over all
functions in the Designer Model through expert review. In Section 3.2.2,
percentage was obtained through an empirical data collection process.
From the AHLTA study, percentage was obtained through assessment by
two expert evaluators. Although the process still requires significant
effort, it is more efficient than a method using empirical data collection.
From this expert review process, the usefulness metric for the AHLTA
EHR as defined by the percentage of domain functions in the Designer
Model over all functions in the Designer Model was 76%. Detailed
~ Page ! ~42](https://image.slidesharecdn.com/betterehr-151223134030/85/Better-ehr-43-320.jpg)
![results are shown in Figure 6, which shows that most functions in the
"summary" subsection are overhead functions and not useful, whereas
most functions in the "readiness" subsection are useful domain functions.
Figure 4. Visualization of the top three levels of the six-level hierarchy AHLTA user interface
[46].
Figure 5. Among 1,996 interface items in the AHLTA EHR system, 39% were objects and 61%
operations. Out of the 1,218 operations, 76% were domain functions and 24% overhead
functions [46].
~ Page ! ~43](https://image.slidesharecdn.com/betterehr-151223134030/85/Better-ehr-44-320.jpg)
![!
Figure 6. Percentage of domain vs. overhead functions in each of the subsections of the
AHLTA patient record section [46].
3.3. Representation analysis
Representation analysis is the process of evaluating the
appropriateness of representations for a given task performed by a
specific type of user such that interaction between users and systems is in
a direct interaction mode [47]. Representation analysis is based on the
representation effect described in Section 3 [35, 36, 38, 39, 43]. Different
representations of a common abstract structure can generate
dramatically different representational efficiencies, task difficulties, and
behavioral outcomes. A major type of representation analysis is a
comparison of a representation with isomorphic representations of the
same structure and determination of whether it is efficient for the task
and the user. This is described in Section 3.3.1. Another representation
analysis is based on the affordance of interface items, which is described
in Section 3.3.2. Expert review of usability violations against well
established principles includes various types of representation analyses,
and described in Section 3.3.3. There are many other types of
representation analyses, some of which are being developed and
evaluated in our EHR Usability Lab at the National Center for Cognitive
Informatics and Decision Making in Healthcare (NCCD).
~ Page ! ~44](https://image.slidesharecdn.com/betterehr-151223134030/85/Better-ehr-45-320.jpg)
![3.3.1. Isomorphic representations
Identifying and generating isomorphic (functionally equivalent, but
computationally different) representations is a major type of
representation analysis. Work domain ontology is a common abstract
structure that can be implemented many ways. For example, for the
function "write medication prescription," it can be represented in a
paper-and-pencil format, in a telephone call to the pharmacy, or a task
on computer in an EHR. Each representation has different consequences
for user performance. There is no best representation of a function for all
tasks for all users. However, an efficient representation, or a set of
efficient representations of a given function, can often be identified for a
specific task for a specific user under specific constraints. In this section,
we describe a previous study of relational information displays [38] to
demonstrate how to use isomorphic representation as a representation
analysis. Relational information displays are a significant category of
displays in EHR systems.
Figure 7 shows the representation taxonomy of relational
information displays, displays that represent relations such as tabular and
graphic displays [38]. The taxonomy is a hierarchical structure. At the
level of dimensionality, different relational information displays can have
different numbers of dimensions, e.g., 2-D, 3-D, 4-D, etc. At the level of
scale types, dimensions of a relational information display can have
different scale types: ratio (R, such as length), interval (I, such as time),
ordinal (O, such as ranking of movies by number of stars), and nominal
(N, such as names of people) scales. At the level of dimensional
representation, each scale type can be implemented by different physical
dimensions. In Figure 7, for example, ratio scale is represented by length,
distance, and angle; interval scale by position and orientation; ordinal
scale by cell position; and nominal scale by shape, direction, texture, and
position. With these physical dimensions, the scale combination R–R can
be represented by length–length (Rectangle, Cross), length–angle
(Coxcomb, Polar Plot), distance–distance (Line Graph, Cartesian Plot),
and so on. The scale combination R–I can be represented by length–
position (histogram), length–orientation (glyph, polygon), distance–
position, and so on. The scale combination R–N can be represented by
length–position (segmented and vertical bar charts), length–direction,
angle–direction (pie chart), and so on. The scale combinations O–O–N
~ Page ! ~45](https://image.slidesharecdn.com/betterehr-151223134030/85/Better-ehr-46-320.jpg)
![can be represented by CellPosition–CellPosition–shape (table, matrix),
position–position–texture (network), and so on.
Figure 7. A representation taxonomy of relational information displays [38].
This taxonomy of relational information displays can be used for two
types of representation analysis for EHR. The first is to analyze the
dimensions of component displays (e.g., a flow sheet table in an EHR
system) and evaluate whether each dimension in the display is
appropriately represented according to the taxonomy. The second
analysis is using the taxonomy to generate new designs. Once dimensions
of data are given (e.g., various vital signs), isomorphic displays for the
data can be systematically generated by using the taxonomy to match the
scale types of the dimensions. Because displays in the taxonomy are
optimized for user performance, displays with good usability can be
generated for the design of the EHR.
Relational information displays are only part of EHR user interfaces.
Other EHR user interfaces are more granular or more abstract than
relational information displays. Developing a comprehensive library of
EHR user interface representations along with mappings to tasks and
users is an ongoing effort in the NCCD EHR Usability Lab.
3.3.2. Affordance of interface items
Affordance is a concept developed by Gibson [48, 49] in the study of
visual perception. For user interfaces, affordance is a set of allowable
~ Page ! ~46](https://image.slidesharecdn.com/betterehr-151223134030/85/Better-ehr-47-320.jpg)
![actions specified by the display coupled with knowledge of the user [50,
51] and indicates the ability to perform user actions. For example, a well-
designed button on the display affords clicking. A hyperlink embedded in
text without any visual cues (e.g., underlined blue text or a distinct color),
even if it supports clicking, does not afford the action because the user
cannot perceive it through its visual cues.
In our evaluation of the AHLTA interface, we determined the degree
of affordance for each operation in a module. Two evaluators
independently analyzed each operation and determined degree of
affordance. Any discrepancies in ratings were resolved by consensus after
further discussion. Operations were rated as follows:
1. High affordance: Operation can be perceived by using external cues in
the interface.
2. Medium affordance: Operation can be perceived by external cues in the
interface and internal knowledge of the application.
3. Low affordance: Operation can be perceived mainly by using internal
knowledge of the application.
Table 2. Degrees of affordance in an AHLTA EHR module.
The results (Table 2) suggest operations in the AHLTA interface have
a high degree of affordance and can be perceived using external cues.
Only a few operations required internal memory, suggesting the interface
items in AHLTA are well designed and that users can easily perceive
what actions can be performed using the interface.
We plan to extend our representation analysis to classify degree of
correct or incorrect mappings between AHLTA displays and specific
~ Page ! ~47](https://image.slidesharecdn.com/betterehr-151223134030/85/Better-ehr-48-320.jpg)
![tasks. Ideally, information perceivable from a display should exactly
match information required for the task—no more and no less. In other
words, tasks assigned to a display should be the tasks afforded by the
external representations of the display. Likewise, displays assigned to a
task should be the displays whose external representations support the
task [51].
3.3.3. Representation analysis through expert review of usability
principles
Expert review of violations against well-established usability
principles, often called heuristic evaluation [52-55], is a large portion of
representation analysis. Heuristic evaluation is an easy-to-use, easy-to-
learn, discount usability evaluation technique for identifying usability
problems of a product in a timely manner with reasonable cost. The
technique requires a few evaluators to independently apply a set of
usability principles to a product, identify violations of principles, and
assess severity of each violation. In an early project, we integrated,
revised, and expanded the ten heuristics by Nielsen [54] and the eight
golden rules by Shneiderman [56] to form 14 principles customized for
the health domain [57]. We since applied these fourteen principles to a
variety of healthcare domains [57-60].
The 14 principles:
1. [Consistency] Consistency and standards in design.
2. [Visibility] Visibility of system state.
3. [Match] Match between system and world.
4. [Minimalist] Minimalist design.
5. [Memory] Minimize memory load.
6. [Feedback] Informative feedback.
7. [Flexibility] Flexibility and customizability.
8. [Message] Good error messages.
9. [Error] Prevent use errors.
10. [Closure] Clear closure.
11. [Undo] Reversible actions.
~ Page ! ~48](https://image.slidesharecdn.com/betterehr-151223134030/85/Better-ehr-49-320.jpg)
![12. [Language] Use users' language.
13. [Control] Users are in control.
14. [Document] Help and documentation.
The first six (Consistency, Visibility, Match, Minimalist, Memory, and
Feedback) concern representation properties of user interfaces and are
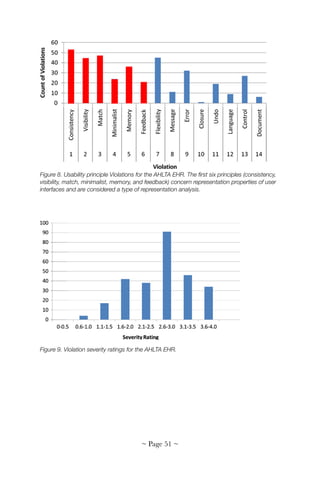
considered a type of representation analysis. Figure 8 shows the
evaluation of the AHLTA EHR with the 14 principles. Evaluation was
performed by three independent evaluators and results integrated into a
master list of all violations. Then, each evaluator independently rated
each violation for severity on a scale of 1 to 4 (1 = cosmetic; 2 = minor; 3
= major; 4 = catastrophic). Ratings were averaged as shown in Figure 9.
Figure 10 shows detailed results of where violations occurred in the
Health History module of the AHTLA. Violations were documented in
detail and recommendations for generated.
Representation analysis through expert review of usability principles
is an efficient method capable of a large range of usability violations. It
usually generates informative results for users and designers. However, as
it currently stands, it is not a well-organized, systematic method that can
generate consistent and reliable results for comparison of different
representations. An ongoing effort at the NCCD EHR Usability Lab is
developing and validating a reliable, systematic, and operationalized
process for a subset of usability principles relevant to representations.
3.4. Task analysis
Task analysis is loosely defined in the literature [61, 62]. For EHR
usability, we define task analysis as the process of identifying steps needed
to carry out an operation using a specific representation, relationships
among these steps, and the nature of each step. Our definition of task
analysis is based on the GOMS approach [63, 64]. An important point
about cognitive task analysis is that steps include not only physical steps
but also mental steps. By considering mental steps, we identify cognitive
factors that make a task easy or difficult [43, 65]. Steps needed to carry
out the same operation are different with different representations (e.g.,
using a bar chart vs. using a spreadsheet to find the highest glucose level
of a patient over three years). An important objective of task analysis is
finding which representation is best suited for each task, why it is better,
~ Page ! ~49](https://image.slidesharecdn.com/betterehr-151223134030/85/Better-ehr-50-320.jpg)
![and how to generate a better representation. By performing task analyses
for the same operation implemented in different user interfaces, we can
compare user performance associated with different user interfaces in
terms of time on task, number of steps and mental effort, all of which
are metrics of efficiency for usability (see Table 1).
We conducted a series of task analyses for many EHR systems. In the
following, we describe a task analysis study for the AHLTA EHR system
[66]. We used the Keystroke Level Modeling (KLM) to estimate time on
task, task steps, and mental effort for fourteen prototypical use cases.
KLM is a well-established and validated method that estimates
performance level by experts [63, 67]. Over one hundred research
publications have shown performance levels generated by KLM are
within 20% of expert performance through empirical studies [63, 68].
The 14 use cases, provided to us by expert AHLTA clinician users, were:
1. Enter HPI (History of Present illness)
2. Enter PMI (Present Medical Illness)
3. Document social history
4. Document family history
5. Enter vital signs
6. Enter order consult
7. Document coding of procedures
8. Entering the lab order
9. Document Instructions—Other Therapies
10. Order radiology study
11. Document comments in A/P diagnosis
12. Review coding of medical encounter
13. Document follow-up plan
14. Associate orders/medication/labs
~ Page ! ~50](https://image.slidesharecdn.com/betterehr-151223134030/85/Better-ehr-51-320.jpg)
![!
Figure 10. Violations of usability principles in the Health History module of the AHLTA EHR
showing most of violations are in the current encounter section.
Figure 11 shows the KLM analysis of the 14 use cases. Each case was
rated by two evaluators. Inter-rater reliabilities were good for all 14 use
cases (kappa > 0.6 for all use cases). The number of steps varied from as
few as 43 for Use Case 9 (Document Instructions – Other Therapies) to
as many as 466 for Use Case 5 (Enter Vital Signs). Time on task shows
similar patterns: 34 steps for Use Case 12 (Review Coding of Medical
Encounter) and 389 steps for Use Case 5 (Enter Vital Signs). On average,
37% of task steps were mental and 50% of the time was spent on mental
steps.
Figure 11. The left panel shows the number of task steps needed for each of the 14 use
cases. The right panel shows time on task (from [66]).
In the AHLTA study, three metrics for efficiency measure of usability,
time on task, task steps, and mental effort were estimated using KLM
modeling (Table 1). These are expert performance levels following
optimal paths of tasks, providing a set of benchmarks for EHR usability.
Performance levels by actual users in real clinical environments will be
~ Page ! ~52](https://image.slidesharecdn.com/betterehr-151223134030/85/Better-ehr-53-320.jpg)
![different from estimated expert performance levels with metrics collected
through more effortful user testing.
Although KLM is an excellent method for estimating expert
performance levels, it is not a straightforward or efficient process for
controlling inter-rater reliabilities. To address this issue, we adopted the
CogTool [68] method for usability evaluation of EHR systems. CogTool is
based on KLM but incorporates the Act-R model of human cognition
[69, 70]. CogTool increased the accuracy of KLM and has been reported
to be within about 10% of empirical data [71]. In addition to better
accuracy, CogTool does not require two evaluators to achieve significant
inter-rater reliability because estimates of performance levels are carried
by the model itself. Thus, CogTool provides more accurate, more reliable,
and more objective estimates of expert performance levels on skilled
tasks.
3.5. TURF in redesign of EHR user interface
TURF is not only a framework for evaluating the usability of existing
EHRs, it is also a method for redesigning EHRs for better usability. In a
small demonstration project [72], we applied TURF to evaluate the
usability of a module of the OpenVista EHR for NIST Test Procedure
§170.302(e): Maintain Active Medication Allergy List with three subtasks
(Add, Modify, and Review Allergy). We performed user, function,
representation, and task analyses; identified usability problems; developed
new design mockups; and then compared the original product and a new
design using KLM and function analysis. Figure 12 shows the results of
the KLM task analysis: dramatic improvements to both time on task and
task steps: 187 total steps in the original product to 79 total steps for a
new design; 199 seconds for the original product to 82 seconds for the
new design. The biggest improvement was for the Modify Allergy
subtask, with improvement from 91 to 14 steps and 97 to 10 seconds.
Function analysis showed similar patterns. Overhead functions reduced
from 99 in the original design to 19 in the new design. Domain functions
increased from 28 in the original to 53 in the new design.
~ Page ! ~53](https://image.slidesharecdn.com/betterehr-151223134030/85/Better-ehr-54-320.jpg)
![Figure 12. Improvements for time on task and task steps after the redesign of an OpenVista
module: 187 total steps from the original product to 79 total steps for the new prototype
design, and 199 seconds in the original product to 82 seconds in a new prototype design
(from [72]).
3.6. Environmental factors and workflow for usability
So far we have presented TURF and case studies for idealized,
uninterrupted EHR tasks by individual users. EHR systems, like many
products, are used in real world settings typically interruption-laden,
unpredictable, stressful, and involving many other factors, such as
organizational, social, physical, spatial, temporal, financial, and historical
influences. All of these can contribute to the representation effect in
various ways and should always be considered in the design and
evaluation of EHR usability.
For example, interruption and multitasking are routine in real clinical
settings [73-75] and can cause medical errors [76]. A measure of an
EHR's ability to handle interruptions and multitasking should be
included as part of usability. Workflow across multiple people and
artifacts is a major usability factor that we have not discussed under
TURF; we only discussed task sequences within a task performed by an
individual user. NCCD has developed a framework and software
modeling tool for capturing, analyzing, and predicting workflow across
team members in healthcare settings [77] (Chapter 11). The match
between information flow and workflow is a key principle of usability for
user tasks [78]. If the structure of an EHR does not match the workflow
of clinical work, then its users have to perform additional overhead tasks
to work around, or follow a sub-optimal workflow [79]. In the future, we
~ Page ! ~54](https://image.slidesharecdn.com/betterehr-151223134030/85/Better-ehr-55-320.jpg)

![of SYFSA for the analysis of a simplified central line insertion task. We
also describe several information theoretic measures of flexibility that can
be used to compare alternative designs, measure how efficiently a system
supports a given task, relative cognitive workload, and learnability.
INTRODUCTION
Efforts to improve healthcare quality have led to an increased push to
develop and adopt systems that enforce or encourage consistent processes
based on best practices and evidence-based medicine. These efforts
follow similar successful practices in other safety-critical industries, such
as aviation and nuclear power. Within healthcare, these efforts include
clinical guidelines, structured documentation, standardized
terminologies, decision support systems, checklists, and policies.
Although systems that enforce or encourage consistency can improve
safety and efficiency, healthcare is filled with complexity, variations, and
exceptions not easily captured by idealized processes. Systems too rigid to
support deviations can lead to decreases in quality, caregiver resistance
and creative workarounds that lessen the positive effects of best practices
[80].
Hollnagel's efficiency-thoroughness tradeoff (ETTO) principle is an
informal way to express the tradeoff between systematicity and flexibility
[81]. Recognition of similar tradeoffs in other industries led to the design
of Systematic Yet Flexible (SYF) systems [82] in which the system supports
and sometimes enforces a systematic approach, while allowing flexibility.
Thimbleby [83] argued that user interfaces are easier to use when they
are "permissive" (i.e., giving users flexibility and, hence, lowering learning
costs), but this is an informal treatment. Norman [84] emphasizes the
role of design constraints and forcing functions in user interfaces, but not
how to design the appropriate blend.
Although there are general design goals for SYF systems [82], there
are no analytic frameworks that allow one to analyze tradeoffs and
determine the appropriate blend of systematicity and flexibility. Without
analytic frameworks, organizations (or system developers) will inevitably
make arbitrary, sometimes sub-optimal, design choices. The usual
response is to require iterative design, a period of repeated
~ Page ! ~58](https://image.slidesharecdn.com/betterehr-151223134030/85/Better-ehr-59-320.jpg)
![SYFSA is a design and analysis framework, not a set of prescriptive
guidelines or principles for producing SYF systems. Prescriptive
guidelines give explicit design advice, but usually at a high level of
abstraction that leaves considerable details underspecified. For instance,
one of Perer and Shneiderman's guidelines for SYF systems that we
discuss below is to allow the user to "See an overview of the sequential
process of actions," [82] but the guideline does not help designers decide
which of many possible sequences to highlight. In contrast, SYFSA's
primary value as a design and analysis framework is to allow stakeholders
to explore tradeoffs in systematicity and flexibility by making constraints
(and lack of constraints) on actions and sequences of actions an explicit
part of the design and evaluation process. SYFSA forces designers and
others involved in the design or evaluation process to think about the
constraints in each of the spaces and whether a specific system design
supports those constraints. It is then up to the designer to use the results
of the analysis to inform system design. Returning to Perer and
Shneiderman's example, SYFSA can help designers decide which
sequence of actions to highlight.
We also propose three quantitative, information-theoretic measures
of task flexibility that allow designers to compare the flexibility of
alternative system designs and how closely these designs match the
idealized flexibility required to complete a task. These measures are
motivated by an intuitive notion of flexibility, whereby a task that can be
done by carrying out actions in any order has maximum flexibility and a
task that can only be done with a specific sequence of actions has the
least flexibility.
BACKGROUND
Flexibility characteristics
The concept of system or process flexibility has been explored for at
least 30 years in a number of fields, including chemical process
engineering [85], manufacturing design [86, 87] and more recently
business process design and workflow automation systems [88-91]. A
general consensus is that flexibility is a multidimensional concept, where
relevant dimensions depend on the kind of process or system being
analyzed and the analyst's goals. For example, Sethi and Sethi [86]
~ Page ! ~60](https://image.slidesharecdn.com/betterehr-151223134030/85/Better-ehr-61-320.jpg)
![identified 11 different, but complementary, definitions of manufacturing
flexibility, including production flexibility (the range of products a system
can produce without need for major changes) and operation flexibility
(the ability for a system to produce a product in different ways).
Despite the lack of a single, precise definition of flexibility, or even a
fixed set of dimensions, there is general consensus that flexibility is the
ability of a system to tolerate and adjust to variations in operating
conditions. One common distinction is between short-term and long-
term flexibility, where short-term flexibility is the ability to tolerate
variations without changing the goal, whereas long-term flexibility is the
ease with which a system can be changed to meet new goals. An example
of short-term flexibility is the ability of an automotive manufacturing
process to adjust to a part substitution. In contrast, long-term flexibility
refers to the ease of changing the assembly line to manufacture a
different vehicle.
There are often tradeoffs between different dimensions. For example,
a multipurpose woodworking machine that acts as a router, planer,
jointer, and table saw has a lot of functional flexibility, but because it
takes time to convert from one function to another and can only perform
one function at a time, a shop with a multipurpose machine loses
scheduling flexibility over a shop with a dedicated machine for each
function. In addition, dedicated machines often perform better (e.g., with
more precision or speed) than multipurpose ones.
Some researchers argue the general definition of flexibility, with its
emphasis on adapting to and tolerating variation, implies there are
invariants meant to be maintained by flexible systems [92]. This implies a
flexible system must be resistant to change in the same way that airplane
wings must flex, but still return to their original positions. Some of the
more formal definitions and approaches to measuring flexibility
operationalize this concept by defining a range of operation a system
must maintain in the face of variation. Flexibility is then the amount of
variation that can be tolerated while maintaining operation in the desired
range [85]. For example, a chemical process that works only when
ambient temperature varies by no more than 5° is less flexible than one
that works within a wider temperature range.
~ Page ! ~61](https://image.slidesharecdn.com/betterehr-151223134030/85/Better-ehr-62-320.jpg)
![The multidimensional nature of flexibility means there are also
different measures of flexibility. In a review of flexibility concepts and
measures Gupta and Goyal [93] identified six different classes of
measures and then further subdivided these into qualitative and
quantitative measures. In chemical process design, researchers have
developed a flexibility index—a single number that defines the maximum
variation in a set of normalized variables that the system can tolerate
while still producing the desired output.
Flexibility in healthcare
Healthcare system flexibility, including organizational and health
information technology, is perhaps most similar to business process
flexibility. Researchers exploring business process flexibility have
discussed measures such as the number of possible initial states of a
system, the number of reachable goal states, and the number of paths
from some initial state to the goal states. Bider has applied mathematical
systems theory to business processes [91]. However, research on business
process flexibility is less mature than other domains, so the conceptual
and analytical frameworks are not as well developed.
Like many industries, healthcare experienced a push to adopt and
enforce consistent procedures based on best practices and evidence.
While such systems can improve efficiency and safety, healthcare is
complex and is not always amenable to idealized processes. Some health
information systems are too rigid, leading to negative consequences, such
as decreased quality, user resistance, and workarounds [17, 80, 94-97].
One study concluded many unintended consequences of clinical decision
support systems (CDS) are attributable to insufficient flexibility [95]. An
overly rigid system can cause medication errors by not allowing clinicians
to enter atypical prescriptions [17].
On the other hand, there are also instances when errors can occur
due to excessive flexibility. Consider the nurse who intended to program a
pump to infuse 5 mcg/min, but accidentally selected a rate of 5 mcg/kg/
min (equivalent to 350 mcg/min for a 70 kg patient). While an alert
appeared, the flexible system allowed the nurse to simply bypass the
warning [98].
~ Page ! ~62](https://image.slidesharecdn.com/betterehr-151223134030/85/Better-ehr-63-320.jpg)
![Systematic Yet Flexible design
Perer and Shneiderman working in the context of exploratory data
analysis systems proposed seven SYF design goals for systems that
support exploratory data analysis [82]. The design goals enable users to:
1) see an overview of the sequential process of actions, 2) step through
actions, 3) select actions in any order, 4) see completed and remaining
actions, 5) annotate their actions, 6) share progress with other users, and
7) reapply past paths of exploration on new data. These design goals
provide useful advice for tasks generally requiring a single sequence of
actions, but they do not provide guidance on assessing task flexibility or
tradeoffs among user interfaces that support different amounts of
flexibility for the same task.
Cognitive Work Analysis
Cognitive Work Analysis (CWA) is a design and analysis framework
created to develop systems that allow workers to flexibly adapt to
unanticipated situations [99, 100]. It does this by using a number of
methods to uncover the intrinsic constraints of a work domain at multiple
hierarchical levels. Once constraints are visible, a designer can look for
places where flexibility may be unnecessarily restricted. This gives
workers flexibility to adapt to unanticipated situations. In addition, CWA
emphasizes the development of information displays and controls that
maximize a worker's situation awareness, readily understand an
unexpected situation and respond appropriately.
Although CWA is designed to support flexible systems, it does not
explicitly provide tools for analyzing tradeoffs in systematicity and
flexibility. CWA emphasizes increasing flexibility to allow workers to
adapt. We found only one paper that explicitly addressed flexibility in the
context of CWA, but it focused on increasing flexibility [101]. It did,
however, contain a brief comment that sometimes limiting flexibility can
be beneficial because fewer choices can speed decision making. This was
followed by a recommendation to develop interfaces presenting the most
common strategy, while still allowing alternative strategies. This is the
essence of an SYF system. Unlike CWA, SYFSA provides an explicit
mechanism for understanding tradeoffs in flexibility and systematicity.
However, CWA is highly complementary to SYFSA because it provides a
number of methods and tools for uncovering, relating, and visualizing
~ Page ! ~63](https://image.slidesharecdn.com/betterehr-151223134030/85/Better-ehr-64-320.jpg)
![perform more functions (increased functional flexibility) under more
conditions (increased operational flexibility) and do each function several
different ways (procedural flexibility) than an epinephrine auto-injector.
An analysis of procedural flexibility is, therefore, necessary for analyzing
operational and functional flexibility.
Second, many best practices in healthcare are highly procedural.
Attempts to improve practice or enforce best practices often take
procedural forms. This is especially true of regulations, standard
operating procedures, structured data entry, and Health IT forcing
functions and interaction design. The motivation for this approach comes
from decades of experience that shows the healthcare work domain is
under-constrained and that even experienced workers often do not know
or do not follow best practices. This has resulted in a well intentioned,
but often ineffective reaction to erect barriers that force workers to do the
"right" thing. As noted in our review, this can result in a system so
inflexible that it prevents or hinders workers from delivering appropriate
care, or leads workers to create workarounds that can jeopardize
themselves or the institution, and even bring harm to patients. For
example, estimating a required patient weight when there is no way to
weigh the patient can lead to dosing errors.
In future work we plan to extend SYFSA to incorporate the other
two types of flexibility.
A FRAMEWORK FOR SYSTEMATIC YET FLEXIBLE SYSTEMS
ANALYSIS (SYFSA)
To illustrate our framework and how it can be used to design SYF
systems, we consider a simplified procedure: central venous line insertion
[102]. Central lines are used to establish reliable access to large (central)
veins to deliver medications and fluids, draw blood for testing, and obtain
measurements, such as central venous pressure. Once inserted, a central
line remains in place for days or weeks. As a result, patients may develop
central line infections that substantially increase morbidity and mortality.
The chance of infection is reduced by following infection control
guidelines during insertion and minimizing the number of days the
central line stays in the body.
~ Page ! ~65](https://image.slidesharecdn.com/betterehr-151223134030/85/Better-ehr-66-320.jpg)
![Our example is a simplified version of the insertion procedure and
sacrifices realism for clarity. For example, hands are usually washed
before putting on a sterile gown to avoid contaminating the gown. We
consider only the following actions, listed in the approximate order,
required to comply with best practices for infection control:
Sterilize site
Drape patient
Put hat on
Put mask on
Put gown on
Wash hands
Glove up (put gloves on)
Insert central line
Apply sterile dressing
Under ideal circumstances, a caregiver first prepares the patient by
sterilizing the insertion site and then fully draping the patient. The
caregiver inserting the central line must then put on a mask, hat, and
gown. The gown prevents the donning of a mask and hat, so while the
order of mask and hat does not matter, they must both come before
donning a gown. Once the gown is on, the caregiver washes their hands
and then puts on sterile gloves. Following this, they insert the central line
and place a sterile dressing over the insertion site.
Following Newell and Simon [103], a problem space consists of a
symbolic representation capable of capturing each problem state, a set of
operators (information or physical processes that transform one state into
another), an initial state, and one or more goal states. Just prior to setting
up a new programmable infusion pump for a patient, the initial state is
one in which the pump is turned off, whereas the goal state is one in
which the pump is infusing the prescribed drug at the prescribed rate and
volume. Infusion pump operators consist of the actions (such as the
buttons on the front panel) available to install the drug administration set
and program the pump.
In general, a problem space of a real world task may consist of
hundreds, thousands or even millions of states and transitions between
states (operator applications). Manual analysis is difficult or impossible.
Thus, we implemented each space as a model in Mathematica [104] that
~ Page ! ~66](https://image.slidesharecdn.com/betterehr-151223134030/85/Better-ehr-67-320.jpg)
![generates a finite state machine (FSM) containing every possible state and
operator application. We then used the FSM to visualize the space and to
calculate measures for each space, such as all possible paths between a
pair of states, the number of states, different goal states, and so on. A
Mathematica notebook containing the code for the examples presented
here is available from the first author and may be used to develop new
models. We do not describe the details of this approach here because it is
one of many possible ways to automatically calculate the equations
described below. The basic approach to generating and using FSMs for
the analysis of user interaction is fully described by Thimbleby in a book
[105] and several articles [106-108].
In the remainder of this section we walk through the specification
and implications for each of the three spaces, beginning with the
idealized space. Although we present the spaces sequentially, we expect
the framework to be used in an iterative fashion. Part of the value of the
framework is that it provides insight to better understand a task and how
to design an SYF system to support that task.
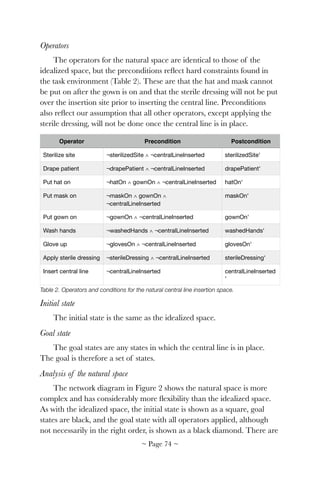
The idealized space
The idealized space is best specified as a work domain ontology (WDO)
for the task [27]. A WDO defines an explicit, abstract, implementation-
independent description of a task by separating the task from the work
context and technology used to accomplish the task. In other words, the
WDO separates inherent constraints of the task from constraints due to
system design. Rather than focusing on details of the current system,
WDO highlights the fundamental nature of the work, thereby providing
guidance for designing an appropriate system to support the work. WDO
does not provide explicit methods for discovering and visualizing
constraints, however, CWA (Section 2.4) provides a range of such
methods and visualization tools.
A WDO is easy to express as a problem space. The WDO goal is
specified as one or more goal state(s). Operations in the WDO are
specified as problem space operators. Constraints are specified as sets of
preconditions on the operators.
~ Page ! ~67](https://image.slidesharecdn.com/betterehr-151223134030/85/Better-ehr-68-320.jpg)
![Assumptions
As with all models, a WDO is based on a variety of assumptions that
set the scope of the model ( i.e., which elements of the real world are
considered relevant and which are not). When we specify the idealized
space we must always specify our assumptions.
For the idealized central line insertion space, we assume a single
caregiver will accomplish the entire task, that all required supplies are
available, and that there is sufficient time to do the entire procedure
according to best practices. We also assume the objects needed to follow
the best practice and the caregiver are specified in the WDO (i.e., are
inherent components of the abstract task).
Explicitly listing assumptions allows us to better assess the validity
and scope of the idealized space and, subsequently, the results of the
entire analysis. Berenholtz et al. [102] found lack of ready access to
supplies a barrier to following the best practice for central line insertion.
Part of their intervention for lowering central line infections was to
develop a central line insertion cart, restocked on a regular basis. We
assume all supplies are on hand to simplify our example, but in an actual
design setting, making this assumption explicit would allow one or more
of the stakeholders in the design process to question its validity, with the
possibility of modifying the analysis.
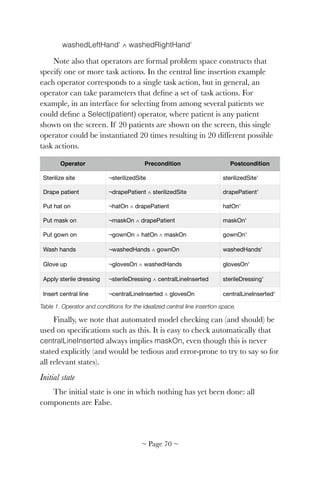
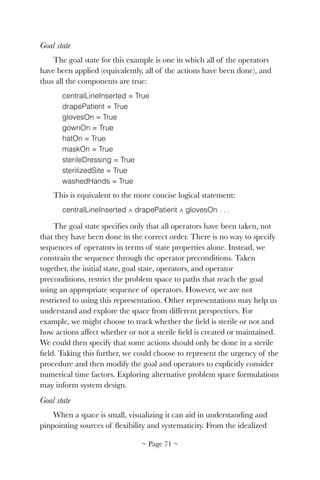
State representation
To specify a problem space we must decide how to represent the
system state. Abstractly, we think of state representation in terms of a set
of state variables and a specific state as a specific assignment of values to
each variable. In this example we use a simple Boolean representation of
state components to record whether an action was done or not. For
instance, if nothing has been done the components would all be false,
thus:
centralLineInserted = False drape
Patient = False
glovesOn = False
gownOn = False
hatOn = False
maskOn = False
~ Page ! ~68](https://image.slidesharecdn.com/betterehr-151223134030/85/Better-ehr-69-320.jpg)
![many more goal states in the natural space because it recognizes a person
may stop once they accomplish the primary (central line placement) goal.
The natural space has 384 states of which 256 are goal states. There
are 13,004 paths that lead to a state in which the central line is inserted
with the shortest being one step and the longest nine. Although there are
1,680 possible paths to the "ideal" goal state, only two of these paths
contain the appropriate sequence of nine steps that reflect best practice.
Comparing the natural space to the idealized space, we can see the
ideal sequence of actions is not enforced or encouraged by physical
constraints. Some actions, such as washing hands or sterilizing the site,
may leave no visible record, meaning the current system state is not
visible. A lack of visibility of system state is a major usability problem
that can lead to errors of omission (omitting a necessary step; e.g., not
washing hands) and commission (including an unnecessary step; e.g.,
washing hands twice). Further, the system state contains insufficient
information to allow an observer to detect the ideal goal state. The state
variables in our problem space indicate only which actions were done,
not the sequence of actions. However, the ideal goal depends, in part, on
action order.
Because the sterile dressing is placed after the primary goal of central
line insertion is achieved, there is a strong chance of post-completion
errors [109], which are errors occurring when a person forgets to do an
important task action that must be taken after they have accomplished
the primary goal. Typical post-completion errors are forgetting to retrieve
your ATM card after receiving cash from the machine or leaving an
original document on a copier after making copies.
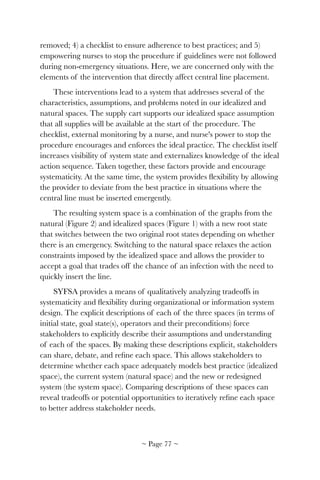
~ Page ! ~75](https://image.slidesharecdn.com/betterehr-151223134030/85/Better-ehr-76-320.jpg)
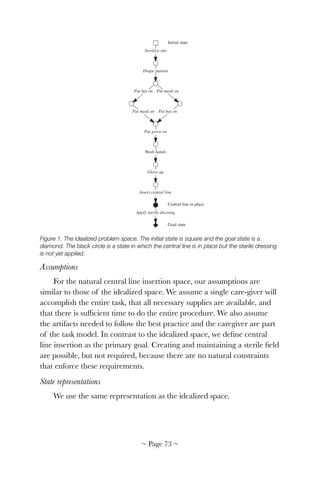
![!
Figure 2. The natural central line insertion space. The initial state is the square in the lower
right quadrant of the central image. The goal state in which all operators have been applied is
the black diamond in the upper left corner. Black circles are states in which the central line has
been placed. White circles are states where the central line has not been placed.
Taken together, characteristics of the natural space allow flexibility
that makes idealized task performance less likely to be achieved (i.e.,
intuitively the task might be considered "error prone."). Below we use the
comparison between these two spaces to consider a SYF system that
encourages ideal performance, while supporting graceful degradation
under unexpected or unusual conditions.
The system space
As noted above, stakeholders can use SYFSA to design a new system
or to evaluate and possibly refine an existing system. For this
demonstration of SYFSA, we base the system space on the existing
intervention proposed and implemented by Berenholz et al., which has
nearly eliminated central line-related bloodstream infections in multiple
institutions [102, 110]. Although the intervention was widely reported to
consist of a simple checklist, it actually has five components: 1) educating
staff on best practices and the intervention; 2) creating a central line
insertion cart to ensure easy access to all supplies needed to comply with
the best practice; 3) asking daily whether the central line could be
~ Page ! ~76](https://image.slidesharecdn.com/betterehr-151223134030/85/Better-ehr-77-320.jpg)
![All-objects: Table A has ten objects and Table B is empty. The
goal is to place all ten on Table B.
Sort-objects: Table A has ten numbered objects. The goal is to
move all ten objects in increasing order to Table B (i.e., object 1,
2, 3 ..., object 10).
In our central line example, Table A might be the central line supply
cart and Table B the sterile field.
By our intuitive definition of flexibility, Sort-objects is the least
flexible of the three tasks. But, which of the other two is the most
flexible? If we define flexibility as the number of paths to the goal, then
All-objects with 10! = 3,628,800 paths is clearly more flexible than Any-
object with only 10 paths. But intuitively, it seems Any-object is equally, if
not more flexible than All-objects because Any-object allows any choice
of action, and just one choice is needed. In contrast, although All-objects
allows any sequence of actions to lead to the goal, each choice constrains
the actions that follow, which intuitively would seem to decrease
flexibility. In fact, a system space that allowed a person to move an object
from Table B back to Table A would be overly flexible for the All-objects
task. Thus, the number of paths in a space can have more to do with the
size of the space, rather than constraints on actions.
Instead of using the number of paths to the goal to define flexibility,
we can use the average amount of information needed to choose an
action per non-terminal state (whether those states lead to a goal or non-
goal terminal state). In information theory [111], the amount of
information (measured in bits) in a choice between n equally likely
actions is ! , so the total information required to perform a
sequence of actions is the sum of the information for each decision along
the path. Suppose that there are n non-terminal states 𝑆i, and these states
have a corresponding number of equally probable actions 𝑎i (in terminal
states there are no actions). Then the average bits per non-terminal state
F is given by:
!
(1)
log2 (n)
F =
log2 (ai )i=1
n
∑
n
~ Page ! ~79](https://image.slidesharecdn.com/betterehr-151223134030/85/Better-ehr-80-320.jpg)

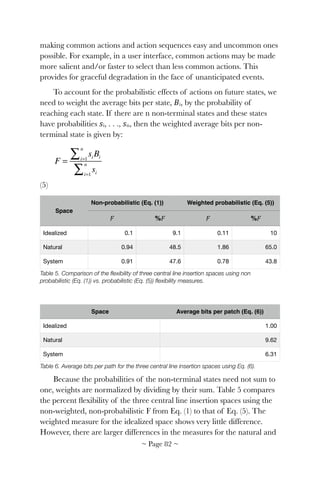
![We can use a similar measure to quantify how efficiently the natural
space supports the best practice by comparing the amount of
information a clinician requires to do the best practice in the natural
space versus the idealized space. In the idealized space there are two
equivalent paths of nine non-terminal states. Eight of the nine states
permit a single action, whereas one state has two possible actions. This
means that a person need only convey one bit of information to correctly
perform the task in the idealized state. In contrast, the natural space has
the same two paths, but because of the lack of natural constraints on
possible actions, seven of the non-terminal states allow more than one
action. The initial state has eight possible actions, the second state seven,
and so on, with each correct action eliminating one possible action until
the final two non-terminal states admit a single action each (with zero bits
of information). Assuming actions are equally probable, this makes the
total bits in either correct path:
!
(7)
Since the idealized space requires only 1 bit, the efficiency of the
natural space for supporting the best practice is only 100 * 1/15.2992 =
6.5%.
According to the Hick-Hyman law, the time to make a decision is
proportional to the amount of information in the available choices [112,
113]. As a result, the information theoretic analysis of a system provides
a prediction of cognitive load and relative task times (e.g., a task that
requires more information is likely to take longer than a task that requires
less information). In addition, through practice a person can automate a
consistent sequence of task actions, resulting in fast, nearly subconscious
behavior. This means a person must acquire through practice over 15 bits
of information to fully automate the idealized task in the natural space,
but only 1 bit in the idealized space. We can use this kind of analysis to
compare the learnability of different spaces for different system designs.
log2 (i) = 15.2992
i=2
8
∑
~ Page ! ~84](https://image.slidesharecdn.com/betterehr-151223134030/85/Better-ehr-85-320.jpg)
![supporting multiple tasks, common user-centered design principles
recommend providing error reversal, or undo, functionality to traverse
back through prior choices, to change them or to review them. For
example, if a clinician accidentally sets an infusion pump to 100 mcg/
min instead of 10 mcg/min, it should be possible to clear or re-enter the
infusion rate. This reflects an increase in flexibility over the idealized
space (which assumes a perfect user), but is an appropriate trade-off
given the realities of the natural space in which even highly trained users
can make mistakes.
Design frameworks such as SYFSA are often difficult to validate.
They tend to be used or abandoned based on whether designers find
them useful and easy to use. Any evaluations are often qualitative in
nature, consisting of case studies and arguments that outline strengths
and weaknesses. However, some aspects of SYFSA may be empirically
testable. SYFSA assumes that systems that are too flexible relative to the
task (the idealized space) will be harder to learn and use, as will systems
that support too little flexibility. Building on several existing laws and
cognitive results, we also believe that SYFSA can predict relative
efficiency, cognitive load, and learnability. However, we have not yet
empirically evaluated these claims.
Another challenge is that many real world tasks and systems can have
dozens or hundreds of possible actions leading to thousands or even
hundreds of thousands of states in each problem space. There are at least
three solutions to this problem. The first is to generate and analyze the
spaces computationally as we have done for the examples here.
Thimbleby describes these techniques in detail and they are also
demonstrated in the Mathematica code available from the first author
[105]. The second is to reduce the complexity of the spaces by selecting
an appropriate level of abstraction. For example, in the central line
examples we did not model the detailed cognitive steps required to
determine the best location to insert the central line, nor all of the
physical steps involved in the process, such as opening equipment
packages. As with any modeling approach, selecting the right level of
abstraction is challenging and remains part art and part science. The
third solution is to separately analyze subparts of a complex system. For
instance, we analyzed an infusion pump by analyzing the number entry
~ Page ! ~86](https://image.slidesharecdn.com/betterehr-151223134030/85/Better-ehr-87-320.jpg)


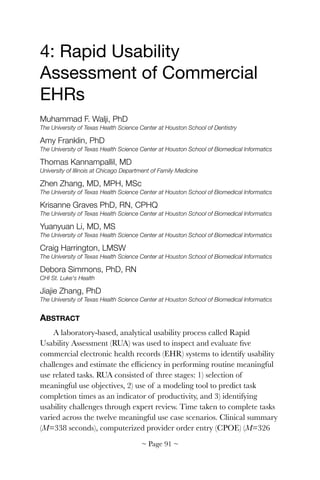
![seconds), and Medication List (161 seconds) test procedures had the
highest mean task completion times. Expert review detected 1,135
usability problems within five EHRs. CPOE (N=58) and Clinical
Summary (N=53) had the highest mean number of usability problems
per EHR. Memory, Feedback + Error, and Match were the most
frequently violated usability heuristics. Time for experts to perform
meaningful use-related tasks in existing EHRs were high. These times are
predictive of errors in routine performance and would likely be higher in
actual clinical practice. Users face numerous usability problems as they
use systems in real-world clinical practice. Poor usability is a critical
challenge limiting the adoption and safe use of EHRs. Performance times
can be used as benchmarks to measure and compare EHR systems along
the efficiency dimension of usability. Our results suggest an urgent need
to improve the usability of existing EHRs.
INTRODUCTION
The American Recovery and Reinvestment Act (ARRA) of 2009
provided significant financial incentives for healthcare providers to adopt
and meaningfully use electronic health records (EHR) systems [114].
However, the promise of health information technology (HIT) to
transform healthcare practice is often limited by its usability [23]. Within
the framework of the ARRA, the Office of the National Coordinator
funded the National Center for Cognitive Informatics and Decision
Making in Healthcare as one of the four Strategic Health IT Advanced
Research Programs. The establishment of this Center was based on the
recognition that EHR usability was a significant barrier to achieving the
goal of nationwide use by 2014 [115].
Usability refers to how useful, usable and satisfying a system is for the
intended users to accomplish goals in a work domain by performing
certain sequences of tasks [7]. In spite of recent reports of devastating
consequences from poor EHR usability [16, 17], significantly more
attention is directed towards the financial and technical aspects of EHR
than its usability and integration into the clinical work environment [23,
116]. We conducted extensive evaluation and usability analyses of EHR
systems, developing meaningful metrics for assessing EHR usability.
~ Page ! ~92](https://image.slidesharecdn.com/betterehr-151223134030/85/Better-ehr-93-320.jpg)
![We studied five commercial EHR systems and identified core
usability challenges and optimal efficiency based on a Rapid Usability
Assessment (RUA) protocol. Results, we believe, provide diagnostic
information for developers to improve the usability of EHR systems.
APPROACH
Methodology was based on our prior health IT usability research
[18, 20, 21, 42, 46, 66, 117-120]. RUA combines model-based and
inspection-based approaches to EHR evaluation. Laboratory methods
are complementary to time-intensive field observation and user testing,
making it a flexible way to develop feedback for iterative design. The
approach generated a repository of EHR usability challenges and issues
useful for future development efforts.
RUA uses the TURF framework [7]. TURF stands for Task, User,
Representation, and Function, core analyses that can assess usefulness,
usableness and satisfaction of an EHR. TURF provides a mechanism to
evaluate an overall system based on intrinsic complexity and extrinsic
difficulty. Intrinsic complexity refers to the complexity of work needed to
be done in a domain, independent of technology implementations or
procedures. Functional analysis can be used to assess intrinsic complexity,
thereby determining the usefulness of a system [46]. Extrinsic difficulty
reflects difficulties a user experiences with a specific representation or
interface to perform a task, which is an indication of system usableness.
Representation and task analyses can be used to determine extrinsic
difficulty.
RUA focuses on the extrinsic difficulty component of the TURF
framework, assessed by task and representation analyses. The current
version of the RUA protocol uses multiple methods including model- and
expert-based evaluations. RUA results can be followed up by more
resource-intensive and targeted user-based usability techniques.
We used RUA to evaluate EHR usability in three stages: 1) selection
of meaningful use objectives, 2) predicting performance by task
completion time as measured by CogTool [71], and 3) identifying usability
challenges through expert review.
~ Page ! ~93](https://image.slidesharecdn.com/betterehr-151223134030/85/Better-ehr-94-320.jpg)
![Selecting meaningful use objectives
Health providers must use a certified EHR containing meaningful
use-related functionality to receive incentive payments. The National
Institute of Standards and Technology (NIST) developed meaningful use
test procedures, which are publicly available for EHR certification bodies
[121]. Tests contain specific instructions and sample data to determine if
an EHR system has met a meaningful use objective. For example, the
"Maintain up-to-date problem list" test states an EHR system should
"enable the user to electronically record, modify, and retrieve a patient's
problem list over multiple encounters." The test specifies data must be
recorded in a structured format using either ICD-9-CM or SNOMED-
CT. Specific problems to be recorded, modified and retrieved are also
specified.
Twelve clinical tasks associated with the first 15 core objectives of
meaningful use in ambulatory care settings were selected for evaluation.
Five EHR products were assessed to determine if test procedures could
be completed.
Predicting performance using task completion times
After selecting a standardized set of tests for EHR evaluation, we
studied the impact of the system on performance. We used completion
times as our primary outcome measure. Completion time is one of the
most widely reported barriers for EHR adoption due to its direct effect
on productivity [66, 122, 123]. Although numerous researchers have
reported both positive and negative performance outcomes due to EHR
use [124], there is surprisingly limited conclusive evidence for EHR's
impact on clinical workflow. Part of the reason is a lack of reliable
evaluation data.
Our approach was to predict an expert's routine task completion
times using a modeling tool, then use these results as performance
benchmarks for laboratory evaluations. The Goals, Operators, Methods
and Selection (GOMS) technique [63, 125] is a cognitively grounded
approach that has been used for many years to predict task completion
times. We used a generalized task analysis method derived from GOMS
known as KLM (Keystroke Level Model). KLM is the simplest GOMS
technique [63], using a pre-specified set of keystroke and mouse
~ Page ! ~94](https://image.slidesharecdn.com/betterehr-151223134030/85/Better-ehr-95-320.jpg)
![operators with associated timings [126]. KLM predicts the time it takes
for an expert (skilled in the domain in which the task is considered) to
execute keyboard and mouse inputs along with the associated cognitive
overheads (e.g., thinking time or time taken to visually acquire objects on
the screen). For example, to enter a patient name and click a submit
button: 1) move cursor to the name text box using the mouse, 2) type the
patient's name using the keyboard, then 3) move the mouse to the
"Submit" button and left-click. The model also incorporates "think"
operators, i.e., time spent to mentally prepare for an action or a set of
related actions (e.g., "think" before moving mouse to the name text box).
Parameterized KLM values have been prescribed. For example, double-
clicking a mouse button takes 0.4 seconds. KLM has been used in a
variety of fields to compute task-based performance measures, including
visualization [127], cell-phone menu browsing [128], handheld devices
[71], evaluating devices for the disabled [129], email organization [130],
and in-vehicle information systems [131]. We used KLM to determine
routine clinical task completion times for one EHR system [66].
We used CogTool [132], a software application based on an enhanced
version of KLM incorporating the more detailed ACT-R framework
[133], for analysis of selected NIST meaningful use test procedures. This
provided a theoretically grounded, analytical approach for predicting
comparative performance across potentially different screen paths. By
using a standardized sequence of tasks (e.g., recall information, modify
fields, and record new data), we computed the time taken for the same
task across multiple EHRs. For example, we could consider the time to
complete an e-prescription for a given set of data independent of system
interface design (e.g., popups, drop-downs, searching, using text to
complete drug name selection, etc.).
Identifying usability challenges through expert review
An EHR may use design elements unfamiliar to users, display
information in unexpected ways, or fail to provide appropriate feedback
to ascertain if intended actions have been completed. An efficient way of
identifying usability problems is through a process called "expert review,"
in which usability specialists determine if a user interface conforms to
established usability principles. Expert reviews are cost effective, can be
conducted rapidly, and have been found effective in identifying gross
~ Page ! ~95](https://image.slidesharecdn.com/betterehr-151223134030/85/Better-ehr-96-320.jpg)
![usability problems [134]. These methods are complementary and, used
together, can provide evidence of task performance time and
impediments limiting user performance.
Heuristic evaluation, a type of expert review, was initially proposed
by Nielsen [135] and modified for use in clinical settings [57]. In a
heuristic evaluation, a small set of evaluators examine an interface and
review its compliance with recognized usability principles (or
"heuristics"). Heuristic evaluation has been successfully applied to health
IT, including practice management [136], computerized provider order
entry (CPOE) [137], telemedicine [60], and medical devices [57, 58]. It
has also been successfully used for predicting usability issues that impact
end user involvement [59, 138, 139].
We developed a modified heuristic evaluation process. Two
evaluators independently inspected an EHR in the context of a specific
clinical task and focused only on interface items needed to accomplish the
task. Each evaluator was guided by seven heuristic design principles
(Table 1) based on human cognitive capacities and limitations [19] and
derived from previous research [7, 57]. For example, the heuristic
principle of consistency encourages interface designers to set and adhere
to patterns in layouts, vocabularies, color or other features that allow
users to immediately feel familiar with their interface and to avoid
distracting or confusing users with unnecessary variations. A violation of
the consistency heuristic would be alternating placement of the cancel
and save buttons across screens.
Expert reviews have the potential to identify a range of usability
problems. Some issues may have life-threatening consequences, while
others may impact only the cosmetic appearance of the system. Each
heuristic violation was ranked using a four-point scale, where 1 was a
cosmetic issue, 2 a minor usability violation, 3 a major usability violation,
and 4 a catastrophic usability violation. Ratings consider the proportion
of users who may experience the usability problem, the impact of the
problem on patient safety or performance, and whether the issue is a
problem only during initial encounters or could persistently disturb users.
~ Page ! ~96](https://image.slidesharecdn.com/betterehr-151223134030/85/Better-ehr-97-320.jpg)
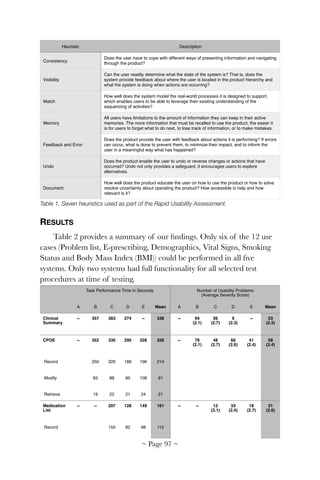
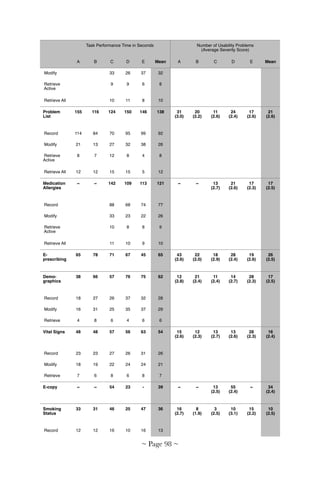
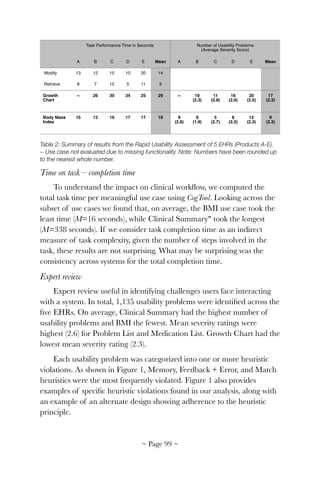
![Figure 1.
DISCUSSION
We evaluated the usability of five commercial EHR products for
their potential impact on clinical environments in terms of task
completion time and adherence to good usability design principles. Our
findings are consistent with concerns expressed in a Institute of Medicine
(IOM) report on health IT and patient safety citing "poor interface
design, poor workflow and complex data interfaces" as serious threats to
patient safety in clinical environments [140].
We found some tasks took significantly longer to complete (e.g.,
clinical summary and CPOE). Increased time reflected increased
complexity of the task and potential risk.
~ Page ! ~100](https://image.slidesharecdn.com/betterehr-151223134030/85/Better-ehr-101-320.jpg)
![While our evaluation was performed on systems that had already
been developed, it was directed at identifying efficiency benchmarks for
comparing usability across systems. To the best of our knowledge, such
benchmarks do not currently exist in the field of academic or commercial
EHR developers/researchers. Our predictions of task performance times
are of particular importance when viewed in the context of a real-life
clinical encounter. For example, a typical patient visit that involves: 1)
recording demographics, vital signs, smoking status, 2) calculating BMI,
and 3) recording problem list, medication list, medication allergy list, and
a set of orders through CPOE would take 11 minutes and 19 seconds on
average. This represents the optimal performance time interacting with
the EHR (assuming no user errors), and does not include the time spent
examining or interacting with a patient.
Through expert reviews we discovered tasks that were more complex
and took longer had the highest number of usability problems. However,
even shorter tasks had a number of usability challenges. Some issues had
potential for causing patient safety-related events. Of particular concern
were interfaces requiring high memory load or mismatches between
clinical workflow, internal representation and system design.
More user-based testing is needed to identify specific challenges users
face and directions for interface improvement. Our approach and results
are complementary to the recently released National Institute of
Standards and Technology (NIST) EHR Usability Protocol, which
focuses on ensuring the design of safe EHRs through expert reviews and
summative user testing [141].
FUTURE DIRECTION
Despite several advantages for the RUA approach, limitations exist
relating to the comprehensiveness of our findings. First, we used expert
user performance for computing task completion times. This is likely to
differ from actual task performance in clinical settings. Nevertheless,
KLM predicts an ideal measure of time required to complete certain
routine tasks. We plan user testing in field settings to validate and further
explore task completion times. Second, we used only two usability
evaluation methods in our RUA protocol. For usability evaluation to be
comprehensive, additional user-centered methods such as field studies or
~ Page ! ~101](https://image.slidesharecdn.com/betterehr-151223134030/85/Better-ehr-102-320.jpg)
![laboratory-based experiments (as outlined in the NIST EHR Usability
Evaluation Protocol) would be useful capturing a greater number of
usability problems and triangulating findings. Third, we did not use all
the NIST defined meaningful use-related tasks for our assessment.
However, the RUA can easily be expanded for other tasks as they are
defined by NIST or others as part of future stages of meaningful use.
IMPLICATIONS
Combining a predictive model of time required to complete a task
with a more subjective, expert-based measure of usability violations
provides significant flexibility understanding the structure of NIST
meaningful use tasks. Our results show lack of efficiency in completing
certain tasks in conjunction with incompatible user interfaces provides
evidence for the "threats to patient safety" highlighted in the IOM report
[140].
© 2014 Muhammad Walji, Amy Franklin, Thomas Kannampallil, Zhen Zhang, Krisanne Graves,
Yuanyuan Li, Craig Harrington, Debora Simmons, Jiajie Zhang
~ Page ! ~102](https://image.slidesharecdn.com/betterehr-151223134030/85/Better-ehr-103-320.jpg)
![5: EHR Vendor Usability
Practices
Raj Ratwani, PhD
National Center for Human Factors in Healthcare, MedStar Health
Rollin (Terry) Fairbanks, MD MS
National Center for Human Factors in Healthcare, MedStar Health
Zachary Hettinger, MD MS
National Center for Human Factors in Healthcare, MedStar Health
Natalie Benda
National Center for Human Factors in Healthcare, MedStar Health
ABSTRACT
A team of healthcare human factor experts interviewed 11 electronic
health record (EHR) system vendors to better understand their
implementation of user-centered design (UCD). The team learned both
application practices and challenges. Interviews revealed three UCD
implementation categories: rigorous UCD processes in place, basic UCD
processes employed, and no UCD. Challenges that vendors faced in each
category are described, including a lack of UCD understanding,
problems integrating UCD into software development, and difficulty
recruiting participants for usability studies. Results provide insight on the
current state of UCD in EHR products and ideas that could improve
usability.
INTRODUCTION
Electronic health records (EHR) systems have the potential to
dramatically improve healthcare efficiency, quality and safety. To reach
this goal, systems must be designed, developed, and implemented with a
focus on usability and safe use [142]. This suggests vendors employ user-
centered design (UCD) during product development and that healthcare
users appropriately implement the system.
The Office of the National Coordinator (ONC) for Health
Information Technology requires EHR vendors certify their products'
usability and safety [6]. ONC safety-enhanced design requirements
~ Page ! ~103](https://image.slidesharecdn.com/betterehr-151223134030/85/Better-ehr-104-320.jpg)
![specify vendors employ a UCD design process, conduct testing and
report test results of at least eight UCD functions. While ONC does not
describe a specific UCD design and development process, requirements
reference the International Standards Organization (ISO) and National
Institute of Standards and Technology (NIST) standards [143]. Despite
these requirements, however, EHR usability remains problematic [144,
145].
Our team studied vendor UCD processes and researched new ideas
to help vendors improve UCD [7]. The EHR marketplace is diverse.
Some vendors have less than ten employees and offer only ambulatory
care products, others employ more than five thousand and market a suite
of products. We conducted semi-structured interviews with a diverse
representation of EHR vendors to learn about their implementation of
UCD. Insight could help create better UCD design methodology and
development tools. A clear understanding of vendor UCD processes and
challenges can also assist policymakers, regulatory agencies and others
dedicated to improving EHR systems.
APPROACH
A research team of human factors, clinician/human factors, and
clinician/informatics experts visited eleven EHR vendors and conducted
semi-structured interviews about their UCD processes. "Process" was
defined as any series of actions that iteratively incorporated user
feedback throughout the design and development of an EHR system.
Some vendors developed their own UCD processes while others followed
published processes, such as ISO or NIST guidelines.
Vendor recruitment. Eleven vendors based on market position and type
of knowledge that might be gained were recruited for a representative
sample (Table 1). Vendors received no compensation and were ensured
anonymity.
~ Page ! ~104](https://image.slidesharecdn.com/betterehr-151223134030/85/Better-ehr-105-320.jpg)
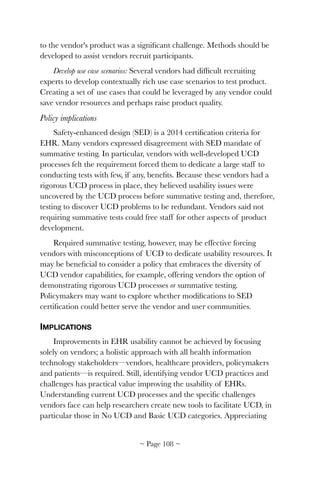


![6: Turf Usability Tool Suite
Min Zhu, MD, PhD
The University of Texas Health Science Center at Houston School of Biomedical Informatics
Deevakar Rogith, MBBS
The University of Texas Health Science Center at Houston School of Biomedical Informatics
Amy Franklin, PhD
The University of Texas Health Science Center at Houston School of Biomedical Informatics
Muhammad F. Walji, PhD
The University of Texas Health Science Center at Houston School of Dentistry
Jiajie Zhang, PhD
The University of Texas Health Science Center at Houston School of Biomedical Informatics
ABSTRACT
Usability is a major barrier to electronic health record (EHR)
adoption and meaningful use. Traditional usability assessments include
pen and paper, and stand-alone recordings. We developed Turf, software
to evaluate, document, and improve EHR usability in an all-in-one
product. Turf can be used in both usability evaluation and the testing and
design of EHR systems. Intended to support lab and real world
environments, Turf streamlines conducting and reporting formative and
summative assessments, including user testing and heuristic evaluation.
INTRODUCTION
Poor usability is a barrier to adopting electronic health records
(EHR) [21, 146]. Despite significant research on the importance of EHR
usability in patient safety and quality of care, EHR systems' ease of use
and learnability are problematic [147]. Usability testing can identify
problems during product development, but assessment can be laborious.
Conventional usability testing is often word processor, spreadsheet, or pen
and paper-based.
An EHR system's required tasks, its users' needs, how it represents
health information, and its functional capabilities (TURF) determine its
usability. We developed a unified framework for evaluating electronic
health records system usability called TURF [7] (Chapter 2). TURF is: 1)
a theory for describing, explaining, and predicting usability differences, 2)
~ Page ! ~111](https://image.slidesharecdn.com/betterehr-151223134030/85/Better-ehr-112-320.jpg)
![a method for objectively defining, evaluating, and measuring usability,
and 3) a set of usability measures. The Office of the National
Coordinator for Health IT requires vendors adhere to safety-enhanced
design (SED) [148]. SED mandates EHR vendors document their user-
centered design (UCD) processes and conduct summative usability
testing. Legislation also requires test results be reported in a "common
industry format." Based on the TURF framework, we developed Turf, an
all-in-one software tool to help EHR vendors evaluate, document, and
improve the usability of their products.
APPROACH
Turf was designed and developed using a work-centered approach.
Functional requirements were based on extensive experience conducting
usability assessments, SED, and national guidelines and protocols
published by the National Institute of Standards and Technology (NIST):
• (NISTIR 7741) NIST Guide to the Processes Approach for
Improving the Usability of Electronic Health Records
• (NISTIR 7742) Customized Common Industry Format Template for
Electronic Health Record Usability Testing
• (NISTIR 7804) Technical Evaluation, Testing and Validation of the
Usability of Electronic Health Records
• (NISTIR 7865) A Human Factors Guide to Enhance EHR Usability
of Critical User Interactions when Supporting Pediatric Patient Care
Turf architecture
Because many clinical applications require a Microsoft Windows
operating system, we based development on Microsoft Windows 8. Our
major programming language was C#. Microsoft coding standards were
adopted, Microsoft Visual Studio 2012® used as our integrated
development environment, and Microsoft User Interface Design
Guidelines for Windows presentation foundation (WPF).
Turf uses a model–view–controller design pattern. We divided the
application into interconnected components to separate the internal
representation of information from how information is presented to
users. The central component consists of application data, business rules,
~ Page ! ~112](https://image.slidesharecdn.com/betterehr-151223134030/85/Better-ehr-113-320.jpg)
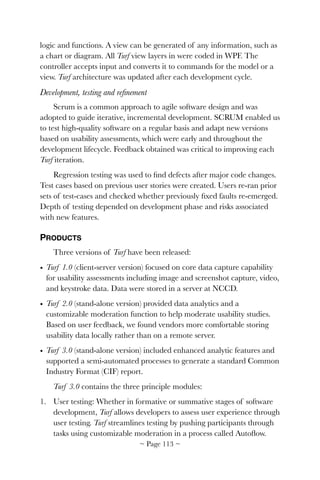
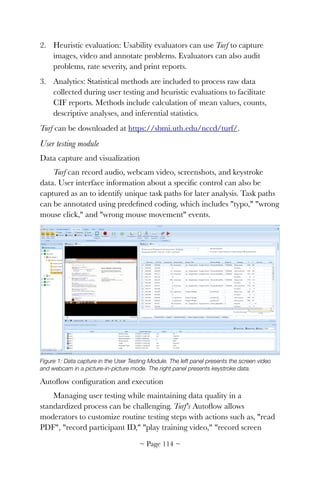
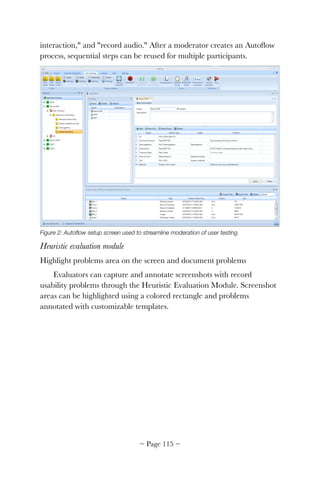
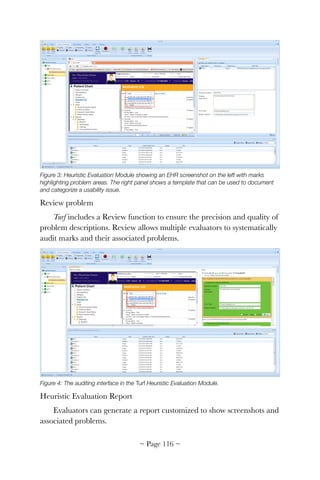


![7: Safety-enhanced & User-
centered Design
Amy Franklin, PhD
The University of Texas Health Science Center at Houston School of Biomedical Informatics
ABSTRACT
The US Centers for Medicare & Medicaid Services provide financial
incentives to health providers for meaningful use of certified electronic
health records (EHR) systems. Safety-enhanced design (SED) is a 2014
certification criteria and requires EHR vendors to:
1. Use a formal, user-centered design (UCD) process during EHR
system development, and
2. Perform summative usability testing for portions of their EHR
product.
We detail efforts to help EHR vendors better understand UCD,
including disseminating:
• Requirements to meet SED certification, and
• International standards that meet SED legislation.
INTRODUCTION
The US Centers for Medicare and Medicaid (CMS) provide financial
incentives to health providers using certified electronic health records
(EHR) systems. To receive EHR incentive payments, a provider must
show meaningful use of their EHR and the EHR vendor must certify
their EHR product meets certification requirements for safety-enhanced
design (SED) [149]. The Office of the National Coordinator (ONC)
describes SED as a design process to reduce design-based errors within
EHR interfaces, thereby improving the quality and safety of EHR
systems [141]. Integral to this approach is the concept of user-center
design (UCD). SED certification requires:
1. Documentation of the UCD process used during EHR development,
and
~ Page ! ~121](https://image.slidesharecdn.com/betterehr-151223134030/85/Better-ehr-122-320.jpg)
![2. Summative usability testing of their EHR, including:
a. Computerized Provider Order Entry System (CPOE)
b. Drug-drug, drug-allergy interaction checks
c. Medication list
d. Medication allergy list
e. Clinical decision support
f. Electronic medication administration record
g. Electronic prescribing
h. Clinical information reconciliation
Guidelines and protocols published by the National Institute of
Standards and Technology (NIST) and International Organization for
Standardization (ISO) have been suggested as possible routes for meeting
SED certification requirements.
User-Centered Design
UCD is "an approach to designing a product or service in which the
end user is placed in the center of the process" [150]. The intent is to
build systems that accommodate users rather than forcing users to adapt.
ISO describes six key principles of user-centered design [151]:
1. Design is based upon an explicit understanding of users, tasks and
environments.
2. Users are involved throughout design and development.
3. Design is driven and refined by user-centered evaluation.
4. The process is iterative.
5. The design addresses the whole user experience.
6. The design team includes multidisciplinary skills and perspectives.
NIST, ISO, and ONC SED criteria are not prescriptive. ONC set
SED requirements without limiting vendors to specific UCD processes or
summative testing procedures. To fulfill certification requirements,
vendors must only submit documentation specifying the UCD process(es)
used. This allows for significant flexibility in achieving SED. Written
~ Page ! ~122](https://image.slidesharecdn.com/betterehr-151223134030/85/Better-ehr-123-320.jpg)
![reports, documentation of procedures or providing acknowledgement of
having followed ISO standards are a means of meeting requirements.
APPROACH
We participated in conversations with several EHR vendors over
months regarding their summative testing plans. We also commented on
UCD protocols, analyzed issues and offered reporting ideas. Discussions
varied by vendor understanding of UCD and capabilities for summative
testing. We also summarized ISO standards to assist vendors document
relevant UCD practices.
RESULTS
ISO standards provide one way to document UCD approaches
during EHR system design. The standards are content rich and
conceptually dense, making it difficult for some vendors to determine
which standards apply and how to select between them (see Chapter 5).
We provided a synopsis of ISO standards relevant to UCD and SED
(Table 1).
Table 1. ISO standards applicable to UCD and SED [151-155].
Each summary described an ISO standard's scope, definitions,
rationale and was cross-referenced to related standards. References were
also made to other UCD methods or principles. Summaries were 4-6
pages long, compared to typical 50-page ISO documents. Table 2
describes the scope of summarized standards.
Standard Title
ISO 9241-11 Ergonomics Requirements For Office Work With Visual Display Terminals
— Part 11: Guidance On Usability
ISO 9241-210 Ergonomics of Human-System Interaction— Part 210: Human-Centred
Design for Interactive Systems
ISO/TR 16982 Ergonomics of human-system interaction — Usability methods supporting
human-centred design
IEC/ISO 62366 Medical devices — Application of usability engineering to medical devices
ISO/IEC 25062 Software engineering — Software product Quality Requirements and
Evaluation (SQuaRE) — Common Industry Format (CIF) for usability test
reports
~ Page ! ~123](https://image.slidesharecdn.com/betterehr-151223134030/85/Better-ehr-124-320.jpg)
![Table 2. Scope of ISO standards applicable to UCD and SED (available at https://
sbmi.uth.edu/nccd/SED/).
Linking to ISO
Referencing appropriate ISO standards requires not only
understanding the standards, but mapping them to appropriate stages of
EHR design and development. We provided linkages to ISO standards
based on components of the UCD process (Figures 1 and 2).
Standard Title Provides Does not provide
ISO 9241-11 Ergonomics
Requirements For
Office Work With
Visual Display
Terminals— Part 11:
Guidance On
Usability
Defines usability, describes
benefits of integrating usability
into the design process,
provide guidances on how to
specify the requirements
needed measure the usability
of products, how to evaluate
usability.
Comprehensive
coverage of
ergonomic design
objectives or human-
centered design
processes
ISO 9241-210
[ISO 9241-210
updates and
replaces ISO
13407:1999.]
Ergonomics of
Human-System
Interaction— Part
210: Human-Centred
Design for
Interactive Systems
Provides information about
human-centered design
available to managers of
hardware, software, and
redesign processes in order for
them to help identify and plan
human-centered design
activities.
Detailed human-
centered methods nor
does it detail project
management.
ISO/TR 16982 Ergonomics of
human-system
interaction —
Usability methods
supporting human-
centered design
A resource for project
managers to better understand
the methods of usability testing
so that they can make more
informed decisions about how
to support human-centered
design as described in ISO
13407 (later revised in ISO
9421:210).
IEC/ISO 62366 Medical devices —
Application of
usability engineering
to medical devices
A process for a manufacturer to
analyze, specify, design, verify
and validate usability, as it
relates to safety of a medical
device.
It does not address
risk and errors
associated with
atypical use.
ISO/IEC 25062 Software
engineering —
Software product
Quality
Requirements and
Evaluation
(SQuaRE) —
Common Industry
Format (CIF) for
usability test reports
Provides the common industry
format (CIF) for reporting the
results of usability testing
related to software.
The scope of ISO/IEC 25062 is
it NISTIR 7742, conforms to
ISO/IEC 25062, and was
written specifically for reporting
on EHR systems and have
been made freely available.
~ Page ! ~124](https://image.slidesharecdn.com/betterehr-151223134030/85/Better-ehr-125-320.jpg)
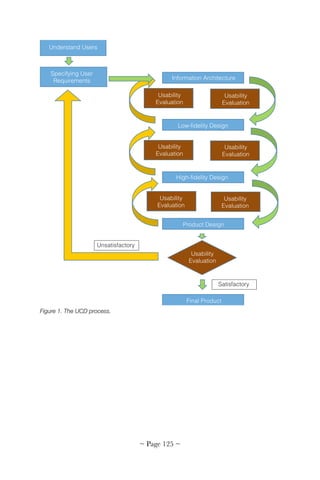
![Figure 2. ISO standards mapped to the first step of the UCD process.
DISCUSSION
SED certification encompasses a range of UCD methods and
processes for certification. While flexibility benefits many within the EHR
vendor community, for others the lack of a specified process is
problematic. Publicly available reports on EHR usability are available
through ONC's Certified Health IT Product List [156], however, few
summative tests or UCD experience reports are available. General
references for following standard UCD procedures can be found [157],
but finding practical references for vendors implementing UCD is
difficult. Growing the literature on EHR UCD implementation is
needed.
SUGGESTED READING
Health information technology: standards, implementation specifications,
and certification criteria for electronic health record technology, 2014
edition; revisions to the permanent certification program for health
~ Page ! ~126](https://image.slidesharecdn.com/betterehr-151223134030/85/Better-ehr-127-320.jpg)


![8: Use Cases
Amy Franklin, PhD
The University of Texas Health Science Center at Houston School of Biomedical Informatics
ABSTRACT
New electronic health records system safety-enhanced design
requirements underscore the need for validated, contextually-rich user
test scenarios. We developed assessment tools to measure system usability
and identify safety risks, and detailed methods of generating these
materials.
INTRODUCTION
Information technology (IT) usability has implications beyond
adoption or ease of use. Testing real users in actual tasks is one of the
most effective means of assessing the safety of an electronic health
records (EHR) system for patient care. The Office of the National
Coordinator (ONC) 2014 EHR safety-enhanced design (SED)
certification criteria require user testing and reporting of specific tasks,
including e-prescribing, medication list maintenance and clinical
information reconciliation [141]. To assess EHR procedures, activities
such as entering a prescription are embedded into scenarios or
descriptions of hypothetical work. While the National Institute of
Standards and Technology (NIST) Test Procedure for §170.314(g)(3)
Safety-enhanced design [141] is a valuable reference for system
evaluation, greater specification of roles, workflows, and EHR system
specific task descriptions are necessary to replicate real world
engagement. EHR test protocols should reproduce a system's user
interface, rely on users' knowledge, simulate users' thought processes
while performing tasks (their "mental model"), support inferences users
make interacting with the system, and produce valid output.
Use cases describe "a system's behavior as it responds to a request.
Each use case is represented as a sequence of simply steps, beginning
with a user's goal and ending when that goal is fulfilled" [150].
~ Page ! ~129](https://image.slidesharecdn.com/betterehr-151223134030/85/Better-ehr-130-320.jpg)
![ONC and NIST use cases describe functional requirement for SED
testing [141]. Broad datasets are provided, but without specifying
workflows. For each test procedure, definitions capture certification
criteria for recording, modifying and retrieving information. For example,
a system must "enable a user to electronically record, modify, and retrieve
a patient's vital signs including, at a minimum, the height, weight, and
blood pressure." NIST provides sample values, such as height 66 inches,
weight 61.2 kg and blood pressure 120/80 are given, which may be
insufficient for testing. To create a use case with appropriate context for
more complicated cases, however (such as entering a prescription and
utilizing decision support), more data entry fields are needed. To generate
comprehensive use cases, data must be enriched to detail roles, business
processes, goal(s), and events that might occur achieving a goal [158].
APPROACH
We created an organizational framework and workflow for each
required 2014 SED test method [159], such as medication reconciliation,
computerized provider order entry, etc. Our use cases include task-
required data and their clinical context (e.g., user role, purpose, workflow,
etc.).
Our use cases were informed by observing and interviewing
clinicians, and verified by clinical collaborators. Synthetic patient data,
including historical information, were generated by mining two large
patient datasets (including 100,000 patients in one sample) from major
metropolitan areas. We used real world data to replicate test participant
(i.e., doctor and nurse) experiences in common patient interactions. For
example, we found the average length medication list has three drugs. We
selected the most frequent conditions, medications and labs for inclusion
in our test database and developed advanced scenarios for testing less
typical cases, such as long medical histories or lengthy drug regimens.
OUTPUT
We envisioned two users of each scenario: a clinical test participant
and a usability expert. Participant instructions, expectations and guidance
to identifiable outcomes were embedded within a realistic narrative,
providing motivation for prescribing drugs or ordering lab tests without
~ Page ! ~130](https://image.slidesharecdn.com/betterehr-151223134030/85/Better-ehr-131-320.jpg)

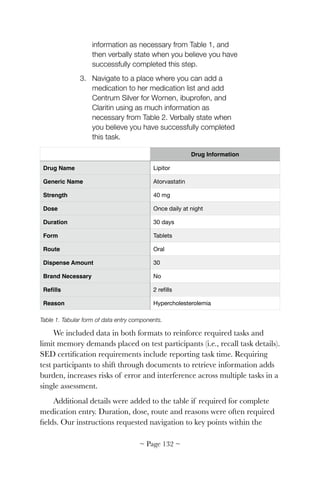
![system without directing participants to certain locations or providing
keystroke level details of task completion.
For usability experts, we provided moderator guides with step-by-step
support for each component. We recommended NIST 7804 for
procedures [141] and detailed other methods of data collection for
system set-up, scripts for participant instruction, task start and end times,
and scoring guides.
Required reported results for each task include success/failure, time
to completion, and path deviation/error. We developed moderator guides
with clear start and end points within each task to support recording of
measures. For example:
1. Navigate to Julie's full medication list START
POINT and verbally state the name and
strength of the first medication on Julie's
medication list.
Task Success/Failure, Time A
2. Navigate to a place where you can update
drug information and change the Atorvastatin
dosage from 20 mg to 40 mg, using as much
information as necessary from Table 1, and
then verbally state when you believe you have
successfully completed this step.
Task Success/Failure, Time B
3. Navigate to a place where you can add a
medication to her medication list and add
Centrum Silver for Women, ibuprofen, and
Claritin using as much information as
necessary from Table 2. Verbally state when
you believe you have successfully completed
this task.
Task Success/Failure. Use case complete, Time
C.
TIME A+B+C = Total Task Time
Three potential points of failure (locate, modify &
record)
~ Page ! ~133](https://image.slidesharecdn.com/betterehr-151223134030/85/Better-ehr-134-320.jpg)


![9: Education & Training
Amy Franklin, PhD
The University of Texas Health Science Center at Houston School of Biomedical Informatics
ABSTRACT
Educating and training health information vendors on usability may
lead to better HIT and electronic records systems. We describe efforts to
develop usability education materials, including an introductory course
and a compilation of training resources.
INTRODUCTION
Usability is key to patient-centered cognitive support. A 2009 report
by the National Research Council found serious gaps in health
information technology, concluding patient-centered cognitive support
should play a central role [5]. The importance of HIT usability and
patient-centered cognitive support is evidenced by the Office of the
National Coordinator (ONC) for Health Information Technology's
requirement that EHR vendors certify their products' usability and safety
[6]. Electronic health records (EHR) vendors use, understanding or
appreciation of key usability principals, however, varies (see Chapter 5).
Usability education and training offers a potential solution.
Usability education can take many forms, from in-person didactics to
online courseware. EHR vendors may have an in-house group devoted to
user-centered design and employ rigorous safety-enhanced design (SED)
practices from product conception to delivery. Other vendors may have
only a few members dedicated to UCD and SED. Still others may have
no in-house expertise.
APPROACH
EHR vendor usability use and methods were surveyed and analyzed
(Chapter 5) and vendors potentially benefiting from usability education
identified. We conducted a search of existing courses, books, and public
or private educational usability training services. Resources primarily
targeted website development and physical product creation, appearing
~ Page ! ~137](https://image.slidesharecdn.com/betterehr-151223134030/85/Better-ehr-138-320.jpg)
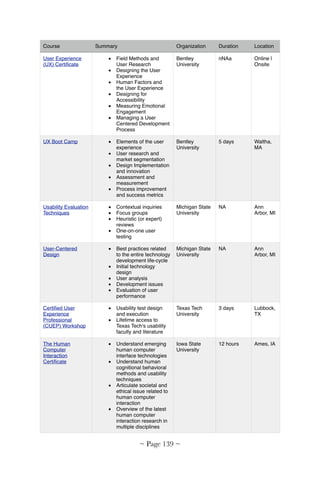
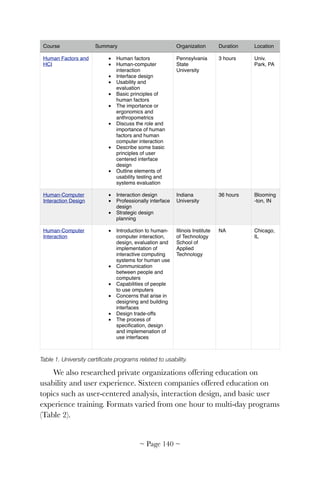
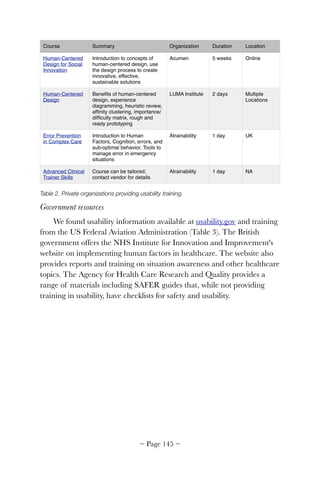
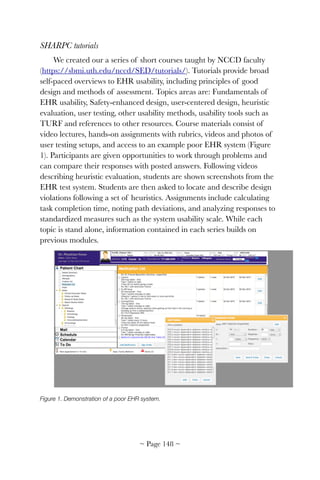


![10: Usability Experience
Survey
Yan Xiao, PhD
Baylor Scott & White Health
C. Adam Probst, PhD
Baylor Scott & White Health
ABSTRACT
We developed the Baylor EHR UX Survey, an instrument to
comprehensively assess the user experience (UX) of an electronic health
records (EHR) system. EHR UX is a function of many factors, including
technical infrastructure, system integration, optimization, user training
and support, and administrative policy. Ongoing UX assessment can help
prioritize scarce improvement resources. Our instrument was piloted in
six hospitals, then deployed in 11 acute care facilities. Survey responses
were received from 1,301 nurses, 202 physicians, and 228 pharmacists.
Combined with other user comments, survey results reinforced the
multifaceted nature of EHR UX, revealed opportunities for healthcare
organizations to improve UX, and highlighted EHR vendors' role in
improvement efforts. All are now available for all organizations looking to
improve their own EHR system.
INTRODUCTION
A majority of hospitals in the US have adopted electronic health
records (EHR) [160]. Studies indicate significant EHR usability
challenges (e.g., negative feedback from nurses, concern over patient
safety and work efficiency [161], which pressure hospitals to improve user
experience (UX). Unfortunately, improvement is often constrained by
healthcare organization resources and limited ability to redesign EHR
user interfaces. Usability data can help organizations focus on areas for
improvement. Systematic EHR surveys can also complement other
feedback, such as data from operations (e.g., downtime, screen update
delays and user responses to clinical alerts), observation and time studies,
suggestion boxes and unsolicited user comments.
~ Page ! ~151](https://image.slidesharecdn.com/betterehr-151223134030/85/Better-ehr-152-320.jpg)
![UX is an essential concept in user-centered design, encompassing a
user's perception of and response to using a product, system or service
(ISO 9241-210 [151]. Surveys have been used to assess technology
acceptance, functionality preferences and user satisfaction [162]. No
survey has been published, however, assessing aspects of EHR UX over
which hospitals have direct control, such as infrastructure, user support
and training.
We developed a survey instrument that provides information about
an EHR system as implemented within an organization. We also
developed a process to use the survey data to guide continuous
improvement and underpin collaborative opportunities with software
vendors. Our instrument was successfully deployed in Baylor Scott &
White Health (North Texas Division), a large integrated healthcare
system, and piloted by other organizations [163]. Results have guided
healthcare organization decisions on user training, functionality
development, documentation policies, and infrastructure improvement.
APPROACH
We formed a multidisciplinary team of experts in patient safety,
safety culture, human factors, survey design, statistics, nurse informatics,
medical informatics, pharmacy informatics and hospital administration.
The team reviewed the literature on user satisfaction surveys, user
experience, EHRs and computerized clinical documentation. Five tools
were identified, such as those by Edsall and colleagues [164] and Otieno
and colleagues [165]. We also consulted professional organizations,
including the Health Information and Management System Society
(HIMSS) for unpublished surveys.
EHR UX should be viewed as a socio-technical system—socio, in
that healthcare organizations have the power to directly influence facility
aspects of EHR UX, technical in that users can only indirectly impact
EHR software design. For example, installation of patient room
computers used by nurses to document and administer medications may
be installed in inaccessible locations (e.g., behind a couch) or with
inadequate space (e.g., in a closet too narrow for using a mouse pad)
(Figure 1). Facility redesign can alleviate these problems. EHR vendors'
software design, however, determines intrinsic functionality and user
~ Page ! ~152](https://image.slidesharecdn.com/betterehr-151223134030/85/Better-ehr-153-320.jpg)
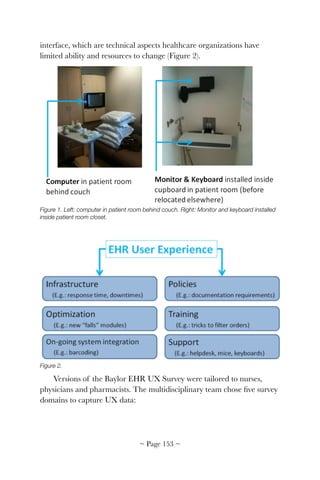
![comments. We judged the survey a success based on responses compared
with other surveys carried out in the organization.
Since nurses were surveyed in 2011 and 2013, it was possible to assess
changes in user experience. The nursing version of the Baylor EHR User
Experience Survey demonstrated good internal consistency (Cronbach's
alpha=0.72-0.76) based on the 2011 survey from 606 nurses (response
rate 36%) (Table 1). The instrument was published on the HIMSS
website for non-profit usage [166]. Greatest gains were in usability,
improved infrastructure, and enhanced support. Content layout and
ability to correct errors did not improve.
Free-text comments highlighted specific areas for EHR improvement,
including medication administration records and referral management.
Text also included comments on changes made to the EHR and about
learning to use the EHR.
Workgroups for the three targeted users (nurses, physicians, and
pharmacists) were formed to study survey results and prioritize adding
new or modifying existing functions. The survey, thus, became a platform
for communicating healthcare organization EHR needs to their EHR
vendor. Nursing policies were examined to understand discrepancies
highlighted by survey results. User-centered design principles were
introduced to assess readiness of new modules prior to going live.
DISCUSSION
Implementation of an EHR system is complex and challenging.
Costs of initial acquisition, change management, user training, continual
improvement and on-going maintenance are high [167]. It is important
to describe how survey results will be used early in the process and to
include all stakeholders early in the solution, including administration
officials. We found involving executive leadership important to the
success of our survey.
As much as vendors should be held responsible for delivering highly
usable products, healthcare organizations hold many keys to a positive
user experience. EHRs, unlike isolated software applications or consumer
products, are part of a complex system of technology, professionals,
policies and other interacting components. Refresher training, for
~ Page ! ~155](https://image.slidesharecdn.com/betterehr-151223134030/85/Better-ehr-156-320.jpg)
![example, was identified in the survey as an important need for users who
have initial experience and would like to learn techniques that can
improve their productivity. Hardware maintenance is a constant
challenge given the number of devices deployed among dispersed
geographical areas in a typical hospital. Documentation may be
challenged by user interfaces, unclear expectations, variance in practices,
and suboptimal access to computers. A survey is an excellent tool to
systematically sample a large number of users, especially at multi-hospital
healthcare organizations. Taking a socio-technical perspective allows
assessing user experience from multiple perspectives (user and vendor),
building a foundation upon which improvements can be made.
Among all tools, EHRs consume the most clinicians' time [168].
Measuring UX and improving UX should be a top priority in all
healthcare organizations. As more organizations measure their own user
experience, it will be instructive to compare results. Vendors should be
invited to analyze survey results and work closely prioritizing their future
software improvement efforts.
SUGGESTED READING
Staggers, N., Rodney, M., Alafaireet, P., Backman, C., Bochinski, J.,
Schumacher, R. M., & Xiao, Y. (2011). Promoting Usability in Health
Organizations: Initial Steps and Progress Toward a Healthcare Usability
Maturity Model. https://www.himss.org/files/HIMSSorg/content/files/
HIMSS_Promoting_Usability_in_Health_Org.pdf
ACKNOWLEDGEMENT
The authors writing for the Baylor EHR User Experience Survey
team included Donna Montgomery, BSN, MBA, RN-BC; Lindsey M.
Philpot, MPH; Sunni A. Barnes, PhD; Jan Compton, BSN, MSHA, RN;
Donald Kennerly, MD, PhD; Jeff Kerr, MD; Joseph Schneider, MD;
Lynn Finck, RN; David Watson, BS, RPh. The authors thank
contributions from Drs. Linda Harrington, Jiajie Zhang, and
Muhammad Walji, as well as nurses, physicians, and pharmacists. Results
of the nursing version of the survey originally appeared in the Journal of
Nursing Administration.
© 2014 Yan Xiao, C. Adam Probst
~ Page ! ~156](https://image.slidesharecdn.com/betterehr-151223134030/85/Better-ehr-157-320.jpg)

![a new evidence-based approach to HIT in which healthcare leaders
decide and plan the appropriate role of computing for their clinics.
INTRODUCTION
One of the most important goals of health information technology
(HIT) is to improve the way clinicians can perform healthcare [169, 170].
Based on recent analyses, however, the goal is not being achieved [170,
171]. Two of the most important challenges to HIT are problems with
workflow and usability [170, 172].
Synchronizing information flow and workflow is a key principle for
HIT effectiveness, quality and usability [7]. HIT users are faced with a
dilemma when information flow does not support an appropriate
workflow of care: either compensate and perform unplanned overhead
tasks by modifying their information environment or follow a sub-optimal
workflow to conform to the way their HIT applications provide
information [79]. Unplanned overhead is more than just extra work that
interrupts clinical care; it can disrupt users' cognition, inhibit
coordination among team members, and even obscure their
understanding of tasks [37, 39]. It is a form of usability problem that
places ease-of-use in opposition to patient safety [173, 174]. A well-
designed HIT application with good usability will make the routine
performance of safe, efficient and effective care procedures the easiest
course of action.
When HIT design decisions are not directly related to the values of
better care, the design can be dominated by issues of technical feasibility,
schedule or cost. The resulting applications can have the unfortunate
effect of rearranging clinical workflow by accident rather than by design
[78, 175]. Conversely, understandable evidence about HIT's measurable
benefits to care will result in increased adoption and productive.
To close the gap between the flow of health information and the
workflow of clinical care we developed a comprehensive new design
method called MATH (Modeling & Analysis Tools for Healthcare) to
integrate three fundamental elements that are currently disjoint:
workflow models of how clinical care is actually performed and the areas
where improvement is needed, options for how HIT should improve
~ Page ! ~160](https://image.slidesharecdn.com/betterehr-151223134030/85/Better-ehr-161-320.jpg)
![workflow in measurable ways, and software specifications for rapid
implementation.
MATH is supported by a suite of tools.
• MATHflow for capturing, analyzing and integrating workflow and
information flow,
• An information dictionary created while modeling workflow with
MATHflow, and
• MATHsim for discrete-event simulations and formative evaluation of
HIT options.
MATH is an evidence-based approach that makes measurable,
predictable workflow improvement integral to HIT design.
Cognitive science principles
The term "information system" is something of a misnomer because
work is executed not only by computers, but also by the cognitive and
manual procedures of human users. Further, HIT applications typically
play a support role as they are used in a clinical workflow with many
important manual tasks of care and administration.
The integration of manual tasks and computer-performed tasks is
critically important for HIT effectiveness and usability [175].
Information resources, like many other types of resources, constrain the
way clinicians can use them to perform care. Research from cognitive
science [37, 39] and software design [27, 78, 176] consistently
demonstrates that content, organization and representation of
information inherently impose powerful constraints on the way users are
able to perform their tasks. The constraints are widespread and powerful.
They affect users' procedures and even their cognitive strategies for
performing tasks [39]. Cain and Haque described how HIT implicitly
imposes workflows upon nursing [177]. White and Miers argue that the
software of information systems embody a model of workflow, whether
or not that workflow was understood and planned [178]. Further,
unplanned tasks may be added to the workflow in an accidental manner
when users have to deal with design-induced errors [173, 179] caused
when properties of information do not match the needs of a task.
~ Page ! ~161](https://image.slidesharecdn.com/betterehr-151223134030/85/Better-ehr-162-320.jpg)
![HIT developers may be reluctant to accept responsibility for
constraining the way clinicians work with their applications, but taking a
neutral design stance is mistaken. Information resources, like many other
types of resource, constrain the way they can be used to perform work.
Constraints on information-dependent work are inherent to complex
HIT applications. The only question is whether the workflow impact of
an HIT application will be understood and planned as part of systems
design, or that its impact will be accidental and discovered after
deployment.
APPROACH
MATH capitalizes on two established software standards: the
Business Process Modeling Notation (BPMN) standard for modeling
workflow [178], and the class and state diagrams of the Unified
Modeling Language (UML) to model HIT information architecture [180,
181]. Originally popularized for web design, information architecture is a
powerful, non-visible dimension of usability for both mobile and client
platforms. Information architecture is, therefore, a key part of software
design, defining an application's body of content, and how it is organized
for end-users [182].
The traditional way to reduce undesirable HIT impact on workflow
was to make conservative, incremental improvements to existing
information systems. This cautious approach, however, can easily fail to
exploit the full potential of HIT or achieve benefits to justify significant
costs. Our use of standards develops well-defined models of workflow
and of information architecture. As the paired models are being
developed we can understand the implications of design decisions for one
on the other, so their respective designs can converge. MATH's high-level
design goal is for workflow and HIT to function as a pair of well-
matched, complementary components to improve the performance of
care in a predictable manner.
MATHflow
The core capability is MATHflow, a visual diagramming tool that
captures the existing workflow and information resources in such a
manner to reveal how care should be improved with HIT. There is
growing interest in workflow models as a tool to analyze and design HIT
~ Page ! ~162](https://image.slidesharecdn.com/betterehr-151223134030/85/Better-ehr-163-320.jpg)
![[183-188]. Carayon, et al., argued that HIT necessarily involves
workflow, but little is known about how to integrate the two [184].
MATHflow allows us to analyze how an HIT application will impact
workflow by replacing, augmenting, or complementing important manual
activities of care, then evaluating the resulting model. MATHflow models
can also explicitly represent the overhead tasks of using HIT so we can
identify and minimize them.
MATHflow is independent of any specific EHR. It is based on the
Object Management Group's recent standard for Business Process
Modeling Notation [178]. The standard for BPMN has been widely
adopted for software requirements to support manual work by teams of
people. Our use of standards, therefor enables interoperability with other
tools, such as workflow engines, external simulation and analytic tools.
Innovation for information modeling
MATHflow's integration of workflow modeling, physical resources,
and the use of information resources is different than of workflow
diagrams. One of MATHflow's major innovations is to increase the
expressiveness of BPMN 2.0 by implementing a small set of modeling
constructs that increase modeling power while simplifying the models.
The extensions provide more flexibility and yet easier modeling of
information resources, including HIT systems. BPMN comes with three
types of Information Artifacts: Document, Annotation and Group.
MATHflow has extended the set with three types of Information
Resources:
1. Person, such as a patient or a colleague providing information,
2. Information System, such as an EHR or other HIT application, and
3. Part, such as equipment that provides EKG, blood pressure, etc.
This extended set reflects the richness of information resource types
commonly used in a clinical environment that must be explicitly
documented in order to understand the complete flow of important
information. MATHflow distinguishes the access properties of different
types of information resources. For example, the contents of a Document
can only be used by clinicians in the immediate vicinity. In contrast, the
~ Page ! ~163](https://image.slidesharecdn.com/betterehr-151223134030/85/Better-ehr-164-320.jpg)
![contents of an Information System can be shared electronically by a
clinician in any location with a suitable device and access privileges.
MATHflow builds an information dictionary that models
information resources as objects and their contents as attributes, creating
a record of the information requirements of a workflow. The tasks in
MATHflow have an editor for entering the information requirements in
terms of the information attribute that is needed and the resource that
provides it, which are then recorded automatically in the dictionary.
Another innovative extension of BPMN are complex decision gates.
MATHflow's information dictionary tracks the relationships among tasks,
information resources, the information attributes they contain, and any
specific values for attributes. These data structures allow values of
attributes that are set in one part of a workflow to be used in the decision
logic of gates in other parts of a workflow. Complex decision gates allow
much more realistic and complex information flows to be modeled than
conventional workflow tools.
MATHflow can also model relationships between information
resources. MATHflow has integrated UML class diagrams with BPMN
in order to model user definable information resource artifacts and their
relationships. In essence, researchers can model any HIT system to
analyze how it will impact workflow as an information system.
Innovation for formative evaluation and analysis
MATHflow's new capabilities to integrate information modeling with
workflow allow the MATH method to make trade-off analyses between
better information resources for less need of physical resources, such as
the labor of highly skilled clinicians. These analyses provide valuable,
formative evidence about the HIT impact during the design stage of a
project to guide decision making about HIT functionality.
The MATH method
MATH documents how care is currently performed with existing
information resources, identifies problems and how they can be mitigated
or eliminated, with a focus on better designed HIT (Figure 1). The first
step of MATH is similar to popular process improvement methods [189],
but the rest of MATH is a variant of "concurrent engineering" in which
~ Page ! ~164](https://image.slidesharecdn.com/betterehr-151223134030/85/Better-ehr-165-320.jpg)
![multidisciplinary teams collaborate on a common design objective [190].
MATH iteratively combines "patient-centered design" with conventional
"technology-centered design." The objective is a pair of matched designs
that work smoothly together as: 1) a measurably better workflow of care,
and 2) a cost-effective, highly usable HIT application whose information
flow maps to the needs of the better workflow.
Figure 1. The MATH method.
Step 1 is an observational study that applies ethnographic methods to
discover, model and understand how clinical care is currently performed
using existing information resources. This produces the dictionary of the
information required to support it and identifies awkward workflows and
problems.
Step 2 is an analysis of HIT options to address problem areas, such
as information organization or sequence that does not match workflow,
presentation format does not match tasks, information degraded because
diverse resources must be integrated manually, or excessive user attention
to control existing HIT functionality.
Steps 3 through 6 progress through several iterations. In Step 3 we
analyze the information architecture for each option. The information
~ Page ! ~165](https://image.slidesharecdn.com/betterehr-151223134030/85/Better-ehr-166-320.jpg)
![architecture defines the content and organization of a body of
information needed to support the workflow. MATH analyzes the
information architecture for each option in Step 3. It can be readily
translated into key software specifications using UML [180, 181],
establishing a connection between the workflow benefits of HIT and its
technical feasibility and cost.
Step 4 uses formative evaluation to compare at least two options: "as-
is" and a proposed "to-be." A key principle of evidence-based HIT is that
computing functions should be prioritized on the basis of their impact on
better care. The evidence of improvement should be the benefits to
workflow, such as gains in the quality or efficiency of care. In our
experience, user participation in this step can quickly generate ideas for
several to-be options. We organize these into several coherent options
from Steps 2-3 and estimate the dimensions and magnitude of
improvement for each. The results provide valuable formative evidence
about beneficial impact on workflows of clinical care.
Step 5 considers each HIT option's technical difficulty, time to
availability and cost. These are the typical decision making factors in
conventional design, but they should be weighed against their impact on
the efficiency and quality of care to select the best option.
Step 6 transitions responsibility for prioritizing the options to the
clinic's leadership, stakeholders, and information technology staff. We
facilitate their analysis to rank order the options based on their values for
patient care. The analysis weighs the trade-offs of three factors for each
option: 1) the value of care improvement, 2) the technical risk, and 3) a
cost estimate for the project to acquire or implement each option.
MATH enables researchers working with care stakeholders to
capture workflow improvements and connect them to HIT design. This
connection enables design trade-offs between the added value of an HIT
system in terms of impact on the quality or efficiency of clinical
workflow, and HIT technical implementation factors, such as feasibility,
risk, cost and schedule. MATH addresses three of the Institute of
Medicine's dimensions of quality: patient-centered, efficiency, and
timeliness [3]. MATH closes the gap in conventional methods by
integrating the capture of how clinical care is actually performed, the
options for how it could be improved in measurable ways if supported by
~ Page ! ~166](https://image.slidesharecdn.com/betterehr-151223134030/85/Better-ehr-167-320.jpg)
![better HIT applications, and the algorithms, data, and user interface
concepts of those applications. A benefit of bridging the gap between
workflow and the design and HIT is reduced cost and time for software
development.
MATH provides a methodical and understandable means for
stakeholders to direct strategic, cost-effective workflow improvements [27,
78]. A feasibility study illustrated how increased insight into the workflow
and information flow of a large primary care center resulted in a
predictable and measurably better workflow.
Feasibility demonstration
We applied the MATH method, tools and techniques in a study at a
primary care clinic in the Puget Sound region. In collaboration with
VHA Medical Informatics and clinicians, our team of analysts followed
the MATH method to:
• Develop an as-is workflow model of how care was practiced using
existing information resources,
• Analyze how workflow could be improved with better HIT,
• Perform formative evaluations to predict the HIT impact on a to-be
workflow,
• Build and test an alpha version of HIT software and compared
results with MATH predictions.
Modeling and analysis took about sixteen hours of semi-structured
interviews and observations with providers and nurses. Thirty hours were
spent for model-building, analysis, and design. The design was then
implemented in an alpha version of software, tested in a summative
evaluation that took another 22 hours of subject interviews, and 20 hours
of software testing by subjects.
Evidence-based HIT requires understanding the way clinicians
currently perform care so that improvements can be identified,
prioritized, and incorporated into design of a better system. Figure 2
shows the top-level MATHflow model of current practice for patient
visits to a primary care clinic in the Puget Sound region. Patients arrive at
the clinic in the upper left corner of the diagram. Patients follow one of
~ Page ! ~167](https://image.slidesharecdn.com/betterehr-151223134030/85/Better-ehr-168-320.jpg)
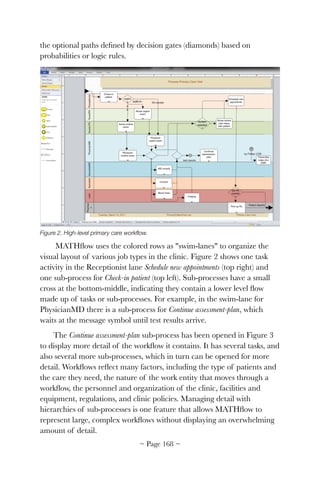
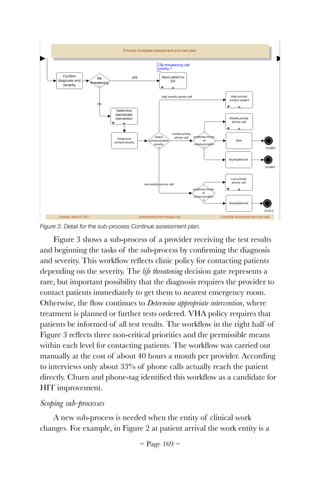
![patient's visit registration. Other sub-processes in Figure 2 have entities
for patient exams, treatment plans, and lab tests. These are distinctly
different and the scope of each sub-process must account for the
transformation of its work entity to its goal state. For example, the sub-
process for a lab must account for how the entity of a blood draw is
transformed to the goal state, which is a lab test report. Importantly,
MATH can also model and analyze HIT support for work entities that
are conceptual, such a diagnosis, or a treatment plan [29].
A workflow is also constrained by resources, including information
resources. The initial as-is MATHflow model of the clinic captured how
care was actually performed and how that was constrained by the context
and availability of resources, including physical resources and
information resources, as shown in Figure 4. Our focus is to understand
current workflow to determine how HIT should improve care. But we are
primarily focused on modeling workflow at the level of detail that reveals
how information is accessed, used, changed and recorded.
Capturing information flow
The flow of information is not identical to the workflow of clinical
care. Patients, tests, diagnoses, treatment plans, etc. are some of the
entities that flow through clinical care. In contrast, information about
them flows in and out of care activities, which can change it.
Most diagramming tools for software are aimed at creating elegant
design solutions, as opposed to the complex, and often informal way that
healthcare is actually performed. MATHflow represents information that
is distinct from, but related to clinical workflow, providing the flexibility
needed to capture the way care is actually performed with information
resources. All the information resources that are used in a clinic must be
documented, whether they are physical or electronic. In a clinical
environment the information resources may include media that are
paper, digital, mechanical equipment or analog instruments. Information
resources also include people, adding complexity that may overwhelm
conventional modeling languages. Doctors and staff may play the
multiple roles of labor resource or information resource. Further adding
to the complexity, the patient may have multiple roles: as an entity of
care, as an actor for self care; or as an information resource.
~ Page ! ~170](https://image.slidesharecdn.com/betterehr-151223134030/85/Better-ehr-171-320.jpg)
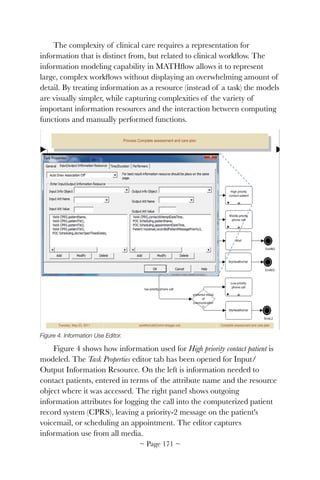
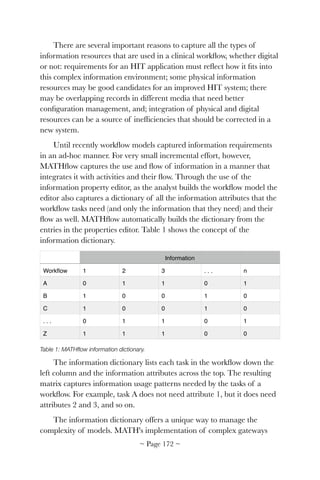
![differs from the BPMN standard, since the standard does not share
MATH's concept of information resources. MATHflow has complex
decision gateways that can check the value of an information variable in
the dictionary, and then select which outgoing flow to take based on its
value. This allows activity in one sub-process to determine the behavior
in another without drawing long flows across pages. The dictionary, thus,
becomes the connection between HIT improvements and care workflow.
MATH allows us to analyze how an as-is model of workflow can be
improved by changing the resources that provide information. This
innovation has the added benefit of representing both manual tasks and
HIT tasks in the same notation, which is key for integrating HIT into
workflow improvements. Rather than focusing on the features of HIT it
is treated as an information resource that supports or performs tasks.
Analyzing options for improvement
Our study of the clinic identified a significant problem area and lead
to the design of measurable improvement. Using MATH led to
important understanding of the demographics and the context in which
care takes place. For example, the VA offers web-based MyHealthEvet
for access to veteran health benefits and services, but clinic personnel
estimated that only about 10% of their patients use it. In addition, the
patients of this clinic typically have multiple comorbidities and complex
treatment plans. Consequently, providers wanted to talk with patients to
check how well they could carry out new orders. Recent surveys show a
strong preference for real-time phone conversations with providers when
new orders are issued [191, 192].
The new workflow enabled by the new HIT application is shown in
Figure 5. The unproductive activity (right half of Figure 3) has been
replaced with an software product named Priority Contact, which won an
award in the national challenge competition SMART Apps for Health
[193]. Priority Contact was designed to interact with EHRs by reading and
writing data via the new SMART Connect interoperability standard,
while running on its own, separate web server to allow maximum
functional flexibility.
~ Page ! ~173](https://image.slidesharecdn.com/betterehr-151223134030/85/Better-ehr-174-320.jpg)
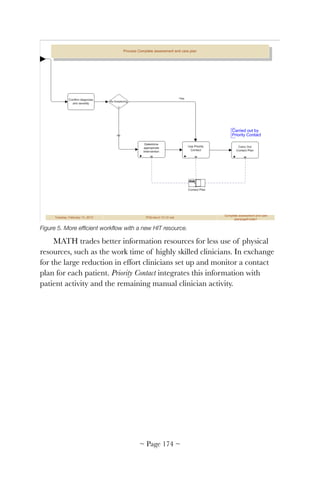
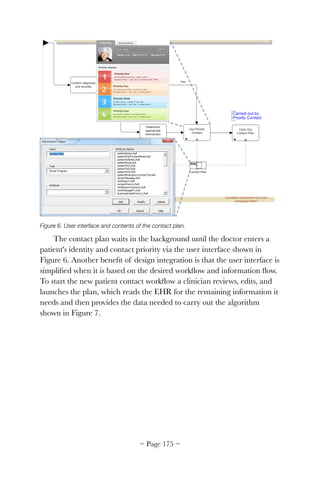
![Figure 7: Algorithms derived from workflows.
Figure 7 shows how the as-is workflow of manual activities was
translated into an algorithm that is now carried out by the patient,
clinicians, and the software agent. The algorithm was derived from the
as-is workflow. They accomplish the same purpose but far more
efficiently by integrating HIT functions and automation with manual
tasks. Priority Contact does not replace important real-time conversations
between clinicians and patients (represented by the four sub-processes on
the far right). It enables them to happen more quickly, with less
frustration and wasted effort. The system can handle urgent, Priority 1
contacts by calling multiple phones simultaneously and repeatedly until
the physician is notified that one of the phones answers or calls back.
Principles of formative evaluation
Developers need guidance during the design stage of HIT for their
project to reliably benefit clinical care. The importance of evaluating
HIT applications for their impact is well established [194, 195], but
conventional methods require some version of the software to evaluate
impact. This has traditionally meant conducting evaluations after the
major design decisions of an application were already decided, so the
~ Page ! ~176](https://image.slidesharecdn.com/betterehr-151223134030/85/Better-ehr-177-320.jpg)
![results had to wait until the next version of the software. Little could be
done to improve any fundamental design problems during in the
intervening months or years while clinicians dealt with unplanned
overhead and risk of errors. Evaluation needs to provide feedback before
a project has reached the point where it is too expensive or difficult to
make major changes.
The growing use of usability evaluation like TURF (Chapter 6) is an
example of how formative evaluation can provide timely feedback to
improve user interfaces [7]. MATH's focus on achieving synchrony of
workflow and information flow complements TURF's deep focus on
individual user interface designs. By moving the evaluation of workflow
impact much earlier in the HIT life-cycle MATH can "build-in" the
benefit of HIT through model-based design iterations.
Formative evaluation for quality
Clinicians were able to understand and critique MATHflow
diagrams with minimal training. They performed exhaustive manual
model checking to evaluate the quality of to-be workflows were
conductive using the cognitive walk-through technique [36]. Clinicians
and developers worked in joint sessions to review every path and drill-
down into sub-processes for correct conformance with appropriate care,
efficiency, and feasibility. As shown earlier in Figure 6, user interface
images could be linked to tasks in MATHflow to make the evaluation
more tangible.
An important patient safety criterion was a workflow that allowed
clinicians to maintain positive situation awareness until the need to
contact the patient was resolved, e.g., "What should happen if the patient
does not have voicemail, or nobody checks it?" When either a provider or
a developer recognized a problem they negotiated by suggesting other
options, then checking if it worked from both perspectives.
Another key part of the walk-through was the flow of information, as
depicted in Figure 8. The integration of human tasks and those
performed by Priority Contact was mediated by the common use of
information objects: i.e., both HIT and the human users operate on the
same information objects, but with a more appropriate allocation of
~ Page ! ~177](https://image.slidesharecdn.com/betterehr-151223134030/85/Better-ehr-178-320.jpg)
![responsibility. Figure 8 illustrates how MATHflow makes the information
requirements explicit for review by both clinicians and developers.
Figure 8. Information used by tasks in the to-be workflow with Priority Contact.
Formative evaluation for efficiency
The property sheets of tasks include tabs for Time/Duration and for
the Performers of a task. They allow MATHsim to analyze an important
trade-off: less use of labor resources for access to better information
resources.
MATHsim is a discrete-event simulation engine [37] that is integrated
with MATHflow. It reads models from a MATHflow database, and
performs Monte Carlo simulation to measure the performance of the
models under user-supplied workloads, allowing multiple models to be
compared against one another. The results are quantitative distributions
of task times and resource usage. MATHsim first provided a baseline for
the as-is model, then evaluated the impact of different options for Priority
Contact.
MATHSim runs several independent trials, each of which contains
process instances that may interfere with another's operation. Monte
~ Page ! ~178](https://image.slidesharecdn.com/betterehr-151223134030/85/Better-ehr-179-320.jpg)
![Carlo uses a pseudo-random number generator. Process state is
maintained by a discrete event queue.
MATHSim runs several independent trials, each of which contains
several process instances that may interfere with one another's operation.
MATHsim uses a strong pseudo-random number generator, and the
process state is maintained by a discrete event queue [196].
MATHsim executes a computer-based simulation by generating all
possible workflow and information resource combinations to estimate
important performance statistics, such as the distribution for how long a
workflow will take or how much time it will require from a given type of
resource, such as a doctor. One of the key innovations of MATHsim is
that makes appropriate distinctions between the constraints for using
digital information resources vs. physical information resources.
Figure 9 shows MATHsim's formative evaluation that compares the
number of clinician hours required for the workflow to contact 100
patients about test results with thirty replications to approximate a
normal distribution around the modes.
Figure 9. Comparison of monthly hours spent contacting patients.
The comparison of as-is and to-be in Figure 9 was evidence of a
promising advantage of about 26% time savings for a workflow using
~ Page ! ~179](https://image.slidesharecdn.com/betterehr-151223134030/85/Better-ehr-180-320.jpg)
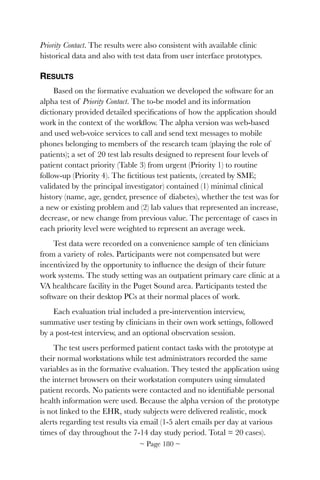
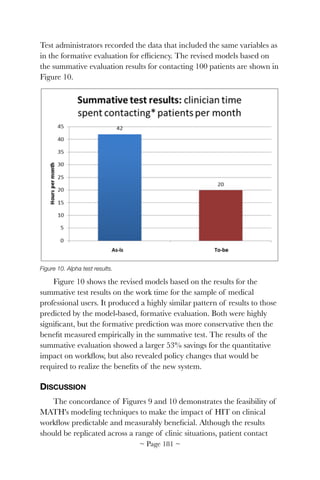
![represents a considerable scope integrating HIT functions with
automated functions, communications and manual activities of clinicians
and patients into a coherent, efficient workflow, with error handing for
patient safety.
The patient contact project is currently at the step for Feasibility and
Cost Analysis (Step 5 in Figure 1). An earlier prototype won an award
using the common SMART Apps API to access test patient records [38].
For ethical reasons the alpha study used graduate students acting as
patients. The promising results of the feasibility demonstration should
justify additional investigations leading towards widespread adoption.
The alpha version of Priority Contact is made up of web services that allow
for flexibility and customization. Data interoperability, however, is not
only a technical issue. Policies about security and permission have to be
negotiated. So, the value of the benefit will be weighed against the
difficulty of changing policy or getting exception to it in the Trade-off
Analysis (Step 6).
Although we cannot make claims about causality on the basis of one
study, the accuracy of the predictions was certainly based in large part on
the level of detail in the workflow models. The to-be workflow was
planned as part of the design and task time estimates for clinicians
included data from testing user interface prototypes, three-point estimates
from subjects and estimates based on similar tasks. Team member skills
and the enthusiastic participation by clinicians factored in the study's
success.
The main methodological conclusion is that a systems modeling
approach using MATH can work well to discover how HIT should be
applied to improve the workflow of clinical care. MATH adds value in
several distinct ways:
Information modeling
Workflow models can serve as a heuristic to increase the accuracy for
identifying the information that is actually used. A workflow can add
important context that aids recollection of information use, as compared
to conventional methods, such as focus groups. Workflow modeling also
reveals inconsistencies or gaps in our understanding of information use,
which can be addressed in follow-up interviews or observations. Also, by
~ Page ! ~182](https://image.slidesharecdn.com/betterehr-151223134030/85/Better-ehr-183-320.jpg)
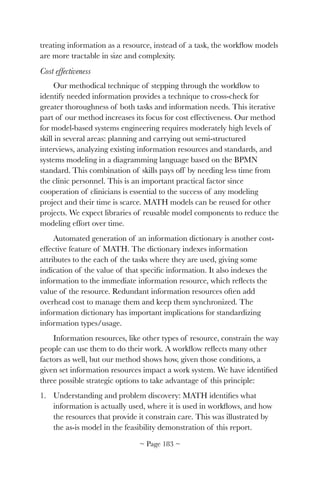
![Consolidation and explanation
A total of 303 guidelines were categorized into 14 heuristic principles
[57] with illustrative examples and cross-category references.
Consolidation occurred via group discussion using inter-rater methods to
resolve duplicates and overlapping guidelines from multiple sources of
documentation and to classify guidelines into an established coding
scheme.
We used the heuristics developed by Zhang, et al [57] as our coding
scheme and generated 14 heuristic-specific reports listing applicable
principles with examples.
RESULTS
Our Medline search returned 25 articles. After reading each title and
abstract, none was considered "potentially relevant" to EHR system
design. Google and Google Scholar identified 23 documents. Through
group discussion, experts suggested two additional documents as
"potentially relevant" that were not identified by our search strategy:
white papers and industrial brochures that lacked explanations and
validation processes.
We excluded articles that were either rules of thumb or
reorganizations of established guidelines. Four documents from reliable
sources were selected for general guideline compilation (Table 1).
Table 1. General features of qualified guideline documents [197-200].
Year Title Domain Volume Method
2001
113 Design Guidelines for
Homepage Usability
General
26 categories 113
guidelines
Empirical
study based
2006
The Research-Based Web Design
& Usability Guidelines
General 209 guidelines
Expert
review
2012
Microsoft Health Common User
Interface Guidelines
Health
33 categories with
thousands
guidelines
Expert
review
2012
A Human Factors Guide to
Enhance EHR Usability of Critical
User Interactions when Supporting
Pediatric Patient Care
Health
9 categories of
recommendations
Expert
review
~ Page ! ~190](https://image.slidesharecdn.com/betterehr-151223134030/85/Better-ehr-191-320.jpg)
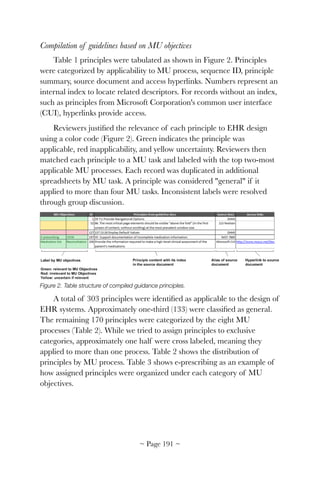
![Table 2. Distribution of principles by MU objectives.
The majority of results retain their original section or sequential
number under the Principles column. Original numbers are locators for
retrieving principle details in corresponding source documents. Because
guideline principles extracted from Microsoft's CUI do not carry
numbers [200], we added hyperlinks to source files. The numbers
attached to Principles from other source documents include:
• DHHS – the format of numbers is (A B: C) – A is page number, B is
chapter number and C section number [198].
• 113 Nielsen – the format of numbers is (A) – A is the sequence
number [197].
• NIST-7865 – the format of numbers is (A) – A is the sequence
number in an aggregated table of guidelines [199].
MU objectives
Number of principles that fit into this
category (may overlap)
Medication list 8
Drug-drug and drug allergy interaction
checks
25
Medication allergy list 25
E-prescribing 55
CPOE 64
Clinical decision support, 12
Electronic medication administration record 13
Clinical information reconciliation 45
~ Page ! ~192](https://image.slidesharecdn.com/betterehr-151223134030/85/Better-ehr-193-320.jpg)
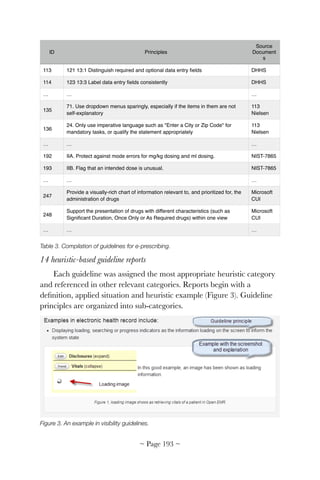
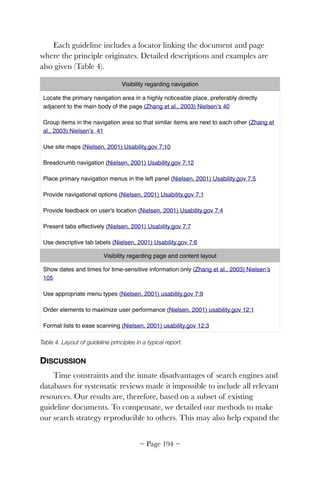


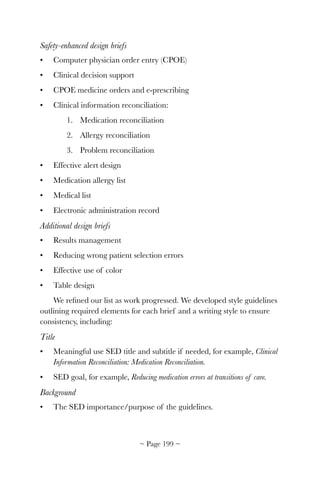
![Figure 1. Draft SED Brief distributed to team members as a template.
We created a to-do list in Basecamp for each SED brief and assigned
responsibilities. Because some briefs were obtained from other ongoing
SHARPC projects, briefs were prioritized by project status. Briefs
dependent on results of SHARPC work not yet begun were placed on
hold. Basecamp allows users to upload files and create discussions
organized by to-do. This feature allowed us to track progress and
Clinical Information Reconciliation: Medications
Preventing Medication Errors at Transitions of Care
To learn more:
For more details and background see: a Short Paper , a Video demonstration, or a Usable Prototype.
Background: Accurate
medication reconciliation
at transitions of care can
reduce medication related
adverse events, thereby
decreasing the chance of
costly complications.
Reconciliation involves
comparing two or more
lists of medications (such
as a home list and in
patient list) to determine
the appropriate meds for a
patient.
GUIDELINES
Screen and interaction design:
• To help compare medications across lists
1. Visually indicate Identical, similar, functionally similar, and unique drugs
from each list by using spatial proximity and/or color
2. Display medications that need to be compared close together
3. Highlight differences between similar medications
4. Use visual properties (such as font size) to make the most important
elements (such as the name) of medications the most salient.
5. Show brand and generic names, such as Atorvastatin (Lipitor)
6. Allow users to group medications by therapeutic intent
7. Provide a way for users to see the ingredients in compound drugs
8. To minimize alert fatigue and improve efficiency and quality, display information
such as medications that are on the patient’s insurance, medication interactions,
side effects, allergies, etc.
9. Display medication information as: Generic (Brand Name), Dose and dosing unit,
route, frequency, for indication xxx. (Atorvastatin (Lipitor) 80 mg by mouth at bedtime
for high cholesterol.)
10. NEVER use error-prone medication abbreviations (e.g., AD, OD, QD), symbols, or
dose designations (see http://www.ismp.org/tools/abbreviations/)
11. Follow table design guidelines
12. Follow color use guidelines
DRAFT – June 17
2013
6. Meds may be grouped by
therapeutic intent
1. Columns show unique, similar and identical drugs
2. Similar
medications are
shown on the same
line
3. Differences of
similar meds are
highlighted in
yellow.
Hovering over a
med highlights it
and any similar
meds
4. Med names in
bold and on
separate line from
other details
5. Generic and brand names are shown for all meds [WE
NEED TO MODIFY PROTOTYPE TO SHOW BOTH]
~ Page ! ~201](https://image.slidesharecdn.com/betterehr-151223134030/85/Better-ehr-202-320.jpg)
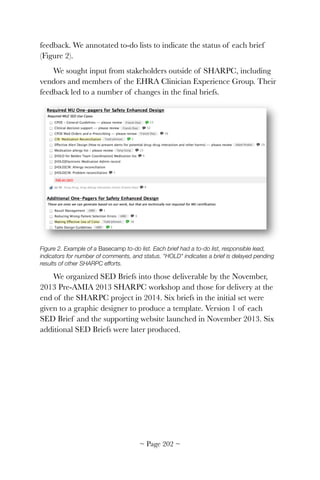
![14: EHR Design eBook
Inspired EHRs: Designing for clinicians
Jeffery L. Belden, MD
University of Missouri-Columbia
Nathan Lowrance, MS
University of Missouri-Columbia
Jennifer Patel
Involution Studios
Richelle Koopman, MD, MS
University of Missouri-Columbia
Joi Moore, PhD
University of Missouri-Columbia
Catherine Plaisant, PhD
University of Maryland
Todd Johnson, PhD
The University of Texas Health Science Center at Houston School of Biomedical Informatics
Juhan Sonin
Involution Studios
ABSTRACT
We produced Inspired EHRs: Designing for Clinicians, a clinically-
inspired electronic health records (EHR) usability design guide eBook.
Richly illustrated and interactive, Inspired EHRs is based on feedback from
an expert advisory panel and the EHR vendor community. eBook
chapters cover medication lists, medication allergy lists, medication
reconciliation, ePrescribing, computerized provider order entry, drug
alerts, clinical decision support, human factors, and usability design
principles. Inspired EHRs was sponsored by the California HealthCare
Foundation and SHARPC and released June 30, 2014 at
InspiredEHRs.org.
INTRODUCTION
Electronic health record (EHR) systems' potential to improve the
coordination and quality of healthcare is widely recognized [4, 10, 201].
~ Page ! ~207](https://image.slidesharecdn.com/betterehr-151223134030/85/Better-ehr-208-320.jpg)
![Impaired EHR usability however, frustrates many users [17, 142, 202].
Learnability, efficiency, and cognitive load are frequent barriers. Current
EHR designs may not incorporate visual design psychology, cognitive
science, and usability best practices. Healthcare providers are acutely
aware that their information needs are not being met, but do not know
why. American healthcare is a complex socio-technological system.
Information structures, needs and workflow often vary by institution.
Displays optimized for healthcare providers may fail for patients and
caregivers, and vice versa. Instead of improving healthcare, many EHR
systems reduce physician productivity and efficiency, and endanger
patient safety by making information opaque, hard to find, or misleading.
Human factors specialists and visual designers apply cognitive and
visual perception science to produce better products. Numerous articles
about user interface design [56, 203], data visualization [204, 205] and
human perception [206, 207] have been published, but outside of health
information technology and, therefore, lacking clinical perspective. We
developed Inspired EHRs: Designing for Clinicians, [4] an interactive guide
based on expert design principles and recommendations by the American
Medical Informatics Association (AMIA) EHR Usability Task Force
Report [147]. Many EHR usability studies are research-centric [208-210]
or policy-driven [161, 211-213]. Inspired EHRs models EHR system
design and health information displays that foster efficient, safe, patient-
centered care. Our objectives were to:
1. Create an interactive eBook of common design patterns that
incorporate EHR patient-safety functions identified by the Office of
the National Coordinator, including medication lists, medication
allergy lists, medication reconciliation, ePrescribing, computerized
provider order entry (CPOE), drug alerts, clinical decision support,
human factors, and EHR usability design principles.
2. Incorporate EHR vendor input and feedback.
3. Promote the guide through Health Information Management
Systems Society (HIMSS) Electronic Health Records Association
(EHRA) publicity and educational channels, the EHRA Clinician
Experience Workgroup, HealthIT.gov, sponsor web sites, physician
specialty societies, press campaigns, and social media.
~ Page ! ~208](https://image.slidesharecdn.com/betterehr-151223134030/85/Better-ehr-209-320.jpg)
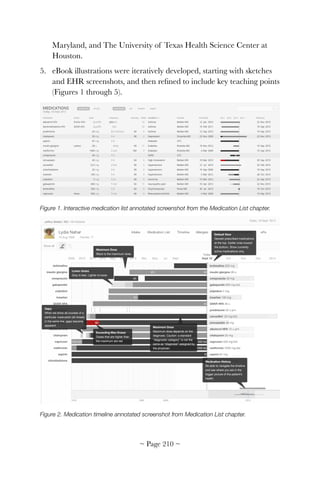
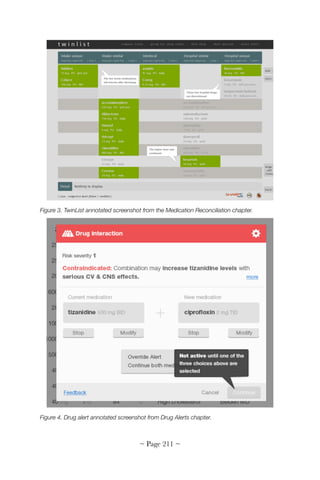
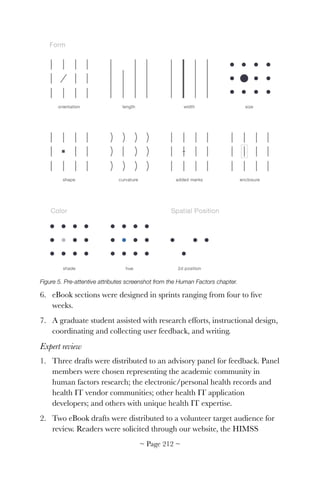
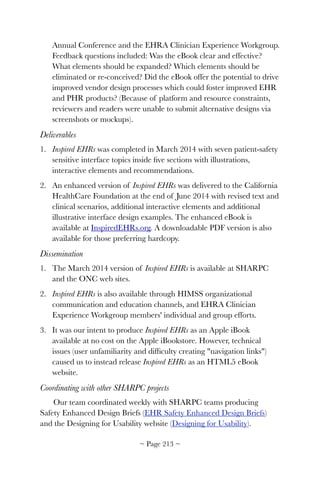


![INTRODUCTION
Medication reconciliation is a complex iterative task [214-217], a
collaborative process where many things can go wrong. For example,
patients may not recall what medications they are taking or may be
unable to communicate; information may not be recorded properly,
leading to uncertainty (e.g., dosage, name or indication); records of past
medication may be incomplete or inaccessible; and not all sources of
medication orders may be known (e.g., the patient may have consulted a
specialist on their own). Eventually the clinician is presented with
medication lists from different sources for reconciling into a single,
complete and accurate list to be signed and saved in the medical record.
User interface design has the potential to reduce errors and improve
quality of care. We studied the last step of the reconciliation process—
reviewing and sorting medications into lists containing those to be
continued and those to be stopped. The result is "TwinList," a prototype
user interface providing cognitive support for improved speed and
accuracy.
The following example describes a single clinical scenario—
discharging a patient from the hospital (Figure 1). The reconciliation
process involves comparing two lists; determining what drugs are unique,
identical or similar between lists; and making decisions about what to
keep, what to discontinue, and what to add or modify.
Intake Hospital
Acetaminophen PO q6h 325 mg Acetaminophen PO q64h 325 mg
Darbepoetin SC qFriday 60 mg Darbepoetin SC qFriday 60 mg
Calcitrol PO daily 0.25
mg
Folic Acid PO daily 1 mg
Ramipril PO daily 5 mg Omeprazole PO daily 400 mg
Meloxicam PO daily 7.7 mg Ciproflocacin PO daily 500 mg
Folvite PO daily 1 mg Ramipril PO daily 5 mg
Calcitrol PO daily 0.25
mg
Ferrous Glocanate PO TID 300 mg
~ Page ! ~220](https://image.slidesharecdn.com/betterehr-151223134030/85/Better-ehr-221-320.jpg)
![Figure 1. Discharging a patient from the hospital requires providers compare the "Intake
list" (left) and the "Hospital list" (right) and determine what drugs are identical, unique, or
similar.
TwinList uses a spatial layout with multistep animation to first help
clinicians better understand the similarity of drugs included in lists, and
then rapidly choose those to include in a reconciled list (Figure 2).
Figure 2. TwinList moves identical drugs to the middle column. Drugs unique to the Intake list
move to the left, drugs unique to the Hospital list move to the right. Similar drugs are aligned
and differences highlighted in yellow (e.g., q6h versus q4h for acetaminophen). A click on
Folvite (a brand name for Folic Acid) selects it–highlighted in green–and deselects Folic acid
(grayed out with a strikethrough). Hovering the mouse Omeprazole (dark gray) reveals details
at the bottom of the screen.
BACKGROUND AND RELATED WORK
Research shows the need for improved medication reconciliation
[215, 218-223]. Duplicate or similar medications may result in overdose
and adverse interactions, as well as non-continuation of important
medication. Problems can compound by patient misunderstanding or
mistrust of new medication, lack of outpatient followup, and changes in
medication due to formularies and drug shortages. Trial implementation
of medication reconciliation policies show significant improvements. In
one study, 94% of patients had medication errors that were eliminated by
a medication reconciliation process [214].
There are three kinds of medication error outcomes: harmful
(preventable adverse drug events, or PADEs), potentially harmful (near-
misses, either intercepted or avoided by luck), and harmless (the most
common) [221]. At least 1.5 million harmful errors occur every year
~ Page ! ~221](https://image.slidesharecdn.com/betterehr-151223134030/85/Better-ehr-222-320.jpg)
![[220]. Patients are particularly vulnerable to errors at care transitions
[222, 224] where medication regimens frequently change. Properly
reconciling medication at transition points is crucial, but complete and
accurate reconciliation is often difficult. Reconciliation is often
overlooked or simply not performed (although this is rapidly changing to
satisfy new regulations).
While many papers report the severity of medication reconciliation
problems, few describe user interfaces used in clinical settings. It is
difficult to completely assess current commercial system interfaces due to
industry concerns of intellectual property, however many work similar to
Pre-Admission Medication List (PAML) Builder [215]. PAML's interface
presents medications from all sources in one combined "super list"
grouped alphabetically by generic name. The interface exhibits a visual
homogeneity that does little to help clinicians distinguish similar from
unique medications. We found systems where a clinician might see an
intake list in one window, a hospital medication list in a separate window,
and the final discharge list in a third. Other systems present a single
merged list of all drugs [215] and group drugs with the same name,
providing some level of comparison. Algorithms have been proposed to
automatically detect similarities between medications [218, 222]. A
review described different levels of drug equivalence and showed
revealing equivalent drugs can simplify reconciliation based on a detailed
keystroke analysis. Other research tried to augment medication lists by
linking prescribed medications with clinical problems or indications
(either automatically [222] or crowdsourcing [218]) with limited,
although promising success.
OVERVIEW OF TWINLIST USER INTERFACE
TwinList's single window user interface consists of three parts (Figure
2): a header at the top, a list viewer at center, and an item detail panel
along the bottom. The list viewer is where users interactively accept/keep
or reject/discontinue medication. An early prototype [222] led to a
complete rewrite using JavaScript and HTML5. See www.cs.umd.edu/
hcil/sharpc for video demonstrations.
Preprocessing: A preprocessing phase identifies similar drugs found in
both lists. We use an algorithm [225] (https://github.com/jherskovic/
~ Page ! ~222](https://image.slidesharecdn.com/betterehr-151223134030/85/Better-ehr-223-320.jpg)
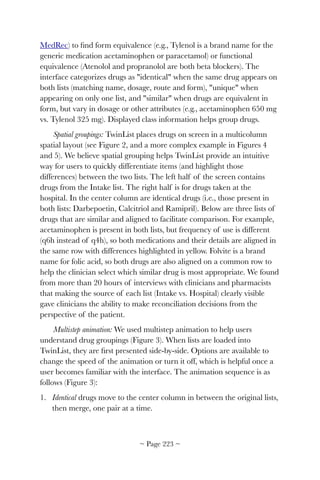
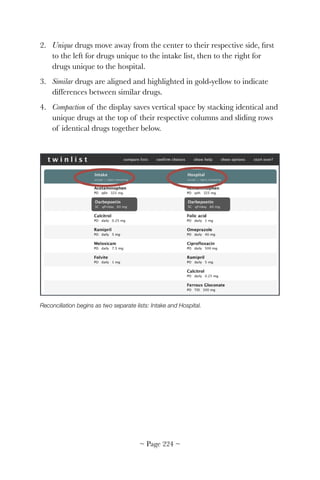
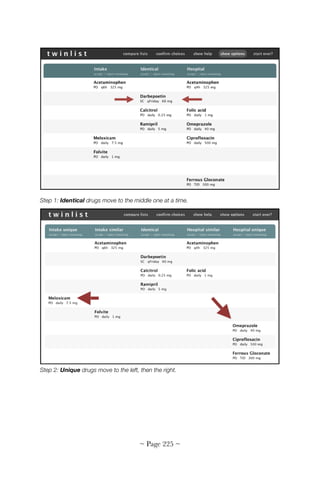
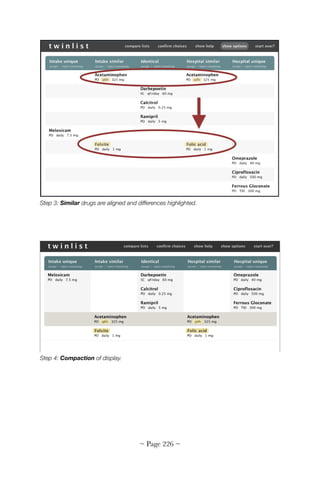
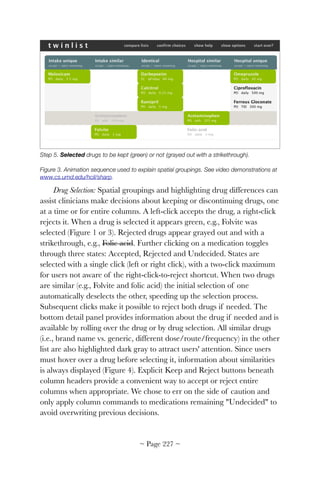
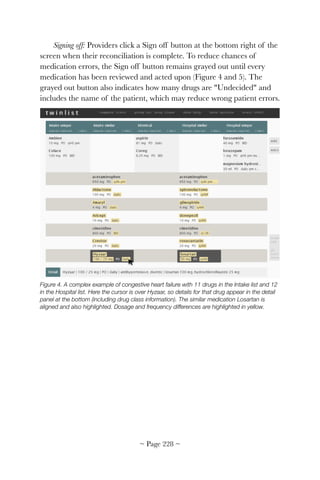
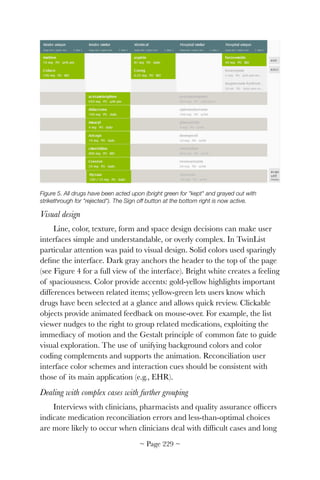
![medication lists (see Figure 4 for a case of congestive heart failure).
TwinList's approach reveals numerous cases of similarities and
differences in drug name, dosage or frequency. The final reconciled set of
drugs is clearly indicated in green (Figure 5).
Interviews suggested different types of grouping (e.g., associated
problem, clinical condition, diagnosis, drug class, etc.) provide additional
cognitive support for the medication reconciliation process. The current
prototype allows medication to be tagged with such attributes, which can
then be used to group drugs on the screen. In an ideal setting, individual
medications would be linked to the patient's problem list (demonstrating
therapeutic intent), however many EHRs do not provide the ability to
link diagnosis to medication (or the function is not reliably used), limiting
its utility in the reconciliation process. Several ongoing efforts are
underway to automatically link information between drug and the
therapeutic intent [226, 227]. When available, this information could be
shown in TwinList's detail panel with other medication details and used
to further organize drugs. TwinList employs high level drug classifications
to help users identify potential problems created by patient transition
from one healthcare environment to another. Clinical condition may be
even more useful. Figure 6 shows an example of grouping by primary
drug class. The grouping reveals this complex case includes a large
number of anti-hypertensive medications, some of them less commonly
used than others and, therefore, at higher risk of misidentification.
Unfortunately, primary class alone may not be always appropriate or
sufficient. Medications may be prescribed for other indications or even
off-label reasons (acceptable but not FDA-recognized indications). This
was a highly debated topic in our interviews, so we explored how
interface could show multiple (N) class affiliations. One method was to
duplicate the drug N times on the screen; one for every class to which a
drug belongs. To indicate additional drug labels were merely ghost copies
(not duplicate prescriptions) they are displayed in Figure 7 in pale gray
instead of black. While the grouped-by-N-class display became complex
(more items on the screen resulting in longer lists), some physicians noted
the visual complexity represented the complex reality of the case.
Grouped-by-N-class display may not be best as a default user interface,
but may be useful: 1) during training; 2) to review decisions before sign-
~ Page ! ~230](https://image.slidesharecdn.com/betterehr-151223134030/85/Better-ehr-231-320.jpg)
![off in complex cases, or 3) for users preferring drugs displayed
metaphorically with case complexity. Although an imperfect solution,
Grouped-by-N-class may sometimes be more useful than common
alphabetic grouping and could be offered as a display option or
preference [228].
Alternative design: Using only 2 columns and showing similarity by dynamic
highlighting only
We felt grouping by class potentially useful, but realized five columns
creates layouts of drugs spread thinly over the entire screen, losing much
of TwinList's original compactness (compare Figures 6 and 7 with Figure
4). Sparsity results from two spatial methods: grouping based on
comparison between the lists (i.e., identical, unique and similar, resulting
in five columns) and slicing by class, resulting in many small sets of drugs
spread over the screen. This led us to reconsider the original grouping of
five columns.
Another alternative interface used only two columns. We preserved
the strong horizontal separation between Intake (left) and Hospital (right),
but reserved the main vertical grouping for drug classes. A disadvantage
is that similarity and differences between lists are no longer shown
spatially, instead revealed temporarily via highlighting when the cursor
hovers over a drug (Figure 8). An advantage is a more compact layout
than five columns of class grouping, using about the same screen space as
the five column layout, but with a taller, narrower design. Another
possible advantage is that the layout can be extended to three or more
lists side-by-side, perhaps useful when merging data from multiple sources
(e.g., inpatient, outpatient and a pharmacy generated list).
~ Page ! ~231](https://image.slidesharecdn.com/betterehr-151223134030/85/Better-ehr-232-320.jpg)
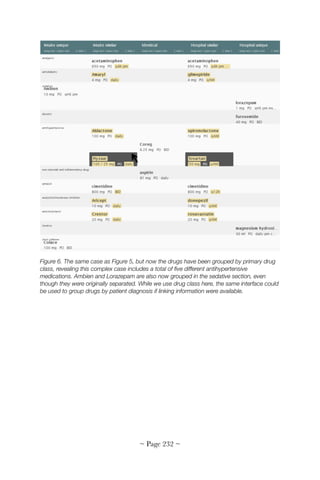
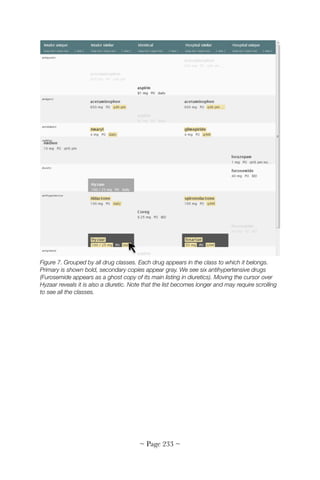
![Figure 8. Two columns (Intake and Hospital). Initially (left) drugs are grouped by primary drug
class, which naturally brings similar drugs close together, here showing a large group of
antihypertensives. Highlighting reveals further similarities (e.g., when the user mouse overs
Hyzaar they can see the similarity with Losartan). Optionally, we can show all classes, with
additional ghost copies when drugs belong to more than one class.
Alternative design: Single column merged list
For reference, we contrast the current TwinList interface with an
earlier design [229]. Figure 9 shows drugs in two merged lists: the
unreconciled original list at the top and the reconciled list below.
Identical drugs (white background) are automatically moved to the
reconciled list. Remaining unreconciled drugs are displayed and color
coded by similarity. Unique drugs are dark orange. Similar drugs are
grouped pale orange, and drugs of form equivalence (brand vs. generic)
are grouped with a white background. Whenever two drugs have the
same dosage or other attribute, their table cells are merged (e.g., 25 mg
dosage for Coreg and similar Carvedilol). Drugs that are unique are
displayed as a bright orange color.
All information about a drug is visible in a wide row, however, this
scheme makes it harder to tell which list a drug belongs. Instead of origin
spatially separating drugs, a dedicated column provides the information.
~ Page ! ~234](https://image.slidesharecdn.com/betterehr-151223134030/85/Better-ehr-235-320.jpg)
![To reconcile, users drag rows from the top list to the bottom. They
can also change their mind and slide reconciled rows back. We found the
method particularly effective on touch screens (e.g., tablets) where users
are accustomed to tap and drag gestures. Drag rows with a mouse was
slower and more error prone on PCs, becoming more difficult reconciling
long lists. Merging more than two lists was possible, but multiple levels of
similarity were problematic. Simply grouping all drugs lost details of drug
connections. Grouping by class or indication was difficult because
groupings were repeated in both lists.
Figure 9: An alternate design of two stacked lists, unreconciled at top and reconciled below.
Drugs are grouped by similarity. Color indicates type of similarity. Dragging rows from one list
to the other indicates which drugs are to be kept.
Additional design considerations
When to use animation? While animation has been shown compelling
and helpful revealing transformations in complex graphical
representations (such as trees or graphs), other studies cast doubt on
animation's usefulness in learning [230]. To gauge if animation was
beneficial in TwinList, a pilot study was conducted with 20 participants
comparing TwinList with multistep animation versus a direct jump to
final layout [231]. The study found no significant difference in training
time, but differences were observed in user comments and clarification
~ Page ! ~235](https://image.slidesharecdn.com/betterehr-151223134030/85/Better-ehr-236-320.jpg)
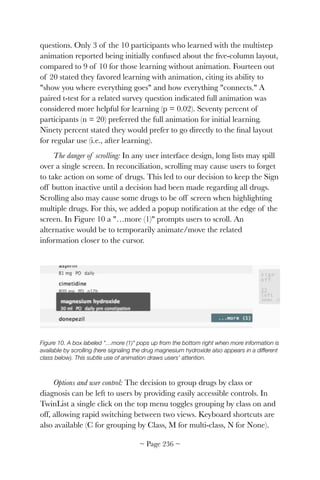
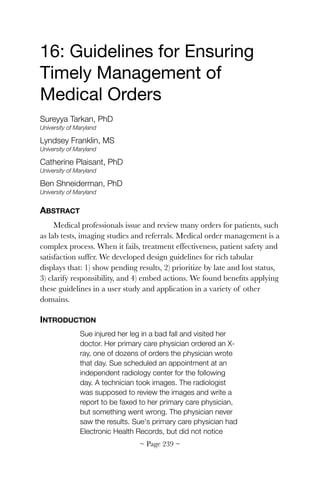
![Sue's test results missing. Her fracture was never
treated. Sue lost her leg.
This is a real story. Many things can go wrong in a complex process
with many steps, multiple actors and various responsible parties. Patients
can be physically harmed if a lab test or imaging study is lost or
mishandled, and patients can become sicker or die if referrals to
specialists are lost [232]. Failure to follow up on abnormal test results is
one of the most frequent causes of medical malpractice litigation in
outpatient medicine [233]. Timely management of medical orders
improves efficiency and effectiveness of treatment, patient safety, and
overall satisfaction [234].
There are no standards regarding how best to manage medical
results [235]. A study of contemporary test result management systems
discovered interface and logic errors in routing, physician records, system
settings, and system maintenance tools [236]. During our interviews, we
saw environments where needed results were received in a timely and
reliable fashion (e.g., emergency rooms in hospitals with all test facilities
in house), while others reported high rates (20%) of late or lost results.
We observed physicians keeping paper "cheat sheets," and staff and
patients spending hours on the phone tracking missing results. Even
when physicians have reliable systems, medical staff do not routinely
check the status of all pending orders [236]. Better management of
medical orders and test results could yield significant benefits.
Because lists are the most common way of managing daily work
[237], we focused on interactive rich tables to indicate medical order
progress. We developed a prototype of rich tables generated using the
Multi-Step Task Analyzing, Reporting, and Tracking (MSTART) system
from workflow models of processes (multiple steps associated with possible
user actions) [238]. Rich tables were refined by conducting iterative
design reviews with medical professionals. The result are guidelines to
improve timely management of medical orders by using tables that: 1)
show pending results, 2) prioritize orders and results by late and lost
status, 3) clarify responsibility, and 4) embed actions. Items 1 and 2
encourage users' attention. Items 2 and 4 allow users to rapidly take
action. Our guidelines extend Stephen Few's table design
recommendations [239] and Microsoft's Common User Interface design
~ Page ! ~240](https://image.slidesharecdn.com/betterehr-151223134030/85/Better-ehr-241-320.jpg)
![guidance [240] to medical systems. A user study was conducted to
formally compare rich tables based on our guidelines to a common
interface used for reviewing medical test results. We learned that our
guidelines can help reduce the problem of missed results.
Figure 1. Rich tabular displays as seen by a physician. Rich tables adhere to our design
guidelines. Hovering over rows reveals informational tooltips.
Related work
To the best of our knowledge, state-of-the-art medical order tracking
is represented by Partners Healthcare Results Manager [241]. Results
Manager is limited by not showing late results or impediments to taking
rapid actions on them. Other clinical event notification systems [242]
remind physicians to follow up on results, but research shows such
systems can generate undesired alerts and cause clinician alert fatigue,
potentially resulting in providers bypassing or missing important alerts
[243]. Other researchers applied workflow management techniques to
clinical situations [244] with models that assist optimizing or testing
workflows in the context of an ideal environment. In contrast, we focused
on what can go wrong in real world situations.
Many principles can be learned from well designed alert systems.
Researchers have built tools to support organizing users' daily tasks and
roles [237]. These systems generally display tasks as chronologically-
ordered lists [245] and remind users about pending tasks. Users may
~ Page ! ~241](https://image.slidesharecdn.com/betterehr-151223134030/85/Better-ehr-242-320.jpg)
![switch between screens to complete tasks, but such interruptions have
been found to reduce awareness [246, 247]. In the medical domain,
interruptions contribute to error risk. Information visualization research
has applied situation awareness theory [248], but this requires users focus
on the visualization to discover anomalous behavior. We found medical
workflow to be more dynamic and time critical.
DESIGN GUIDELINES
We offer design guidelines based on shortcomings of existing EHR
interfaces. For example, in many systems, physicians scan a list (either of
all patients, or per patient), which serves as a reminder to review results.
Pending orders are usually not visible unless a physician reads details of a
patient's record or uses a reporting tool. In many EHR systems,
physicians are forced to remember orders they have placed. Systems
generally have no notion of latency between orders and results. Result
lists may be sorted by arrival date, with newer results inserted at the
bottom. A physician may have no way of knowing if an expected result is
missing, but even if they do, their only option may be tracking it down
via phone. Once results have been reviewed, there is often no mechanism
to ensure followup.
Show pending results
Tables should provide access to results, pending orders, and planned
orders, whether all patients or only one. Figure 1 shows an example of
Dr. Brown's orders. Returned results are listed on top under Results to
Review, while orders that have not yet returned are shown under
Pending Test Results. Orders that have been issued, but were intended
for the future (e.g., a mammogram on a patient's 50th birthday) are
accessed under Planned Tests (shown here collapsed). Orders
automatically move from planned to pending at the appropriate time. As
results arrive, their entry moves to the topmost table. Results are removed
once the physician has reviewed them and confirmed followup.
Prioritize by late and lost status
Our prototype employs an underlying result management workflow
model that assigns normal and maximum durations to each step. For
example, a patient may be given between three days and a week to
~ Page ! ~242](https://image.slidesharecdn.com/betterehr-151223134030/85/Better-ehr-243-320.jpg)
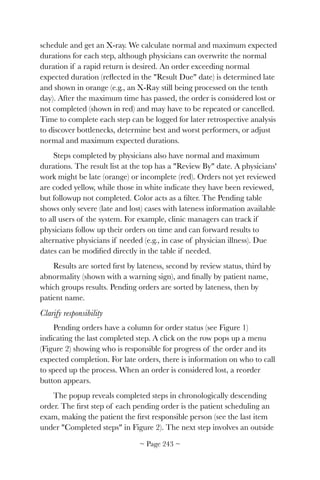
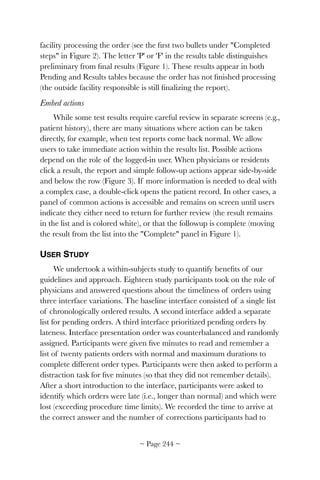
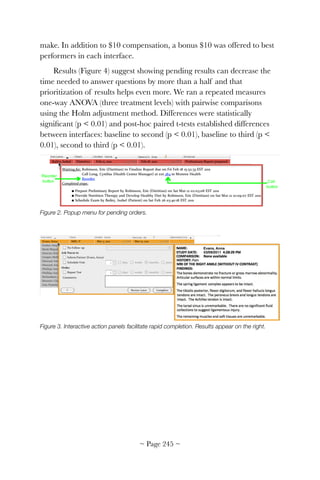
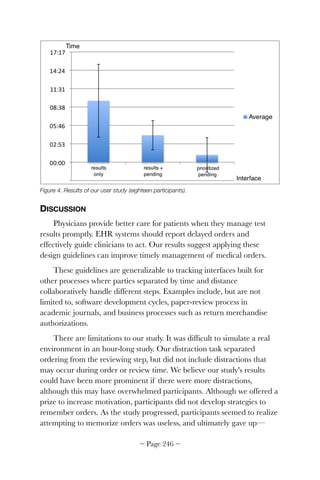


![17: Clinical Summarization
A model-based technique
Dean F. Sittig, PhD
The University of Texas Health Science Center at Houston School of Biomedical Informatics
Allison B. McCoy, PhD
Tulane University School of Public Health Tropical Medicine
Adam Wright, PhD
Brigham Women's Hospital
ABSTRACT
We developed model-based techniques to automatically generate
clinical summaries from complex electronic health record (EHR) data.
Research included studying how clinicians collect, distill, interpret, and
synthesize patient information. To organize our work, we developed an
eight-dimension socio-technical model of safe and effective EHR
implementation and use. We also developed AORTIS (Aggregation,
Organization, Reduction and Transformation, Interpretation and
Synthesis), a six-stage model of data summarization. We used the socio-
technical model to explore clinician utilization of EHRs in various
ambulatory settings and the AORTIS model to evaluate the clinical
summarization capabilities of several EHR products. We then developed
prototype clinical summarization displays using the Harvard SMART
platform. This research provides a theoretical and practical foundation
for future work in computer-generated clinical summarization.
INTRODUCTION
The ability of clinicians to collect, distill and accurately interpret
patient information is critical. Clinicians often face volumes of data from
a variety of sources and strain to separate important information from
background noise. They must also condense and refine information to
communicate with colleagues in the course of providing continuous and
coordinated care [249, 250]. The way information is structured and
presented to clinicians can profoundly influence their decision making
[251]. Medical information is often fragmented, existing in a wide range
~ Page ! ~251](https://image.slidesharecdn.com/betterehr-151223134030/85/Better-ehr-252-320.jpg)
![of locations and formats, which puts patients at an increased risk of
errors, adverse events and inefficient care [252]. An accurate, well-
designed, context-specific summary could save time, improve clinical
efficiency and mitigate errors.
Clinical summarization can be defined as collecting, distilling, and
synthesizing patient information to facilitate a range of clinical tasks.
Discharge summaries, daily progress notes, patient handoffs at shift
change and oral case presentations are common. We narrowed the
definition to healthcare provider efforts that result in patient-specific
clinical data to assist communication and decision making. This differs
significantly from the concept of text summarization, which broadly refers
to creating a text summary from one or more source documents (e.g.,
scientific articles, literature abstracts, and multimedia).
While some aspects of clinical summarization have become easier
through electronic health records (EHRs), other aspects are now more
complex. Clinicians collect and process enormous amounts of clinical
data, creating the potential for information overload and error [243,
253]. This overload can cause frustration, inefficiency and
communication failure [254], leading to important data being overlooked
[174]. Problems will likely increase with health information exchanges
(HIEs), which allow broad sharing of patient data. Poor presentation of
clinical information can also impair medical decision making,
contributing to medical errors and reduced quality of care [255].
Readily accessible and perfectly legible clinical notes, laboratory
results, images, and provider correspondence inform clinical care [256],
but pose a challenge for time-pressured clinicians working in busy settings
[243]. Early EHR adopter organization patients may have accumulated
more than ten years of electronic health data. As the number of
clinicians using EHRs increase and HIEs capable of exchanging patient-
level data expand, the quantity of data that clinicians need to review for
safe and effective care will exponentially grow. Clinicians must integrate
these data with their medical knowledge and the scientific literature, then
integrate this knowledge with their institution's policies and government
regulations. Solutions require explicit, unified, accurate, and
comprehensive patient-centered models that reflect the true work domain
ontology [257].
~ Page ! ~252](https://image.slidesharecdn.com/betterehr-151223134030/85/Better-ehr-253-320.jpg)
![Automated methods of using patient-centered knowledge to
summarize and display patient clinical information are needed. The
ultimate goal of our research are knowledge models and knowledge bases
that produce clinical summaries as clear and concise as Figure 1.
Figure 1. Example of automatic clinical summarization (problem-oriented view). Reprinted with
permission from J Biomed Inform. 2011 Aug;44(4):688-99.
Clinical summaries can be divided into three interrelated categories:
source-oriented, time-oriented and concept-oriented views [258]. Source-oriented
views derive from traditional paper charts where information is filed in
separate categories to facilitate document retrieval [259]. Source-oriented
views are part of most EHRs. Information is organized according to
source, allowing data to be grouped into categories, such as laboratory
results, imaging studies and medication. Time-oriented views organize
information based on when it was collected and order data
chronologically in normal time or reverse time (most recent first).
Information may delineate a sequence of events or details of a care plan
and are common in both paper and electronic records. In a concept-
oriented view, data is organized around specific clinical concepts, such as
medical problems or organ systems. Using a concept-oriented view
requires significant clinical knowledge (physician expertise or
~ Page ! ~253](https://image.slidesharecdn.com/betterehr-151223134030/85/Better-ehr-254-320.jpg)
![computerized knowledge database), but can speed information retrieval
and improve medical decision making [260, 261]. Each view, alone or in
combination, is a valuable way to analyze patient data across a range of
clinical tasks.
Our first challenge was identifying data and methods to model a
clinicians' desired interactions with patient medical history, then
summarizing patient histories and identifying appropriate actions to
improve clinician decision making. Our second challenge was designing
automated methods to create accurate, succinct, condition-dependent
and independent computer-generated summaries of patients to improve
patient safety, clinician efficiency and satisfaction, and reduce cost of
care.
APPROACH
Our work was divided into three parts. Part 1 identified the data and
methods clinicians use to make sense of vast clinical information
contained in state-of-the-art EHRs. For this, we developed a form of
ethnography called the Rapid Assessment Process (RAP). Part 2
developed a theoretical framework to study the data summarization
process. Part 3 used clinical knowledge bases (described in Chapter 18) to
create prototype clinical summarization displays.
Part 1: The rapid assessment process
RAP methods were used to understand user needs for
summarization. RAP is a modification of traditional ethnography's
ability to address how and why [262]. Often used in international
and public health settings, we modified the approach to study different
clinicians (e.g., primary care, sub-specialists, hospitalists) using EHRs in
different settings (e.g., clinics, emergency rooms, hospitals). RAP consists
of: 1) selecting sites and participants to maximize what is learned in the
shortest time, 2) using local collaborators to identify clinicians to
interview and observe, 3) collecting data using multiple observers and
methods (e.g., observation, think-aloud, focus groups, surveys, task
analyses, document analysis), and 4) collaborative, structured data
analysis.
~ Page ! ~254](https://image.slidesharecdn.com/betterehr-151223134030/85/Better-ehr-255-320.jpg)
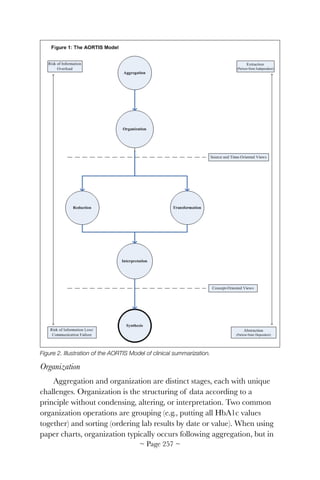
![an EHR can occur near-simultaneously to aggregation. Realistically, most
patient information must progress to the organization stage to be of
clinical value.
LDL cholesterol test results could be sorted chronologically, by value,
or grouped by laboratory of origin (hospital, PCP, previous PCP, VA,
etc.). Both source and time-based LDL value organization aids clinicians'
understanding aggregated data. In paper records, views must be
manually created by clinicians or administrative staff. Physical properties
of the record may be designed to accomplish time-oriented organization
(e.g., an hourly flow sheet, space for entering daily progress notes), but
manual organization can be a lengthy process. Electronic systems, in
contrast, can organize the same data almost instantaneously.
Reduction and Transformation
Clinicians are vulnerable to information overload without further
data processing after organization. Data condensation can occur by
reduction or transformation. Reduction culls salient information from the
database without altering it to decrease the amount of data presented.
For numerical information, this might include a selection of the most
recent values, maximum values (i.e., medication peak levels), minimum
values (i.e., medication trough levels), or statistical reductions such as
medians. For text-based information, this might include selecting results
or notes over a certain timeframe or category (e.g., endocrinology consult
notes, radiology reports, all notes that mention the term back pain or
the assessment section of all progress notes).
Transformation is the process of altering a data view or data density
to facilitate understanding. A simple form of transformation is trending:
the qualitative description of a basic pattern in data (e.g., transforming an
array of HbA1c values to the statement, the patient's HbA1c level
decreased 29% (from 8.6 to 6.2) over one year). Another example is the
graphical display of laboratory results (e.g., HbA1c levels) over time. In
this transformation, values are translated from numeric representation to
spatially-oriented displays. Transformation can also be accomplished
using other visual tools, such as metaphorical graphics overlaid on a
schematic diagram of the human body or timeline [208, 263].
~ Page ! ~258](https://image.slidesharecdn.com/betterehr-151223134030/85/Better-ehr-259-320.jpg)
![Reduction and transformation require less contextual clinical or
general scientific knowledge than interpretation or synthesis. For
example, HbA1c is a numeric value. It's fairly simple to find the mean
HbA1c by summing all values and dividing by the number of values
summed. Another example: qualitative urine human chorionic
gonadotropin is a discrete text value. Finding a true arithmetic mean
value is not possible. Theoretically, a median or modal value could be
calculated, although the clinical significance of an average value would
depend on the nature of the test and its clinical context. In the absence
of high-level summarization, reduction and transformation are tools for
producing extracts because these steps do not depend on patient-specific
information.
Continuing the LDL example, reduction might be used to create an
extract of a patient's LDL by reporting the most recent or maximum and
minimum results for a given time period. Transformation might yield a
line graph of available values over time or a description of the data's
trend (which is also considered an extract).
Interpretation
Interpretation is context-based analysis of a single type of clinical
data using general (versus patient-specific) medical knowledge. For
example, selecting abnormal lab results to include in a patient handoff
summary requires interpretation by a clinician or computer program to
identify which results are abnormal. Many lab result reports include an
indication of abnormally high or low results made by a computer using a
knowledge base of abnormal and critical ranges. This is an example of
simple interpretation because it applies general medical knowledge to a
single data type for a specific patient.
Interpretation requires a clinical knowledge base. Despite progress in
machine learning, artificial intelligence, expert systems, natural language
processing and clinical decision support, interpretation beyond abnormal
flags and reference ranges remains largely in the hands of clinicians.
However, for the purpose of accomplishing a highly specific clinical task,
automated high-level systems can be created, such as computer-assisted
acid-base interpretation [264] and EKG interpretation [265].
~ Page ! ~259](https://image.slidesharecdn.com/betterehr-151223134030/85/Better-ehr-260-320.jpg)
![Interpretative elements can be added to transformed data. For
example, one could add a text alert indicating recent changes, such as
LDL level has increased over the past year and now exceeds goal level.
Horizontal lines showing the limits of the normal range could be added
to a graphical display, thus facilitating visualization that a patient's results
are outside normal limits. Both require general medical knowledge to
define goal levels.
Synthesis
The final phase of AORTIS is combining two or more data elements
with knowledge-based interpretation of patient state to create meaning
or to suggest action. Synthesis is the most sophisticated and valuable form
of clinical summarization because concept-oriented views are possible.
Following knowledge-based interpretation, clinical information can be
understood in relation to other parts of the medical record and can be
viewed with respect to the patient's unique clinical status. Synthesis
depends heavily on previous steps to create a reliable and complete
clinical information summary.
When one interpreted piece of information (such as an abnormal lab
result) is synthesized with other types of patient information (such as
medications used to treat the condition), more sophisticated meaning is
generated. For example, a simple synthesis of LDL results might yield the
statement, In response to elevated LDL levels on 12/01/09, a statin was
initiated and LDL levels decreased to normal on 2/1/10. This synthetic
statement brings together the identification of an abnormal value with
pertinent medical history and succinctly provides a rich array of patient
information. The statement, thus, captures: 1) a previous abnormal LDL
on December 1st, 2) the now normal LDL on February 1st, 3) the
initiation of a lipid-controlling medication, 4) the downward trend in
LDL, 5) the implication that medication helped lower LDL, and 6) the
impression that the patient's hyperlipidemia is well-controlled with
medication.
Part 3: Development of clinical summarization prototypes
We developed a patient summarization application using the
Harvard University SHARP project's Substitutable Medical Apps
Reusable Technologies (SMART) platform [266]. The app is based on
~ Page ! ~260](https://image.slidesharecdn.com/betterehr-151223134030/85/Better-ehr-261-320.jpg)
![our proof-of-concept problem-medication linkage SMART app based on
a National Drug File – Reference Terminology knowledge base [267].
The summarization app can be run in any EHR environment that either
supports SMART or runs the SMART-enabled i2b2 clinical bridge [268].
The bridge demonstrates a pathway for reusable app development that
does not require EHR vendors to immediately adopt the SMART API.
Apps can be developed in SMART and run by clinicians in the i2b2
repository, reusing clinical data extracted from EHRs.
We modeled our summarization app's user interface on a previously
designed OpenVista prototype interface of a problem-oriented view. The
interface was evaluated using the TURF framework (see Chapter 2) for
EHR usability [7, 269]. We developed the app using HTML and
JavaScript, the Bootstrap front-end framework (http://
getbootstrap.com/) and Google Visualization API [270]. Our original
proof-of-concept SMART app showed all problems and medications on
one screen, which was unwieldy for complex patients, and displayed
output in a rigid HTML table. The new app featured a cascading style
sheet and fluid grid design to ensure proper proportions for key screen
resolutions.
RESULTS
Results from the clinical summarization project are divided into the
same three parts as our Approach.
Part 1: The rapid assessment process
We used RAP in clinical settings at The University of Texas
professional practice plan, Baylor College of Medicine faculty practice
plan, Houston VA ambulatory clinics, and Brigham Women's Hospital
Ambulatory clinics. We found:
1. The majority of patient problems were not recorded using structured
clinical vocabulary terms in the EHR section commonly known as
problem list. This early finding caused us to devote significant effort
developing new ways to infer patient clinical problems from
structured and unstructured EHR data (Chapter 19).
2. Understanding the roles health information technology plays in
clinical care and patient summarization is challenging. We developed
~ Page ! ~261](https://image.slidesharecdn.com/betterehr-151223134030/85/Better-ehr-262-320.jpg)
![and refined an eight-dimension socio-technical model to help us
study the design, development, implementation, use, and evaluation
of HIT within complex healthcare systems (Figure 3) [271].
Figure 3. The eight-dimension socio-technical model of safe and effective EHR implementation
and use applied to Clinical Summarization.
3. Clinicians face numerous social, legal, ethical, and financial issues on
a daily basis that have the potential to affect their usage of HIT and
EHRs. One example: …key legal dilemmas that must be addressed
in the near-term pertain to the extent of clinicians' responsibilities for
reviewing the entire computer-accessible clinical synopsis from
multiple clinicians and institutions, the liabilities posed by overriding
clinical decision support warnings and alerts, and mechanisms for
clinicians to publicly report potential EHR safety issues. Ethical
dilemmas that need additional discussion relate to opt-out provisions
~ Page ! ~262](https://image.slidesharecdn.com/betterehr-151223134030/85/Better-ehr-263-320.jpg)
![that exclude patients from electronic record storage, sale of de-
identified patient data by EHR vendors, adolescent control of access
to their data, and use of electronic data repositories to redesign the
nation's health care delivery and payment mechanisms on the basis
of statistical analyses. Finally, one overwhelming financial question is
who should pay for EHR implementation because most users and
current owners of these systems will not receive the majority of
benefits. [272].
4. Lack of an evidence-based definition of EHR-related errors is
holding back progress toward a safe and effective EHR-enabled
healthcare system. We created our own definition: EHR-related error
occurs anytime HIT is unavailable for use, malfunctions during use,
is used incorrectly by someone, or when HIT interacts with another
system component incorrectly, resulting in data lost or incorrectly
entered, displayed, or transmitted [273].
5. There is emerging evidence of EHR-related safety events [274].
Unfortunately, no national program to facilitate the collection,
analysis, or investigation of these events exists. We proposed the
creation of a national EHR oversight program for dedicated
surveillance of EHR-related safety hazards and to promote learning
from errors, close calls, and adverse events [275].
6. Despite considerable progress in the adoption and use of EHRs
following the US government's 2009 Health Information Technology
for Economic and Clinical Health Act [276], EHR adoption has
resulted in larger than expected challenges in day-to-day clinical
processes. For example, many clinicians perceive the total cost of
EHR (money spent on hardware, software, and consulting services
plus the additional time required to complete orders, notes, and
billing, plus required changes to their workflow) outweighs direct
benefits. Still, they acknowledge patients and payers are likely to
benefit from EHR use. We hypothesized that by providing clinicians
with assurances EHRs will deliver the features and functions they
need and that the regulatory environment will support them, would
improve EHR adoption rates. We, therefore, developed a set of rights
and responsibilities for EHR users [277]. Following publication of a
~ Page ! ~263](https://image.slidesharecdn.com/betterehr-151223134030/85/Better-ehr-264-320.jpg)
![first manuscript, we were asked to develop an additional set of rights
for clinicians caring for children [278].
7. At a time when health care organizations (HCOs) are focused on
meaningful use, we believe clearer guidance should be provided (to
both clinicians and HCOs) to better align patient safety activities
with those required to support a safe EHR-enabled health care
system. We developed EHR-specific safety goals modeled after the
Joint Commission's National Patient Safety Goals [279] to provide
HCOs with focus areas for sustained improvements in organizational
infrastructure, processes, and culture as they adapt to new, state-of-
the-art health information technology.
Part 2: A theoretical framework for clinical summarization
We compared different aspects of 12 ONC certified EHR systems'
general clinical summary screens using our AORTIS model [280] (Table
1).
~ Page ! ~264](https://image.slidesharecdn.com/betterehr-151223134030/85/Better-ehr-265-320.jpg)
![Figure 4. Screen print of Partners HealthCare System's Longitudinal Medical Record (LMR)
clinical summary screen. Used with permission.
Part 3: Clinical summarization prototype
We partnered with the Harvard SHARP team [281] to test prototype
clinical summarization displays using SMART. Our clinical
summarization SMART app user interface displays a list of active
problems on the left. Users may select a problem from the list and display
associated medications on the right. Users can also click the All
Medications text to toggle a list of all prescribed medications for a
patient. We have not yet integrated a knowledge base with lab results, so
the app displays all historical lab results and vital signs below problems
and medications. Users may click a lab result or vital sign to toggle the
values display. Any lab result with multiple values is shown as a graph,
generated using the Google Visualization API. (See video at: http://
www.i-jmr.org/article/downloadSuppFile/2454/6210. The app is open-
source and available as a free download [282].
~ Page ! ~266](https://image.slidesharecdn.com/betterehr-151223134030/85/Better-ehr-267-320.jpg)
![Figure 5. The patient summarization app running inside the SMART-i2b2 container. Shown
here: urinary incontinence is highlighted and a relevant medication (oxybutynin) is displayed to
the right; lab results are shown as line graphs below. Used with permission from: Interact J
Med Res. 2013 May 30;2(1):e11. doi: 10.2196/ijmr.2454.
DISCUSSION
Developing automated methods to accurately and succinctly
summarize a patient's clinical history from the vast amount of structured
and unstructured data in an EHR system remains one of the grand
challenges in clinical decision support [283]. It's also one of the most
important problems to be solved if we are to provide safe and effective
EHRs to all clinicians [262]. We believe we have made considerable
progress understanding and solving this problem. For example, using our
RAP methodology, we were able to identify socio-technical barriers that
clinicians face. Our eight-dimension socio-technical model of safe and
effective EHR implementation has proven useful in several HIT-related
venues:
• Analysis of EHR-related safety concerns [170].
• Comparison of comparative effectiveness research platforms [284].
• Analysis of Medicare's bundled payments demonstration project
[285].
• Evaluation of a new tablet-based, clinical data collection system for
use in rural India [286].
• Evaluating the effectiveness of EHR-based clinical referrals [287].
~ Page ! ~267](https://image.slidesharecdn.com/betterehr-151223134030/85/Better-ehr-268-320.jpg)
![• Understanding the management of electronic test result notification
in the out-patient setting [288].
Our AORTIS clinical summarization model has been used by
outside research groups to evaluate a prototype clinical documents
visualization tool [289] and in-patient clinical documentation system for
physicians [290]. The model illustrates steps to enable robust clinical data
synthesis, bringing multiple data elements together to allow clinicians to
rapidly process clinical information. AORTIS provides a roadmap to
guide clinicians to information contained in patient records. Although
clinicians are well suited to completing final high-level steps in
summarization, it's possible that with further study of clinical cognition
and workflow automated tools could support high-level summarization
steps across a broader range of clinical tasks.
We demonstrated how large informatics projects could collaborate at
a distance using freely available, open-source tools to develop a working
prototype. This required agreement on syntax, software architecture and
clinical content.
The burden for developing innovative clinical data entry and displays
has fallen largely on EHR vendors. A significant amount of EHR vendor
time, effort and money over the last four years has gone toward meeting
Health and Human Services' meaningful use requirements [114]. As a
result, we found collaborating with commercial EHR vendors to design
and develop the next generation of EHRs difficult. Instead, we used the
Harvard SHARP team's SMART tool for testing clinical knowledge bases
against real-world patient data. Our clinical summarization prototype
user interfaces demonstrated the utility of these knowledge bases.
SMART has several important advantages:
1. SMART shortens the learning curve of app development by
leveraging existing Web standards (e.g., JavaScript Object Notation
data structures and Web service interfaces).
2. The SMART API is a straightforward data model designed to meet
the needs of app development without trying to solve all use-cases for
external clinical data views. This avoids more complicated formats
such as the Clinical Document Architecture, a health care data
standard for representing all types of clinical data.
~ Page ! ~268](https://image.slidesharecdn.com/betterehr-151223134030/85/Better-ehr-269-320.jpg)

![18: Developing Knowledge
Bases for Automated Clinical
Summarization
Making electronic health records
smarter
Allison B. McCoy, PhD
Tulane University School of Public Health Tropical Medicine
Adam Wright, PhD
Brigham Women's Hospital, Harvard Medical School
Dean F. Sittig, PhD
The University of Texas Health Science Center at Houston School of Biomedical Informatics
ABSTRACT
Finding relevant patient information in electronic health
records' (EHRs) large datasets is difficult, especially when organized only
by data type and time. Automated clinical summarization creates
condition-specific displays, promising improved clinician efficiency.
However, automated summarization requires new kinds of clinical
knowledge (e.g., problem-medication relationships). We studied eight
problem-medication pair knowledge bases using six different approaches.
A standards-based ontology knowledge base created the largest number
of pairs (33,894,415). A reputation metric knowledge base was the most
limited (983 pairs). Further research is needed to better understand
knowledge bases for automated EHR data summarization.
INTRODUCTION
Electronic health records (EHRs) contain voluminous data of many
types: visits, problems, allergies, notes, laboratory test results, diagnoses,
medications, health maintenance items, etc. The amount of information
can overwhelm clinicians, leading to frustration, inefficiency and errors
[16, 17, 95, 174, 255]. Automated clinical summarization has the
~ Page ! ~271](https://image.slidesharecdn.com/betterehr-151223134030/85/Better-ehr-272-320.jpg)
![potential to alleviate the problem of too much information [277, 291],
but few EHRs have implemented required components, in part due to
difficulties developing knowledge-based tools [280].
Automatic clinical summaries require knowledge of data
relationships. There are a number of approaches to developing
knowledge bases for EHR summarization, each with advantages and
disadvantages. Some approaches are manual and require expert clinician
review. Others are automated, relying solely on computational methods.
Manually created knowledge bases can be highly accurate, although time
consuming to create. They may also be incomplete. Automation requires
little clinician time, but may be inaccurate.
APPROACH
We compared six clinical knowledge base development approaches
for clinical summarization: manual creation, a standards-based ontology,
association rule mining, crowdsourcing, reputation metric and an
ensemble method.
Data sources
We used data from three sources. Partners Healthcare (Partners) is a
large integrated academic clinical care network. We randomly selected a
cohort of 100,000 patients from the Brigham and Women's Hospital seen
at least once during 2007 and 2008 who had two or more outpatient
notes in their record. The EHR data set included 272,749 problems and
442,658 medications. There were 1,756 unique problems and 2,128
unique medications [292].
University of Texas Physicians (UTHealth) is a large, multi-specialty,
ambulatory, academic practice. Clinicians are required to manually link
medications to an indication within their patient's clinical problem list for
all medications ordered through e-prescribing. Between June 1, 2010 and
May 31, 2011, clinicians entered 418,221 medications and 1,222,308
problems for 53,108 patients [293].
Blue Cross Blue Shield of Texas (BCBS-TX) is the largest
commercial insurance provider in Texas. We extracted billed diagnoses
and prescribed medications for 6,486,226 patients with claims between
2008 and 2011 [294, 295].
~ Page ! ~272](https://image.slidesharecdn.com/betterehr-151223134030/85/Better-ehr-273-320.jpg)
![Manual creation
Knowledge bases can be manually created through expert clinician
review. We used a six-step rule development process, including automated
identification of problem associations with other structured data,
selection of problems of interest, development of preliminary rules,
characterization of preliminary rules and alternatives, selection of a final
rules, and validation of the final rule (Chapter 19) [296, 297]. We
developed rules using data from Partners Healthcare that asserted
treats relationships between medications and problems.
Standards-based ontology
The Veterans Health Administration National Drug File-Reference
Terminology (NDF-RT) [298] system provides a formal content model to
describe medications and definitional relationships (e.g., simvastatin
may_treat hypercholesterolemia) [299]. We created a standards-based
ontology knowledge base using the may_treat linkage from NDF-RT,
with medications and problems mapped to the National Library of
Medicine's RxNorm naming system [300] and Systematized
Nomenclature of Medicine Clinical Terms (SNOMED-CT) [301] using
the Unified Medical Language System (UMLS) [267]. We expanded the
linkage to all levels of problem and medication hierarchies within UMLS
using the is relationship within SNOMED CT and the ingredient_of
relationship within RxNorm (Figure 1). To evaluate the resulting
knowledge base, we randomly selected 25 patients who had at least three
problems and at least five medications and reviewed all potential pairs for
appropriateness as the gold standard.
!
Figure 1. Generation of knowledge base for linking patient medications with clinical problems
using RxNorm, NDF-RT, and SNOMED CT. Dashed line indicates inferred relationship.
RxNorm
CUI
SNOMED
CT Concept
“may_treat”
SNOMED
CT Concept
NDF-RT
Preparation
NDF-RT
Disease
RxNorm
CUI
“ingredient_of”
~ Page ! ~273](https://image.slidesharecdn.com/betterehr-151223134030/85/Better-ehr-274-320.jpg)
![Association rule mining
Association rule mining identifies related concepts using measures of
interestingness and has been successful identifying relationships between
clinical data elements [302]. We developed three knowledge bases from
association rule mining Partners, UTHealth and BCBS-TX [292, 303]
data. For each knowledge base, we used a minimum support threshold of
five and a minimum confidence threshold of ten. The chi-squared
statistic performed best when compared to a gold standard from our
previous analysis.
Crowdsourcing
Crowdsourcing outsources tasks to a group or community. For
example, Wikipedia depends on contributions from the public [304, 305].
Biomedical researchers are evaluating crowdsourcing to develop new
resources, including drug knowledge [306, 307]. We created a
crowdsourcing knowledge base from UTHealth data [227], using links
between medications and problems manually asserted by clinicians
during e-prescribing (Figure 2).
~ Page ! ~274](https://image.slidesharecdn.com/betterehr-151223134030/85/Better-ehr-275-320.jpg)
![Figure 2. Example screen showing problem manually linked to medication during e-
prescribing.
To ensure accuracy of retrieved links, we determined patient link
frequency (the number of distinct patients for whom a link had been
asserted) and link ratio (proportion of patients receiving a particular drug
with a particular problem for which a link between the drug and problem
had been manually asserted). We stratified problem-medication pairs into
threshold groups using patient link frequency and link ratio. One
hundred problem-medication pairs were randomly selected from each
group to determine a threshold cutoff for which links had an estimated
accuracy of 95% or greater. Pairs meeting the threshold were included
the resulting knowledge base. We compared the knowledge base to a gold
standard review of all potential problem-medication pairs for 100
patients.
Reputation metric
Reputation metrics are often used for evaluating user-generated
content, such as e-commerce transactions [308], product reviews [309],
and e-news or forum comments [310]. We developed a reputation metric
knowledge base using logistic regression that included three contributing
variables: clinician link sharedness (the proportion of links asserted by a
given clinician also asserted by another clinician), clinician total distinct
links (number of unique problem-medication pairs linked by a given
clinician), and clinician link ratio (for each distinct problem-medication
pair linked by a clinician, the average of the proportion of links asserted
for all scenarios in which the clinician had the opportunity to link
problem and medication) [311]. We included pairs by clinicians predicted
to have 95% or greater accuracy for linked pairs by the regression model
(Figure 3). We evaluated pairs with the same gold standard used with the
crowdsourcing knowledge base.
~ Page ! ~275](https://image.slidesharecdn.com/betterehr-151223134030/85/Better-ehr-276-320.jpg)
![Figure 3. Definition of the clinician reputation metric approach.
Ensemble
We developed an ensemble method to integrate the five knowledge
bases (association rule mining at Partners, UTHealth, and BCBS-TX;
crowdsourcing; and reputation metric) into a unified computable
problem-medication knowledge base. We mapped pairs from their source
to standardized terminologies using natural language processing, then
mapped medications to RxNorm at the ingredient level and problems to
root ICD-9 codes (International Classification of Diseases [312]). Figure
4 shows the overlap of knowledge bases. Measures of confidence from
each knowledge base approach were integrated into a matrix to facilitate
problem-medication knowledge extraction from user-defined criteria.
~ Page ! ~276](https://image.slidesharecdn.com/betterehr-151223134030/85/Better-ehr-277-320.jpg)
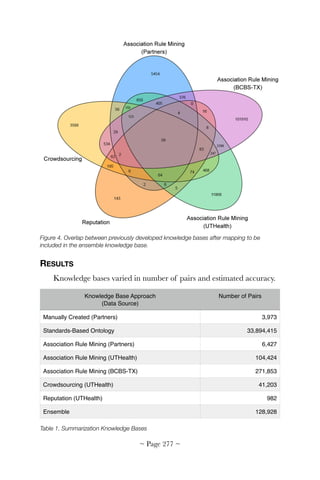
![The manually-created knowledge base included 3,973 problem-
medication pairs, composed of eight distinct problems (asthma, breast
cancer, coronary artery disease, depression, diabetes, dyslipidemia,
hypertension, and hypothyroidism) with 53 distinct sub-problems and
909 distinct medications [296]. Although we did not formally assess
accuracy of the manually created knowledge base, specificity is likely
high due to the expert review, although coverage of the knowledge base
compared to all possible clinical conditions and medications is low.
The standards-based ontology knowledge base was the largest with
33,894,415 problem-medication pairs. Pairs included 60,632 problems
and 24,079 medications. Compared the gold standard review, the
standards-based ontology knowledge base achieved 43.41% sensitivity
and 98.28% specificity [267].
We performed association rule mining on the three source datasets.
We identified 6,427 problem-medication pairs Partners, including 168
problems and 1,147 medications. Of the top 500 pairs, according to the
chi square statistic, 89.2% were found in the gold standard, suggesting a
high level of accuracy [292]. Using UTHealth, we identified 104,424
problem-medication pairs, including 563 problems and 9,088
medications. As with Partners, we found a high level of accuracy for the
top pairs [303]. Using BCBS-TX, we identified 271,853 problem-
medication pairs, including 1,693 problems and 2,459 medications.
The crowdsourcing approach identified 41,203 problem-medication
pairs, including 4,676 problems and 4,903 medications. Compared to
expert review, crowdsourcing achieved a sensitivity of 56.2% and
specificity of 98.0%. Evaluation of the knowledge base combined with
links asserted manually by clinicians found a sensitivity of 65.8% and
specificity of 97.9% [227].
With the reputation metric approach, we identified 125 clinicians
with an estimated link appropriateness greater than or equal to 95%.
Problem-medication pairs linked by clinicians totaled 2,464 (982 pairs,
including 368 problems and 572 medications), making it the smallest
knowledge base. Our evaluation found the reputation metric knowledge
base alone had a sensitivity of 16.1% and specificity of 99.5%. When
combined with manual links by providers and the crowdsourcing
knowledge base, sensitivity was 66.3% and specificity 97.8% [311].
~ Page ! ~278](https://image.slidesharecdn.com/betterehr-151223134030/85/Better-ehr-279-320.jpg)

![mining, and text mining. To our knowledge, our work is the first to
combine the presentation of all approaches. A comprehensive evaluation
of approaches is important to allow researchers and informatics
personnel adopting these methods to understand benefits and drawbacks.
There are limitations to our work. Although each method is included
and presented for comparison, we were unable to directly compare
approaches without having each mapped to a single, standardized
terminology assessing overlap. Analyses were only performed
independently. Some approaches were only evaluated using a single
source of data. It is unknown if our approaches generalize across all
healthcare settings.
FUTURE DIRECTION
We plan to better map knowledge bases to standardized terminology.
We will also develop improved ensemble knowledge and apply these
approaches to additional clinical data elements, including laboratory
values and procedures. Our preliminary findings suggest additional
approaches might be necessary [292, 293]. We hope to use the resulting
knowledge bases to generate actual clinical summary screens (Chapter
19) and conduct a trial to determine if clinical summarization improves
patient safety.
SUGGESTED READING
Feblowitz, J. C., Wright, A., Singh, H., Samal, L., Sittig, D. F. (2011).
Summarization of clinical information: a conceptual model. J Biomed
Inform, 44(4), 688-699. doi: 10.1016/j.jbi.2011.03.008.
Klann J,. Wright A., McCoy A. B., Murphy S. (2012). The Medical App
Store, Research Data Repositories, and Physician Cognitive Overload:
Uniting Three Large, Multisite Grants for Health Care Transformation.
Panel Presentation presented at the AMIA Annu Symp Proc, Chicago,
IL.
Laxmisan, A., McCoy, A. B., Wright, A., Sittig, D. F. (2012). Clinical
Summarization Capabilities of Commercially-available and Internally-
developed Electronic Health Records. Appl Clin Inform, 3(1), 80-93. doi:
10.4338/aci-2011-11-ra-0066.
~ Page ! ~280](https://image.slidesharecdn.com/betterehr-151223134030/85/Better-ehr-281-320.jpg)

![INTRODUCTION
Clinicians with a clear understanding of their patients' problems and
diagnoses make better clinical decisions [313]. Overall quality of care
increases, as does health organization quality improvement and
measurement. Biomedical research efforts are also impacted.
Problem lists were first proposed by Dr. Lawrence Weed in 1968
[260]. Now a central component of problem-oriented medical records,
problem lists describe active diseases, document risk factors, facilitate
workups and treatment, promote continuity of care, help generate care
plans and manage preventative care [314-316]. Computerized problem
lists offer advantages over paper, such as linking laboratory results,
imaging studies, medications and allergies to central problems [260, 317].
Electronic patient problem lists can be enhanced by structured problem
vocabularies [318-320]. ICD-9 (International Classification of Diseases
[312]) and SNOMED (Systematized Nomenclature of Medicine Clinical
Terms) [301] are often used, but there are limitations [321-324]. Other
methods to improve the structure, accuracy, and utility of problem lists
have also been proposed [320, 325-328].
An accurate electronic problem list is a cornerstone of modern
electronic health records (EHR). Clinicians use problem lists to
familiarize themselves with the needs of a patient treated for the first
time, to inventory conditions that may require management during a
visit, or as a marker of contraindications for a therapy. Accurate problem
lists make it easier to communicate with other care providers. Despite
their importance however, problem lists are often incomplete and poorly
maintained [329-331]. Inaccurate problem lists are associated with low
quality of care [332, 333].
Partners Healthcare, a large integrated academic clinical care
network, uses problem lists to trigger reminders to help clinicians manage
chronic diseases, which account for a large proportion of healthcare
costs. Twenty-two percent of Partners' clinical decision support rules
depend on coded patient problem lists [313]. A clinician with a diabetic
patient, for example, will receive appropriate alerts and reminders to
guide care. Quality care is measured and tracked, and the patient
possibly flagged as eligible for special care management programs.
~ Page ! ~284](https://image.slidesharecdn.com/betterehr-151223134030/85/Better-ehr-285-320.jpg)
![To receive federal incentives for meaningful use under the
HITECH Act (up to $44,000 through Medicare and $63,750 through
Medicaid), providers must maintain an up-to-date problem list of
current and active diagnoses. Eighty percent of patients having at least
one problem must be recorded or an indication of no known problems
entered [114, 334]. Since problem lists are often incomplete, alternative
information sources have been sought. Several systems have been
reported using natural language processing to infer clinical problems
(25-27). Researchers have also used data mining to identify clinical data
as proxies for problems [226, 292, 335]. Carpenter and Gorman (2002)
used medication to identify possible problem mismatches [332] and
Poissant et al. employed a combination of billing codes, single-indication
drugs and prescription indications to infer problems in an electronic
prescribing system [336, 337]. Inferring patient problems through data
mining is promising, but reported systems are limited. Most use only a
single type of data (medication, billing code, or narrative text) to make
inferences. Many rely on time-consuming manual techniques for
generating knowledge bases. To our knowledge, none have provided a full
knowledge base for use or validation by others.
We describe a knowledge base for improving problem list
completeness [296], the results of a randomized trial conducted using
this knowledge base with an alert intervention [297] and the results of a
user survey [338].
APPROACH
We developed a problem list knowledge base using a six-step process
designed to yield high quality rules with known performance
characteristics [296]:
1. Automated identification of problem associations with other
structured data;
2. Problems of interest selection;
3. Preliminary rules development;
4. Characterization of preliminary rules and alternatives;
5. Final rule selection; and
~ Page ! ~285](https://image.slidesharecdn.com/betterehr-151223134030/85/Better-ehr-286-320.jpg)
![Figure 2. Cumulative number of problems added in the intervention and control groups.
We then conducted a survey of provider attitudes toward the
problem list and alert intervention. In total, 103 of 140 providers
completed an online survey (response rate: 73.6%). Twenty-eight
providers (20.0%) declined to participate and nine providers (6.4%) could
not be reached via email. Seven of the 103 responding providers
indicated they had not received the alerts, despite electronic logs
indicating all had received them. Non-responders were significantly more
likely male, significantly younger, had significantly fewer total notes (a
proxy for visit volume) and had significantly less unique alerts than
responders. Providers' attitude towards the intervention varied widely. Of
103 survey respondents, users reported a median alert frequency of 5.0 (a
few times per week, [IQR 5.0-7.0) across the study period. For the 96
providers reported receiving alerts, median alert accuracy and self-
reported acceptance rate were both 5.0 (sometimes accurate, [IQR
3.0-6.0]; and accepted alerts sometimes, [IQR 3.0-7.0]). Users reported
rarely accepting alerts when covering patients for another provider
(median = 2, IQR 1.0-3.0).
To assess potential predictors of alert acceptance, we performed
linear regression on both the providers participating in the trial (n = 140)
and providers responding to the survey (n = 103). For the trial, we
~ Page ! ~290](https://image.slidesharecdn.com/betterehr-151223134030/85/Better-ehr-291-320.jpg)

![20: Authoring Editing of
Decision Support Knowledge
Facilitating broader use
interoperability of best-practice CDS
knowledge
Robert A. Greenes, MD, PhD
Arizona State University
Davide Sottara, PhD
Arizona State University
Peter J. Haug, MD, PhD
Intermountain Healthcare
ABSTRACT
We worked with a national initiative to refine a model for
representing clinical decision support (CDS) knowledge in unambiguous,
sharable, standardized form to help electronic health record system
vendors better integrate best-practice CDS into products. We also created
a tool for knowledge engineers and subject matter experts to author and
edit CDS knowledge in this sharable form.
INTRODUCTION
This project began by addressing the complexity faced by health care
organizations and practices in developing computable rules from
narrative decision support recommendations and customizing the rules to
unique setting-specific factors (SSFs). The customization of knowledge to
smoothly integrate into the workflow in a particular setting and
adaptation to other local considerations have long been recognized as
requiring a major effort. Failure to do this well will often impede
successful implementation. Based on prior work by a consortium in which
we were engaged (The Morningside Initiative [339]), we developed a
four-stage knowledge refinement paradigm:
~ Page ! ~295](https://image.slidesharecdn.com/betterehr-151223134030/85/Better-ehr-296-320.jpg)
![• Initial markup and categorization of a recommendation based on
purpose, user, domain, and other components using narrative text
entries.
• Formalization of the above using information modeling, coding
systems, and value sets.
• An iterative process of modeling of adaptations of the rule based on
SSFs, such as how a rule would be triggered in a particular setting, in
what clinical context, refinement of inclusion and exclusion criteria,
incorporation of timing considerations (such as pre-event firing when
an action is due vs. post-event firing only if the action was not done
when expected), and to whom and how the recommendations or
actions are to be delivered.
• Conversion to an executable form for use in a particular environment,
typically involving translation to a proprietary electronic health record
(EHR) system's internal knowledge representation format and mapping
of the information model (the patient data and the rule's clinical
knowledge) to the EHR's internal representation.
The initial goal of the project was to develop the details of the Stage
2 and Stage 3 knowledge refinement process and to create an
Implementer's Workbench (an editing tool) that would facilitate this
process. Stage 4 was beyond the scope of the project, but there had been
a prior demonstration showing this was feasible by automatically
converting rules developed in an XML-based version [259] of the Arden
Syntax [340, 341], a standards-based rules language for healthcare, to
Drools [342], a popular generic rules management system representation.
With the onset of the Health eDecisions (HeD) Initiative in 2012
[343] sponsored by the Office of the National Coordinator for Health
Information Technology (ONC), midway through the project the team
was asked to turn its efforts to working with a national team on the
development of a standard model-based representation and XML
exchange format for best-practice knowledge that could be included as a
requirement for EHR systems as part of Meaningful Use Stage 3.
Knowledge to be exchanged was intended to include decision rules, order
sets, and documentation templates. All of the above types of artifact in
the HeD Initiative were considered typically to consist of sections of the
~ Page ! ~296](https://image.slidesharecdn.com/betterehr-151223134030/85/Better-ehr-297-320.jpg)
![The knowledge authoring problem for health care-oriented KAs
typically suffers from a disconnect between the ability of a human expert
to comprehend and grasp it and the detail required for mapping the
knowledge to formal patient data/information model elements, coding
schemes, value sets, and proprietary record formats and modes of
execution. Thus, most knowledge authoring today is done by using
custom or system-specific authoring/editing tools provided by the EHR
vendor and is typically at a level that must be carried out by a KE or
software engineer. There is little ability to organize the corpus of
knowledge to review what it contains, search it by specific attributes (such
as domain, setting, usage, or mode of intended execution), manage the
corpus of knowledge or update it, or identify gaps in knowledge requiring
attention. Thus, we believe that this work, while limited in initial scope to
the goals of the HeD initiative, has the potential to be extended to enable
it to be useful also for the original goals of the project to accommodate
specialization with SSFs, and for a variety of other purposes that are
enumerated in the final section.
APPROACH
We worked in conjunction with other national participants in the
HeD Initiative to develop a formalized model of KAs that could be
standardized (working with the Health Level Seven (HL7) [344]
standards development organization) and that could be used as a basis for
creating a distribution/exchange rendition of the KA in XML format
[345]. The model-based approach is in contrast to focusing only on the
XML representation and has enabled a variety of powerful capabilities
to:
• View, refine, and extend the model;
• Provide model-based associations and constraints as a guide to
authoring/editing and run-time usage of KAs;
• Translate the KA to a variety of formats (not just XML) but English or
other languages, Drools, Arden Syntax, or various rule engine syntaxes,
provided the target format has a well-defined syntactical structure and
that adaptors are explicitly built for this purpose;
~ Page ! ~298](https://image.slidesharecdn.com/betterehr-151223134030/85/Better-ehr-299-320.jpg)
![• Be incorporated into a knowledge repository allowing appropriate
indexing and tagging based on the model component types, coding
systems, and value sets.
The internal model is based on Description Logic, a widely adopted
formalism with descriptive and inferential capabilities [346]. More
specifically, we have chosen the Web Ontology Language v2 (OWL2-DL)
[347], a W3C standard designed for interoperability over the web. This
choice facilitated the development of the models and the software, since
there exist several software tools and libraries, such as Protégé [348] or
the OWL APIs [349] that support the OWL2-DL language natively.
Moreover, OWL2-DL has been specifically designed for open,
collaborative environments such as the Web. Many general-purpose (or
upper) ontologies have been released by research groups and/or
standard-defining organizations using OWL, providing initial foundations
for domain-specific models. Some of these ontologies inspired the
creation of the HeD XML schema in the first place. However, the XML
specification was mostly focused on the ability to deliver the content as
output; it was not intended to capture or represent the complete
semantics present in the original ontologies. The editor, however, tries to
leverage both the content and the context. In particular, the foundations
of our work are:
• SKOS [350], which was used to conceptualize clinical and medical
terms and vocabularies;
• The Dublin Core (DC) [351], which was the basis for the HeD
metadata;
• The Production Rule Representation [352]OMG standard (PRR),
which provided the general structure of a KA;
• and a combination of Object Constraint Languages [353], inspiring
the HeD expression language.
We also included the LMM [354] to capture concepts and the ability
to reference and mention them, as well as the DULCE/IO-Lite [ 355]
ontologies, which allowed us to contextualize our required concepts and
provide support for a future integration of SSFs (Figure 1).
~ Page ! ~299](https://image.slidesharecdn.com/betterehr-151223134030/85/Better-ehr-300-320.jpg)
![Figure 1. The modular HeD ontology and its dependencies.
We extended and harmonized these ontologies to include the specific
concepts needed to model HeD artifacts and their content. We also
adopted a modular approach to preserve the original components and
facilitate future extensions. Notice that, although some ontologies have
been created manually, others have been generated dynamically. For
example, the rule authoring process requires a description of the domain-
specific information model used to deliver the data at runtime (HL7 vMR
[356], in our case). This model is also described using an ontology, which
has been derived from the vMR schema. Similarly, the ontology module
that covers the expression language is the result of a partially manual and
partially automated generation process. At the time, in fact, the HeD
schema did not completely define and constrain the use of the expression
language, delegating that responsibility to an implementation guide.
Being expressed in natural language, the implementation guide could not
be integrated directly in our semantic framework. We first had to
formalize the additional content of the implementation guide before we
could integrate the expression language with the rest of the editor's
framework.
The ontologies are the models driving the editor which, in turn, are
based on a simple 3-tier architecture (Figure 2). The persistence layer
allows storage and retrieval of a KA from a repository (currently a simple
repository based on a file system implementation is provided, but APIs
will allow replacement of it with a more robust implementation). The
KAs are stored in RDF [357]format rather than HeD/XML to preserve
~ Page ! ~300](https://image.slidesharecdn.com/betterehr-151223134030/85/Better-ehr-301-320.jpg)
![the additional information in the semantic description. The editor core is
responsible for loading the artifact being authored and the ontologies
required to model it. The core will also analyze the artifact, generate the
internal data structures required during the authoring process and apply
the additions and transformations requested by the user through the user
interface. The presentation layer is a pure web-based application written
in JavaScript which interacts with the core through a set of RESTful
[358] application programming interfaces (APIs). The core is packaged
as a Play™ [359] application, which allows the editor to be deployed in
the cloud, as well as a web application container such as Tomcat [360].
Figure 2. Implementer's Workbench conceptual architecture.
Relying on the underlying formal model and the editor's modular
architecture, our basic approach to developing the editor was to create
constructs that SMEs could use to define a KA at a somewhat high,
conceptual level and to associate with each construct the specific
attributes needed to be specified in order to create a placeholder for it.
For example, if a rule is to refer to the existence of a specific laboratory
test result being available within a timeframe and above a threshold
value, then the name and the timeframe and value need to be specified.
A default coding scheme can be associated with it based on the model
~ Page ! ~301](https://image.slidesharecdn.com/betterehr-151223134030/85/Better-ehr-302-320.jpg)
![provided, and a presumptive coded value or value set can be provided,
but these can be refined later by a KE.
We used five approaches to design the SME-oriented interface:
1. Extensible library of templates for higher-level constructs. If one is entering a
clause for a rule about laboratory test results, the model defines
certain attributes that are associated with the concept of laboratory
test results, that might be required to be specified in a rule, such as
the date the test was done and its value. But we can go further by
identifying likely clause types that a laboratory test might participate
in, such as whether the test was performed within a specified date
range or whether its result exceeded a threshold. By creating
prototypes or templates for such constructs, we make it easier for an
author to create a rule with such a clause, since it pre-associates the
appropriate operator and operand(s), and suggests needed attributes
as well as possible optional ones, as well as possible default coding
systems and values. A prior study by Greenes and Sordo [356] in
reviewing rules at Partners Healthcare in 2004 showed that the many
thousands of rules in use tended to reuse some 40+ clause types. This
suggests that creating templates for commonly used clause types
would be both feasible and useful. The templates determine which
data element properties are relevant, so selecting a template type
means the author need only focus on specifying those properties
needed for a specific clause type. Moreover, templates support default
values and/or constraints on operations and values, which further
simplifies the authoring and allows validation routines to be run. The
templates are defined using a dedicated ontology, but can be pre-
loaded from a spreadsheet compliant with a simple schema, derived
from the official HeD template specification for Use Case II.
2. Extensions of the terminology server to recognize concept classes. Ideally,
authors can begin typing a concept or a clause and, as they do so,
have the system suggest the full concept corresponding to what they
are typing. HbA…, as it is being typed, could be anticipated to be
HbA1c, which is a synonym for Hemoglobin A1c, which, in turn,
is recognized as a lab test name. This would enable a user to select a
lab test clause for a rule without having to first declare that he/she is
intending to write a clause about a lab test. Moreover, based on the
~ Page ! ~302](https://image.slidesharecdn.com/betterehr-151223134030/85/Better-ehr-303-320.jpg)
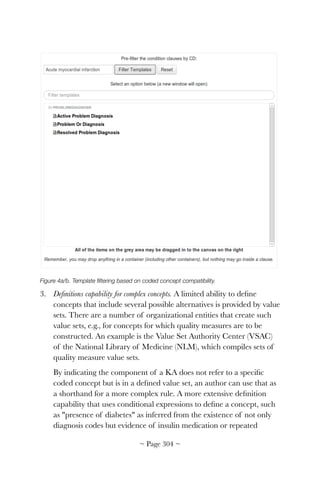
![elevated HbA1c values is also desired, but beyond the scope of the
current HeD model and is identified in the discussion of possible
extensions at the end of this chapter.
Once defined, value sets can be uploaded to the terminology service.
The editor will then be able to use the value sets, either as an
aggregated concept or explode them to pick individual codes. For
initial testing, we have been able to load value sets into our version of
the CTS2 terminology server through a CSV file/spreadsheet,
invoking a custom utility.
4. A visual building-block approach to constructing KAs. Especially for rules,
logic expressions can be complex, involving multiple AND, OR, and
NOT clauses, sometimes nested. Triggers and actions can also have
several components, and actions, in particular, can be complex,
particularly for representing multi-part actions in rules or for order
set or documentation template types of KAs. To address this, we
adopted the Google Blockly [361] visual expression authoring tool to
support the creation of complex constructs using Lego-like building
blocks. Individual components as well as aggregations can be given
short names that are highly readable.
This capability is used in several authoring system components. The
expression authoring section, designed principally for KEs, allows
HeD named expressions to be composed using blocks generated
dynamically from an expression ontology. This expression ontology is
derived from the HeD model. A similar visual approach is used to
allow navigation of the domain model (the vMR in our current
approach to HeD KA authoring) to include references to domain
classes and properties. (See Fig. 5.)
~ Page ! ~305](https://image.slidesharecdn.com/betterehr-151223134030/85/Better-ehr-306-320.jpg)
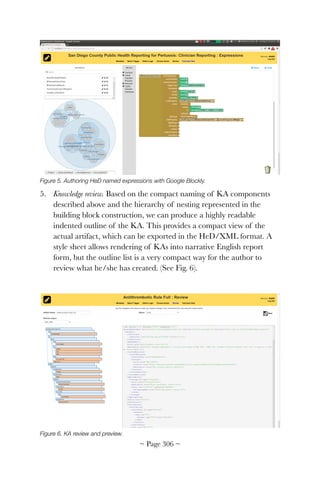
![PRODUCTS
The products of this work included the team's contribution to the
HeD modeling process itself and, specific to this project, the development
and initial testing of the HeD knowledge artifact editor.
A beta version of the HeD editor has been released under the
Apache Software License v2 Open Source license and is available at
https://github.com/sharpc2b, where it is periodically updated.
Documentation is also available at this location. The community is
encouraged to extend this tool and contribute to the repository.
As of June 2014:
• The SHARPc2B/HeD core, derived ontologies, and an initial set of
templates are available, possibly as independent models.
• The editor core allows import, authoring, and export of HeD-XML
artifacts in a controlled way. The major components of HeD, such as
metadata, expressions, triggers, conditions and actions (atomic,
conditional and composite), are supported and can be authored simply.
• The authoring process is assisted and constrained both at the SME
level using templates and the KE level, where the Blockly-based
expression model allows for type validation and additional analysis.
• The editor core is based on the Play Framework so that it can be
deployed in a cloud environment. It can also be packaged as a WAR
application (a means of packaging and distributing a collection of
JavaServer pages [362] and deployed in a web container.
• The editor UI is a pure web application distributed as a WAR file.
• To enable support for medical terminologies and value sets, a CTS2
service must be available and reachable by the editor. Recommended
open source implementations are listed in the editor's documentation.
Known limitations:
• While the editor is model driven, both the domain models (such as
vMR) and the template lists are processed at compile time and loaded
when the editor is launched. The architecture would also allow loading
of the resources at runtime, but this functionality is not yet exposed to
users.
~ Page ! ~307](https://image.slidesharecdn.com/betterehr-151223134030/85/Better-ehr-308-320.jpg)
![• The application backend is cross-platform. Likewise, the front end is a
pure web application. However, the latter has only been tested with
Google Chrome. Compatibility is not yet guaranteed with other
browsers. Corollary services such as authentication, security, or a
proper repository implementation have not yet been implemented in a
robust way.
• The editor's UI should adjust to and constrain the user when authoring
different types of artifacts, but this functionality has not yet been
implemented.
• The editor has not yet been subjected to a QA process. While HeD
artifacts are generally supported, fine-grained tests to ensure coverage
for every possible element have not yet been performed to this date.
An example of the use of the HeD editor for a rule is the following,
adapted from NQF 0068 for antithrombotic therapy on discharge of
patients who have ischemic vascular disease, such as an acute myocardial
infarction, or who have had a coronary artery bypass graft, or a
percutaneous coronary intervention. This was originally developed as a
quality measure by the National Quality Forum [363], but a proactive
decision rule was created by NewMentor and provided as part of the
pilot evaluation of the HeD model.
The quality measure rule conditions are: patients 18 years and older
with ischemic vascular disease (IVD) who were discharged alive for acute
myocardial infarction (AMI), coronary artery bypass graft (CABG) or
percutaneous coronary interventions (PCI) from January 1 to November
1 of the year prior to the measurement year, or who had a diagnosis of
ischemic vascular disease (IVD) during the measurement year and the
year prior to the measurement year and who had aspirin or another
antithrombotic during the measurement year.
Clinical concepts of AMI, CABG, IVD, and antithrombotic
medications are defined by specified value set groupings published by
NCQA, and maintained by the NLM VSAC. The flow chart for the
proactive decision rule adapted by Motive Medical Intelligence (formerly
NewMentor) as part of one the HeD Use Case 1 pilot projects is depicted
in Figure 7.
~ Page ! ~308](https://image.slidesharecdn.com/betterehr-151223134030/85/Better-ehr-309-320.jpg)
![Figure 7. Informal specification of the NQF0068-derived CDS Rule. (Retrieved from http://
wiki.siframework.org/file/history/open+house+_final_v2.pptx (New Mentor). Reproduced by
permission.)
Using the editor, we modeled the trigger event as being in pre-
discharge status. This could either be a status field in a patient's record or
identified as a scheduled event to discharge within, say, 12 hours. For
simplicity we use the trigger of patient status change to pre-
discharge (Figure 8).
Outputs:
This diagram represents a clinical rule based on NQF 0068 | PQRS 204:
Ischemic Vascular Disease (IVD): Use of Aspirin or Another Antithrombotic
Patients 18 years and older with ischemic vascular disease who were discharged alive for acute
myocardial infarction (AMI), coronary artery bypass graft (CABG) or percutaneous coronary interventions
(PCI) from January 1-November 1 of the year prior to the measurement year, or who had a diagnosis of
ischemic vascular disease (IVD) during the measurement year and the year prior to the measurement
year and who had the following during the measurement year. -Use of aspirin or another antithrombotic.
The clinical concepts of AMI, CABG, IVD, and Antithrombotic medications are defined by specified value
set groupings published by NCQA, and maintained by the NLM Value Set Authority Center.
Actions (select one):
Patient age ≥18 yearsAND IF AND IF NOT
Alert Message:
“Patient was identified as havingischemic vascular
disease, AMI, or related procedure. No aspirin or other
antithrombotic was found on the patient's active
medications”
Patient Data Message:
“Patient was identified as having[relevant diagnosis
or procedure from the patient’s record]”
Medication Order:
[List of medications that could be
ordered to satisfy the measure]
THEN
Documentation:
Document antithrombotic already in the
patient’s active medications
Documentation:
Document reason for not prescribing
antithrombotic
AND
OR OR
IF Diagnosis or Procedure:
AMI
CABG
IVD
or
or
Medication:
Antithrombotic
Documention:
Reason for not prescribing
antithrombotic
AND IF NOT
~ Page ! ~309](https://image.slidesharecdn.com/betterehr-151223134030/85/Better-ehr-310-320.jpg)
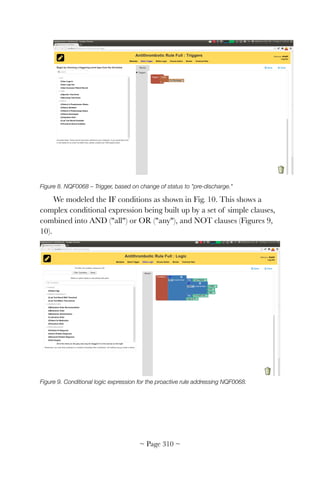
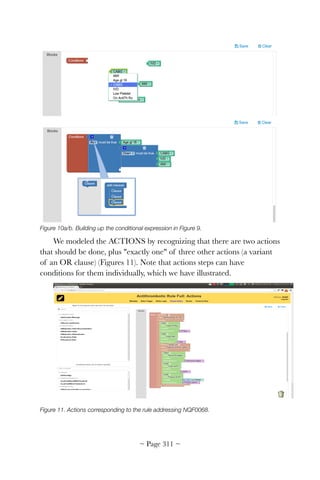
![FUTURE DIRECTION
The natural constituency for HeD KA exchange, and therefore
authoring and editing of the KAs, does not yet exist because of the lack
of regulatory or other stimulus to raise its importance to EHR,
knowledge vendors and healthcare organizations. Anticipating that such
stimulus will indeed be present in the near future, there are a number of
enhancements that should be made to the tool.
First, if import and export of HeD KAs does become a requirement,
the following activities would add to the tools value:
1. More templates for commonly used constructs (i.e., trigger types,
conditional expression clause types, and action types) should be
added to the template library. This could be targeted based on
experience with authoring rules and analysis of them to determine
the most frequent constructs. Templates could then be collected in
libraries and enhanced with domain-specific extensions, e.g., for
pharmacogenomics CDS.
2. Automatic selection or filtering of potential templates as a user
begins to type a phrase based on concept type of the term being
typed could be enhanced. Although the current version of the CTS2
terminology server doesn't include this, an approach could be to look
up the term being typed in the UMLS [364] SPECIALIST lexicon,
which contains most abbreviations, synonyms, and variants of
clinical concepts. These point to a Concept Unique Identifier in
UMLS. The various coding schemes used for that concept and the
appropriate code(s) in them are also provided (e.g., for a medication,
RXNORM is identified as a coding scheme and the RXNORM
code for the medication is provided). In addition, the concepts have
an associated semantic type in the UMLS [364] Semantic Network,
for example, a medication would have a type Pharmacologic
Substance or Biologically Active Substance. A laboratory test
result would have a type Laboratory or Test Result. If the main
concepts of templates are pre-associated with such semantic types,
then entering a specific term, synonym, or abbreviation can be
recognized as calling for use of templates with main concepts of the
corresponding semantic types. The set of possible templates, e.g.,
those relating to conditions about laboratory tests, could thus be
~ Page ! ~313](https://image.slidesharecdn.com/betterehr-151223134030/85/Better-ehr-314-320.jpg)
![offered to the user and guide the remainder of the clause
construction, suggesting other relevant attributes that need to or
could be specified.
3. The formal incorporation of useful libraries of value sets, such as
those for the quality measures currently being assembled by the
NLM VSAC, can be incorporated into the CTS2 server.
4. Additional definition capability might be considered as an extension
of the HeD model. This would involve the ability to create a logical
conditional expression that has as its action, if true, the assertion of a
definition being true. For example, the presence of diabetes could be
asserted for a patient by either the existence of an appropriate
diagnosis code in the EHR, or by two or more abnormal HbA1c
values, or by the existence of insulin or other hypoglycemic agent
medications in the record.
5. Although HeD does not define a particular patient information
model, most of the work to date has been done assuming that the
model to be used will be based on the vMR. However, the surge of
interest recently in the Fast Healthcare Interoperability Resources
(FHIR) specification as an alternative model for both data
representation and transport suggests an authoring system should be
able to generate KAs capable of including FHIR-based data
references. In addition, efforts by the Clinical Information Modeling
Initiative (CIMI) may establish definitions of compound clinical
concepts in which concepts have associated relevant attributes, based
on the Clinical Element Model (CEM) approach pioneered by Huff
et al. [365] at Intermountain Healthcare. There are now some efforts
underway to expand FHIR profiles to include CEMs. If these efforts
gain broad acceptance, it would be useful for the knowledge editor to
support them.
6. To further the usefulness of a standards-based tool such as the HeD
editor, it would be useful to create a set of adaptors to render created
artifacts in other useful formats, such as Drools, Arden Syntax, and
other rules engine languages.
In addition, the capabilities developed have a number of other
potential uses if opportunities for funding and carrying out the necessary
~ Page ! ~314](https://image.slidesharecdn.com/betterehr-151223134030/85/Better-ehr-315-320.jpg)

![21: Cognitive Support for
Clinical Comprehension
SHARPC project 2A
Trevor Cohen, MBChB, PhD
The University of Texas Health Science Center at Houston School of Biomedical Informatics
Thomas Kannampallil, MS
The New York Academy of Medicine
Vimla L. Patel, PhD, DSc
The New York Academy of Medicine
ABSTRACT
We developed and evaluated a Cognitive Support System (CSS) that
organizes clinical information to support decision making. Previous
research showed organizing information is a distinguishing characteristic
of expertise and a prerequisite to effective problem solving [366]. We
elicited knowledge from experts and characterized their decision making
processes. Decision models were then rendered computer-interpretable to
organize patient data. CSS user interfaces were developed to present real
and synthetic patient data. Studies comparing participant interpretation
with and without CSS interfaces suggest CSS mediates high-level clinical
data organization and is conducive to problem solving.
INTRODUCTION
Clinicians' attention to complex patient conditions is a precious
resource too often consumed by the extra cognitive demands of
information overload, time pressure, aggregating and synthesizing data
from disparate sources. Research has shown that comprehension of a
situation is a prerequisite to accurate mathematical [367] and medical
problem solving [368]. The ability to organize information to facilitate
rapidly generating solutions is a distinguishing characteristic of experts,
including expert physicians [369]. The cognitive burden of organizing
clinical information is compounded by the need to elicit, select, gather
and integrate relevant data [370]. We propose a cognitive support system
~ Page ! ~319](https://image.slidesharecdn.com/betterehr-151223134030/85/Better-ehr-320-320.jpg)
![(CSS) that uses supporting knowledge structures to help clinicians make
effective decisions by organizing and aggregating information in a
problem-specific manner.
The EHR as a cognitive artifact
The Electronic Health Record (EHR) is under scrutiny.
Unprecedented in scale and scope, the Office of the National
Coordinator (ONC) for Health Information Technology (HIT) launched
initiatives to spur national HIT adoption. Potential benefits include
significant cost savings and improved patient safety [371]. EHR
implementation, however, carries the risk of unintended consequences,
including errors [17, 174, 202]. While some errors have been attributed
to socio-technical factors, others relate to technology's impact on
clinicians' cognitive processes [372]. Unintended effects were
demonstrated in a study comparing records produced by physicians with
and without an EHR [251]. The EHR changed the nature of
information recorded by physicians and the impact continued even after
physicians stopped using the EHR. HIT's unintended effects can be
positive or negative. Consequently, EHRs can be considered a cognitive
artifact—artificial devices that maintain, display or operate upon
information in order to serve a representational function and that affect
human cognitive performance [373]. As cognitive artifacts, EHRs have
an effect on human cognitive performance, planned or not. The design,
implementation and deployment of EHR systems must, therefore, be
closely aligned with the information processing skills and limitations of its
users.
The perils of sub-optimal design
Consider the case of a potassium chloride overdose [255].
Intravenous (IV) medication errors are well recognized as a recurring
cause of potentially harmful events [374]. Computerized Provider Order
Entry (CPOE) systems have been proposed as a way to reduce errors
[375]. In this case, however, the opposite occurred. CPOE screens for
drip and IV bolus orders were superficially similar, yet required different
mental calculations to estimate dosage. Orders for IV bolus doses were
specified by dose. Orders for other IV administrations were specified by
duration, but labeled Total Volume on the entry screen. Total Volume was
meant to indicate size of IV bag, not total amount of fluid to be delivered
~ Page ! ~320](https://image.slidesharecdn.com/betterehr-151223134030/85/Better-ehr-321-320.jpg)
![to the patient. IV fluid orders were not displayed on the medication
review screen, further complicating bolus calculations. Calculating
correct infusion dose is an essential task. Unfortunately, the CPOE system
did not provide tools to assist with this process, and its interface design
was a poor fit for the conceptual operations clinicians use calculating
dosage (i.e., volume vs. duration). Research literature is littered with
examples demonstrating how poor interplay between technology and
clinical decision making can negatively affect health care [17, 95].
Characterizing cognition
The overdosing case exemplifies a larger problem: current EHR
systems are not always designed to support clinical decision making.
Many serve primarily as media for information storage and retrieval, and
are not aligned with mental processes underlying clinical decisions. While
the idea of engineering systems to accommodate the constraints of a
given task and those of the human cognitive system is not new [376,
377], the approach taken in our research differs in focus and methods.
Our work is rooted in decades of medical decision making and reasoning
cognitive research [369, 378-380]. Theories and methods allowed us to
characterize knowledge structures, conceptual operators and decision
strategies underlying clinical tasks.
We based reference models on how experts organize information,
since experts have shown superior abilities to generate representations
conducive to problem solving [381], including medical problems [382].
Organizing clinical information in an expert-like manner enhances the
clinical comprehension of less experienced practitioners [383]. However,
the extent to which expert representations must be adapted to facilitate
non-expert comprehension is controversial and should be empirically
evaluated. A good example of expert cognition as a basis for expert-like
performance is provided by Staszewski's research on landmine detection
[384]. A training program based on expert strategies dramatically
improved performance in detecting low metal mines, from approximately
10% to greater than 90%. Spatial representations of mines was found a
distinguishing characteristic of expert mine detectors. Staszewski's group
also developed an augmented display that represented buried mines from
auditory signals emitted by a mine detector [385, 386].
~ Page ! ~321](https://image.slidesharecdn.com/betterehr-151223134030/85/Better-ehr-322-320.jpg)
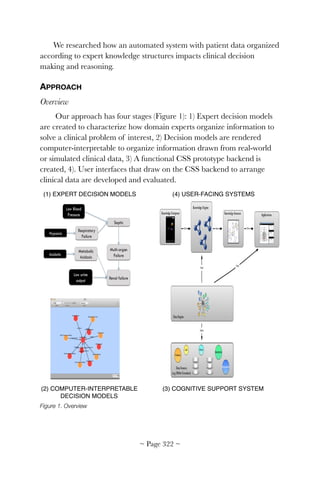
![Stage 1: Characterizing cognition
Systemic Inflammatory Response Syndrome (SIRS) is an
inflammatory state with ominous prognostic implications. Clinically
deciding if a patient exhibits SIRS is a sub-component of a larger
assessment process, including the probability of underlying infection and
likely infection causes. For the purposes of illustration, we restrict our
focus to the question, is this SIRS? Despite a well-defined set of criteria
for SIRS [387], this decision point is considerably more complex than it
appears.
Our approach characterized knowledge structures and cognitive
processes underlying a decision. Of particular interest is how experts
facilitate problem solutions. For example, in the reasoning of a master
chess player, the cluster of pawns, rook and king making up the powerful
defensive castled-king position is perceived as a unit [388]. In the
literature on medical cognition, this structure is referred to as intermediate
constructs [389]. Expert physicians are distinguished by their ability to
recognize these constructs [390] to facilitate efficient and accurate
diagnostic reasoning. In medicine, intermediate constructs are
meaningful clusters of clinical findings (e.g., right-sided cardiac failure
or respiratory problem), which are not in themselves diagnostic, but
partition the search space of possible diagnoses. Cognitive processes of
interest include comparison or generation of new hypotheses during
diagnostic and therapeutic reasoning.
The excerpts in Table 1 are drawn from an in-depth knowledge
elicitation session involving two intensivists. Participants were encouraged
to discuss the condition and generate a visual representation of their
knowledge on a whiteboard, which was captured for further analysis. The
intensivists were told to steer the discussion toward intermediate
constructs. SIRS constitutes one possible intermediate construct.
~ Page ! ~323](https://image.slidesharecdn.com/betterehr-151223134030/85/Better-ehr-324-320.jpg)
![Table 1. Excerpts from a knowledge elicitation session.
Figure 2. An excerpt from the SIRS Concept Map. The four relevant criteria that trigger a
possible SIRS diagnosis are shown within the shaded box.
Sessions were recorded, transcribed and key sets of concepts
captured as Concept Maps [391] using the CMapTools software package
[392] (Figure 2). Included are SIRS diagnostic criteria, such as reference
ranges for white blood count, heart rate, respiratory rate and
temperature. Note that this is a component of a larger model that
includes prognostically important factors such as presence of organ
failure.
The decision making process was characterized at a granular level by
applying a coding system from previous research in pediatric cardiology
[380]. We isolated and coded conceptual operators used to reach the
categorical decision whether this constitutes a case of SIRS or not. For
Excerpt 1 Physician 1: …and white count is greater than 12 but less than 4…
Physician 2: Right.
Physician 1: …and fever is greater than 38 or less than 36.
Excerpt 2 Physician 2: It would, so there's variations where obviously if you have
heart condition, you may not get to a heart rate of 90, um, if you are on
sedative drugs.
Excerpt 3 Physician 2: …over the course of 2-3 days if it goes up you start worrying
about it.
~ Page ! ~324](https://image.slidesharecdn.com/betterehr-151223134030/85/Better-ehr-325-320.jpg)
![example, the first excerpt in Table 1 illustrates the compare-to-norm
conceptual operator where an observed clinical parameter is compared to
reference ranges included in official SIRS criteria. The second excerpt
illustrates a compare-to-expected operator in which mitigating
circumstances affect the extent to which usual reference ranges apply.
The third excerpt illustrates a compare-over-time operator, which may
provide an early indicator that SIRS is approaching.
The characterization of a decision informs the presentation of
information supporting it. Required data elements are identified
displayed without extraneous details distracting from the decision.
Conceptual operators suggest visual representation of the data. For
example, compare-to-norm requires rapid assessment of the relationship
between a data point and an established norm, and could be facilitated
by an annotated bar graph, while compare-over-time suggests a trend
line over time. In contrast, compare-to-norm suggests integrating
additional information, in this case the dose of a specific class of
medications.
Stage 2: Computer-interpretable models
Information generating a decision model-based interface must first be
rendered computer-interpretable. Decision models developed in Stage 1
were granular and included a range of concept relations that could be
rendered computer-interpretable for cognitive support. A core set of
conceptual relations were identified and reduced to a set of Resource
Description Framework (RDF) triples, rendering them amenable to
automated reasoning with semantic web technology.
Core relations were identified by studying verbal think-aloud protocol
transcriptions collected in a Medical Intensive Care Unit [370]. This
ensured the identified set of conceptual relations were sufficiently general
to apply to a range of clinical decision tasks. Data consisted of think-
aloud protocols generating a description of a patient case (including
collection of prerequisite data). Participants in this study involved eight
ICU physicians, each of whom accounted for one case. Verbal protocol
data of this nature has been widely employed to characterize cognitive
processes underlying decision making [393]. We analyzed the protocols to
define a set of relations sufficient for cognitive support.
~ Page ! ~325](https://image.slidesharecdn.com/betterehr-151223134030/85/Better-ehr-326-320.jpg)
![Transcribed data were analyzed in three stages using a grounded
theory approach [394]. The first pass (open coding) deconstructed
transcripts and phrases for identification and categorization (e.g., urine
analysis, make us think, source of infection, CT chest, make sure,
etc.). Then, coded key phrases were grouped into categories (axial
coding ) according to form an initial coding framework (e.g., vital signs,
diagnoses, medication orders, suggestions, causes, etc.). Categories were
integrated into higher-level themes (selective coding) to form a structured
conceptual framework, which described physicians' cognitive processes
during medical problem solving (e.g.,observations, interpretations,
suggests, explains, etc.). A constant comparison approach was
subsequently adopted in which concepts deconstructed from each
transcript were analyzed and either integrated into the existing coding
scheme or resulted in the emergence of new codes which were then
added to the overall scheme.
Coders with medical and informatics backgrounds recorded details
of how coding decisions coding were made and how codes were linked to
the original transcripts. This provided justification for the creation of
codes. Debriefing sessions involving another member of the research
team, also with a medical background. Coders discussed the rationale for
code development. If disagreements arose, each would elaborate reasons
for their decision until a consensus was reached (Table 2).
Deterministic Probabilistic Consequential Temporal General
Causes
Increases
likelihood
Accentuates Follows Associates with
Confirms
Reduces
likelihood
Has effect
Contraindicates Has risk
Explains Has sign
Is consistent with Prevents
Rules out
Suggests
Treats
~ Page ! ~326](https://image.slidesharecdn.com/betterehr-151223134030/85/Better-ehr-327-320.jpg)
![Table 2. Summary of 16 relationships identified and included in the framework categorized into
5 classes.
A relations set validation study was conducted using case reports
from the Clinical Problem Solving feature of the New England Journal
of Medicine (NEJM-CPS) [395]. NEJM-CPS articles provide
interpretations with detailed explicit description of a contributing expert's
reasoning, instead of only reporting clinical details. The capacity to
represent these explanations would support the cognitive utility of our
core set of relations. To assess this capacity, graphical representations of
five NEJM-CPS case explanations (Figure 3) were evaluated for
completeness by two domain experts. Ratings were generally positive
(mean=9/10), supporting that our relation set was sufficient for a broad
array of clinical reasoning tasks.
Figure 3. From the NEJM-CPS article, A Problem in Gestation [396]. The graph was created
using CmapTools [392] from: Labor is rarely described as abrupt in onset, is usually colicky in
nature, and is often associated with other symptoms or signs, such as blood tinged vaginal
discharge. When there is doubt regarding the cause of the pain, observation and serial
examinations of the cervix for evidence of change are helpful. Musculoskeletal pain is
common, and its likelihood increases as pregnancy advances, owing to weight gain, the
loosening of connective tissues with the hormonal changes of pregnancy, and the shift
forward in the woman's center of gravity. Pyelonephritis is a concern with an abrupt onset of
back pain, but it is unlikely in this patient, given the reported location of the pain and the
absence of fever, chills, urinary frequency, and dysuria.
This core set of relations was used to encode the SIRS-related
decision model in a computer-interpretable form. Our MedSense
Knowledge Engine uses semantic web technologies to represent model
concepts and relations as a set of RDF triples and makes these services
available to other programs. Figure 4 illustrates concepts and relations
~ Page ! ~327](https://image.slidesharecdn.com/betterehr-151223134030/85/Better-ehr-328-320.jpg)
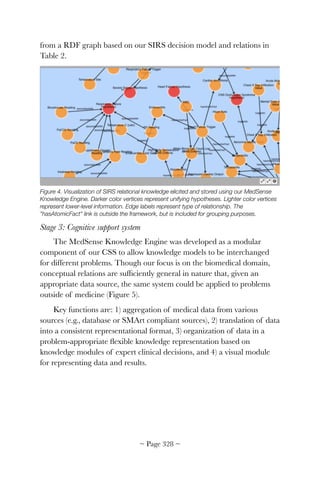
![Figure 5. CSS architecture for clinical decision support showing three main components: data
engine, knowledge engine, and user interface.
Key components of the CSS architecture are:
1. Data sources and data engine
Although we use a generic data source in the current version of our
system, we previously used SMArt platform, a SHARP-funded effort to
promote development of applications that could function on multiple
EHR platforms [397]. We extended the model to incorporate the ability
to retrieve data from multiple sources, including SMArt or similar
platforms, to allow integration of MIMIC-II [398] data. MIMIC-II is a
large-scale database of de-identified intensive care unit (ICU) data
available under license that provides an invaluable source of physiological
data for organization in accordance with our knowledge models. Without
MIMIC-II, it would be difficult to evaluate the effect of knowledge
organization because simulating ICU cases with high fidelity is time-
consuming given the large number of synthetically estimated data points
needed.
The core of our data engine is an abstract ontology model that
describes raw clinical information with flexible metadata, such as class,
value, value unit, normal value range, and possible interpretation of the
value. Ultimately, patient data will be mapped onto the information
model and exposed to the rest of the system through a set of application
~ Page ! ~329](https://image.slidesharecdn.com/betterehr-151223134030/85/Better-ehr-330-320.jpg)
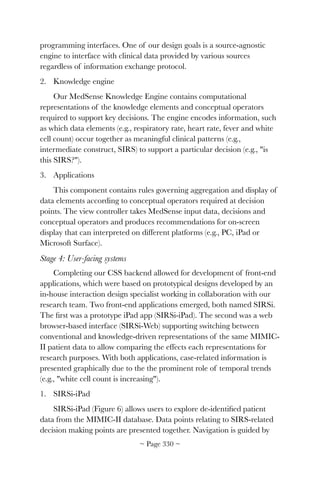
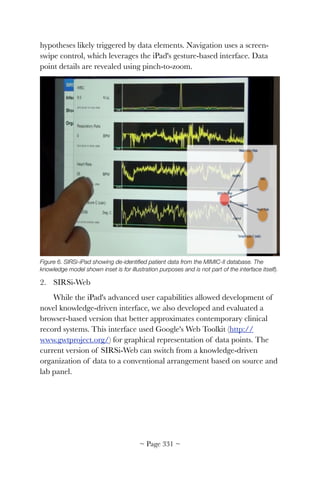
![Figure 7. SIRSi-Web showing de-identified patient data from the MIMIC-II database organized
in accordance with SIRS knowledge model.
We developed a psychiatry CSS during previous research [399], but
did not evaluate it for clinical comprehension at the time. The psychiatry
CSS categorizes text [400] to draw associations between short segments
of a clinical narrative and four diagnostically and/or prognostically
relevant intermediate constructs: psychosis, mood, substance abuse
and dangerousness (Figure 8).
~ Page ! ~332](https://image.slidesharecdn.com/betterehr-151223134030/85/Better-ehr-333-320.jpg)
![Figure 8. The psychiatry CSS interface. Aspects of the narrative deemed relevant are listed at
top and highlighted if the intermediate construct or any of its elements is clicked. Clicking a
text element scrolls the narrative to its location.
RESULTS/PRODUCTS
These interfaces demonstrate ways expert knowledge can be
leveraged to support clinical decisions. In the following sections, we
present results of some experimental work conducted during the course
of the project. We will describe results of observational studies from
information gathered in an ICU practice, studies comparing the cognitive
process of psychiatry CSS system users to those without cognitive
support, and results from a similar analysis of SIRSi-Web.
1. Information Gathering in the ICU
We found physicians extensively relying on paper records in an
observational information gathering study of eight Medical Intensive
Care Units (MICU) [370]. Physicians spent equal time on paper and
electronic records during decision making. Yet, an analysis of audio-
recordings revealed electronic records afforded more structured
information and more non-redundant information. We characterized
level of abstraction differences between information types using an
epistemological framework by Evans and Gadd [401] previously applied
to characterize clinical dialogue [402] (Figure 9). Electronic records were
used to retrieve low-level information, such as clinical observations (e.g.,
patient had a chest pain) and findings (e.g., aggregated results from
multiple tests). High-level representations such as intermediate constructs
(or facets) and diagnoses made up a larger proportion of information
retrieved from paper records.
~ Page ! ~333](https://image.slidesharecdn.com/betterehr-151223134030/85/Better-ehr-334-320.jpg)
![Figure 9. Information retrieved from paper and electronic records as portrayed in Kannampallil
et al., 2012 [370].
Data suggest cognitive support for decision making in the ICU is
currently sub-optimal. Clinical data are aggregated according to data
sources (e.g., EHR, paper notes) rather than meaningful decision model.
Electronic data sources played a minimal role supporting higher-level
cognition.
2. Psychiatry CSS
We studied the performance of 16 psychiatry residents interpreting
two clinical cases developed in previous research [383, 403]. Half of the
residents used the psychiatry CSS interface and half did not. Verbal
think-aloud protocols were collected during evaluations, allowing a fine-
grained analysis of cognitive processes. A qualitative analysis revealed five
ways in which the system was used to mediate clinical decision making
[403]:
• Hypothesis evaluation: The interface was used to evaluate hypotheses
generated while reading narrative text summaries. Residents
reviewed related information organized at intermediate construct
levels or reviewed highlighted facet-relevant components.
• Leveraging text juxtaposition: Sequential organization of information
associated with interface elements at facet level led to the generation
of new diagnostic hypotheses. A similar strategy occurred when text
~ Page ! ~334](https://image.slidesharecdn.com/betterehr-151223134030/85/Better-ehr-335-320.jpg)
![highlighted by the interface and juxtaposed text contained narrative
rich in diagnostically useful information, which lead to the generation
of facet-level diagnostic hypotheses.
• Review to exclude: For the sake of completeness, the interface was used
to rule out alternative diagnostic hypotheses by reviewing elements
organized at facet level.
• Review to confirm: The interface was used to confirm thoughts and
recollections by reviewing the findings organized at facet level (both
in the interface and highlighted text).
• Facet-level preview: Facet-level elements were reviewed before narrative
text was read.
With the exception of two outliers (IC-6 and IC-8) with sparse think-
aloud protocols, residents in the IC group attended better to nine
clinically important points selectively attended to by experts in previous
research [383], particularly those highlighted by the system (Table 3).
Nine key points were either highlighted by the interface (IC) or gathered
during interpretation of cases without the CSS interface (NO-IC).
Table 3. From Dalai et al., [403]. Comparison across points of divergent recall characterized
by Sharda et al. 2005. The top half of the table is derived from the think-aloud protocol
captured during exploration of the case. SUBJ=subject number. WC1= protocol word count
for case 1 and so forth. ✓indicates recall of the proposition(s) concerned. Grey cells indicate
~ Page ! ~335](https://image.slidesharecdn.com/betterehr-151223134030/85/Better-ehr-336-320.jpg)
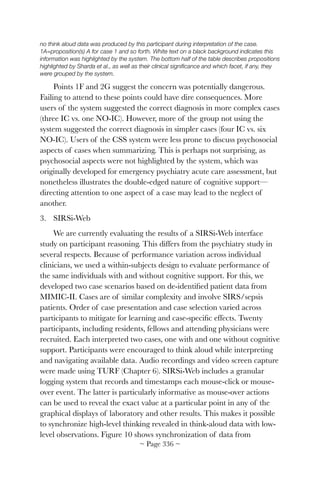
![practice. We also plan to continue exploring options for embedding our
CSS interface, or aspects of it, within an active EHR. This will provide
the means to evaluate the effects of cognitive support on sepsis-related
downstream indicators of healthcare quality, such as time to treatment.
Demonstrating positive effects will help realize the translational potential
of our work.
IMPLICATIONS
Our CSS assumes some cognitive burden of clinical comprehension
by organizing key clinical information in accordance with expert-derived
reference models. Based on decades of research in medical and general
expertise [381, 404], we drew inspiration from work on training
personnel in landmine detectors [384]. Staszewski coined the term
Cognitive Engineering Based on Expert Skill (CEBES) for this
paradigm. Earlier demonstrations of CEBES effectiveness exist, perhaps
the most famous being in the domain of mnemonic expertise [388].
Landmine detection also lead to a prototype system to assume cognitive
work of expert decision makers [385].
We developed a CSS prototype and evaluated a psychiatry CSS
[400] that encode aspects of knowledge structures underlying expert
decisions. A system that could assume some of the cognitive burden of
expert comprehension relates to the theory of distributed cognition
[405], which views cognition as the product of a distributed system
involving human actors and the external media supporting them in their
cognitive tasks. Rather than being confined to the mind of a single
clinician, clinical comprehension can be viewed as a distributed process
involving, for example, a human reader and a textual display.
Comprehension involves the construction of a mental representation of a
clinical case influenced by the structured knowledge stored in the mind
of the clinician [390, 406]. By organizing information presented in
accordance with a simulation of expert knowledge structure, a CSS can
redistribute part of the expert comprehension cognitive work from man
to machine. Our research confirms this is possible. Our baseline studies
of information from MICUs confirm some current electronic systems do
not support the organization of clinical information in accordance with
higher-level knowledge structures [370]. Our studies of cognitive support
~ Page ! ~340](https://image.slidesharecdn.com/betterehr-151223134030/85/Better-ehr-341-320.jpg)
![effects in psychiatry [403] and SIRS/sepsis reveal numerous examples of
reorganization effects on diagnostic reasoning.
In the case of the psychiatric CSS, participants were able to navigate
through the summary to investigate diagnostic hypotheses and review
information organized thematically. This appears to have improved their
ability to attend to clinically-relevant elements, including evidence that
suggested the patient might be harmful to themselves or others.
Preliminary findings from our studies of the SIRSi-Web interface suggest
the same participants may generate more facet-level (i.e., intermediate
construct based) pre-diagnostic hypotheses than when exploring patient
data using an approximation of a conventional interface. However,
redirection of attention may come at the expense of neglecting aspects of
the case not highlighted by the system. For example, users of the
psychiatry CSS generally paid less heed to psychosocial aspects. Ideally,
the design of CSS interfaces should be based on a robust canonical
model of the decision task at hand. Any attempt to support decision
making through intelligent organization of clinical data is arguably an
advance over organizing this information arbitrarily.
This project resulted in a number of software and design products,
including a sepsis user interface, a flexible CSS system architecture, and
prototype front end interfaces. The SIRSi backend and web interface are
available under an open source license with desirable research features,
such as: 1) the ability to replace the sepsis knowledge model with another
model of interest, 2) the ability to switch between a knowledge-driven
and default presentation of the same clinical case, and 3) a granular
logging system to capture user attention foci. Note that none of these
features are necessary to incorporate cognitive support into existing
systems. It is sufficient merely to replicate the organization obtained
through application of the decision model. Many contemporary EHRs
are sufficiently configurable to accommodate restructuring to some
degree. Our clinical collaborators are currently engaged in reconfiguring
vendor system to include aspects of our decision model for sepsis.
SUGGESTED READING
Patel, V. L., Arocha, J. F., Kaufman, D. (1994). Diagnostic reasoning
and medical expertise. In D. L. Medin (Ed.), The Psychology of Learning
~ Page ! ~341](https://image.slidesharecdn.com/betterehr-151223134030/85/Better-ehr-342-320.jpg)
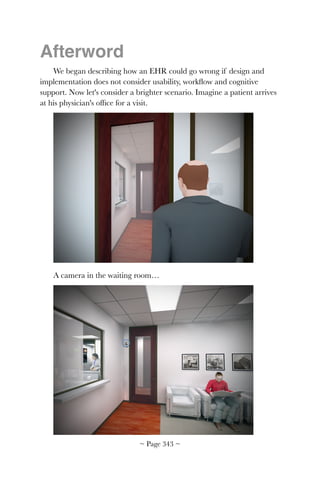
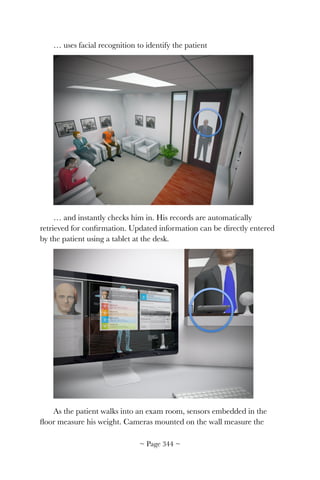
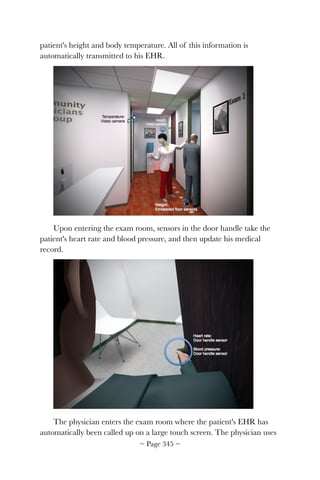
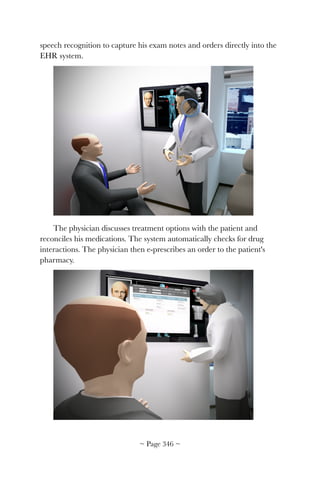
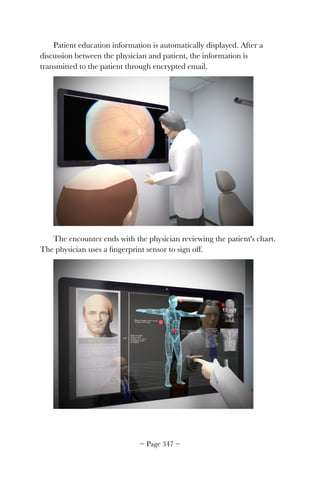


![Bibliography
1. Pedulli, L. KLAS survey: Usability ranked as most important feature for
EMRs. 2014 October 14, 2014]; Available from: http://www.clinical-
innovation.com/topics/ehr-emr/klas-survey-usability-ranked-most-
important-feature-emrs.
2. Strategic Health IT Advanced Research Projects (SHARP). 2014 [cited
2014 June 30, 2014]; Available from: http://www.healthit.gov/policy-
researchers-implementers/strategic-health-it-advanced-research-
projects-sharp.
3. Crossing the Quality Chasm: A New Health System for the 21st Century.
2001: The National Academies Press.
4. Corrigan, J.M., M.S. Donaldson, and L.T. Kohn, eds. Crossing the
quality chasm: A new health system for the 21st century. 2001, National
Academies Press: Washington, D. C.
5. National Research Council Committee on Engaging the Computer
Science Research Community in Health Care, I., The National
Academies Collection: Reports funded by National Institutes of Health,
in Computational Technology for Effective Health Care: Immediate
Steps and Strategic Directions, W.W. Stead and H.S. Lin, Editors. 2009,
National Academies Press (US) and the National Academy of Sciences:
Washington (DC).
6. Health information technology: standards, implementation specifications,
and certification criteria for electronic health record technology, 2014
edition; revisions to the permanent certification program for health
information technology. Final rule. Fed Regist, 2012. 77(171): p.
54163-292.
7. Zhang, J. and M.F. Walji, TURF: toward a unified framework of EHR
usability. J Biomed Inform, 2011. 44(6): p. 1056-67.
8. Hillestad, R., et al., Can electronic medical record systems transform
health care? Potential health benefits, savings, and costs. Health Aff
(Millwood), 2005. 24(5): p. 1103-17.
9. RAND Corporation, Health Information Technology: Can HIT Lower
Costs and Improve Quality? 2005, RAND Corporation: Santa Monica,
CA.
~ Page ! ~367](https://image.slidesharecdn.com/betterehr-151223134030/85/Better-ehr-368-320.jpg)
![2005, Agency for Healthcare Research and Quality: Rockville, MD. p.
323-336.
60. Tang, Z., et al., Applying heuristic evaluation to improve the usability of
a telemedicine system. Telemed J E Health, 2006. 12(1): p. 24-34.
61. Diaper, D. and N.A. Stanton, eds. The handbook of task analysis of
human–computer interaction. 2004, Lawrence Erlbaum Associates,
Inc.: Mahwah, NJ.
62. Crandall, B., G. Klein, and R.R. Hoffman, Working minds: a
practitioner’s guide to cognitive task analysis. 2006, Cambridge, MA:
MIT Press.
63. Card, S.K., T.P. Moran, and A. Newell, The psychology of human-
computer interaction. 1983, London: Lawrence Erbaum Associates.
64. John, B.E. and D.E. Kieras, The GOMS family of user interface analysis
techniques: comparison and contrast. ACM Trans. Comput.-Hum.
Interact., 1996. 3(4): p. 320-351.
65. Wright, P.C., R.E. Fields, and M.D. Harrison, Analyzing human-
computer interaction as distributed cognition: the resources model.
Hum.-Comput. Interact., 2000. 15(1): p. 1-41.
66. Saitwal, H., et al., Assessing performance of an Electronic Health Record
(EHR) using Cognitive Task Analysis. Int J Med Inform, 2010. 79(7): p.
501-6.
67. Kieras, D. Using the keystroke-level model to estimate execution times.
2001.
68. John, B.E. CogTool. 2009 [cited 2011 May 16]; Available from: http://
cogtool.hcii.cs.cmu.edu/.
69. ACT-R Research Group. Home: ACT-R. [cited 2011 May 16]; Available
from: http://act-r.psy.cmu.edu.
70. Anderson, J.R., Rules of the mind. 1993, Hillsdale, NJ: Lawrence
Erlbaum Associates, Inc.
71. Luo, L. and B.E. John, Predicting task execution time on handheld
devices using the keystroke-level model, in CHI '05 Extended Abstracts
on Human Factors in Computing Systems. 2005, ACM: Portland, OR,
USA. p. 1605-1608.
~ Page ! ~372](https://image.slidesharecdn.com/betterehr-151223134030/85/Better-ehr-373-320.jpg)
![72. Harrington, C., et al., Using a unified usability framework to dramatically
improve the usability of an EMR Module. AMIA Annu Symp Proc,
2011. 2011: p. 549-58.
73. Brixey, J.J., et al., Towards a hybrid method to categorize interruptions
and activities in healthcare. Int J Med Inform, 2007. 76(11-12): p.
812-20.
74. Brixey, J.J., et al., Interruptions in a level one trauma center: a case study.
Int J Med Inform, 2008. 77(4): p. 235-41.
75. Franklin, A., et al., Opportunistic decision making and complexity in
emergency care. J Biomed Inform, 2011. 44(3): p. 469-76.
76. Westbrook, J.I., et al., Association of interruptions with an increased risk
and severity of medication administration errors. Arch Intern Med,
2010. 170(8): p. 683-90.
77. Butler, K.A., et al. MATH: Method and toolsuite for integrating HIT
with clinical workflow. n. d. [cited 2014 June 30]; Available from:
https://www.google.com/url?
sa=trct=jq=esrc=sfrm=1source=webcd=1ved=0CB0QFjA
Aurl=https%3A%2F%2Fcatalyst.uw.edu%2Fworkspace%2Ffile
%2Fdownload
%2F8849c201a4042ae800dbc6501b49d8ebc5cebe3995be89c7766f6cb
4a8303aecei=XtWxU-
GZK8WiqAa63oLwDwusg=AFQjCNEhI195vGf3ZU924eeB6DEyY
sgNRwsig2=LTk818SpqJ70n3fZAH-x2A.
78. Butler , K.A., C. Esposito, and R. Hebron, Connecting the design of
software to the design of work. Communications of the ACM, 1999.
42(1): p. 38-46.
79. Chen, Y., Documenting transitional information in EMR, in Proceedings
of the SIGCHI Conference on Human Factors in Computing Systems.
2010, ACM: Atlanta, Georgia, USA. p. 1787-1796.
80. Koppel, R., et al., Workarounds to barcode medication administration
systems: their occurrences, causes, and threats to patient safety. J Am
Med Inform Assoc, 2008. 15(4): p. 408-23.
81. Hollnagel, E., The ETTO principle: efficiency-thoroughness trade-off:
why things that go right sometimes go wrong. 2009, Ashgate Publishing:
Burlington, VT.
82. Perer, A. and B. Shneiderman. Systematic yet flexible discovery: guiding
domain experts through exploratory data analysis. in Proceedings of
~ Page ! ~373](https://image.slidesharecdn.com/betterehr-151223134030/85/Better-ehr-374-320.jpg)
![information system-related errors. J Am Med Inform Assoc, 2004.
11(2): p. 104-12.
96. Kushniruk, A.W., et al., Exploring the relationship between training and
usability: a study of the impact of usability testing on improving
training and system deployment. Stud Health Technol Inform, 2009.
143: p. 277-83.
97. Rosenbloom, S.T., et al., Data from clinical notes: a perspective on the
tension between structure and flexible documentation. J Am Med
Inform Assoc, 2011. 18(2): p. 181-6.
98. Cummings, K. and R. McGowan, Smart infusion pumps are selectively
intelligent. Nursing, 2011. 41(3): p. 58-9.
99. Rasmussen, J., A.M. Pejtersen, and L.P. Goodstein, Cognitive systems
engineering. 1994: John Wiley amp; Sons, Inc. 378.
100. Vicente, K.J., Cognitive Work Analysis: Toward Safe, Productive, and
Healthy Computer-Based Work. 1999, Mahwah, NJ: Lawrence
Earlbaum Associates.
101. Jenkins, D.P., et al., Using cognitive work analysis to explore system
flexibility. Theoretical Issues in Ergonomics Science, 2010. 11(3): p.
136-150.
102. Berenholtz, S.M., et al., Eliminating catheter-related bloodstream
infections in the intensive care unit. Crit Care Med, 2004. 32(10): p.
2014-20.
103. Newell, A. and H.A. Simon, Human problem solving. 1972, Englewood
Cliffs, NJ: Prentice-Hall.
104. Wolfram Research, I., Mathematica. Version 8.0. [software]. 2008,
Wolfram Research, Inc.: Champaign, IL.
105. Thimbleby, H., Press on: Principles of interaction programming. 2007:
The MIT Press.
106. Thimbleby, H., Formulating usability. SIGCHI Bull., 1994. 26(2): p.
59-64.
107. Thimbleby, H., P. Cairns, and M. Jones, Usability analysis with Markov
models. ACM Trans. Comput.-Hum. Interact., 2001. 8(2): p. 99-132.
108. Gow, J. and H. Thimbleby, MAUI: An Interface Design Tool Based on
Matrix Algebra, in Computer-Aided Design of User Interfaces IV, R.K.
~ Page ! ~375](https://image.slidesharecdn.com/betterehr-151223134030/85/Better-ehr-376-320.jpg)
![145. McGinn, C.A., et al., Comparison of user groups' perspectives of barriers
and facilitators to implementing electronic health records: a systematic
review. BMC Med, 2011. 9: p. 46.
146. Zhang, J., Human-centered computing in health information systems.
Part 1: analysis and design. J Biomed Inform, 2005. 38(1): p. 1-3.
147. Middleton, B., et al., Enhancing patient safety and quality of care by
improving the usability of electronic health record systems:
recommendations from AMIA. J Am Med Inform Assoc, 2013. 20(e1):
p. e2-8.
148. Test Procedure for §170.314(g)(3) Safety-enhanced design. Available from:
http://www.healthit.gov/sites/default/files/
170.314g3safetyenhanceddesign_2014_tp_approved_v1.3_0.pdf.
149. HeatlhIT.gov. Standards Certifications Criteria Final Rule. April 9,
2014 August 5, 2014]; Available from: http://www.healthit.gov/policy-
researchers-implementers/standards-certifications-criteria-final-rule.
150. Usability.gov. July 22, 2014]; Available from: http://www.usability.gov.
151. Standardization, I.O.f., Ergonomics of Human-System Interaction, in
Part 210: Human-Centered Design for Interactive Systems. 2006,
International Organization for Standardization: Geneva.
152. International Organization for Standardization, Ergonomic requirements
for office work with visual display terminals (VDTs), in Part 11 :
Guidance on usability. 1998, International Organization for
Standardization: Geneva.
153. Standardization, I.O.f., Ergonomics of human-system interaction -
Usability methods supporting human-centered design. 2002,
International Organization for Standardization: Geneva.
154. Standardization, I.O.f., Software engineering -Software product Quality
Requirements and Evaluation (SQuaRE) -Common Industry Format
(CIF) for usability test reports,. 2006, International Organization for
Standardization: Geneva.
155. Standardization, I.O.f., Medical devices – Application of usability
engineering to medical devices. 2007, International Organization for
Standardization: Geneva.
156. Certified Health IT Product List (CHPL). July 22, 2014]; Available from:
http://www.healthit.gov/policy-researchers-implementers/certified-
health-it-product-list-chpl.
~ Page ! ~379](https://image.slidesharecdn.com/betterehr-151223134030/85/Better-ehr-380-320.jpg)
![157. Research-based web design usability guidelines. 2006 [cited 2014 May
10]; Available from: http://guidelines.usability.gov/.
158. Kaner, C. What is a good test case? in Florida Institute of Technology
Department of Computer Sciences STAR East. 2003.
159. HealthIT.gov. Test Procedure for §170.314(g)(3) Safety-enhanced design.
2013 March 29, 2013; Available from: http://www.healthit.gov/sites/
default/files/
170.314g3safetyenhanceddesign_2014_tp_approved_v1.3_0.pdf.
160. Update on the adoption of health information technology and related
efforts to facilitate the electronic use and exchange of health
information. 2013 June, 2013; Available from: http://
www.healthit.gov/sites/default/files/
rtc_adoption_of_healthit_and_relatedefforts.pdf.
161. Kellermann, A.L. and S.S. Jones, What it will take to achieve the as-yet-
unfulfilled promises of health information technology. Health Aff
(Millwood), 2013. 32(1): p. 63-8.
162. Bangor, A., P.T. Kortum, and J.T. Miller, An Empirical Evaluation of the
System Usability Scale. International Journal of Human-Computer
Interaction, 2008. 24(6): p. 574-594.
163. Xiao, Y., et al., Development of a Tool to Measure User Experience
Following Electronic Health Record Implementation. J Nurs Admin,
2014. 44(7/8).
164. Edsall, R.L. and K.G. Adler, The 2012 EHR User Satisfaction Survey:
responses from 3,088 family physicians. Fam Pract Manag, 2012. 19(6):
p. 23-30.
165. Otieno, G.O., et al., Measuring effectiveness of electronic medical records
systems: towards building a composite index for benchmarking
hospitals. Int J Med Inform, 2008. 77(10): p. 657-69.
166. Baylor EHR User Experience Survey. Available from: http://
www.himss.org/files/HIMSSorg/content/files/ehr_usability/
Baylor_EHR_UserExperienceSurvey.pdf.
167. Eastaugh, S.R., The total cost of EHR ownership. Healthc Financ
Manage, 2013. 67(2): p. 66-70.
168. Hendrich, A., et al., A 36-hospital time and motion study: how do
medical-surgical nurses spend their time? Perm J, 2008. 12(3): p. 25-34.
~ Page ! ~380](https://image.slidesharecdn.com/betterehr-151223134030/85/Better-ehr-381-320.jpg)
![169. Friedman, C.P., A fundamental theorem of biomedical informatics. J
Am Med Inform Assoc, 2009. 16(2): p. 169-70.
170. Committee on Patient, S., T. Health Information, and M. Institute of, in
Health IT and Patient Safety: Building Safer Systems for Better Care.
2011, National Academies Press (US) Copyright 2012 by the National
Academy of Sciences. All rights reserved.: Washington (DC).
171. American Medical Association. Health IT Policy Committee’s
Workgroups on Certification/Adoption and Implementation.
TESTIMONY OF THE AMERICAN MEDICAL ASSOCIATION.
Implementation and Usability of Certified Electronic Health Records.
2013 July 23, 2013 [cited 2014 July 9]; Available from: http://
www.healthit.gov/sites/default/files/archive/FACA%20Hearings/
2013-07-23%20Standards%3A%20Implementation,%20Meaningful
%20Use,%20and%20Certification%20%26%20Adoption%20WGs,
%20%20Implementation%20%26%20Usability%20Hearing/
ama_usabilitytestimony_0.pdf.
172. Force, H.E.U.T. EHR Usability Pain Points Survey Q4-2009. 2010 [cited
2013 June 6]; Available from: http://www.himss.org/files/HIMSSorg/
content/files/Usability_Pain_PointsHIMSS10.pdf.
173. Kushniruk, A.W., et al., Technology induced error and usability: the
relationship between usability problems and prescription errors when
using a handheld application. Int J Med Inform, 2005. 74(7-8): p.
519-26.
174. Ash, J.S., et al., The extent and importance of unintended consequences
related to computerized provider order entry. J Am Med Inform Assoc,
2007. 14(4): p. 415-23.
175. Butler , K.A., Usability engineering, in Encyclopedia of Computer
Science Technology, v.33, A. Kent and J.G. Williams, Editors. 1995,
Taylor Francis, Inc.: New York.
176. Woods, D. and E. Roth, Cognitive systems engineering, in Handbook of
Human-Computer Interaction, J.P. Womack and D.T. Jones, Editors.
1989, North-Holland: New York.
177. Cain, C. and S. Haque, Organizational Workflow and Its Impact on
Work Quality, in Patient Safety and Quality: An Evidence-Based
Handbook for Nurses, R.G. Hughes, Editor. 2008: Rockville (MD).
178. White, S.A. and D. Miers, BPMN modeling and reference guide:
Understanding and using the BPMN. 2008, Lighthouse Point, FL:
Future Strategies Inc.
~ Page ! ~381](https://image.slidesharecdn.com/betterehr-151223134030/85/Better-ehr-382-320.jpg)
![191. Baldwin, D.M., et al., Patient preferences for notification of normal
laboratory test results: a report from the ASIPS Collaborative. BMC
Fam Pract, 2005. 6(1): p. 11.
192. Leekha, S., et al., Patient preferences for and satisfaction with methods of
communicating test results in a primary care practice. Jt Comm J Qual
Patient Saf, 2009. 35(10): p. 497-501.
193. SMART. SMART-Apps Competition. n. d.; Available from: http://
smartapps.challengepost.com/.
194. Freidman, C.P. and J. Wyatt, Evaluation Methods in Biomedical
Informatics. Health Informatics, ed. K.J. Hannah and M.J. Ball. 2005,
USA: Springer Science+Business Media, Inc.
195. Eisenstein, E.L., et al., Defining a framework for health information
technology evaluation. Stud Health Technol Inform, 2011. 164: p.
94-9.
196. Wharton, C., et al., The cognitive walkthrough method: A practitioner’s
guide, in Usability inspection methods, J. Nielsen and R. Mack, Editors.
1994, John Wiley Sons, Inc.: New York.
197. Nielsen, J. 113 design guidelines for homepage usability. 2001; Available
from: http://www.nngroup.com/articles/113-design-guidelines-
homepage-usability.
198. Services, U.S.D.o.H.a.H. Research-based web design usability
guidelines. 2006 [cited 2014 May 10]; Available from: http://
guidelines.usability.gov/.
199. Lowry, S.Z., et al., A Human Factors Guide to Enhance EHR Usability
of Critical User Interactions when Supporting Pediatric Patient Care,
U.S.D.o. Commerce, Editor. 2012, National Institute of Standards and
Technology: Gaithersburg, MD.
200. Microsoft. Microsoft Health CUI design guidance. 2012; Available from:
http://www.mscui.net/DesignGuide/DesignGuide.aspx.
201. Bates, D.W. and A.A. Gawande, Improving safety with information
technology. N Engl J Med, 2003. 348(25): p. 2526-34.
202. Campbell, E.M., et al., Types of unintended consequences related to
computerized provider order entry. J Am Med Inform Assoc, 2006.
13(5): p. 547-56.
~ Page ! ~383](https://image.slidesharecdn.com/betterehr-151223134030/85/Better-ehr-384-320.jpg)
![217. Cadwallader, J., et al., Design of a medication reconciliation application:
facilitating clinician-focused decision making with data from multiple
sources. Appl Clin Inform, 2013. 4(1): p. 110-25.
218. de Koning, J.S., et al., Quality of care in stroke prevention: results of an
audit study among general practitioners. Prev Med, 2004. 38(2): p.
129-36.
219. Commission, T.J. Using medication reconciliation to prevent errors.
Sentinel Event Alert 2006 [cited 2014 June 30]; Available from: http://
www.jointcommission.org/assets/1/18/SEA_35.PDF.
220. Aspden, P., et al., eds. Preventing medication errors. 2007, National
Academies Press: Washington, D. C.
221. Keohane, C.A. and D.W. Bates, Medication safety. Obstet Gynecol Clin
North Am, 2008. 35(1): p. 37-52, viii.
222. Roughead, E.E. and S.J. Semple, Medication safety in acute care in
Australia: where are we now? Part 1: a review of the extent and causes
of medication problems 2002-2008. Aust New Zealand Health Policy,
2009. 6: p. 18.
223. Ellitt, G.R., et al., Drug related problems after discharge from an
Australian teaching hospital. Pharm World Sci, 2010. 32(5): p. 622-30.
224. Using medication reconciliation to prevent errors. Sentinel Event Alert,
2006(35): p. 1-4.
225. Silva, P.A., et al., Automated medication reconciliation and complexity of
care transitions. AMIA Annu Symp Proc, 2011. 2011: p. 1252-60.
226. Burton, M.M., L. Simonaitis, and G. Schadow, Medication and
indication linkage: A practical therapy for the problem list? AMIA
Annu Symp Proc, 2008: p. 86-90.
227. McCoy, A.B., et al., Development and evaluation of a crowdsourcing
methodology for knowledge base construction: identifying relationships
between clinical problems and medications. J Am Med Inform Assoc,
2012. 19(5): p. 713-8.
228. Senathirajah, Y., D. Kaufman, and S. Bakken, Cognitive Analysis of a
Highly Configurable Web 2.0 EHR Interface. AMIA Annu Symp Proc,
2010. 2010: p. 732-6.
~ Page ! ~385](https://image.slidesharecdn.com/betterehr-151223134030/85/Better-ehr-386-320.jpg)
![290. Hahn, J.S., et al., Rapid implementation of inpatient electronic physician
documentation at an academic hospital. Appl Clin Inform, 2012. 3(2):
p. 175-85.
291. Feblowitz, J.C., et al., Summarization of clinical information: a
conceptual model. J Biomed Inform, 2011. 44(4): p. 688-99.
292. Wright, A., E.S. Chen, and F.L. Maloney, An automated technique for
identifying associations between medications, laboratory results and
problems. J Biomed Inform, 2010. 43(6): p. 891-901.
293. McCoy, A.B., et al., Use of the Crowdsourcing Methodology to Generate
a Problem-Laboratory Result Knowledge Base, in AMIA Annual
Symposium. 2012.
294. Franzini, L., O.I. Mikhail, and J.S. Skinner, McAllen And El Paso
revisited: Medicare variations not always reflected in the under-sixty-
five population. Health Aff (Millwood), 2010. 29(12): p. 2302-9.
295. Parikh, R., et al., Cesarean section rate variation across hospital referral
regions in Texas: A claims analysis of privately insured population from
2008-2011, in Think Global, Act Local, 141st APHA Annual Meeting.
2013: Boston.
296. Wright, A., et al., A method and knowledge base for automated inference
of patient problems from structured data in an electronic medical
record. J Am Med Inform Assoc, 2011. 18(6): p. 859-67.
297. Wright, A., et al., Improving completeness of electronic problem lists
through clinical decision support: a randomized, controlled trial. J Am
Med Inform Assoc, 2012. 19(4): p. 555-61.
298. Brown, S.H., et al., VA National Drug File Reference Terminology: a
cross-institutional content coverage study. Stud Health Technol Inform,
2004. 107(Pt 1): p. 477-81.
299. Carter, J.S., et al., Initializing the VA medication reference terminology
using UMLS metathesaurus co-occurrences. Proc AMIA Symp, 2002:
p. 116-20.
300. Liu, S., et al., RxNorm: prescription for electronic drug information
exchange. IT Professional, 2005. 7(5).
301. SNOMED Clinical Terms® (SNOMED CT®). August 8, 2014];
Available from: http://www.nlm.nih.gov/research/umls/Snomed/
snomed_main.html.
~ Page ! ~391](https://image.slidesharecdn.com/betterehr-151223134030/85/Better-ehr-392-320.jpg)
![302. Goethals, B. Survey on frequent pattern mining. 2003.
303. Wright, A., et al., Validation of an association rule mining-based method
to infer associations between medications and problems. Appl Clin
Inform, 2013. 4(1): p. 100-9.
304. Giles, J., Internet encyclopaedias go head to head. Nature, 2005.
438(7070): p. 900-1.
305. Howe, J., The rise of crowdsourcing. Wired Magazine, 2006. 14(6): p.
1-4.
306. Brownstein, C.A., et al., The power of social networking in medicine. Nat
Biotechnol, 2009. 27(10): p. 888-90.
307. Hughes, S. and D. Cohen, Can online consumers contribute to drug
knowledge? A mixed-methods comparison of consumer-generated and
professionally controlled psychotropic medication information on the
internet. J Med Internet Res, 2011. 13(3): p. e53.
308. eBay. Establishing a good eBay reputation: Buyer or Seller. n.d. [cited
2013 August 5, 2013]; Available from: http://www.ebay.com/gds/
Establishing-a-good-eBay-reputation-Buyer-or-Seller/
10000000001338209/g.html.
309. Amazon.com. Help: About Customer Ratings. [cited 2013 August 5,
2013]; Available from: http://www.amazon.com/gp/help/customer/
display.html/ref=hp_left_sib?ie=UTF8nodeId=200791020.
310. FAQ Slashdot. n. d. [cited 2013 August 5]; Available from: http://
slashdot.org/faq.
311. McCoy, A.B., et al., Development of a clinician reputation metric to
identify appropriate problem-medication pairs in a crowdsourced
knowledge base. J Biomed Inform, 2014. 48: p. 66-72.
312. WHO International Classification of Diseases (ICD). 2010 August 8,
2014]; Available from: http://www.who.int/classifications/icd/en/.
313. Wright, A., et al., A description and functional taxonomy of rule-based
decision support content at a large integrated delivery network. J Am
Med Inform Assoc, 2007. 14(4): p. 489-96.
314. Hurst, J.W., Ten reasons why Lawrence Weed is right. N Engl J Med,
1971. 284(1): p. 51-2.
~ Page ! ~392](https://image.slidesharecdn.com/betterehr-151223134030/85/Better-ehr-393-320.jpg)
![341. Jenders, R.A., et al., Standards in clinical decision support: activities in
health level seven. AMIA Annu Symp Proc, 2008: p. 1244-5.
342. Jung, C.Y., K.A. Sward, and P.J. Haug, Executing medical logic modules
expressed in ArdenML using Drools. J Am Med Inform Assoc, 2012.
19(4): p. 533-6.
343. eDecisions, H. Health eDecisions Homepage, SI Framework. 2013
[cited 2013 May 10]; Available from: http://wiki.siframework.org/
Health+eDecisions+Homepage.
344. Health Level Seven International. About HL7. September 30, 2014];
Available from: http://www.hl7.org/about/index.cfm?ref=nav.
345. W3C.org. Extensible Markup Language (XML) 1.1 (Second Edition).
2006 September 30, 2014].
346. Baader, F., et al., eds. The Description Logic Handbook: Theory,
Implementation, and Applications. 2003, Cambridge University Press:
Cambridge, UK.
347. W3C.org. OWL 2 Web Ontology Language Document Overview
(Second Edition). 2012 September 30, 2014]; Available from: http://
www.w3.org/TR/owl2-overview/.
348. Stanford University. Protégé. September 30, 2014]; Available from:
http://protege.stanford.edu.
349. Sourceforge.net. The OWL API. September 30, 2014]; Available from:
http://owlapi.sourceforge.net/.
350. W3C.org. SKOS Simple Knowledge Organization System - Home Page.
September 30, 2014]; Available from: http://www.w3.org/2004/02/
skos/.
351. The Dublin Core Metadata Initiative. Home page. September 30, 2014];
Available from: http://dublincore.org/.
352. Object Management Group. Documents Associated with Production
Rule Representation (PRR) Version 1.0. 2009 September 30, 2014];
Available from: http://www.omg.org/spec/PRR/1.0/.
353. Object Management Group. Object Constraint Language (OCL).
September 30, 2014]; Available from: http://www.omg.org/spec/
OCL/.
~ Page ! ~395](https://image.slidesharecdn.com/betterehr-151223134030/85/Better-ehr-396-320.jpg)
![354. Picca, D., A.M. Gliozzo, and A. Gangemi. LMM: an OWL-DL
MetaModel to Represent Heterogeneous Lexical Knowledge. in LREC.
2008. European Language Resources Association.
355. Laboratory for Applied Ontology. DOLCE : a Descriptive Ontology for
Linguistic and Cognitive Engineering. Available from: http://
www.loa.istc.cnr.it/old/DOLCE.html.
356. Greenes, R.A., et al., Design of a standards-based external rules engine
for decision support in a variety of application contexts: report of a
feasibility study at Partners HealthCare System. Stud Health Technol
Inform, 2004. 107(Pt 1): p. 611-5.
357. w3C.org. Resource Description Framework (RDF). 2014 September 30,
2014]; Available from: http://www.w3.org/RDF/.
358. ACM Transactions on Internet Technology (TOIT). ACM.
359. Play Framework. September 30, 2014]; Available from: https://
www.playframework.com.
360. The Apache Software Foundation. Apache Tomcat. September 30,
2014]; Available from: http://tomcat.apache.org.
361. Google. Blocky. October 29, 2014]; Available from: https://
developers.google.com/blockly/.
362. Hunter, J. What's new in Java Servlet API 2.2? Java World 1999 October
15, 1999; Available from: http://www.javaworld.com/article/
2076518/java-web-development/what-s-new-in-java-servlet-
api-2-2-.html.
363. National Quality Forum. Home page. September 30, 2014]; Available
from: http://www.qualityforum.org/Home.aspx.
364. US National Library of Medicine. Unified Medical Language System®
(UMLS®). 2009 July 18, 2014 September 30, 2014]; Available from:
http://www.nlm.nih.gov/research/umls/.
365. Tao, C., et al., An OWL meta-ontology for representing the Clinical
Element Model. AMIA Annu Symp Proc, 2011. 2011: p. 1372-81.
366. Patel, V.L. and G.J. Groen, Knowledge-based solution strategies in
medical reasoning. Cognitive Science, 1986. 10(1): p. 91-116.
367. Kintsch, W. and J.G. Greeno, Understanding and solving word arithmetic
problems. Psychol Rev, 1985. 92(1): p. 109-29.
~ Page ! ~396](https://image.slidesharecdn.com/betterehr-151223134030/85/Better-ehr-397-320.jpg)
![391. Novak, J.D. and A.J. Cañas, The Theory Underlying Concept Maps and
How to Construct Them. 2006, Florida Institute for Human and
Machine Cognition: Pensacola, FL.
392. Cañas, A.J., et al. CMAPTOOLS: A knowledge modeling and sharing
enviornment. in Concept Maps: Theory, Methodology, Technology.
2004. Pamplona, Spain: Proc. of the First Int. Conference on Concept
Mapping.
393. Ericsson, K.A. and H.A. Simon, Protocol analysis: Verbal reports as data.
Rev'd edition ed. 1993, Campbridge, MA: Bradford.
394. Strauss, A. and J. Corbin, Basics of qualitative research: Techniques and
procedures for developing grounded theory. 2nd ed. 1998, Thousand
Oaks, CA: Sage Publications Inc.
395. The New England Journal of Medicine. September 3, 2014]; Available
from: http://www.nejm.org/medical-articles/clinical-problem-solving.
396. Chamarthi, B., M.F. Greene, and R.G. Dluhy, Clinical problem-solving. A
problem in gestation. N Engl J Med, 2011. 365(9): p. 843-8.
397. SMART Platforms. [cited September 3, 2014; Available from: http://
smartplatforms.org.
398. Saeed, M., et al., MIMIC II: a massive temporal ICU patient database to
support research in intelligent patient monitoring. Comput Cardiol,
2002. 29: p. 641-4.
399. Cohen, T., Augmenting Expertise: Toward computer-enhanced clinical
comprehension, in Department of Biomedical Informatics. 2007,
Columbia University: New York.
400. Cohen, T., B. Blatter, and V. Patel, Simulating expert clinical
comprehension: adapting latent semantic analysis to accurately extract
clinical concepts from psychiatric narrative. J Biomed Inform, 2008.
41(6): p. 1070-87.
401. Evans, D.A. and C.S. Gadd, Managing coherence and context in medical
problem-solving discourse, in Cognitive science in medicine:
Biomedical modeling, D.A. Evans and V.L. Patel, Editors. 1989, MIT
Press: Cambridge, MA.
402. Patel, V.L., D.A. Evans, and D.R. Kaufman, Cognitive framework for
doctor-patient interaction, in Cognitive science in medicine: Biomedical
modeling, D.A. Evans and V.L. Patel, Editors. 1989, MIT Press:
Cambridge, MA. p. 253–308.
~ Page ! ~399](https://image.slidesharecdn.com/betterehr-151223134030/85/Better-ehr-400-320.jpg)
![403. Dalai, V.V., et al., Evaluating the Effects of Cognitive Support on
Psychiatric Clinical Comprehension. Aritificial Intelligence in
Medicine, (under revision).
404. Groen, G.J. and V.L. Patel, The relationship between comprehension and
reasoning in medical expertise, in The Nature of Expertise, M.T.H.
Chi, R. Glaser, and M.J. Farr, Editors. 1988, Lawrence Erlbaum:
Hillsdale, NJ. p. 287-310.
405. Hutchins, E., Cognition in the Wild. Bradford Books. 1985, Cambridge,
MA: MIT Press.
406. Patel, V.L., G.J. Groen, and C.H. Frederiksen, Differences between
medical students and doctors in memory for clinical cases. Med Educ,
1986. 20(1): p. 3-9.
407. Banks, J., et al., Discrete-event system simulation. 1984: Prentice-Hall.
408. eDecisions, H. Health eDecisions Homepage, SI Framework. 2013
[cited 2014 May 10]; Available from: http://wiki.siframework.org/
Health+eDecisions+Homepage.
409. Plaisant, C., et al., Twinlist: novel user interface designs for medication
reconciliation. AMIA Annu Symp Proc, 2013. 2013: p. 1150-9.
~ Page ! ~400](https://image.slidesharecdn.com/betterehr-151223134030/85/Better-ehr-401-320.jpg)


This document provides an overview and table of contents for a book titled "Better EHR Usability, workflow & cognitive support in electronic health records". The book contains 21 chapters focused on improving the usability, workflow and cognitive support of electronic health records. It discusses frameworks and tools for EHR usability assessment, EHR design guidelines, clinical decision support, and more. The book is supported by a federal grant from the Office of the National Coordinator for Health Information Technology.