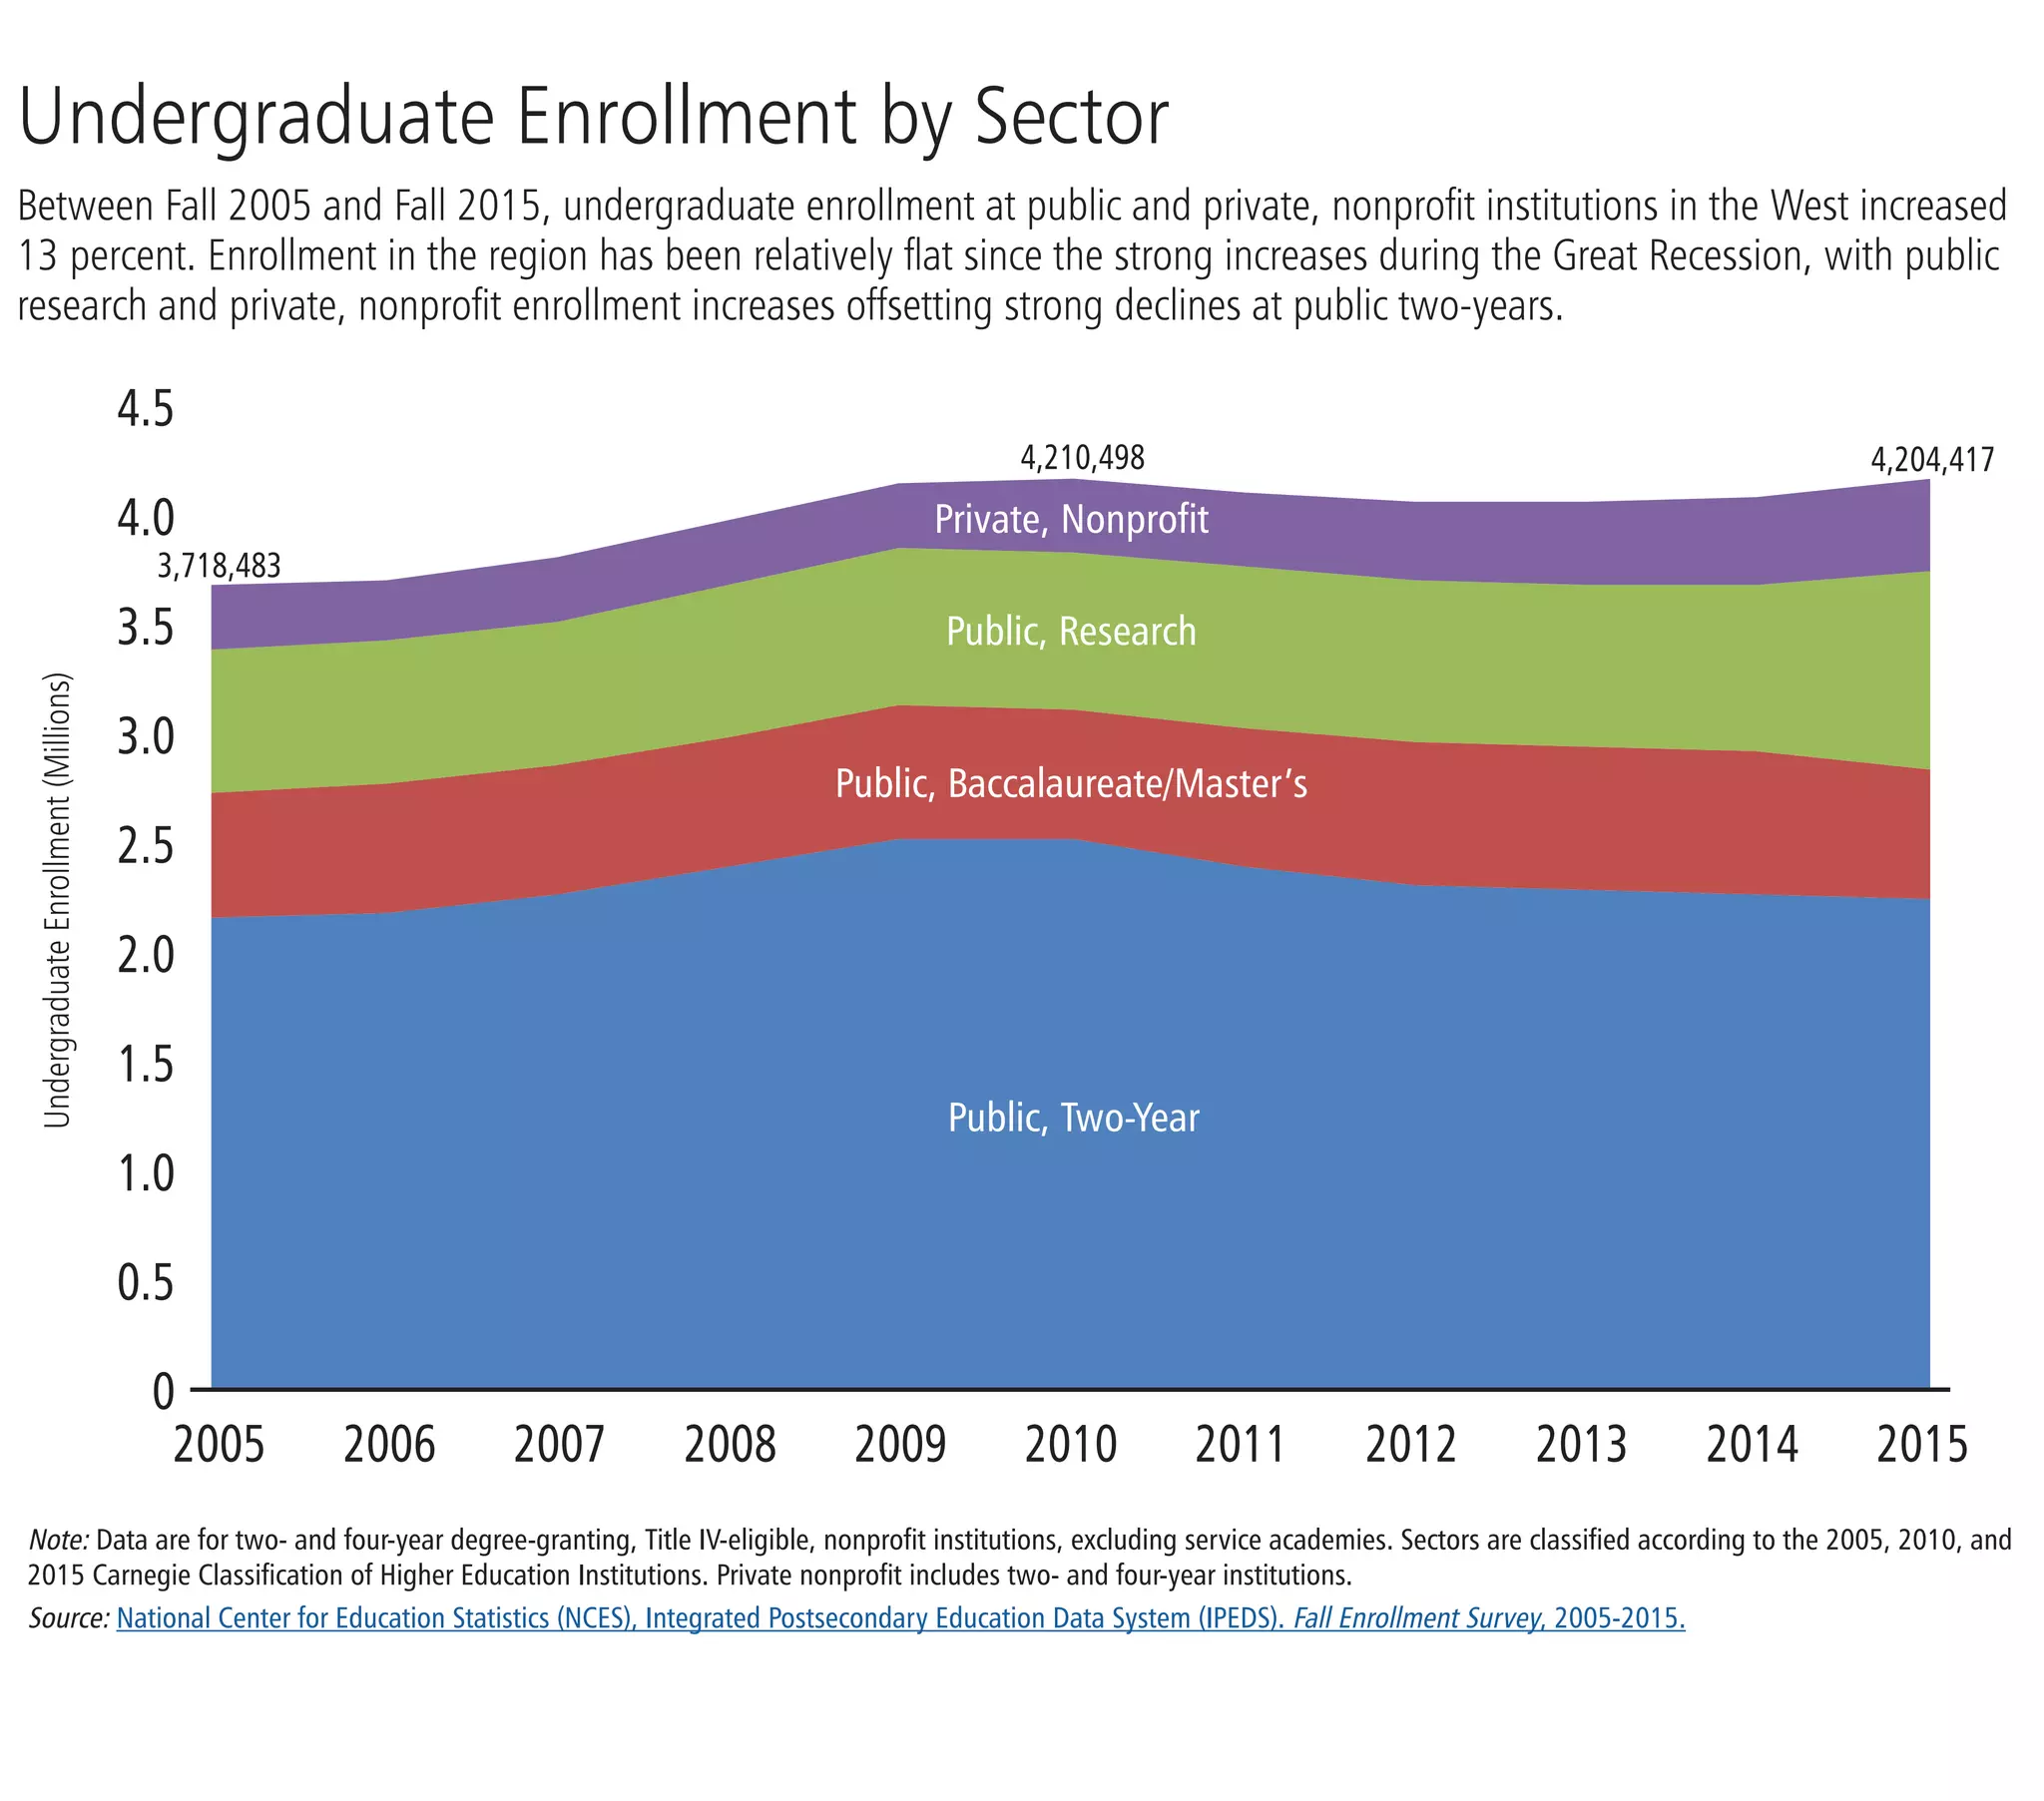
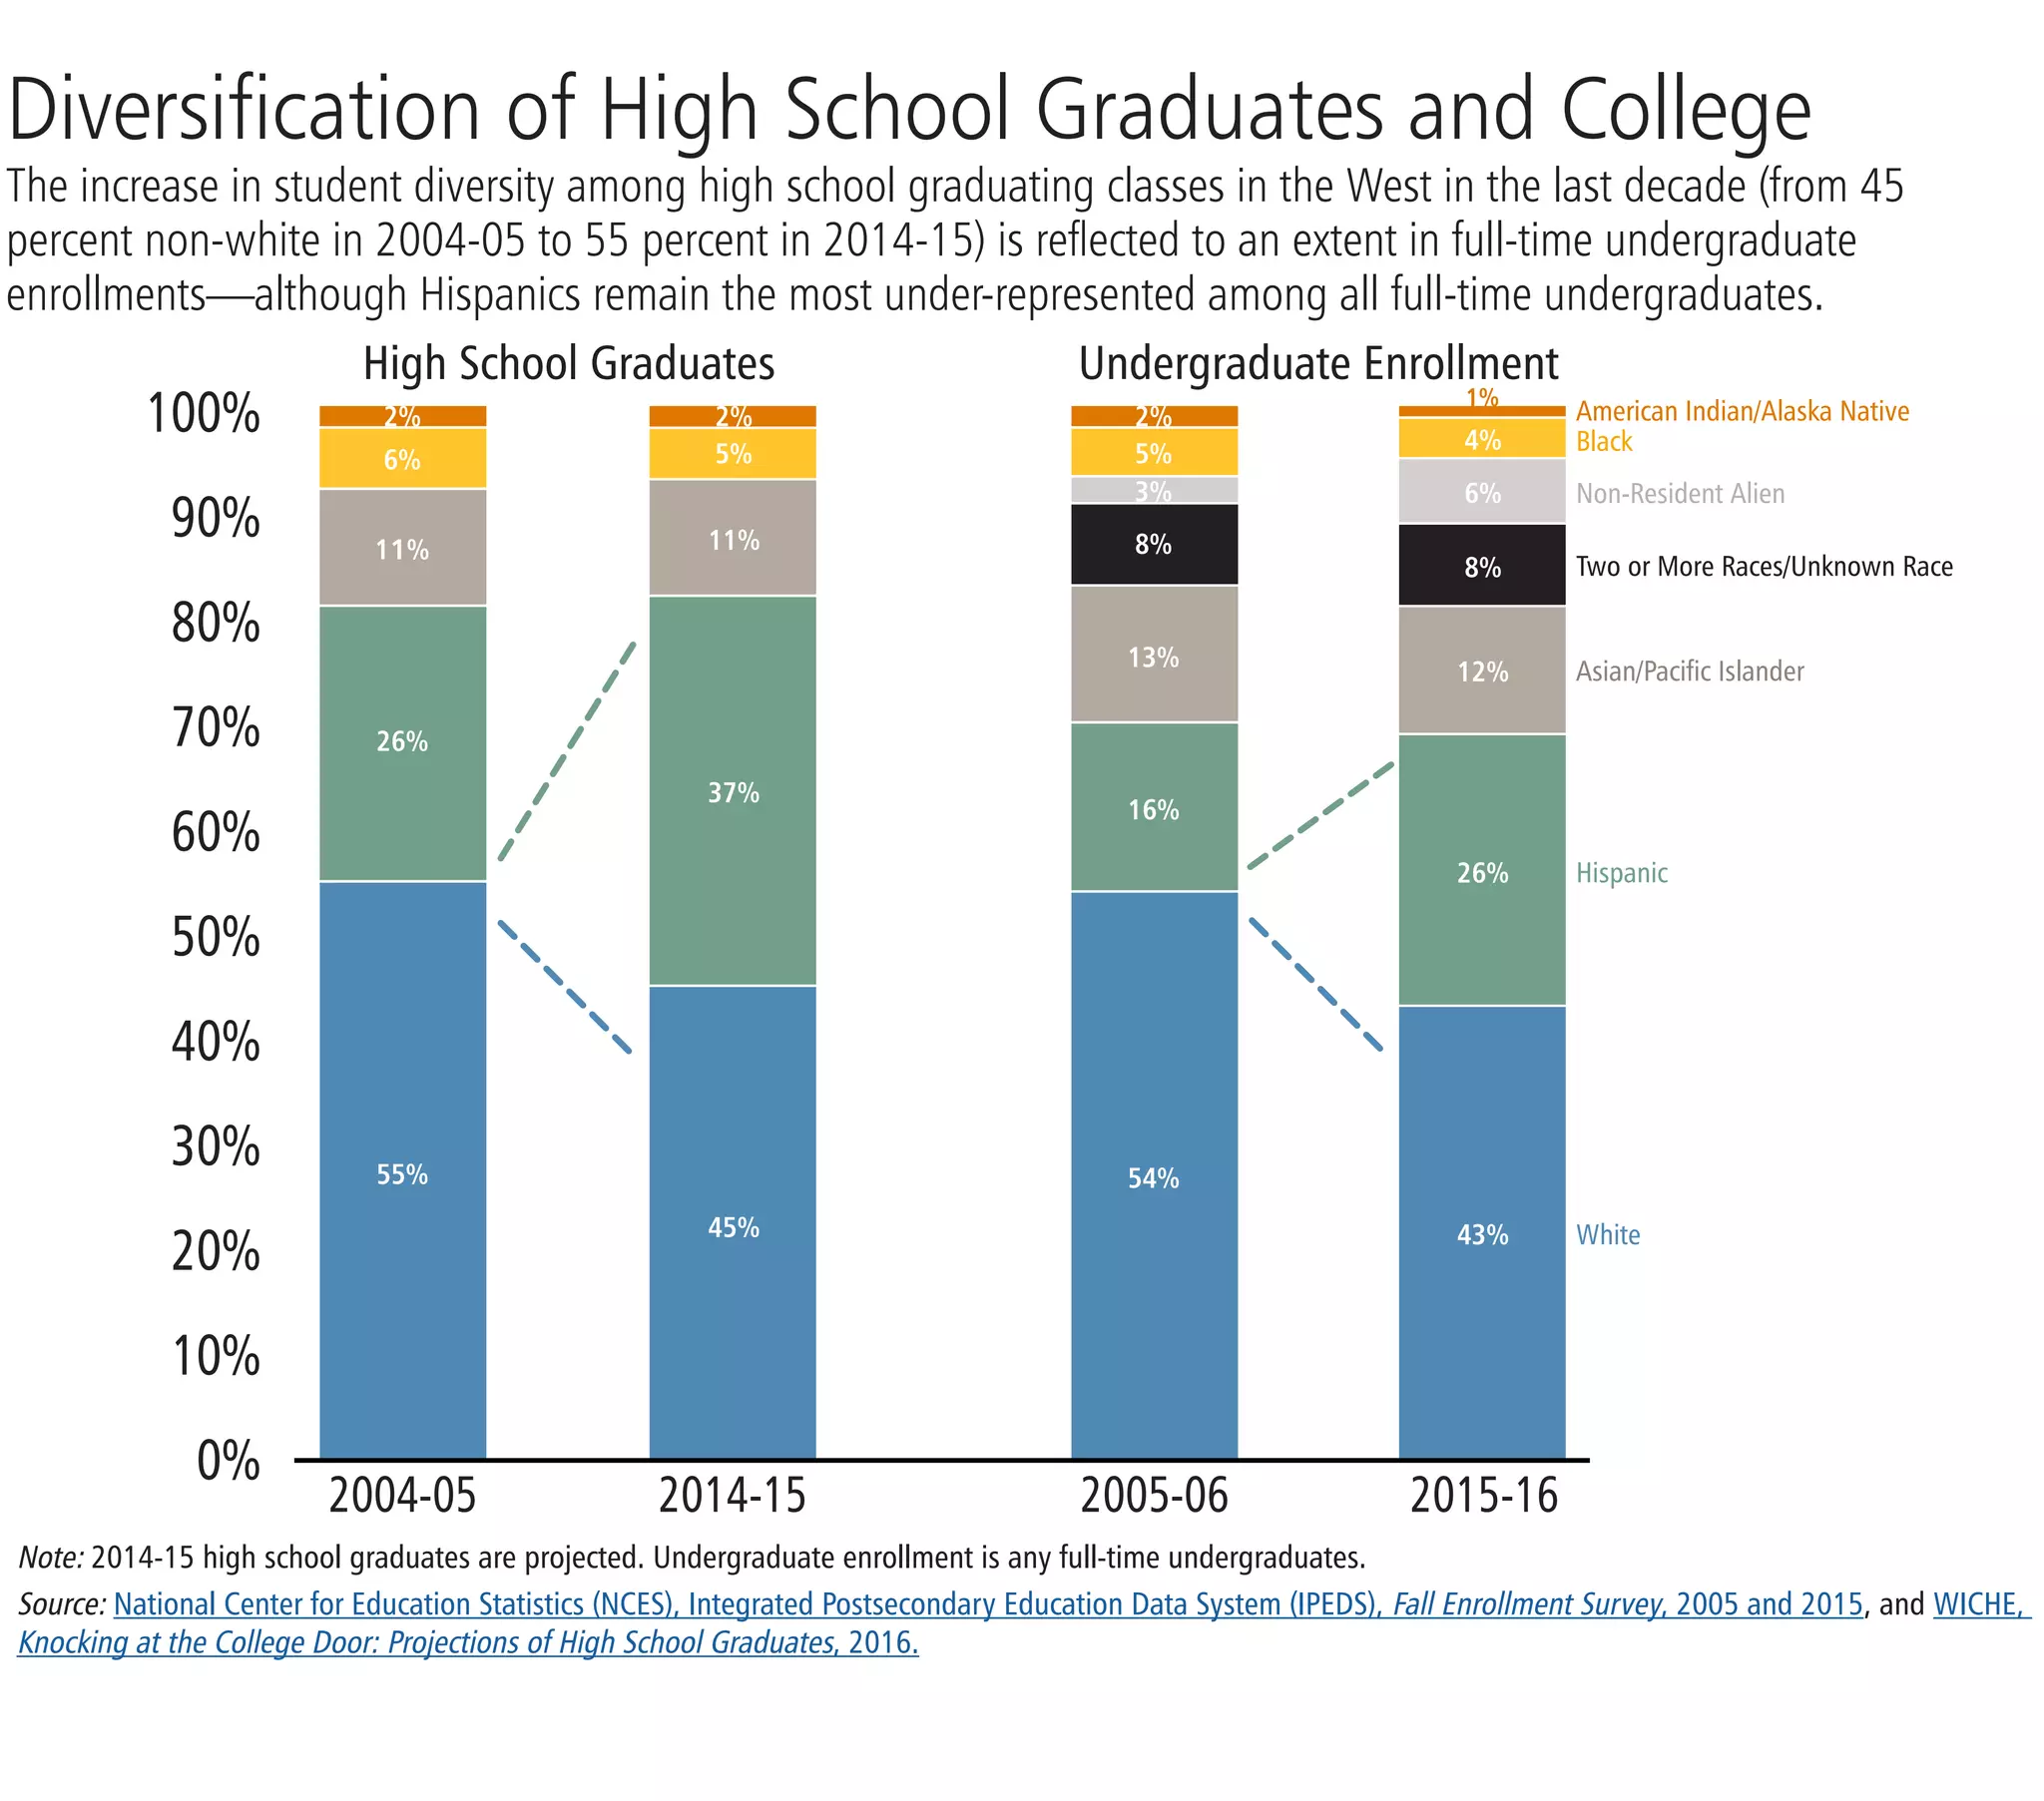
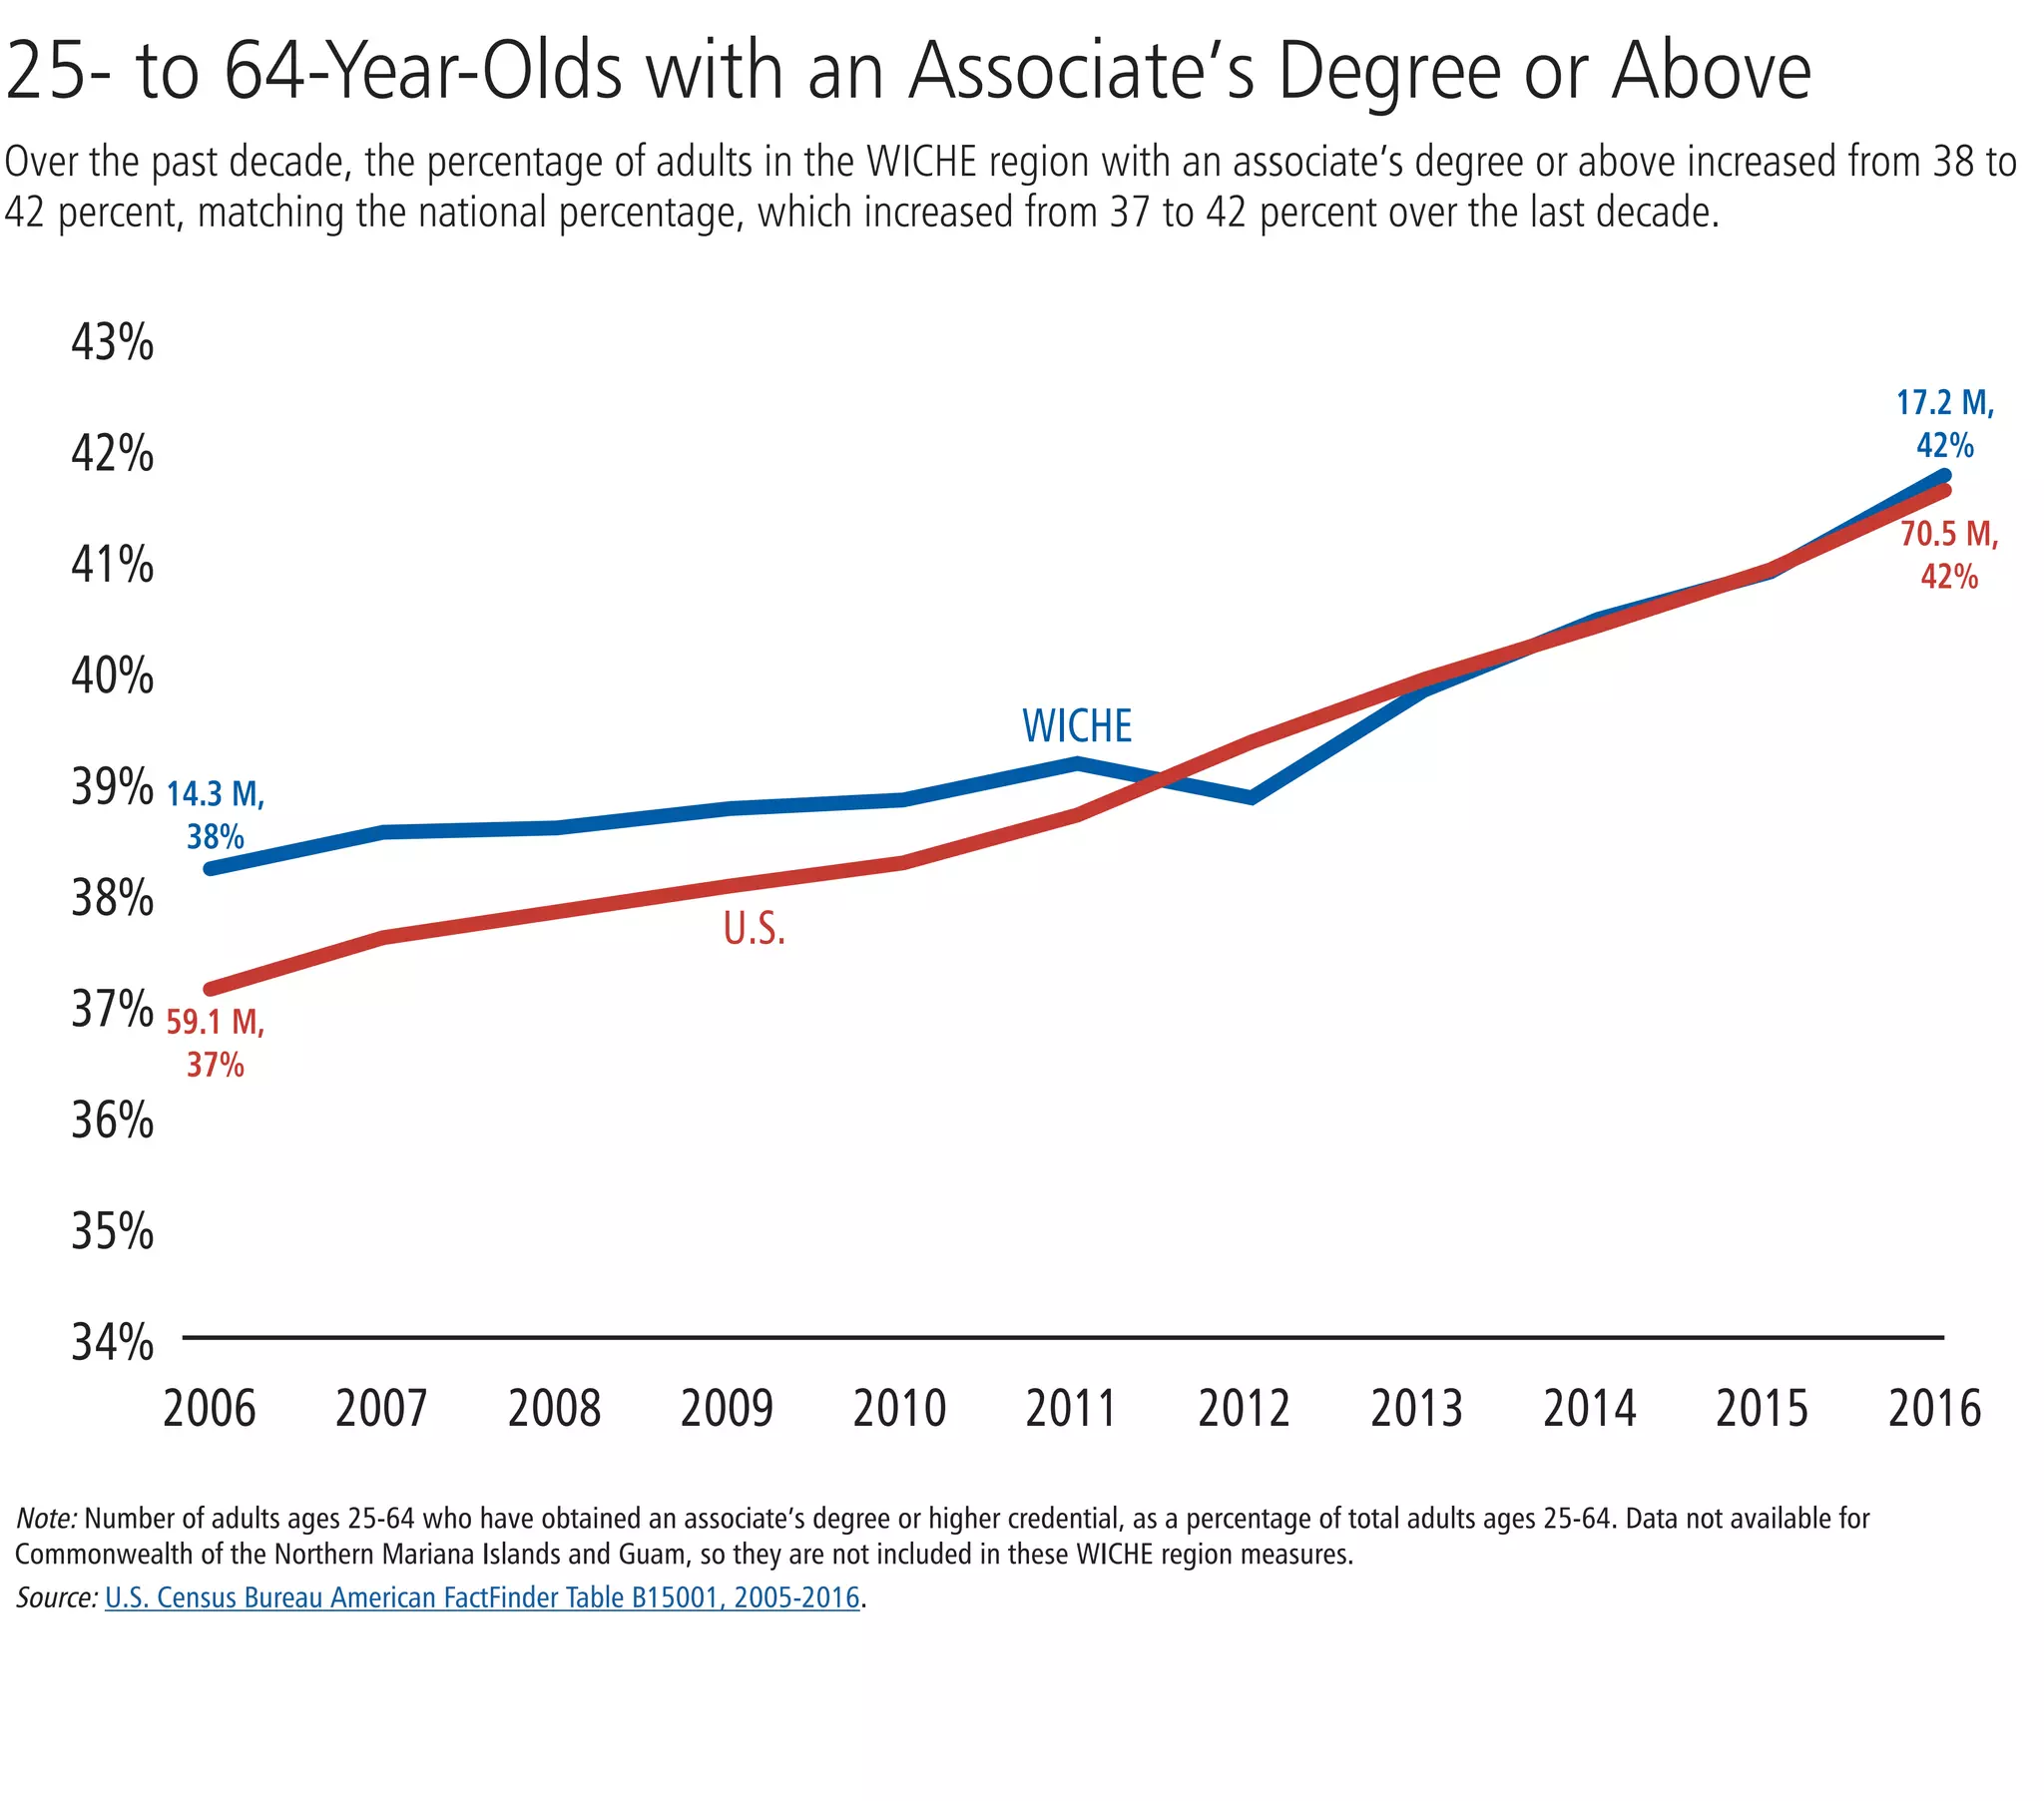
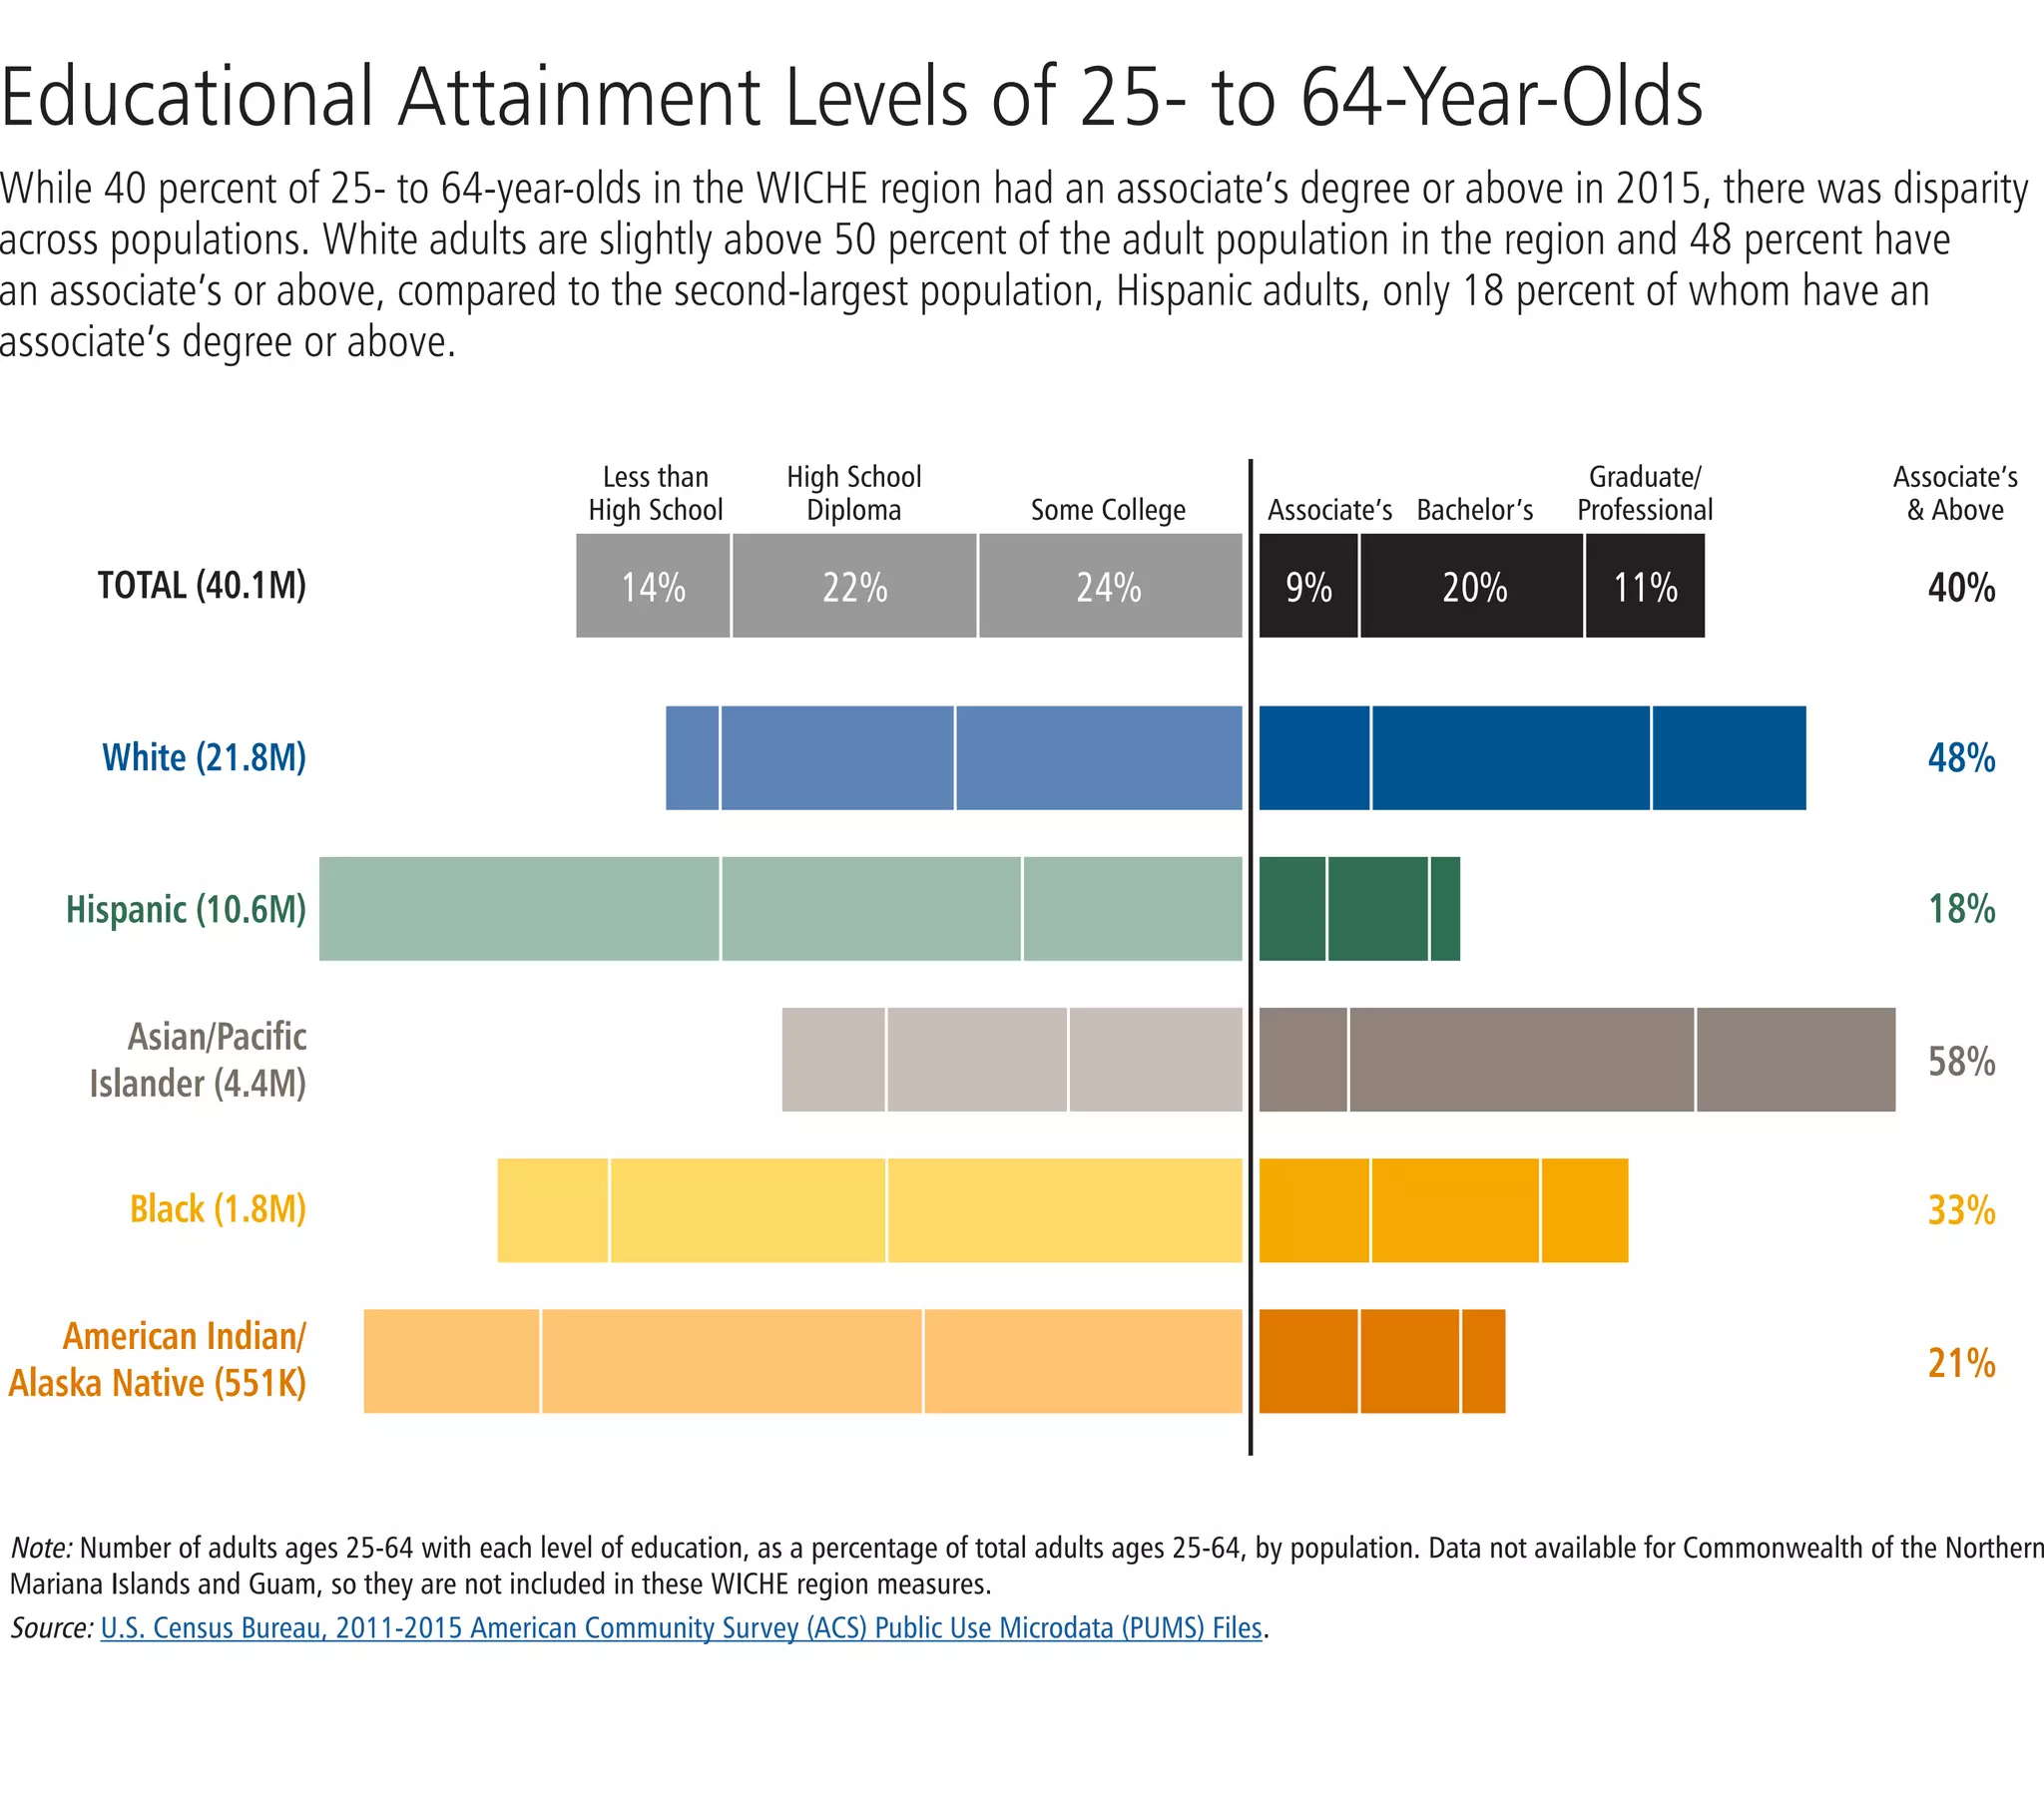
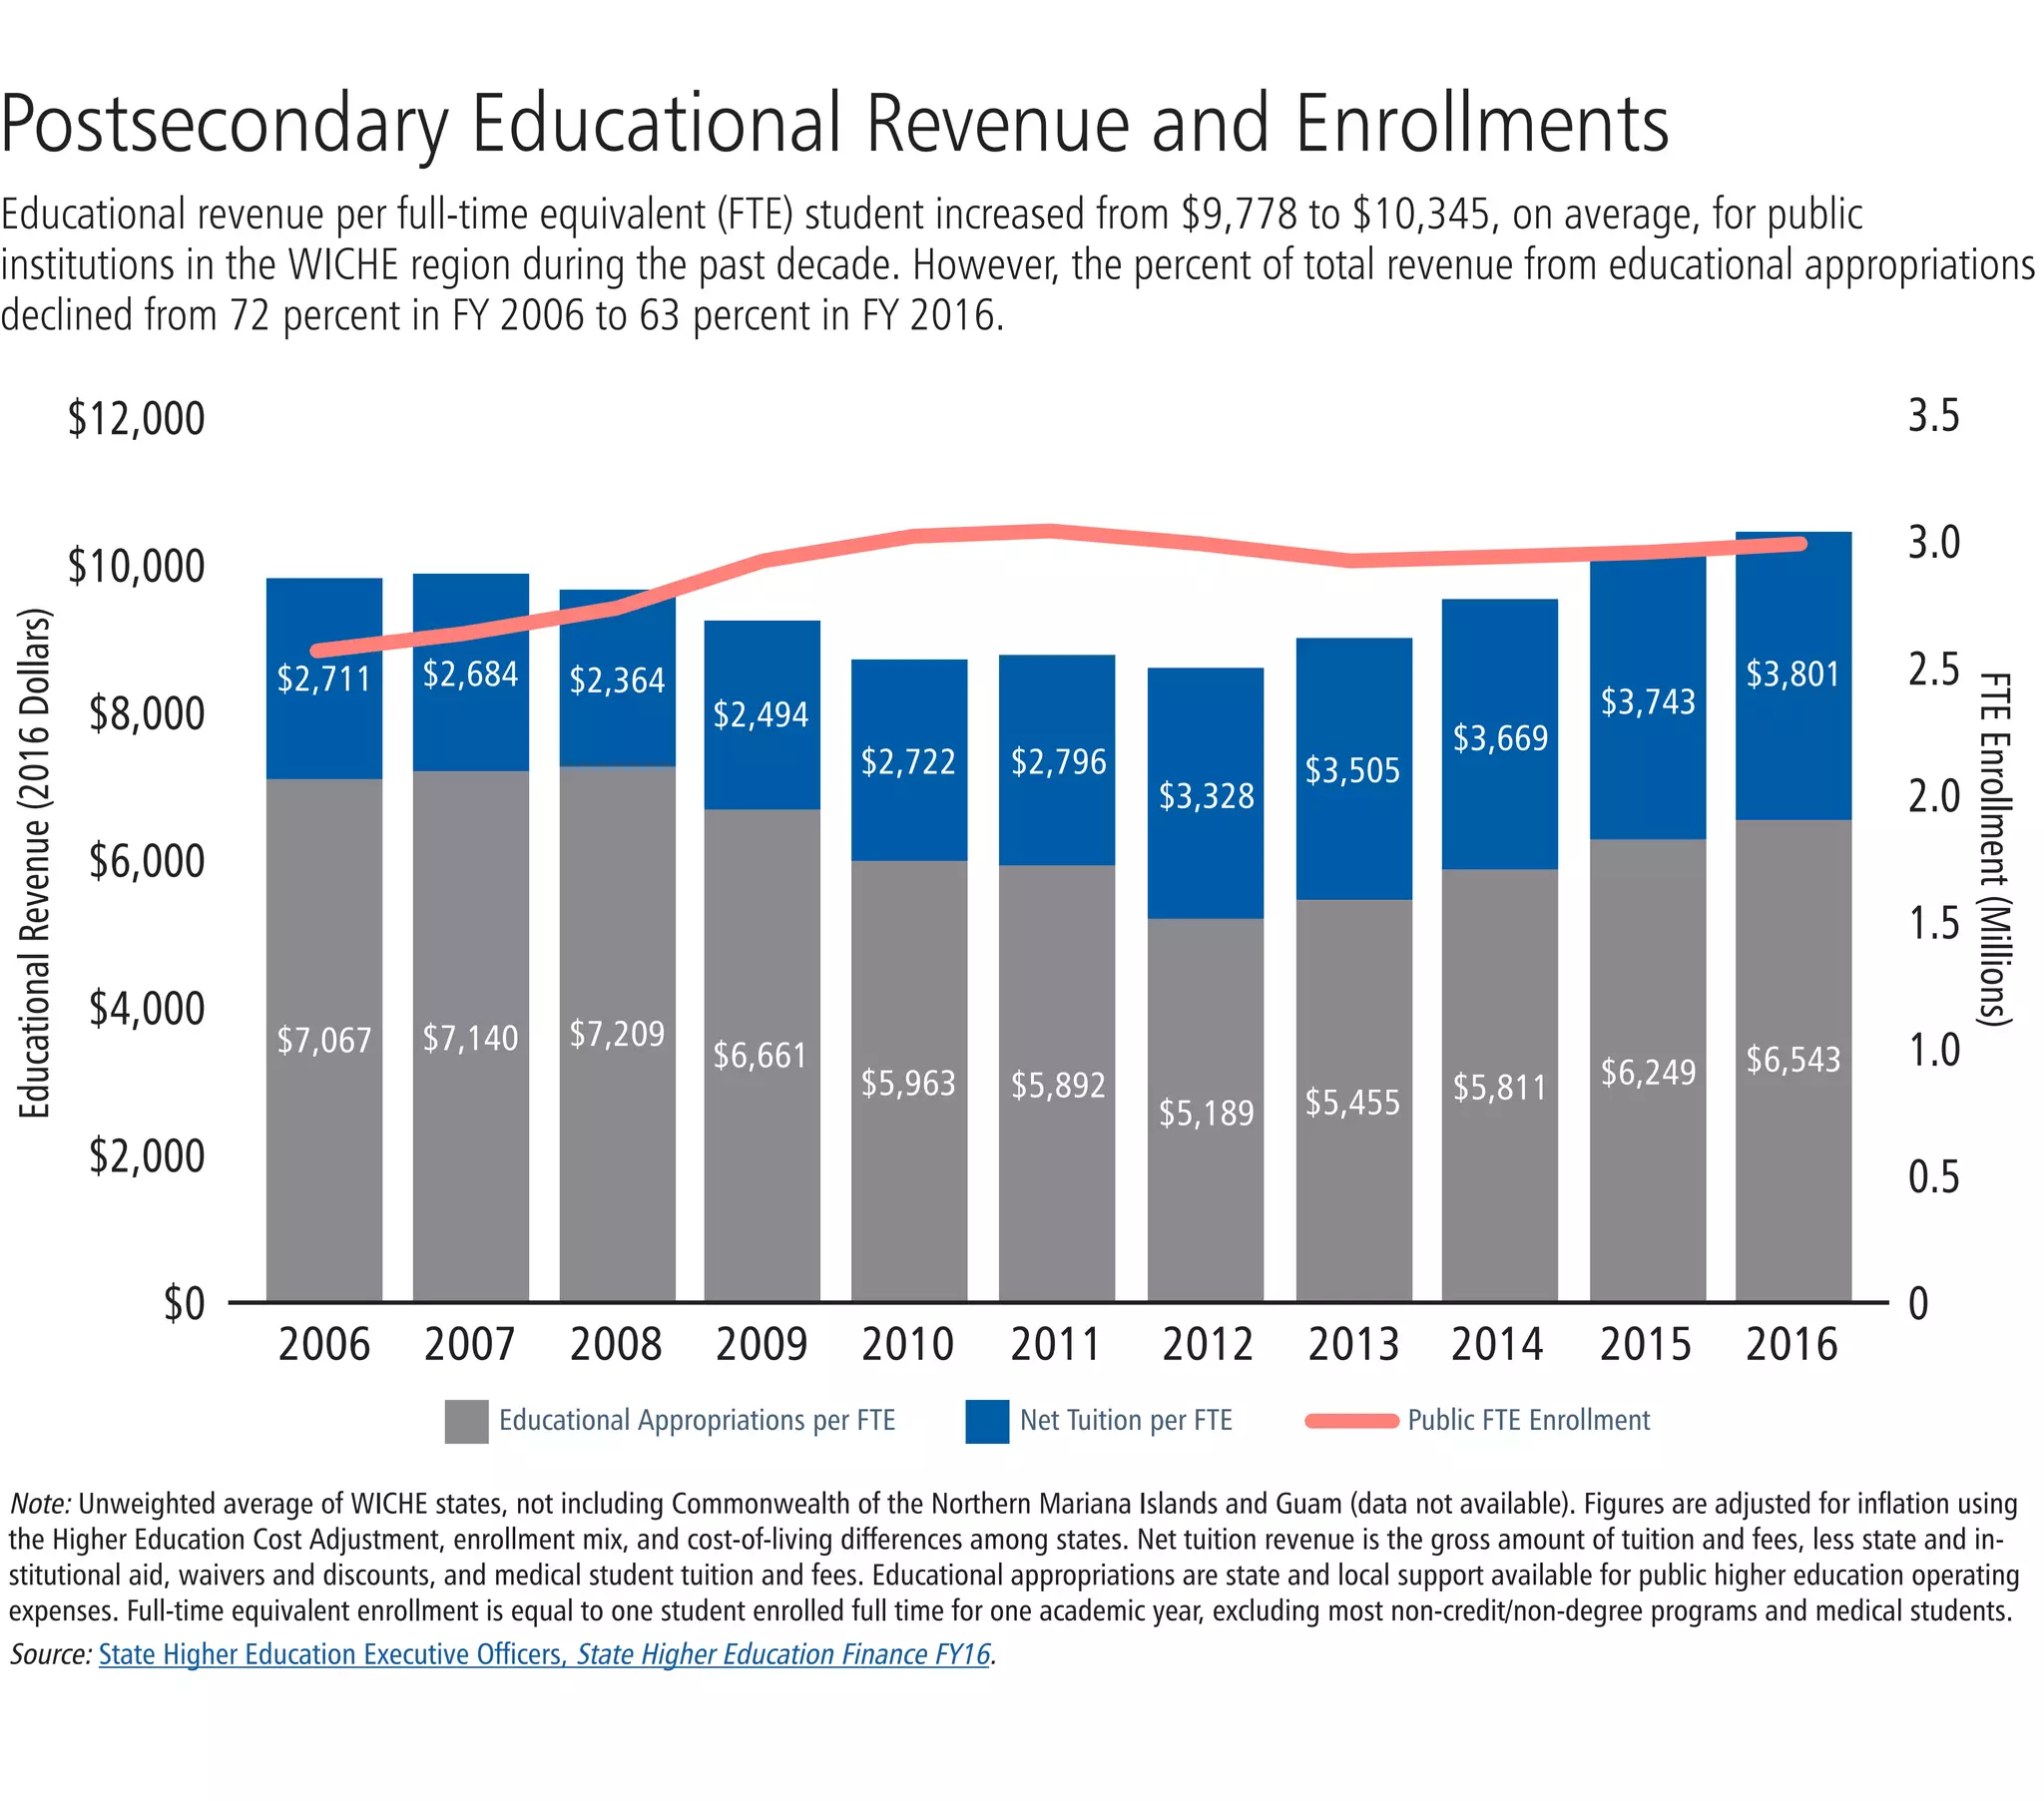
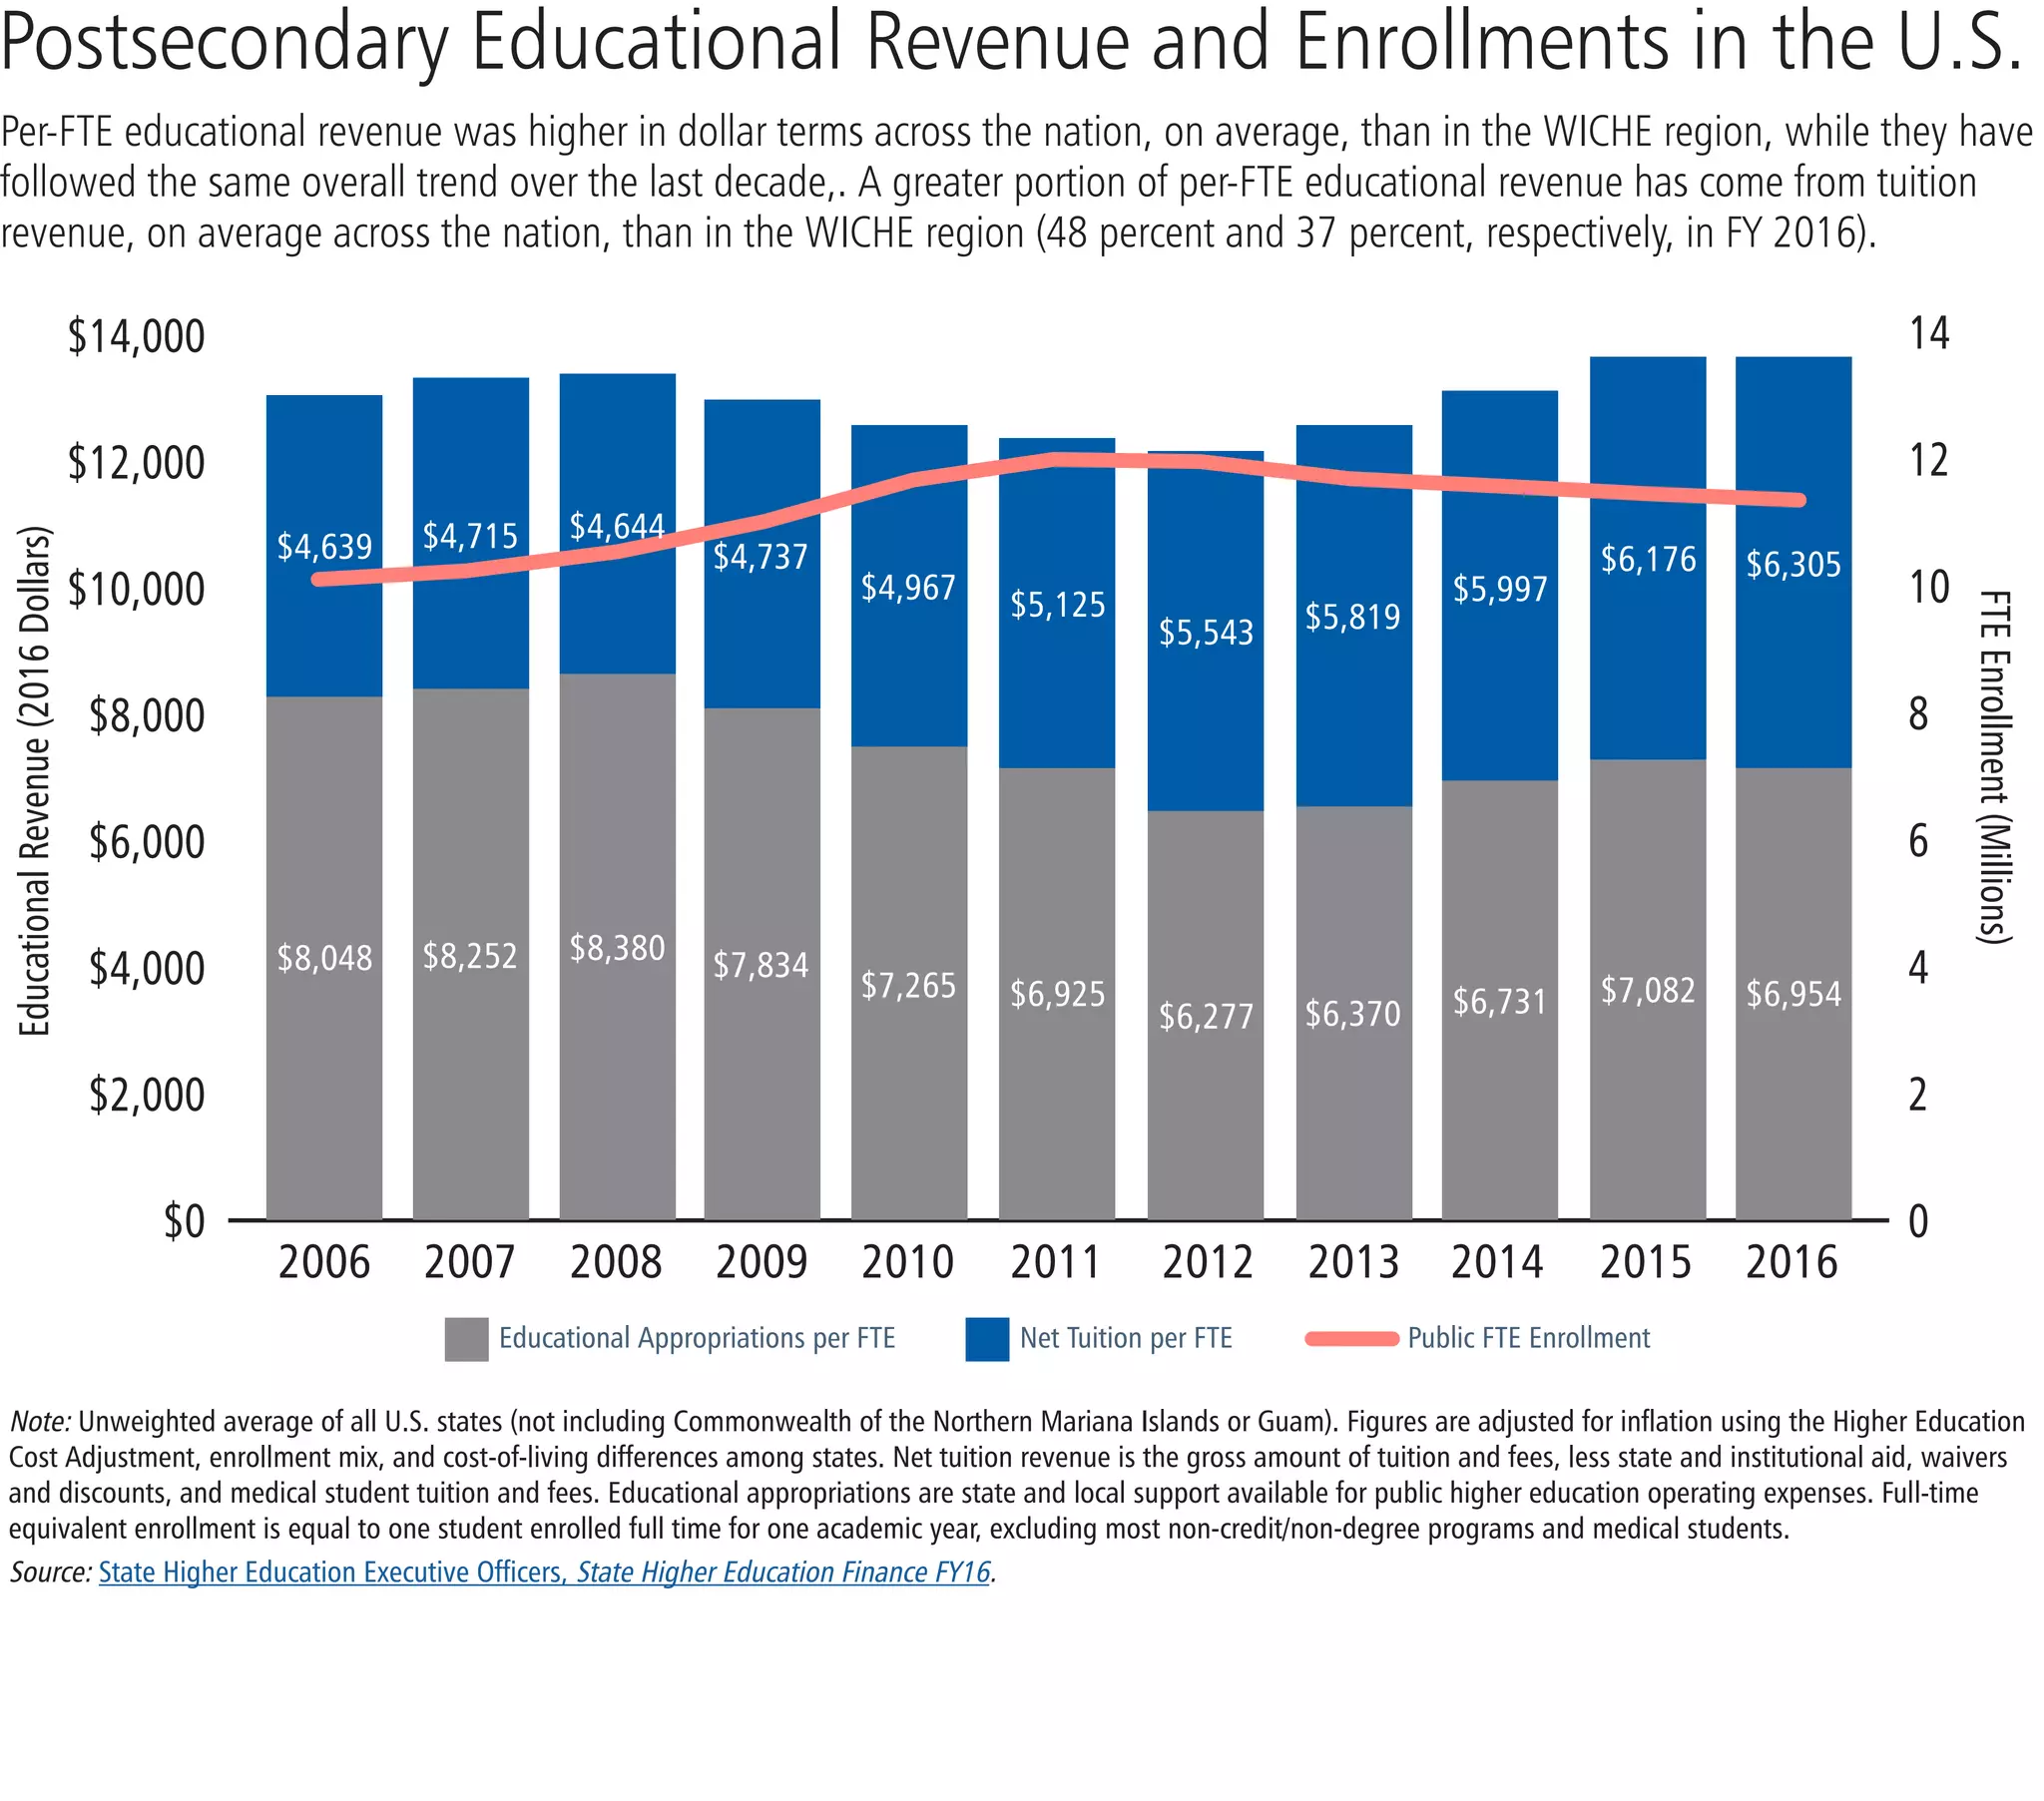
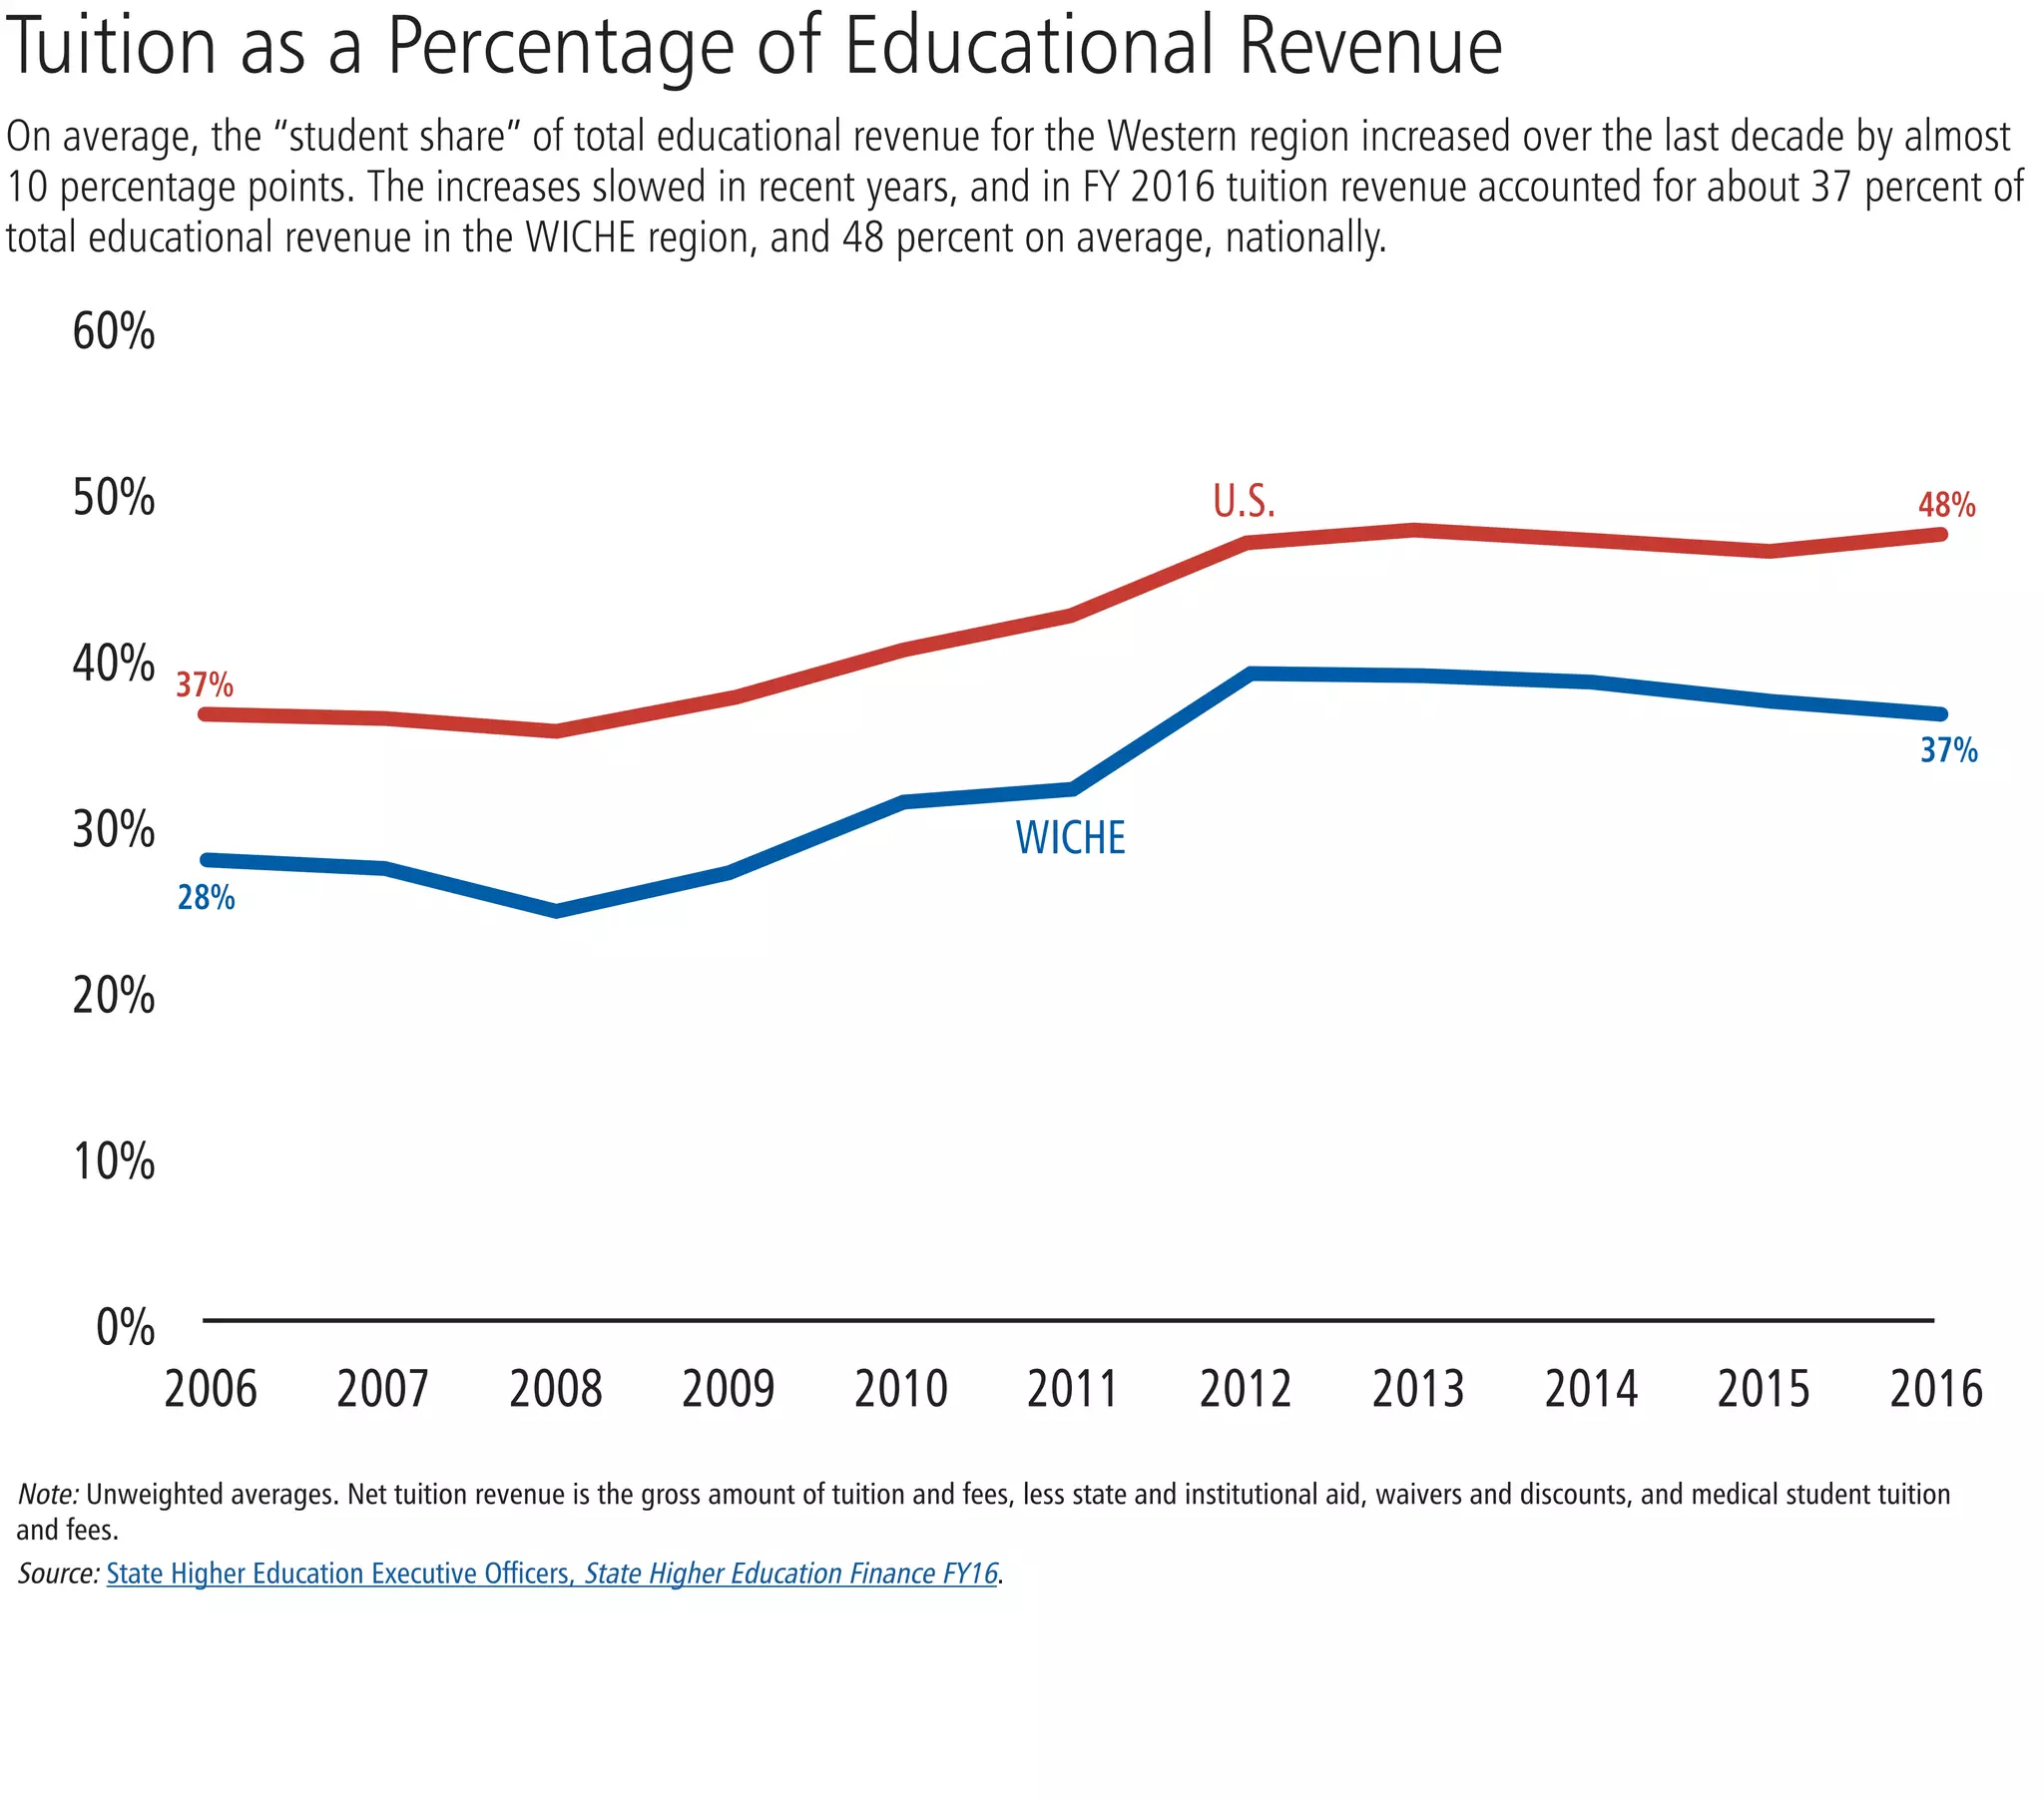
Benchmarks: WICHE Region 2018 presents information on the West’s progress in improving access to, success in, and financing of higher education. The information is updated annually with the most recent data available, to monitor change over time and encourage its use as a tool for informed discussion in policy and education communities. https://www.wiche.edu/benchmarks
The Council of Independent College's new fact sheet, “Student Debt: Myths and Facts,” contains new research to set the record straight by countering myths and providing facts about student debt.
The Council of Independent College's new fact sheet, “Private Colleges and STEM: Myths and Facts,” contains new research to set the record straight by countering myths and providing facts about the success of small, private colleges in preparing STEM majors for careers and graduate study.
On May 9, Civic Enterprises and the Everyone Graduates Center at Johns Hopkins University, as part of the GradNation Campaign, released the 2016 Building a Grad Nation report. Released annually, the report shows detailed progress toward the GradNation goal of a national on-time graduation rate of 90 percent by 2020.
That afternoon, expert speakers and co-authors of the report – John Bridgeland, CEO and president, Civic Enterprises,Jennifer DePaoli, senior education advisor, Civic Enterprises, and Robert Balfanz, director of the Everyone Graduates Center at Johns Hopkins University School of Education – discussed where the nation and states stand on the path to 90 percent.
The webinar was moderated by Tanya Tucker, vice president of alliance engagement, America's Promise Alliance.
In addition to audience questions, topics included:
• Where the nation and states stand on reaching the 90 percent by 2020 goal
• Threats to achieving the goal
• Setting the record straight on graduation rates
• Recommendations for moving forward
Find the report at: www.gradnation.org/2016report
The Racial College Completion Gap by Stella M. Flores (New York University)EduSkills OECD
This presentation was given by Stella M. Flores of the New York University at the international seminar “Equity and quality on higher education: from the right of access to the challenge of graduation” on 17-18 June 2016 in Santiago, Chile.
This presentation summarises the latest findings and updates about Agency data collection, which will take place annually from 2020 onwards. EASIE work continues to focus on developing procedures, indicators and outputs that provide countries with individual, comparative and aggregated data relating to all learners’ access to inclusive education.
In 2012-2013, a total of $58 billion in federal, state and local resources was spent to support our almost 700 public school districts, or $21,118 per pupil for approximately three million students. Of this support, $8,563 per pupil came from the state. Over the past decade the local share (mostly property taxes) of school district revenue has grown five percent, while the state share has declined four percent and federal aid has declined by almost two percent.
Educating Youth in Short-Term DetentionTanya Paperny
Each year thousands of youth in America are uprooted from their schools and communities and sent to a juvenile justice detention center. The majority of these confined youth are there for nonviolent offenses, including technical violations, such as failing to complete treatment or violating probation. Even youth awaiting foster care placement can be placed in a detention center. Over the course of a year, we estimate between 90,000 and 170,000 youth spend at least one day in a short-term detention center, and over 40% are detained for more than a month.
While in these facilities, young people are entitled to the same educational opportunities that they would have in the outside world. However, there is little research or data about this population.
In “Educating Youth in Short-Term Detention,” we found that youth’s educational experiences in these facilities often compound, rather than alleviate, the challenges they face. They are commonly unenrolled from their home school once they are arrested, and while detained, youth often do not receive coursework aligned with their needs, nor do they receive credit for the work they complete. Moreover, once they’re released, youth face significant challenges reenrolling in school, so even a brief period in confinement can severely disrupt a youth’s education.
Patterns and Trends in Educational Opportunity for Students in Juvenile Justi...Jeremy Knight
Every two years the U.S. Department of Education’s Office for Civil Rights conducts the Civil Rights Data Collection (CRDC), which includes information about school demographics, course enrollment, discipline, and other measures of school quality. For the first time in 2013-14 and again in 2015-16, the CRDC included juvenile justice schools, which serve approximately 50,000 adjudicated youth placed in secure facilities across the country.
Students’ educational experiences in juvenile justice facilities have historically gone unnoticed. Due to the unique and relatively small population they serve, these schools are typically exempt from traditional state and federal data collection. The two most recent surveys from the CRDC offer limited insight, leading our team to analyze only 18 states in 2013-14 and 15 states in 2015-16. Our analysis includes a comparison of student access to critical math and science courses disaggregated by race and ethnicity.
In “Patterns and Trends in Educational Opportunity for Students in Juvenile Justice Schools: Updates and New Insights,” we found that juvenile justice facilities fail to provide adjudicated youth with sufficient access to the courses they need to graduate high school. For example, students in juvenile justice facilities are 25 percent less likely to have access to Algebra I, a foundational class required for graduation. Moreover, these facilities offer only limited access to credit recovery programs, which are critical to helping students recoup course credits that they missed or failed to complete earlier in their academic careers.
A closer look at the data reveals that while all youth in juvenile justice facilities experience inadequate access to important classes, no group of students has less access than Native American youth. Only 63% of Native youth in juvenile justice schools have access to Algebra I compared with 79% of white students. This pattern persists in the sciences. Forty-seven percent of Native students have access to biology compared with 70% of white students. Indeed, among all groups of students in juvenile justice facilities, Native students have the lowest access to math and science courses.
These alarming statistics make clear that juvenile justice systems must do a better job providing incarcerated youth with the educational opportunities they need to get back on track. Improving the quality of data about students’ educational experiences in juvenile justice facilities is a critical first step. States — which typically run these schools — can then use improved data to increase resources to these facilities and ensure students are enrolled in the proper classes. These steps will help juvenile justice facilities perform their rehabilitative functions rather than further punishing youth by severely limiting their educational opportunities.
President Donald Trump’s nomination of philanthropist and education advocate Betsy DeVos for Secretary of Education thrust Michigan education into the national spotlight. Because DeVos doesn’t have a track record as a government official or school system leader, her work in Michigan on education issues provides some of the only information about her track record and what she might do as Secretary. Yet, DeVos’ critics and her boosters alike are making a variety of claims about Michigan that are confusing and contradictory.
To help clarify some of these questions, a new analysis from Bellwether Education Partners provides a comprehensive look at the education policy landscape in Michigan.
The Oakland Achieves Partnership brings together community organizations with a deep commitment to public education to share expertise and resources to remove barriers to school success, expand educational opportunities, and help all learners to excel from their earliest years through adulthood.
In this second annual report on student progress in Oakland, we examine how well public education outcomes match the great potential of our children. Click here to download the report.
The report reviews a full range of data on Oakland student outcomes from cradle to career. Wherever possible, it includes data from district-operated schools and charter schools. We have added several new indicators since last year, including kindergarten readiness and Financial Aid Form completion.
Using Accountability to Drive Equity: Risks and Opportunities in ESSAThe Education Trust
The Education Trust's Daria Hall, vice president for government affairs and communications, spoke with U.S. chambers of commerce about what accountability in K-12 education means, why it's important, what are key principles for strong, equity-focused accountability, and opportunities and risks that the Every Student Succeeds Act poses for state accountability.
The Community College Role in Access and Success for all Students by Thomas B...EduSkills OECD
This presentation was given by Thomas Bailey of the Community College Research Center, Teachers College, Columbia University at the international seminar “Equity and quality on higher education: from the right of access to the challenge of graduation” on 17-18 June 2016 in Santiago, Chile.
Arizona's Economic Imperative: Leading the Nation in Latino Student Successbvontran
Educating every student in Arizona is essential to ensuring our state’s economic prosperity, yet a growing portion of Arizona’s future workforce is falling short of essential degree completion. This is particularly true of the fastest growing demographic in our state – the Latino population.
Board of Regents Strategic Goals 07-30-2015HigherEdUtah
Strategic goals presentation by Commissioner Dave Buhler, given at the joint meeting of the Board of Regents and Institutional Trustees on July 30, 2015 at Southern Utah University
More than half (or 51%) of youth aged 18–24 claimed that they did not have the financial means to pay for their tuition. Furthermore, 18% of those aged 18–24 who were not attending educational institutions indicated that their poor academic performance prevented them from participating. This is according to the “Higher Education and Skills in South Africa” report released by Statistics South Africa.
Read more here: http://www.statssa.gov.za/?p=12040
Secondary education on a global scale finalMakha U
The testing hypotheses for Business analysis course using Tableau Software. That part is a proposal, the implementation is to follow.
There is animation which can be seen in the view mode (F5).
It is more interesting to see it moving... Enjoy :)
I am not sure if it can be downloaded in PPT format. If you need you can ask to send it in PPT...
Welcome to TechSoup New Member Orientation and Q&A (May 2024).pdfTechSoup
In this webinar you will learn how your organization can access TechSoup's wide variety of product discount and donation programs. From hardware to software, we'll give you a tour of the tools available to help your nonprofit with productivity, collaboration, financial management, donor tracking, security, and more.
Operation “Blue Star” is the only event in the history of Independent India where the state went into war with its own people. Even after about 40 years it is not clear if it was culmination of states anger over people of the region, a political game of power or start of dictatorial chapter in the democratic setup.
The people of Punjab felt alienated from main stream due to denial of their just demands during a long democratic struggle since independence. As it happen all over the word, it led to militant struggle with great loss of lives of military, police and civilian personnel. Killing of Indira Gandhi and massacre of innocent Sikhs in Delhi and other India cities was also associated with this movement.
The Art Pastor's Guide to Sabbath | Steve ThomasonSteve Thomason
What is the purpose of the Sabbath Law in the Torah. It is interesting to compare how the context of the law shifts from Exodus to Deuteronomy. Who gets to rest, and why?
2024.06.01 Introducing a competency framework for languag learning materials ...Sandy Millin
http://sandymillin.wordpress.com/iateflwebinar2024
Published classroom materials form the basis of syllabuses, drive teacher professional development, and have a potentially huge influence on learners, teachers and education systems. All teachers also create their own materials, whether a few sentences on a blackboard, a highly-structured fully-realised online course, or anything in between. Despite this, the knowledge and skills needed to create effective language learning materials are rarely part of teacher training, and are mostly learnt by trial and error.
Knowledge and skills frameworks, generally called competency frameworks, for ELT teachers, trainers and managers have existed for a few years now. However, until I created one for my MA dissertation, there wasn’t one drawing together what we need to know and do to be able to effectively produce language learning materials.
This webinar will introduce you to my framework, highlighting the key competencies I identified from my research. It will also show how anybody involved in language teaching (any language, not just English!), teacher training, managing schools or developing language learning materials can benefit from using the framework.
How to Make a Field invisible in Odoo 17Celine George
It is possible to hide or invisible some fields in odoo. Commonly using “invisible” attribute in the field definition to invisible the fields. This slide will show how to make a field invisible in odoo 17.
Instructions for Submissions thorugh G- Classroom.pptxJheel Barad
This presentation provides a briefing on how to upload submissions and documents in Google Classroom. It was prepared as part of an orientation for new Sainik School in-service teacher trainees. As a training officer, my goal is to ensure that you are comfortable and proficient with this essential tool for managing assignments and fostering student engagement.
Cambridge International AS A Level Biology Coursebook - EBook (MaryFosbery J...
Benchmarks: WICHE Region 2017
1. WICHE Region 2017
Benchmarks: WICHE Region 2017 presents information on the West’s progress in
improving access to, success in, and financing of higher education. The information
is updated annually with the most recent data available, to monitor change over
time and encourage its use as a tool for informed discussion in policy and education
communities. Data included in these charts is for the WICHE region, unless otherwise
stated. Visit wiche.edu/benchmarks to access these charts’ data for all WICHE members.
Please use the following citation if you are reproducing these charts: Western Interstate
Commission for Higher Education, Benchmarks: WICHE Region 2017.
Western Interstate Commission
for Higher Education
2. Undergraduate Enrollment by Sector
Between Fall 2005 and Fall 2015, undergraduate enrollment at public and private, nonprofit institutions in the West increased
13 percent. Enrollment in the region has been relatively flat since the strong increases during the Great Recession, with public
research and private, nonprofit enrollment increases offsetting strong declines at public two-years.
0
500,000
000,000
500,000
000,000
500,000
000,000
500,000
000,000
500,000
2005 2006 2007 2008 2009 2010 2011 2012 2013 2014 2015
Public Two-Year Baccalaureate/Master's Research/Doctoral Independent
4.5
4.0
3.5
3.0
2.5
2.0
1.5
1.0
0.5
0
UndergraduateEnrollment(Millions)
2005 2006 2007 2008 2009 2010 2011 2012 2013 2014 2015
Note: Data are for two- and four-year degree-granting, Title IV-eligible, nonprofit institutions, excluding service academies. Sectors are classified according to the 2005, 2010, and
2015 Carnegie Classification of Higher Education Institutions. Private nonprofit includes two- and four-year institutions.
Source: National Center for Education Statistics (NCES), Integrated Postsecondary Education Data System (IPEDS). Fall Enrollment Survey, 2005-2015.
4,204,4174,210,498
3,718,483
Public, Two-Year
Public, Baccalaureate/Master’s
Public, Research
Private, Nonprofit
3. Diversification of High School Graduates and College
The increase in student diversity among high school graduating classes in the West in the last decade (from 45
percent non-white in 2004-05 to 55 percent in 2014-15) is reflected to an extent in full-time undergraduate
enrollments—although Hispanics remain the most under-represented among all full-time undergraduates.
Note: 2014-15 high school graduates are projected. Undergraduate enrollment is any full-time undergraduates.
Source: National Center for Education Statistics (NCES), Integrated Postsecondary Education Data System (IPEDS), Fall Enrollment Survey, 2005 and 2015, and WICHE,
Knocking at the College Door: Projections of High School Graduates, 2016.
100%
90%
80%
70%
60%
50%
40%
30%
20%
10%
0%
High School Graduates Undergraduate Enrollment
1%
4%
6%
8%
12%
26%
43%
2%
5%
3%
8%
13%
16%
54%
American Indian/Alaska Native
Black
Non-Resident Alien
Two or More Races/Unknown Race
Asian/Pacific Islander
Hispanic
White
2%
5%
11%
37%
45%
2%
6%
11%
26%
55%
2004-05 2014-15 2005-06 2015-16
4. 25- to 64-Year-Olds with an Associate’s Degree or Above
Over the past decade, the percentage of adults in the WICHE region with an associate’s degree or above increased from 38 to
42 percent, matching the national percentage, which increased from 37 to 42 percent over the last decade.
43%
42%
41%
40%
39%
38%
37%
36%
35%
34%
2006 2007 2008 2009 2010 2011 2012 2013 2014 2015 2016
Note: Number of adults ages 25-64 who have obtained an associate’s degree or higher credential, as a percentage of total adults ages 25-64. Data not available for
Commonwealth of the Northern Mariana Islands and Guam, so they are not included in these WICHE region measures.
Source: U.S. Census Bureau American FactFinder Table B15001, 2005-2016.
WICHE
17.2 M,
42%
70.5 M,
42%
U.S.
14.3 M,
38%
59.1 M,
37%
5. Educational Attainment Levels of 25- to 64-Year-Olds
While 40 percent of 25- to 64-year-olds in the WICHE region had an associate’s degree or above in 2015, there was disparity
across populations. White adults are slightly above 50 percent of the adult population in the region and 48 percent have
an associate’s or above, compared to the second-largest population, Hispanic adults, only 18 percent of whom have an
associate’s degree or above.
Note: Number of adults ages 25-64 with each level of education, as a percentage of total adults ages 25-64, by population. Data not available for Commonwealth of the Northern
Mariana Islands and Guam, so they are not included in these WICHE region measures.
Source: U.S. Census Bureau, 2011-2015 American Community Survey (ACS) Public Use Microdata (PUMS) Files.
Graduate/
ProfessionalBachelor’sAssociate’sSome College
High School
Diploma
Less than
High School
9% 20% 11%14% 22% 24%TOTAL (40.1M)
White (21.8M)
Hispanic (10.6M)
Asian/Pacific
Islander (4.4M)
Black (1.8M)
American Indian/
Alaska Native (551K)
40%
48%
18%
58%
33%
21%
Associate’s
& Above
6. $12,000
$10,000
$8,000
$6,000
$4,000
$2,000
$0
3.5
3.0
2.5
2.0
1.5
1.0
0.5
0
2006 2007 2008 2009 2010 2011 2012 2013 2014 2015 2016
Educational Appropriations per FTE Net Tuition per FTE Public FTE Enrollment
FTEEnrollment(Millions)
Postsecondary Educational Revenue and Enrollments
Educational revenue per full-time equivalent (FTE) student increased from $9,778 to $10,345, on average, for public
institutions in the WICHE region during the past decade. However, the percent of total revenue from educational appropriations
declined from 72 percent in FY 2006 to 63 percent in FY 2016.
EducationalRevenue(2016Dollars)
Note: Unweighted average of WICHE states, not including Commonwealth of the Northern Mariana Islands and Guam (data not available). Figures are adjusted for inflation using
the Higher Education Cost Adjustment, enrollment mix, and cost-of-living differences among states. Net tuition revenue is the gross amount of tuition and fees, less state and in-
stitutional aid, waivers and discounts, and medical student tuition and fees. Educational appropriations are state and local support available for public higher education operating
expenses. Full-time equivalent enrollment is equal to one student enrolled full time for one academic year, excluding most non-credit/non-degree programs and medical students.
Source: State Higher Education Executive Officers, State Higher Education Finance FY16.
$7,067 $7,140 $7,209
$6,661
$5,963 $5,892
$5,189 $5,455 $5,811 $6,249 $6,543
$2,711 $2,684 $2,364
$2,494
$2,722 $2,796
$3,328
$3,505
$3,669
$3,743
$3,801
7. $14,000
$12,000
$10,000
$8,000
$6,000
$4,000
$2,000
$0
14
12
10
8
6
4
2
0
2006 2007 2008 2009 2010 2011 2012 2013 2014 2015 2016
FTEEnrollment(Millions)
Postsecondary Educational Revenue and Enrollments in the U.S.
Per-FTE educational revenue was higher in dollar terms across the nation, on average, than in the WICHE region, while they have
followed the same overall trend over the last decade,. A greater portion of per-FTE educational revenue has come from tuition
revenue, on average across the nation, than in the WICHE region (48 percent and 37 percent, respectively, in FY 2016).
EducationalRevenue(2016Dollars)
Note: Unweighted average of all U.S. states (not including Commonwealth of the Northern Mariana Islands or Guam). Figures are adjusted for inflation using the Higher Education
Cost Adjustment, enrollment mix, and cost-of-living differences among states. Net tuition revenue is the gross amount of tuition and fees, less state and institutional aid, waivers
and discounts, and medical student tuition and fees. Educational appropriations are state and local support available for public higher education operating expenses. Full-time
equivalent enrollment is equal to one student enrolled full time for one academic year, excluding most non-credit/non-degree programs and medical students.
Source: State Higher Education Executive Officers, State Higher Education Finance FY16.
$8,048 $8,252 $8,380 $7,834
$7,265 $6,925
$6,277 $6,370 $6,731 $7,082 $6,954
$4,639 $4,715 $4,644
$4,737
$4,967 $5,125
$5,543 $5,819
$5,997
$6,176 $6,305
Educational Appropriations per FTE Net Tuition per FTE Public FTE Enrollment
8. Tuition as a Percentage of Educational Revenue
On average, the “student share” of total educational revenue for the Western region increased over the last decade by almost
10 percentage points. The increases slowed in recent years, and in FY 2016 tuition revenue accounted for about 37 percent of
total educational revenue in the WICHE region, and 48 percent on average, nationally.
60%
50%
40%
30%
20%
10%
0%
2006 2007 2008 2009 2010 2011 2012 2013 2014 2015 2016
Note: Unweighted averages. Net tuition revenue is the gross amount of tuition and fees, less state and institutional aid, waivers and discounts, and medical student tuition
and fees.
Source: State Higher Education Executive Officers, State Higher Education Finance FY16.
WICHE
28%
37%
37%
48%U.S.
9. Tuition and Fees as a Percentage of Family Income
The average tuition and fees for resident undergraduates in the WICHE region was $8,081 at four-year institutions and $2,126
at two-year institutions in 2015-16. Tuition and fees represented very different shares of median family income in 2015, by
race/ethnicity (not factoring in total or net cost of attendance). This has apparent implications for financial need and perceived
“sticker shock” for certain families in particular.
Note: WICHE region median family income, overall and by population, includes all sources of income for households with children aged 0-17. Tuition and fees is an unweighted
average of resident/in-district tuition and fees at two-and four-year institutions in the WICHE region.
Source: U.S. Census Bureau, 2011-2015 American Community Survey (ACS) Public Use Microdata (PUMS) and Western Interstate Commission for Higher Education, Tuition and
Fees in the West.
$100,000
$90,000
$80,000
$70,000
$60,000
$50,000
$40,000
$30,000
$20,000
$10,000
$0
MedianFamilyIncome,2015
Asian/Pacific
Islander (898 K)
White (5.6 M) Black (432 K) Hispanic (3.1 M) American Indian/
Alaska Native (159 K)
WICHE Median Family Income: $65,623
8%
2%
10%
3%
18%
5%
19%
5%
22%
6%
$96,121
$80,767
$37,355
$43,469$44,422
4-Year Tuition and Fees, 2015-16
2-Year Tuition and Fees, 2015-16
10. Tuition and Fees at Public Two- and Four-Year Institutions
Tuition and fees for resident undergraduates at public two- and four-year institutions increased across all sectors between
2007-08 and 2017-18. The largest increases were at baccalaureate and master’s institutions (48 percent) and research institu-
tions (45 percent). Tuition and fees for resident undergraduates at two-year institutions increased more than 30 percent, both
with and without California, since 2007-08.
Note: Tuition and Fees charges are for resident undergraduates. Sectors are classified according to the 2005, 2010, and 2015 Carnegie Classification of Higher Education
Institutions. Dollars adjusted to 2017 dollars using the Higher Education Cost Adjustment (HECA).
Source: Western Interstate Commission for Higher Education.
2007-08 2009-10 2011-12 2013-14 2015-16 2017-18
Associate’s w/ CA $2,790
$10,127
$3,838
$7,484
Baccalaureate/Master’s
$12,000
$10,000
$8,000
$6,000
$4,000
$2,000
$0
UndergraduateTuition&Fees(2017dollars)
Associate’s w/o CA
Research
$2,003
$6,997
$2,948
$5,060
11. 45,000
40,000
35,000
30,000
25,000
20,000
15,000
10,000
5,000
0
WUE Savings WUE Enrollment
Western Undergraduate Exchange (WUE) Enrollment & Savings
Annual enrollment in WICHE’s Western Undergraduate Exchange (WUE) has increased over 80 percent between 2007-08 and
2017-18. Correspondingly, annual savings to students and/or families more than doubled over the same time period.
WUEEnrollment
Note: Total WUE savings included the Commonwealth of the Northern Mariana Islands starting in 2013-14 and included Guam starting in 2016-17. Dollars adjusted to 2017
dollars using the Consumer Price Index.
Source: Western Interstate Commission for Higher Education.
$162 M $168 M
$197 M
$237 M $239 M $252 M
$277 M $287 M
$317 M
$347 M
$365 M
2007-08 2008-09 2009-10 2010-11 2011-12 2012-13 2013-14 2014-15 2015-16 2016-17 2017-18
12. Institutional Grant Aid Per FTE
Average total grant aid per full-time equivalent student (FTE) at public institutions increased more than 70 percent between
2004-05 and 2010-11 in the WICHE region, but it declined about 10 percent by 2014-15 from the high, reversing the trend so
that the average WICHE grant aid per student went below the national average.
$1,800
$1,500
$1,200
$900
$600
$300
$0
2004-05 2005-06 2006-07 2007-08 2008-09 2009-10 2010-11 2011-12 2012-13 2013-14 2014-15
Note: Data are for grant aid expenditures, not including discounts and allowances, from all sources at public institutions.
Source: National Center for Education Statistics, Integrated Postsecondary Education Data System IPEDS, Finance and Enrollment Surveys, 2005-2015.
WICHE
$1,364
$1,409
U.S.
GrantAidPerFTE(CurrentDollars)
$898
$857
13. Students Receiving Federal Grant Aid
The share of full-time, first-time students in the West receiving federal grant aid climbed dramatically during the recession years
and stabilized after 2011-12. The WICHE rate has typically been lower than the national average, but the difference narrowed
in the last five years.
50%
45%
40%
35%
30%
25%
20%
2004-05 2005-06 2006-07 2007-08 2008-09 2009-10 2010-11 2011-12 2012-13 2013-14 2014-15
Note: Data are for public institutions, excluding U.S. service academies. Federal grant aid includes grants awarded principally through the Pell Grant and SEOG programs, but also
includes educational assistance grants awarded through the Veteran’s Administration, Department of Labor, and other federal agencies.
Source: National Center for Education Statistics (NCES), Integrated Postsecondary Education Data System (IPEDS), Student Financial Aid Survey, 2005- 2015.
WICHE
44%
47%
U.S.
43%
44%
30%
33%
14. Average Loan Amount of Bachelor’s Degree Recipients
The average loan amount for bachelor recipients from public and private nonprofit institutions with loans in the WICHE region
increased 25 percent between 2009-10 and 2015-16, about the same rate as the nation over these six years.
$30,000
$25,000
$20,000
$15,000
$10,000
$5,000
$0
2009-10 2010-11 2011-12 2012-13 2013-14 2014-15 2015-16
Note: Simple unweighted average loan amount of those bachelor recipients from WICHE public and private nonprofit institutions who borrowed and graduated with loans
between academic years 2009-10 and 2015-16. These data are not available for the Commonwealth of the Northern Mariana Islands and Guam. Average debt is in current dollars.
Source: The Institute for College Access and Success, The Project on Student Debt.
WICHE
$23,810
$28,446
U.S.
AverageLoansTotal(CurrentDollars)
$19,056
$23,105