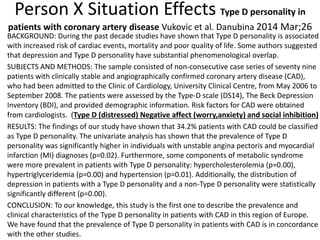
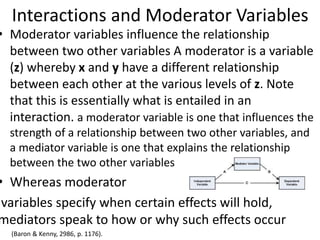
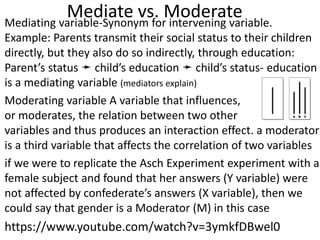
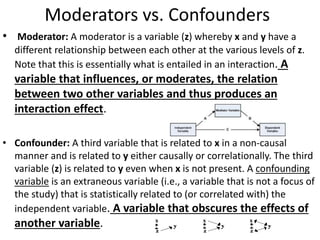
Downloaded 199 times


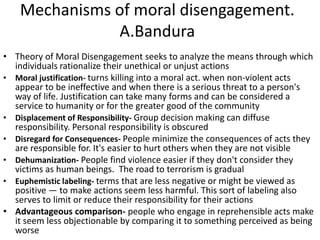
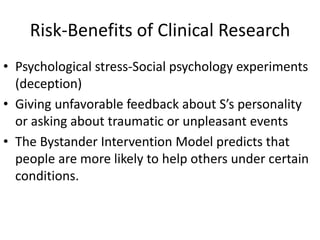
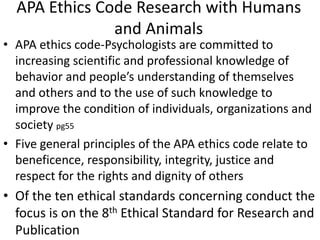
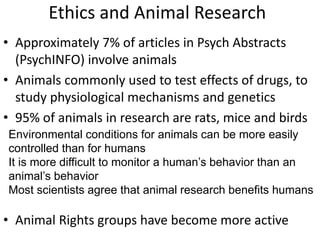
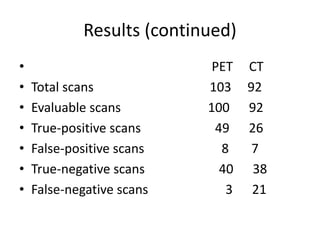
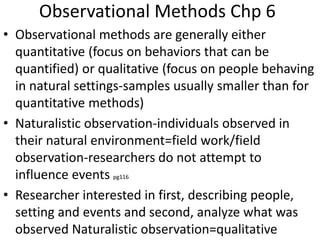
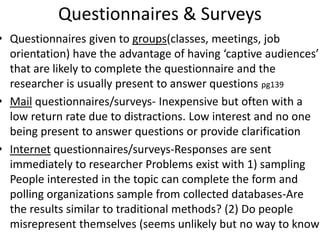
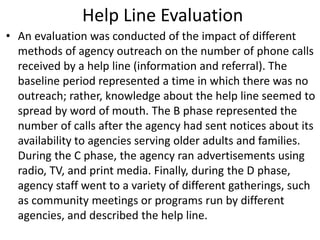
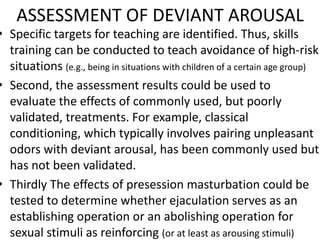
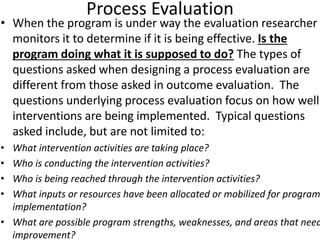
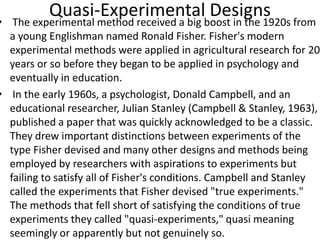
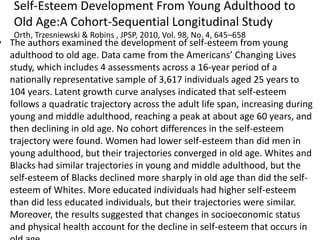
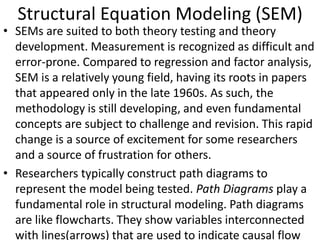
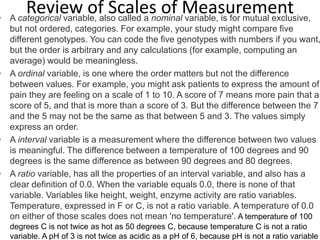
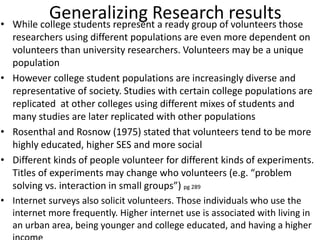
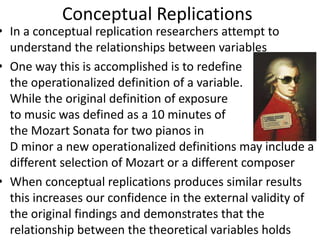
![The relevance of Milgram
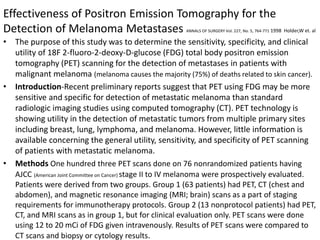
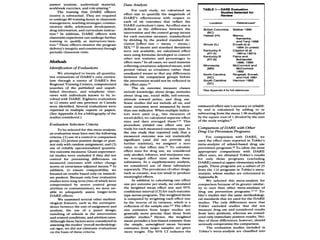
• Milgram sparked direct critical response in the
scientific community by claiming that "a
common psychological process is centrally
involved in both [his laboratory experiments
and Nazi Germany] events
• There are psychological processes which can
disengage morality from conduct](https://image.slidesharecdn.com/behavioralresearch2-150223165842-conversion-gate02/85/Behavioral-research-2-56-320.jpg)
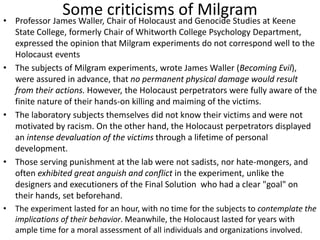


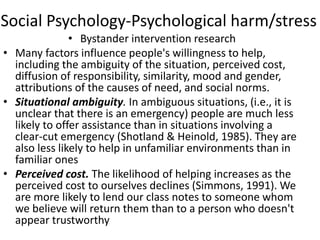

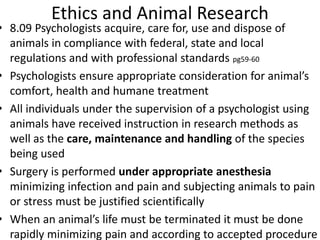


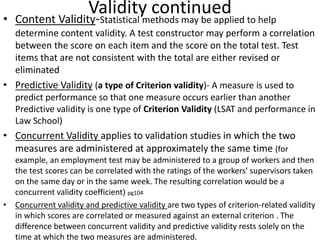


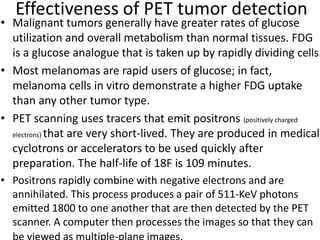

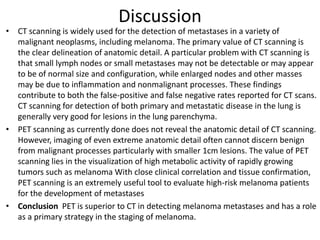


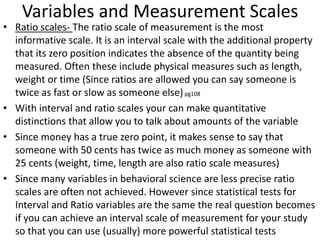
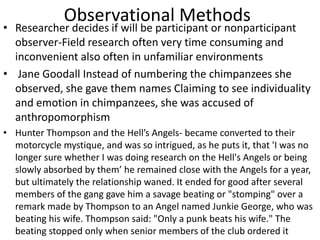
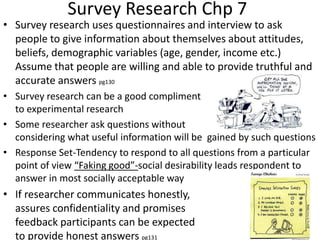
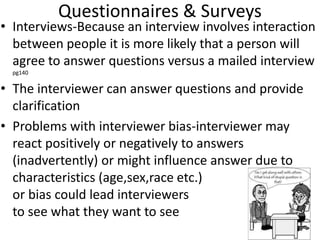
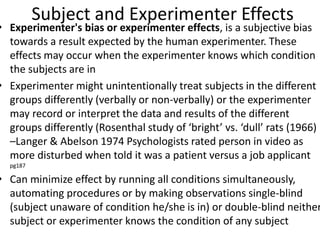
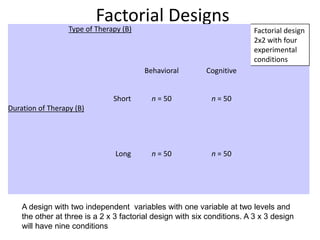
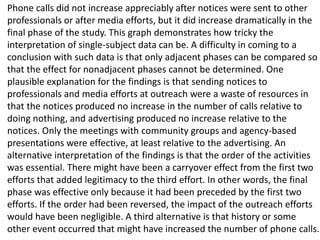
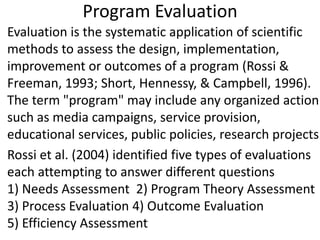
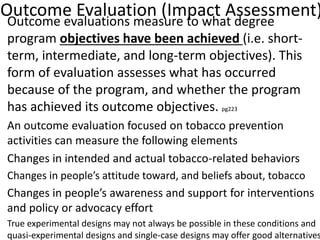
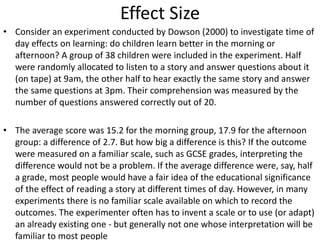
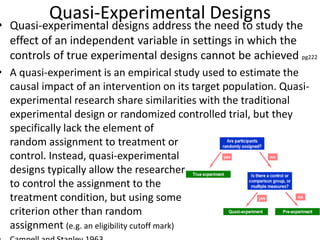
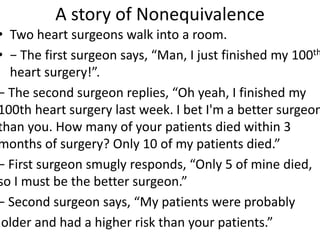
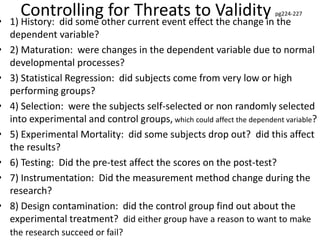
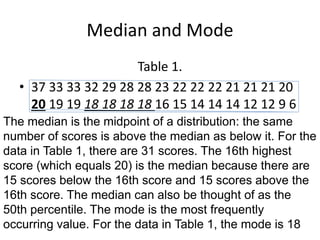
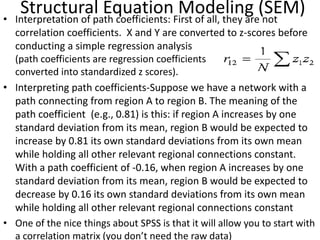
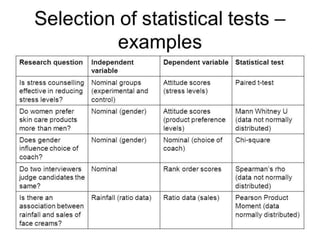
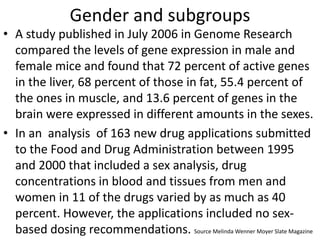
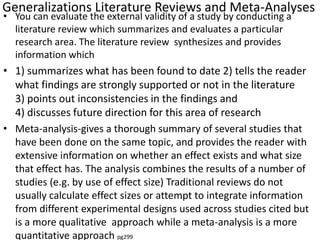
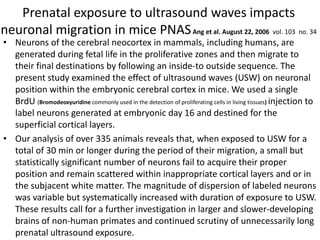
![Cramped Synchronized General Movements in Preterm
Infants as an Early Marker for Cerebral Palsy Ferrari,F Arch Pediatr
Adolesc Med. 2002
• Objective To ascertain whether specific abnormalities (ie,
cramped synchronized general movements [GMs]) can
predict cerebral palsy and the severity of later motor
impairment in preterm infants affected by brain lesions.
• Design Traditional neurological examination was
performed, and GMs were serially videotaped and blindly
observed for 84 preterm infants with ultrasound
abnormalities from birth until 56 to 60 weeks'
postmenstrual age. The developmental course of GM
abnormalities was compared with brain ultrasound findings
alone and with findings from neurological examination, in
relation to the patient's outcome at age 2 to 3 years.](https://image.slidesharecdn.com/behavioralresearch2-150223165842-conversion-gate02/85/Behavioral-research-2-150-320.jpg)
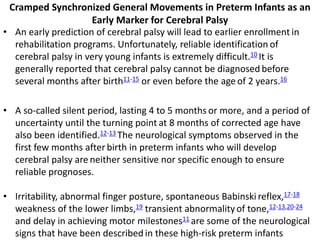
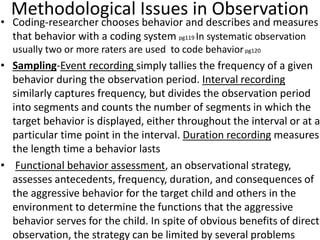

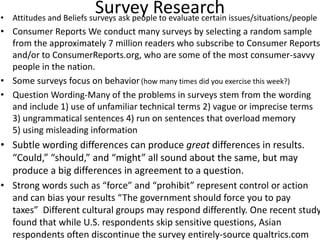


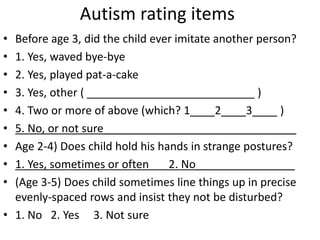


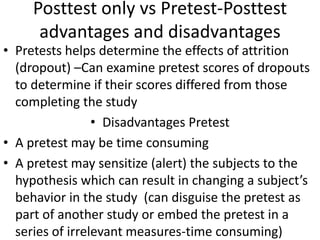
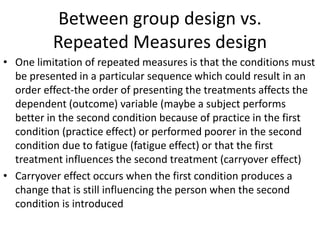

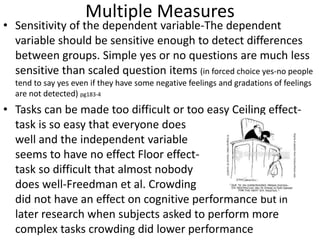


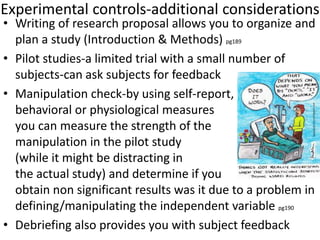

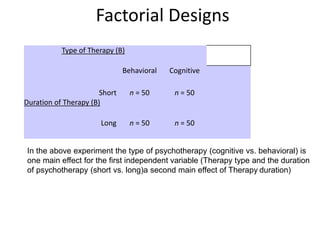
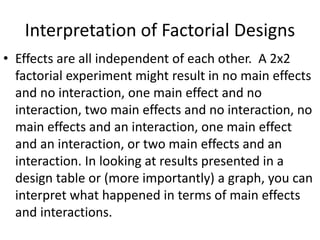


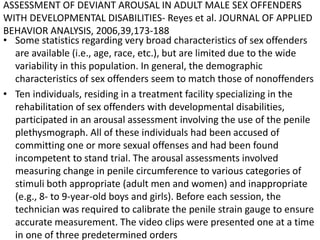


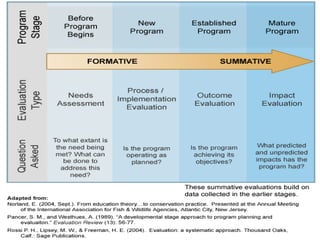


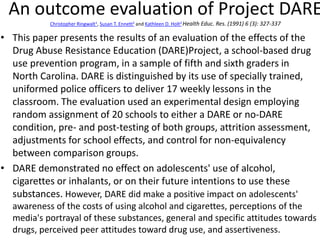
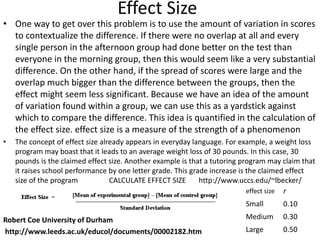
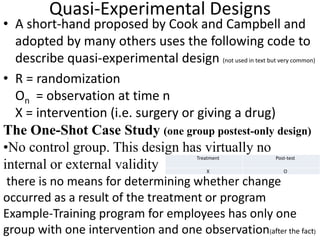


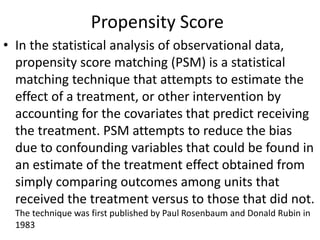


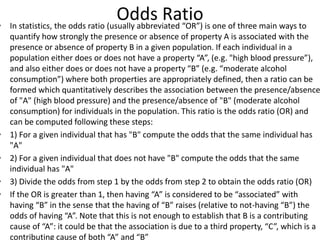


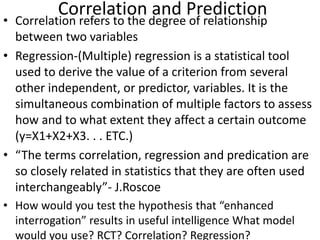


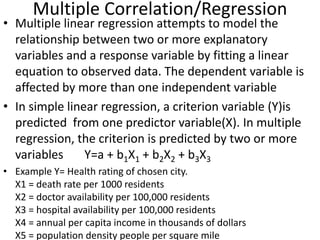
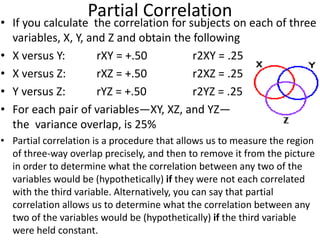
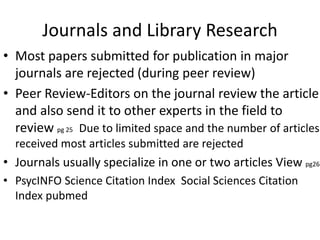
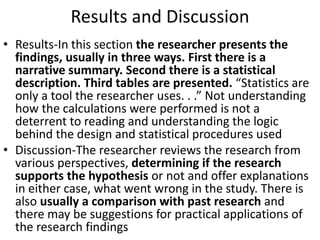
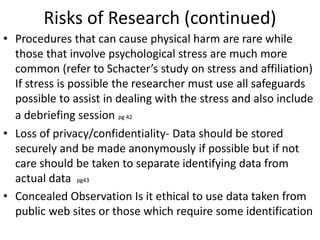
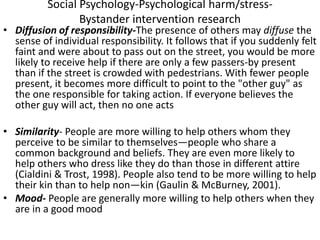
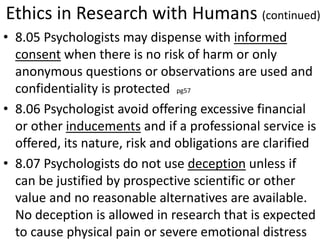
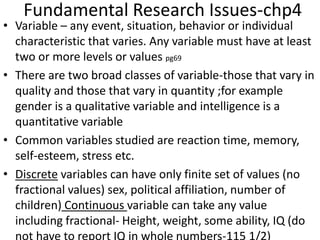
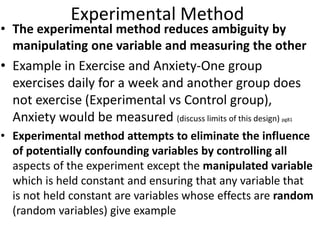
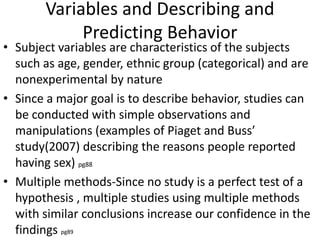
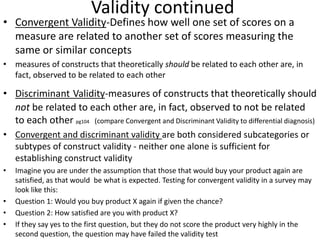
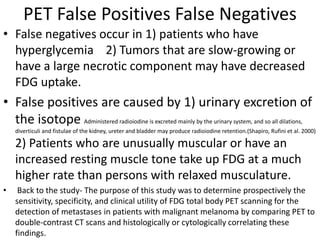
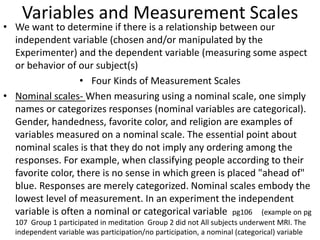
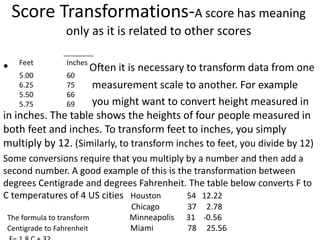
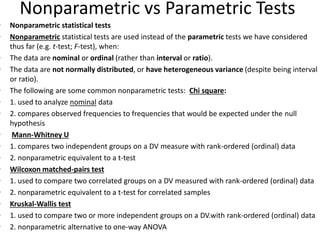
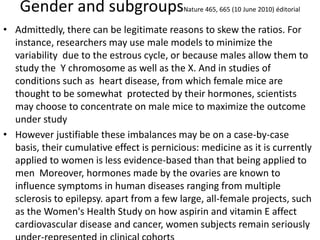
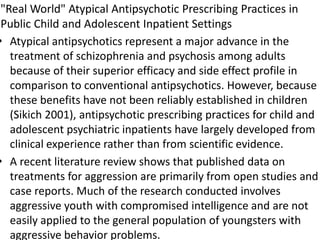
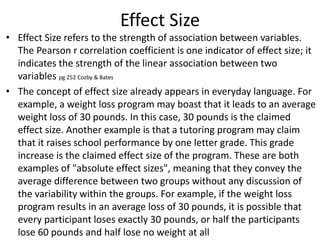
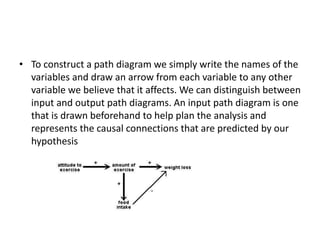
![Partial Correlation
•
or
• rXY·Z =_____rXY—(rXZ)(rYZ)_______
sqrt[1—r2XZ] x sqrt[1—r2YZ]
• rXY·Z =___ .50—(.50)(.50)___
sqrt[1—.25] x sqrt[1—.25]
• rXY·Z =+.33 (therefore r2XY·Z = .11)](https://image.slidesharecdn.com/behavioralresearch2-150223165842-conversion-gate02/85/Behavioral-research-2-344-320.jpg)


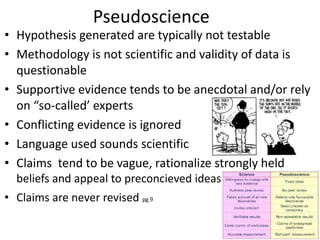
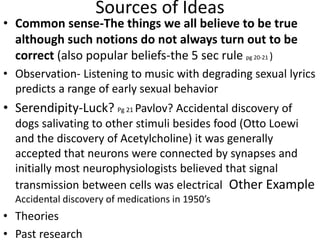
The scientific method involves forming hypotheses and designing experiments to test them. Researchers propose tentative explanations and make predictions to empirically test their hypotheses. Galileo was influential in astronomy by observing Jupiter's moons, which did not conform to the geocentric model and faced opposition. Vesalius advanced anatomy by directly studying human cadavers, challenging Galen's teachings based on animal dissections. Semmelweis found physicians had higher childbed fever rates than midwives and reduced mortality to their level by instituting mandatory handwashing with chloride after autopsies. Challenging existing views can meet resistance but simpler explanations may eventually prove correct through further testing.


