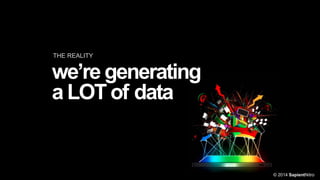
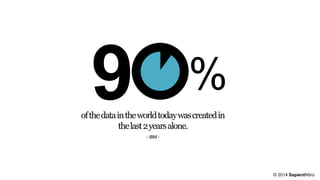
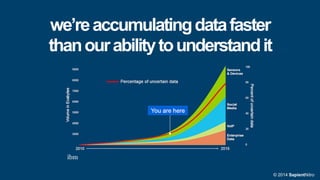
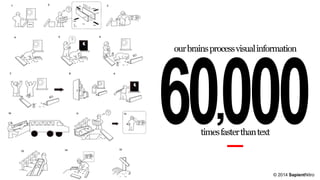
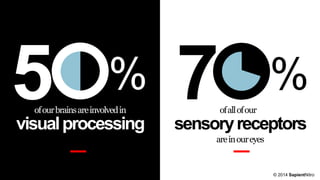
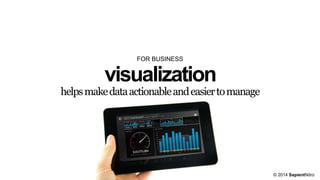
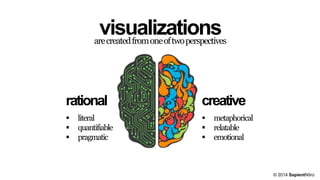
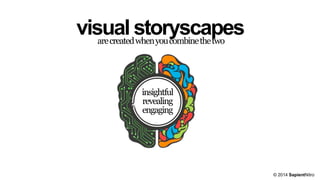
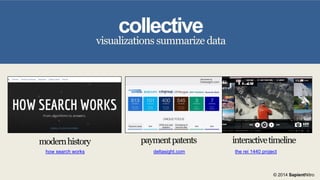
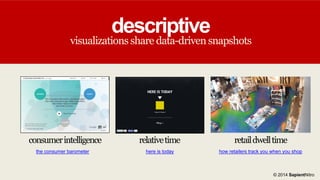
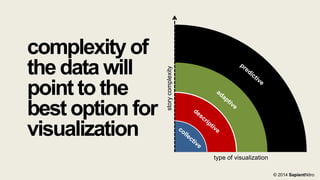
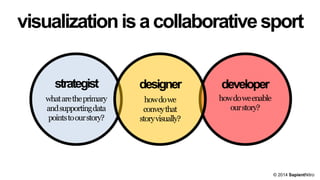
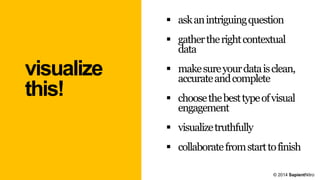
takingbigdata
visually
March 4, 2014

2014 Analytics with Purpose
Behavioral Insight to Advantage
San Diego, California

Charles Sayers
Experience Innovation
SapientNitro
csayers@sapient.com
 challenges in data volume
and velocity

what we’ll look at

 how we’re wired for sight
 creating visual stories

© 2014 SapientNitro
THE REALITY

we’re generating
a LOT of data

© 2014 SapientNitro
%
of the data in the world today was created in
the last 2 years alone.
- IBM -

© 2014 SapientNitro
This is the volume of photos
uploaded to Flikr in a single day

© 2014 SapientNitro
THE PROBLEM

we’re generating
too much, too fast

© 2014 SapientNitro
we’re accumulating data faster
than our ability to understand it

ibm
© 2014 SapientNitro
a new
wave of
data is on
the horizon
innovations in wearables
and biometrics will drive a
surge in physiological data
© 2014 SapientNitro
190,000
people with deep analytic sills as well as

1.5 million
managers and analysts will be needed by
2018 to fill jobs in Big Data

© 2014 SapientNitro
THE OTHER PROBLEM

we don’t think in
numbers

© 2014 SapientNitro
an egg
This is your brain,

a pan
this is your brain,

a shift
this is your brain on drugs,

Any questions?

this famous public service campaign signaled a shift in data story telling
from numbers and statistics to emotional metaphor

© 2014 SapientNitro
our brains process visual information

,

times faster than text

© 2014 SapientNitro
%

%

of our brains are involved in

of all of our

visual processing

sensory receptors
are in our eyes

© 2014 SapientNitro
THE SOLUTION

visualization

© 2014 SapientNitro
FOR PEOPLE

visualization

helps make data clearer and more engaging

© 2014 SapientNitro
FOR BUSINESS

visualization

helps make data actionable and easier to manage

© 2014 SapientNitro
visualization
is about asking

an intriguing question
© 2014 SapientNitro
visualization
is answered with

contextual data
© 2014 SapientNitro
visualization
is expressed in

an engaging way
© 2014 SapientNitro
visualizations
are created from one of two perspectives
rational




literal
quantifiable
pragmatic

creative




metaphorical
relatable
emotional

© 2014 SapientNitro
visual storyscapes
are created when you combine the two
insightful
revealing
engaging

© 2014 SapientNitro
“Stories are just
data with a soul”
Dr. BreneBrown
Research Storyteller
University of Houston

© 2014 SapientNitro
what’s an intriguing
question?

© 2014 SapientNitro
BAD QUESTION

do these
jeans make
me look fat?
© 2014 SapientNitro
TRICK QUESTION

do you know
why I stopped
you?
© 2014 SapientNitro
INTRIGUING QUESTION

how is the
moon like an
Oreo cookie?
© 2014 SapientNitro
where do you find
contextual data?

© 2014 SapientNitro
what you’re
doing

who you are

what you’ve
done

who you
do it with

retail
© 2014 SapientNitro
what ‘s your
lifestyle?

why are
you here?

how much do
you need?

how much
you deposit

how much
you withdraw

banking
© 2014 SapientNitro
what
changed?

what was?

why did it
change?

what did the
change
change?

change
© 2014 SapientNitro
how can data
stories engage?

© 2014 SapientNitro
four types of

visual
engagement

1. collective
2. descriptive
3. adaptive
4. predictive

© 2014 SapientNitro
collective

visualizations summarize data

modern history

payment patents

how search works

deltasight.com

interactive timeline
the rei 1440 project

© 2014 SapientNitro
descriptive

visualizations share data-driven snapshots

consumer intelligence
the consumer barometer

relative time

retail dwell time

here is today

how retailers track you when you shop

© 2014 SapientNitro
adaptive

visualizations adapt to real time data feeds

social mapping

fitness monitoring

spatial awareness

google maps

tictrac

british airways

© 2014 SapientNitro
predictive

visualizations offer the ability to
future-cast and explore conditional scenarios

career advisor

life coach

the existential calculator

Reporter app for iPhone

financial manager
MoneyWiz personal finance

© 2014 SapientNitro
story complexity

complexity of
the data will
point to the
best option for
visualization

type of visualization
© 2014 SapientNitro
following a single
strand of hair
A VISUAL STORYSCAPE

© 2014 SapientNitro
In a world full of mobile savvy shoppers and
aisles bursting with hair care products,

how can one box of
hair color rule them all?
© 2014 SapientNitro
data considerations
84% of guests use their smartphone while in a
store…but what are they actually doing?
Is ‘showrooming’ something to worry about?
© 2014 SapientNitro
 Smartphone use and
behavior tracking
 Location-based, interactive
phone questionnaire

data dive
deploy device activity loggers onto the smartphones of
a community of Shoppers to obtain detailed data on
use both in-store and out of store
© 2014 SapientNitro
learning
environment
 passive infrared sensors and
sound collectors
 heat sensors collect data on
paths, dwell times, entry and
exit points, fixture interactions
 sound data is collected as a
means to understand human
interactions
smartphone





Unobtrusive widget runs in OS background
Logs what people do on their phones 24/7
Data pushed to data warehouse for analysis

questionnaire



Helps us understand context and drivers of a
trip; ultimately match trip types of to phone
behavior and use
contextual continuity
© 2014 SapientNitro
snackable moments

© 2014 SapientNitro
THE CAVEAT

believing what we
see isn’t always a
good thing

© 2014 SapientNitro
this visualization overemphasizes the impact of non-communicable diseases

This graphic lumps together pneumonia deaths at
age 1 with car accidents at age 20, and cancer deaths
at 50 with heart disease deaths at 80.

http://www.informationisbeautiful.net/visualizations/20th-century-death/

© 2014 SapientNitro
visualization is a collaborative sport
strategist

designer

developer

what are the primary
and supporting data
points to our story?

how do we
convey that
story visually?

how do we enable
our story?

© 2014 SapientNitro
 ask an intriguing question
 gather the right contextual
data

visualize
this!

 make sure your data is clean,
accurate and complete
 choose the best type of visual
engagement
 visualize truthfully
 collaborate from start to finish
© 2014 SapientNitro
a parting visualization

the life you have in jelly beans
© 2014 SapientNitro
thank you
takingbigdata
visually
March 4, 2014

Charles Sayers
Experience Innovation
SapientNitro
csayers@sapient.com

Taking Big Data Visually