Downloaded 44 times
![ Three different Internet providers. In one On incidents that caused financial losses Country shut down in Nigeria due to a
case, two of them failed to deliver service week’s unrest following the government’s
Packaging integrity is compromised when
few hours one day but the third (the mobile decision to withdraw a fuel subsidy
alternate materials are used without
phone network) worked well authoriza on causing contamina on outside In the last year an organisa on who
On analysing the extended supply chain the typical specifica on provides a front line service became
insolvent and approximate cost to place a
We reach to the original source of the supply The biggest problems we face are late
business con nuity plan in place
chain to minimize contamina on to produce deliveries from machine shops. This is turn
high purity products. When suppliers of has required us to work addi onal over me Warehouse was completely destroyed in a
original source are hired, we have in order to not ship our product late fire with all stock and building completely
excep onal confidence they not destroyed
The recent [Company A] bank failure caused
contamina ng disrup on to our accounts department. It Riots impact on retail higher than on supply
We only look at our immediate supplier took them a week to check that all chain
A prolonged power failure because of the payments had gone through. No financial Cost to run generator during power outage
destruc on of the main power sta on, in loss, just disrup on. Clients were
Due to a delay in product delivery we had to
Cyprus understanding
postpone some surgeries with loss of income
3PL Omani workers on strike Principle supplier of control brand product
or delayed income
insolvency. We incurred significant costs to
The source of disrup on was not at our
transfer produc on and expedite orders UK Government changed import laws
supplier but it was a na onal event in two
from an alterna ve vendor in me for a me IT hardware delivery delays as a result of
different countries ‐ Nigeria and Kenya
sensi ve marke ng release Thai floods
While we don't rou nely analyse the full
IT issues and the supply of replacement A major failure that impacted our customers
supply chain I was able to review 3 of the
drives due to issue in the Far East drew management a en on to the issue. It
disrup ons I was made aware of and found
took a $4million (US) loss to get any
one to be an immediate supplier failure and The withdrawing of a call divert service by
[Company B], so our office numbers couldn't a en on
2 to be er 2
be directly diverted to the new offices
Supply Chain Resilience 2012. Copyright © 2012 The Business Con nuity Ins tute. All Rights Reserved. 28](https://image.slidesharecdn.com/supplychainresilience2012-121108152619-phpapp01/85/BCI-Supply-Chain-Resilience-2012-28-320.jpg)
![Working with key supply chain partners— suppliers who have a BCP for key contracts for BCM requirements for the Dutch
what if they can’t or won’t meet your BC financial sector and its providers"
A er iden fying vulnerabili es, we
needs?
implement mi ga on programs, generally We also review SAS 70 or similar reports
We would not take on a supplier unless we around mul ‐sourcing where necessary
were happy that they had measures in place Un l we can develop a more cost effec ve We now write the requirement for BCM into
to provide con nuity of service to our
solu on we are using inventory to decouple all our contracts, and judge this as part of
customers our supply capability from our supplier our selec on criteria
Increased inventory coverage for key Changing supplier is not always possible
How do you collect this informa on?
components where government departments are In person follow‐up as necessary and we will
A mixture of the above [strategies provided involved
offer our assistance to aid the development
as answer op ons] depending on the What BC informa on do you seek? of their plan
supplier / product and the market
We rou nely check the financial stability of We personally visit each key supplier each
Ensure that supplier takes steps to mi gate poten al suppliers, number of employees, year and if they have presented any
the situa on with their infrastructure
years in business, credit availability significant problems then have moved to au‐
problems dit them
BCM is not yet popular in [Country]! Being a
In most cases we also have in‐house fall back government agency, we have to deal with We don't collect subject informa on since
procedures
the rigors of a minimum of a 3 cost canvass most of the agencies and businesses in the
In truth it could be any of the above
from different suppliers before ordering Philippines don't have BCMP yet
depending on circumstances, but our from the lowest bidder, add to that the
Contractual requirement
favoured approach is to work with a supplier policy that government agencies should first
to agree a plan to be er align their approach procure supplies from the [Government We have internal procedure for outsourcing.
with our requirements Department] and you'll be le with no BCM is a major requirement on RFP (Request
We do not ask to see their BCP but rather we choice but to make do with what the for Proposals)
government mandates. Not currently done for all ers; Only
ask that they state whether they have a BCP
and will only award the contract to those We advise them to align to the "Principles enforced for third party supply chain
Supply Chain Resilience 2012. Copyright © 2012 The Business Con nuity Ins tute. All Rights Reserved. 29](https://image.slidesharecdn.com/supplychainresilience2012-121108152619-phpapp01/85/BCI-Supply-Chain-Resilience-2012-29-320.jpg)
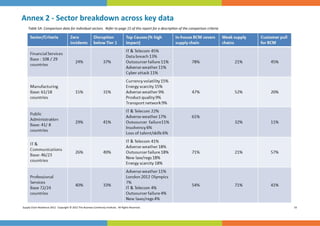


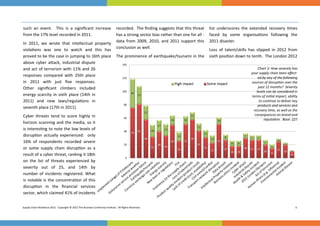
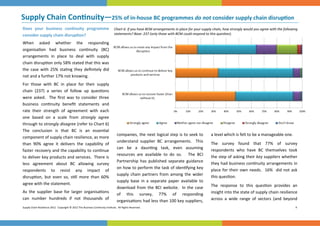
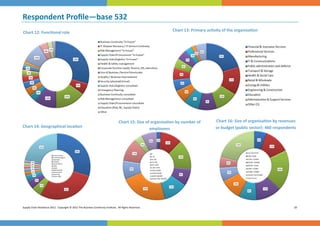
- 73% of respondents experienced at least one disruptive supply chain incident in the past 12 months, with an average of five incidents. - 39% of analyzed disruptions originated below the immediate tier one supplier, underscoring the deep-rooted nature of disruptions. - Unplanned IT or telecom outages jumped to the top cause of disruptions, affecting 52% of organizations to some or a high degree. Adverse weather also remained a prominent cause. - Failure of service provision by outsourcing suppliers doubled from 2011 and joins the top three causes of disruptions.


