Downloaded 19 times
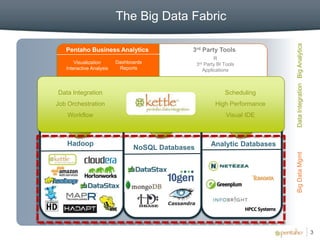
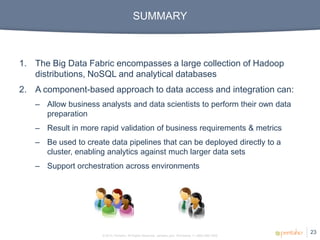

1. The document discusses Pentaho's approach to big data analytics using a component-based data integration and visualization platform. 2. The platform allows business analysts and data scientists to prepare and analyze big data without advanced technical skills. 3. It provides a visual interface for building reusable data pipelines that can be run locally or deployed to Hadoop for analytics on large datasets.


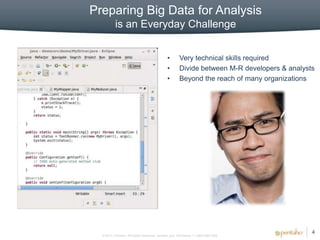
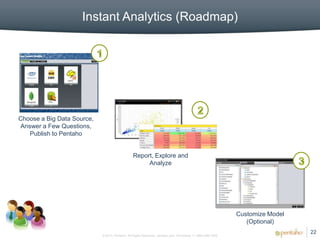
![Competitive edgewithmongod bandpentaho_2014sep_v3[1]](https://cdn.slidesharecdn.com/ss_thumbnails/competitiveedgewithmongodbandpentaho2014sepv31-141022155232-conversion-gate02-thumbnail.jpg?width=640&height=640&fit=bounds)


