SlideShare a Scribd company logo
About Bank of Kigali Limited
Established in 1966, Bank of Kigali is the largest bank in Rwanda by Total Assets, with 31.8% market share as of 30 September 2015. The Bank has a distribution network comprising 74
branches, 81 ATMs, 1,006 agent outlets and serves over 339,000 individuals and 29,000 legal entities. The Bank has a wide distribution network that includes self-service channels such as
deposit-taking ATMs and Point of Sale terminals as well as channels that are geared towards promoting financial inclusion such as mobile vans.
The Bank has a short term credit rating of A1+ and a long term rating of AA-, with a stable outlook, from Global Credit Rating (GCR). In 2011, the Bank became the second domestic
company to be listed on the Rwandan Stock Exchange. The Bank was awarded the 2015 African Banker Award for Best Bank in East Africa as well as the 2015 Euromoney Award for
Excellence as the Best Bank in Rwanda. Since 2009, the Bank has been recognised for six years running as the Best Bank in Rwanda by Emeafinance and for five years as Bank of the Year by
The Banker.
For further information, please visit www.bk.rw or contact:
James Gatera Shivon Byamukama Diane Mukunde
Chief Executive Officer Head of Corporate Affairs Investor Relations Officer
Tel: +250 252 593 100 / 200 Tel: +250 252 593 100 /200 Tel: +250 252 593 100 / 200
Email: jgatera@bk.rw Email: sbyamukama@bk.rw Email: dmukunde@bk.rw
Kigali, 19 November 2015
Bank of Kigali Announces Reviewed, IFRS-Based Q3 2015 & 9M 2015 Results
Bank of Kigali (the “Bank”) announced today its reviewed financial results, reporting Net Income of FRw 16.0 billion (US$ 22.4 million) an
increase of 13.7% y-o-y, with ROAA and ROAE reaching 4.2% and 23.2%, respectively for the 9M period ended 30 September 2015.
 Total Assets decreased by 2.7% q-o-q and grew by 8.3% y-o-y to FRw 525.1 billion (US$ 735.9 million) as at 30 September 2015
 Net Loans and Advances increased by 5.0% q-o-q and 32.2% y-o-y to FRw 295.0 billion (US$ 413.4 million) as at 30 September 2015
 Client Balances & Deposits decreased by 6.7% q-o-q and increased by 9.2% y-o-y to FRw 358.3 billion (US$ 502.2 million) as at 30
September 2015
 Shareholders’ Equity increased by 5.9% q-o-q and 11.1% y-o-y to FRw 94.7billion (US$ 132.8 million) as at 30 September 2015
*Y-o-Y and Q-o-Q growth calculations are based on Rwandan Franc values. US$ values have been derived from period-end FRw/US$ exchange
rates. Quarterly numbers in this press release are reviewed numbers in accordance with Instruction Number 12/2000 of 14 September 2000
issued by the National Bank of Rwanda. Full year numbers are IFRS audited results.
FRw (bn) US$ (mln) Y-o-Y
Total Operating Income 47.1 66.0 7.5%
Total Recurring Operating Costs 21.5 30.2 2.8%
Pre-Provision Operating Profit 25.6 35.9 11.7%
Net Income 16.0 22.4 13.7%
FRw (bn) US$ (mln) Q-o-Q Y-o-Y
Total Operating Income 16.4 22.9 4.3% 23.9%
Total Recurring Operating Costs 7.8 10.9 9.3% 20.6%
Pre-Provision Operating Profit 8.6 12.0 0.2% 27.1%
Net Income 5.3 7.4 (3.4%) 23.9%
FRw (bn) US$ (mln) Q-o-Q YTD Y-o-Y
Total Assets 525.1 735.9 (2.7%) 8.8% 8.3%
Net Loans 295.0 413.4 5.0% 26.4% 32.2%
Client Balances & Deposits 358.3 502.2 (6.7%) 10.4% 9.2%
Total Liabilities 430.3 603.1 (4.4%) 9.5% 7.7%
Shareholders' Equity 94.7 132.8 5.9% 5.8% 11.1%
9M 2015 YE 2014 9M 2014 YE 2013
Gross Loans/Total Assets 57.7% 51.1% 48.6% 50.2%
Gross Loans/Total Deposits 80.9% 72.6% 68.0% 71.1%
Basic Book Value per share in FRw 141.0 133.4 127.0 105.9
ROAA, annualised 4.2% 4.0% 4.1% 4.0%
ROAE, annualised 23.2% 22.9% 24.1% 22.2%
Basic EPS, annualised in FRw 32.0 27.3 29.4 22.2
The following exchange rates have been used for the translation of the Bank's financial statements
9M 2015 YE 2014 9M 2014 YE 2013
FRw/US$ Period End Exchange Rates 713.5 686.1 680.4 670.2
9M 2015
Q3 2015
Change
Change
Change
9M 2015
2
Market Share by Total
Assets
Market Share by Net Loans Market Share by Clients
Balances & Deposits
Market Share by Equity
*Market share data are based on the Q3 2015 unaudited quarterly results submitted by commercial banks to the National Bank of
Rwanda
Bank of Kigali Growth vs. Commercial Banks’ Growth, CAGR YE 2010 – 2015
Total Assets grew by 8.8% YTD to FRw 525.1billion
Total Assets Growth 9M 2015 2014 2013 2012
Bank of Kigali 8.8% 14.3% 30.9% 12.1%
Banking Sector 15.0% 20.8% 21.0% 15.1%
Net Loans grew by 26.4% YTD to FRw 295.0 billion
Net Loan Book Growth 9M 2015 2014 2013 2012
Bank of Kigali 26.4% 17.3% 7.5% 50.3%
Banking Sector 20.1% 21.6% 12.4% 29.8%
Client Balances and Deposits increased by 10.4% YTD to FRw 358.3 billion
Client Balances & Deposits Growth 9M 2015 2014 2013 2012
Bank of Kigali 10.4% 15.7% 32.4% 15.1%
Banking Sector 12.7% 20.4% 20.6% 14.5%
Shareholders’ Equity decreased by 5.8% YTD to FRw 94.7 billion
Shareholders’ Equity Growth 9M 2015 2014 2013 2012
Bank of Kigali 5.8% 26.5% 12.2% 1.9%
Banking Sector 16.8% 5.0% 18.1% 19.2%
17.8%
23.0%
17.6%
19.6%
21.5%
23.8%
21.4%
24.0%
0.0%
5.0%
10.0%
15.0%
20.0%
25.0%
30.0%
Total Assets Net Loans Client Deposits Shareholders' Equity
Commercial Banks Bank of Kigali
3
Q3 2015 Financial Highlights
Net Interest Income increased by 9.7% q-o-q to FRw 12.0 billion. Net Non-Interest Income amounted to FRw 4.4 billion,
a decrease of 7.9% q-o-q mostly impacted by lower FX related margins. Net Fees and Commission Income rose by 5.5%
q-o-q to FRw 2.9 billion. Total Operating Income reached FRw 16.4 billion an increase of 4.3% q-o-q. Total operating
costs increased by 9.3% q-o-q to FRw 7.8 billion mostly relating to an increase in administration and general expenses of
18.7% q-o-q as result of increasing distribution channels. The Bank reported Net Income of FRw 5.3 billion for the
quarter.
As at 30 September 2015 the Bank’s Total Assets stood at FRw 525.1 billion, up 8.3% y-o-y. Gross Loans increased by
3.9% q-o-q and 28.6% y-o-y to FRw 303.1 billion; while Net Loans increased by 5.0% q-o-q and 32.2% y-o-y to FRw 295.0
billion. Gross Loans/Total Assets ratio stood at 57.7% as at 30 September 2015, increasing from 48.6% in the same
quarter 2014. Client Balances & Deposits reached FRw 358.3 billion, recording an increase of 9.2% y-o-y. Shareholders’
Equity equaled FRw 94.7 billion, up 5.9% q-o-q and 11.1% y-o-y. Liquid Assets divided by Total Deposits stood at 53.3%
as at 30 September 2015, down from 66.1% in Q3 2014
9M 2015 Financial Highlights
Net Interest Income increased by 16.9% y-o-y to FRw 33.9 billion. Net Non-Interest Income amounted to FRw 13.2 billion,
a decrease of 11.0% y-o-y significantly impacted by the FX related income margins. Net fees and commission income
increased by 3.3% y-o-y to FRw 8.2 billion; with total operating income reaching FRw 47.1 billion, up 7.5% y-o-y. Total
operating costs increased marginally by 2.8% y-o-y to FRw 21.5 billion as the Bank continued to benefit from cost
management and efficiency measures, thus resulting into lower cost to income ratio of 45.7% for the period, compared
with 47.7% same period last year. The Bank reported Net Income of FRw 16.0 billion in 9M 2015, up 13.7% y-o-y. 9M 2015
annualised ROAA stood at 4.2%, whereas annualised ROAE stood at 23.2% compared to 4.1% and 24.1%, respectively, in
9M 2014.
Monthly Revenue Monthly Pre-Provision Profit
Monthly Net Income Monthly Gross Loans & Advances To Clients
Monthly Clients Balances & Deposits Monthly Gross Loans/Clients Balances & Deposits
4
9M 2015 Business Highlights
 As at 30 September 2015, the Bank served 339,750 Retail customers and 29,066 Corporate clients;
 Expanded the Agency Banking Network to 1,006 agents as at 30 September 2015 and processed over 462,000
transactions worth almost FRw 43.4 billion;
 As of 30 September 2015, the Bank had 74 branches, 81 ATMs and 748 POS terminals that accepted most
international cards including VISA & MasterCard;
 As at 30 September 2015, the Bank had 269,334 Mobiserve users, up from 230,636 users as of 31 December 2014;
 Retail clients’ balances and deposits reached FRw 76.9 billion as at 30 September 2015, up 4.8% YTD;
 Corporate clients’ balances and deposits were FRw 192.2 billion as at 30 September 2015, up 3.4% YTD.
Clients Balances & Deposits
Total Loans & Advances
“We are very pleased with our third quarter 2015 performance, our competitive brand equity and continued dedication
to efficiently serve our customers has been worthwhile. Our Net income grew by 13.7% y-o-y and Total Assets by 8.8%
YTD. We managed to grow our Net Loan book to FRw 295.0 billion a 26.4% increase YTD. The figures show that the Bank
has sustainably defended its position as a market leader in Rwanda across all key balance sheet metrics, with market
share over 30%,”commented James Gatera, Chief Executive Officer.
5
Income Statement
For the quarter ended 30September 2015
Total Operating Income Net Income
Growth, Growth,
IFRS based FRw (Bn) US$ (Mln) FRw (Bn) US$ (Mln) FRw (Bn) US$ (Mln) Q-o-Q Y-o-Y
FRw/Euro Exchange Rate, e-o-p 830.4 807.9 868.3
FRw/US$ Exchange Rate, e-o-p 713.5 701.5 683.8
Interest Income 15.5 21.8 14.3 20.4 12.9 18.8 8.5% 20.6%
Interest Expense 3.5 5.0 3.4 4.8 3.5 5.1 4.8% 1.7%
Net Interest Income 12.0 16.8 10.9 15.6 9.4 13.7 9.7% 27.6%
Net Fee & Commission Income 2.9 4.1 2.8 3.9 2.2 3.3 5.5% 23.7%
Net Income From Documentary Operations 0.1 0.2 0.1 0.2 0.1 0.1 7.3% 31.8%
FX related Income 1.2 1.6 1.8 2.6 1.3 1.9 (34.7%) (7.6%)
Other Non-interest Income 0.2 0.2 0.1 0.1 0.2 0.3 170.2% 100.2%
Net Non-Interest Income 4.4 6.1 4.8 6.8 3.8 5.6 (7.9%) 14.9%
Total Operating Income 16.4 22.9 15.7 22.4 13.2 19.3 4.3% 23.9%
Recurring Operating Costs
Personnel Cost 3.0 4.2 3.1 4.4 2.5 3.7 (4.2%) 19.3%
Bonus Pool 0.9 1.2 0.5 0.7 0.9 1.4 72.0% (9.1%)
Administration and General expenses 2.9 4.1 2.5 3.7 2.2 3.1 18.7% 40.9%
Depreciation & Amortisation 1.0 1.4 1.0 1.4 0.9 1.3 (3.3%) 7.7%
Total Recuring Operating Costs 7.8 10.9 7.1 10.2 6.5 9.5 9.3% 20.6%
Pre-Provision Operating Profit 8.6 12.0 8.6 12.2 6.7 9.8 0.2% 27.1%
Net Loan Loss Provisions 2.5 3.5 2.1 2.9 1.8 2.7 21.6% 37.4%
Gains on recovery 0.5 0.8 0.4 0.5 0.4 0.7 54.2% 29.6%
Net Impairement on Loans & advances 2.0 2.7 1.7 2.4 1.4 2.0 14.3% 40.0%
Profit Before Tax 6.6 9.3 6.9 9.8 5.3 7.8 (3.3%) 23.9%
Income Tax Expense 1.3 1.9 1.5 2.0 1.1 1.6 (2.7%) 23.8%
Net Income 5.3 7.4 5.4 7.8 4.2 6.2 (3.4%) 23.9%
Q3 2015 Q2 2015 Q3 2014
6
Income Statement
For the nine months period ending 30 September 2015
Notes:
(1) Growth calculations are based on FRw values
(2) US$ values have been derived from period-end FRw/US$ exchange rates set out on page 1 of this press release
Growth,
IFRS based FRw (Bn) US$ (Mln) FRw (Bn) US$ (Mln) Y-o-Y
FRw/Euro Exchange Rate, e-o-p 830.4 868.3
FRw/US$ Exchange Rate, e-o-p 713.5 683.8
Interest Income 43.9 61.6 38.4 56.2 14.3%
Interest Expense 10.0 14.1 9.4 13.8 6.0%
Net Interest Income 33.9 47.5 29.0 42.4 16.9%
Net Fee & Commission Income 8.2 11.4 7.4 10.8 3.3%
Net Income From Documentary Operations 0.3 0.4 0.5 0.7 (35.6%)
FX Related Income 4.5 6.3 6.2 9.1 (27.8%)
Other Non-interest Income 0.2 0.4 0.7 1.1 (3.2%)
Net Non-Interest Income 13.2 18.5 14.8 21.7 (11.0%)
Total Operating Income 47.1 66.0 43.8 64.1 7.5%
Recurring Operating Costs
Personnel Cost 9.1 12.7 7.0 10.2 30.3%
Bonus Pool 1.9 2.6 3.1 4.6 (40.8%)
Administration and General expenses 7.6 10.7 8.1 11.8 (5.1%)
Depreciation & Amortisation 2.9 4.1 2.7 4.0 6.8%
Total Recuring Operating Costs 21.5 30.1 20.9 30.6 2.8%
Pre-Provision Operating Profit 25.6 35.9 22.9 33.5 11.7%
Net Loan Loss Provisions 6.7 9.3 6.2 9.0 8.0%
Gains on recovery 1.3 1.8 1.1 1.5 23.0%
Net Impairement on Loans & advances 5.4 7.5 5.1 7.5 4.9%
Profit Before Tax 20.2 28.4 17.8 26.0 13.7%
Income Tax Expense 4.2 6.0 3.7 5.4 13.6%
Net Income 16.0 22.4 14.1 20.6 13.7%
9M 2015 9M2014
7
Statement of Financial Position
As at 30 September 2015
Change Change Change
IFRS based Bn Mln Bn Mln Bn Mln Bn Mln Q-o-Q YTD Y-o-Y
FRw US$ FRw US$ FRw US$ FRw US$
Cash 12.7 17.7 11.4 16.2 12.0 17.5 11.0 16.1 11.3% 5.3% 14.8%
Balances With BNR 23.7 33.2 18.6 26.6 31.9 46.6 23.9 34.9 27.2% (25.8%) (0.8%)
Cash Balances With Banks 90.5 126.9 94.0 133.9 103.0 150.1 121.3 177.4 (3.7%) (12.1%) (25.4%)
Treasuries 3.8 5.3 24.7 35.2 15.0 21.9 13.0 19.0 (84.8%) (75.0%) (71.2%)
Other Fixed Income Instruments 69.0 96.8 77.4 110.4 58.6 85.4 59.6 87.2 (10.8%) 17.8% 15.8%
Gross Loans 303.1 424.7 291.5 415.6 246.7 359.6 235.6 344.6 3.9% 22.8% 28.6%
Loan Loss Reserve 8.1 11.3 10.6 15.1 13.3 19.3 12.5 18.3 (23.8%) (39.2%) (35.4%)
Net Loans To Clients 295.0 413.4 281.0 400.5 233.4 340.3 223.1 326.3 5.0% 26.4% 32.2%
Net Investments 0.2 0.3 0.2 0.3 0.2 0.3 0.2 0.3 0.0% (0.1%) 1.3%
Net Property, Plant & Equipment 22.6 31.7 21.2 30.3 20.5 29.9 20.4 29.8 6.4% 10.2% 11.0%
Intangible Assets 0.3 0.5 0.3 0.4 0.2 0.3 0.2 0.3 22.9% 44.4% 57.5%
Net Other Assets 7.3 10.1 10.7 15.2 7.7 11.2 12.2 17.9 (32.1%) (5.3%) (40.4%)
Total Assets 525.1 735.9 539.5 769.0 482.6 703.4 485.0 709.2 (2.7%) 8.8% 8.3%
Interbank Deposits 16.5 23.1 18.6 26.5 15.2 22.2 18.2 26.6 (11.5%) 8.2% (9.5%)
Client Balances & Deposits 358.3 502.2 383.9 547.2 324.6 473.1 328.1 479.9 (6.7%) 10.4% 9.2%
Borrowed Funds 44.2 62.0 37.5 53.5 39.9 58.2 41.3 60.3 17.9% 10.8% 7.2%
Dividends payable 0.0 0.0 0.0 0.1 0.0 0.0 0.0 0.0 (40.3%) 440.2% 439.5%
Other Liabilities 11.4 15.8 10.0 14.2 13.3 19.4 12.1 17.7 12.7% (15.6%) (7.2%)
Total Liabilities 430.4 603.1 450.0 641.5 393.1 572.9 399.7 584.5 (4.4%) 9.5% 7.7%
Ordinary Shares 6.7 9.4 6.7 9.6 6.7 9.8 6.7 9.8 0.0% 0.1% 0.2%
Reserves 65.8 92.3 65.7 93.6 58.0 84.5 57.8 84.6 0.2% 13.5% 13.8%
Revaluation Reserve 6.2 8.7 6.3 9.0 6.5 9.5 6.6 9.7 (1.6%) (4.7%) (6.2%)
Retained Earnings 16.0 22.4 10.8 15.3 18.3 26.7 14.1 20.6 48.8% (12.6%) 13.7%
Shareholder's Equity 94.7 132.8 89.5 127.5 89.5 130.5 85.3 124.7 5.9% 5.8% 11.1%
Total liabilities & Shareholders' Equity 525.1 735.9 539.5 769.0 482.6 703.4 485.0 709.2 (2.7%) 8.8% 8.3%
Q3 2015 Q2 2015 Q4 2014 Q3 2014
Total Assets Net Loans and Advances
Client Balances & Deposits Shareholders’ Equity
8
Key Performance Ratios
Quarterly ratios are annualised, where applicable
Q3 2015 Q2 2015 Q3 2014 9M 2015 9M 2014 YE 2014 YE 2013 YE 2012 YE 2011 YE 2010
Profitability
Return on Average Assets, % 4.2% 4.3% 3.7% 4.2% 4.1% 4.0% 4.0% 3.9% 3.6% 3.5%
Return on Average Equity, % 22.8% 24.3% 21.7% 23.2% 24.1% 22.9% 22.2% 18.9% 18.6% 24.5%
Net Interest Margin , % 10.8% 9.6% 9.4% 10.2% 9.6% 9.9% 11.1% 9.6% 8.4% 8.3%
Loan Yield, % 20.8% 19.3% 20.6% 19.4% 20.7% 20.5% 20.5% 17.0% 16.9% 15.8%
Interest Expense/Interest Income,% 22.8% 23.6% 27.1% 22.8% 24.5% 24.4% 22.2% 26.0% 26.8% 25.6%
Cost of Funds, % 3.4% 3.2% 3.7% 3.2% 3.3% 3.4% 3.3% 3.4% 3.1% 2.8%
Efficiency
Cost/Income Ratio 47.7% 45.5% 49.0% 45.7% 47.7% 47.9% 48.4% 52.8% 48.4% 47.5%
Costs/Average Assets, % 6.2% 5.6% 5.7% 5.7% 6.2% 6.2% 7.0% 6.6% 5.9% 5.8%
Personnel Costs/Total Recurring Operating Costs 49.3% 50.7% 53.3% 50.8% 48.3% 51.8% 45.0% 47.4% 51.8% 52.3%
Personnel Costs/Average Total Assets, Annualised 3.1% 2.8% 3.0% 2.9% 2.2% 3.2% 3.1% 3.1% 2.9% 3.0%
Personnel Costs/Total Operating Income 23.5% 23.0% 26.1% 23.2% 23.0% 24.8% 21.8% 25.0% 25.1% 25.0%
Net Income/Total Operating Income 32.1% 34.7% 32.1% 34.0% 32.1% 31.5% 27.6% 30.7% 29.5% 29.2%
Total Operating Income/Average Assets % 13.0% 12.3% 11.6% 12.5% 9.7% 12.9% 14.4% 12.6% 12.1% 12.1%
Liquidity
Net Loans/Total Assets,% 56.2% 52.1% 46.0% 56.2% 46.0% 48.4% 47.1% 57.3% 42.8% 51.3%
Liquid Assets / Total Assets 38.0% 41.9% 47.2% 38.0% 47.2% 45.7% 46.0% 31.9% 45.1% 37.0%
Liquid Assets / Total Deposits 53.3% 56.2% 66.1% 53.3% 66.1% 64.9% 65.2% 44.7% 64.9% 47.3%
Liquid Assets / Total Liabilities 46.4% 50.2% 57.3% 46.4% 57.3% 56.1% 55.2% 39.6% 57.4% 44.1%
Total Deposits / Total Assets 71.4% 74.6% 71.4% 71.4% 71.4% 70.4% 70.5% 71.3% 69.5% 78.2%
Total Deposits / Total Liabilities 87.1% 89.4% 86.6% 87.1% 86.6% 86.5% 84.7% 88.7% 88.4% 93.2%
Interbank Borrowings / Total Deposits 4.4% 4.6% 5.3% 4.4% 5.3% 4.5% 5.8% 8.0% 9.5% 12.2%
Gross Loans/Total Assets 57.7% 54.0% 48.6% 57.7% 48.6% 51.1% 50.2% 60.1% 45.4% 53.4%
Gross Loans / Total Deposits 80.9% 72.4% 68.0% 80.9% 68.0% 72.6% 71.1% 84.2% 65.3% 68.3%
Interest Earning Assets/Total Assets 88.8% 90.4% 88.6% 88.8% 88.6% 87.7% 88.4% 80.5% 82.0% 81.6%
Leverage (Total Liabilities/Equity), Times 4.5 5.0 4.7 4.5 4.7 4.4 5.0 4.1 3.7 5.2
Asset Quality
NPLs /Total Loans, % 5.4% 5.8% 6.7% 5.4% 6.7% 6.6% 6.9% 6.5% 8.3% 8.5%
NPL Coverage Ratio 40.4% 62.3% 78.6% 40.4% 78.6% 81.8% 87.4% 70.3% 69.1% 45.8%
Loan Loss reserve / Gross Loans ,% 2.7% 3.6% 5.3% 2.7% 5.3% 5.4% 6.1% 4.6% 5.8% 3.9%
Average Loan Loss reserve / Average Gross Loans ,% 3.9% 4.4% 5.7% 3.9% 5.7% 5.7% 5.4% 5.1% 4.9% 4.3%
Large Exposures / Gross Loans 22.9% 18.5% 16.3% 22.9% 16.3% 18.0% 5.4% 6.5% 8.8% 14.3%
Cost of Risk, Annualised 2.8% 2.5% 2.5% 2.6% 3.0% 3.3% 4.4% 2.2% 3.8% 2.0%
Capital Adequacy
Core Capital / Risk Weighted Assets 22.4% 21.9% 25.7% 22.4% 25.7% 25.8% 23.1% 22.4% 28.1% 18.7%
Total Qualifying Capital / Risk Weighted Assets 22.8% 22.4% 26.3% 22.8% 26.3% 26.3% 23.7% 23.2% 29.1% 20.1%
Off Balance Sheet Items / Total Qualifying Capital 485.5% 481.8% 455.1% 485.5% 455.1% 428.4% 542.5% 524.3% 363.1% 351.2%
Large Exposures / Core Capital 86.1% 69.5% 53.9% 86.1% 53.9% 53.5% 17.9% 22.6% 21.3% 61.1%
NPLs less Provisions / Core Capital 14.8% 8.2% 4.8% 14.8% 4.8% 3.5% 2.9% 6.8% 6.2% 19.7%
Market Sensitivity
Forex Exposure / Core Capital (23.7%) (20.9%) (26.8%) (23.7%) (26.8%) (20.4%) (9.1%) (41.2%) 11.7% 11.5%
Forex Loans / Forex Deposits 20.5% 18.7% 4.9% 20.5% 4.9% 8.4% 0.7% 1.0% 0.8% 1.0%
Forex Assets / Forex Liabilities 85.9% 87.7% 87.2% 85.9% 87.2% 87.5% 93.8% 61.0% 105.3% 106.7%
Forex Loans / Gross Loans 6.2% 6.1% 2.2% 6.2% 2.2% 3.3% 0.3% 0.3% 0.3% 0.4%
Forex Deposits/Total Deposits 36.2% 32.9% 42.9% 24.6% 31.4% 39.9% 44.8% 25.3% 23.8% 27.4%
Selected Operating Data
Full Time Employees 1,118 1,116 1,029 1,118 1,029 1,019 980 877 602 454
Assets per FTE (FRw in billion) 0.5 0.5 0.5 0.5 0.5 0.5 0.4 0.4 0.5 0.4
Number of Active Branches 74 73 70 74 70 70 65 59 44 33
Number of Mobibank 9 9 9 9 9 9 5 5 - -
Number of ATMS 81 79 76 81 76 76 65 55 26 26
Number of POS Terminals 748 670 660 748 660 656 568 405 202 97
Number of Retail current accounts 302,483 286,934 254,752 302,483 254,752 266,239 231,409 191,632 124,248 50,073
Number of BK Yacu Agent 1,006 944 829 1,006 829 861 569 30 - -
9
Definitions
1 Return On Average Total Assets (ROAA) equals Net Income of the period divided by average Total Assets for the same period;
2 Return On Average Total Equity (ROAE) equals Net Income of the period divided by average Total Shareholders’ Equity for
the same period;
3 Average Interest Earning Assets are calculated on a quarterly basis; Interest Earning Assets include: Cash & Balances With
Banks, Treasuries and Net Loans To Clients;
4 Net Interest Margin equals Net Interest Income of the period divided by Average Interest Earning Assets for the same period;
5 Loan Yield equals Interest Income of the period on loans & advances divided by average Gross Loans for the same period;
6 Cost Of Funds equals Interest Expense of the period divided by average Total Liabilities for the same period;
7 Total Operating Income includes Net Interest Income and Non-Interest Income;
8 Costs include Total Recurring Operating Costs and Bonuses (Paid and Accrued);
9 Cost/Income equals Total Recurring Operating Costs plus Bonuses (Paid and Accrued) for the period divided by Total
Operating Income;
10 Personnel Costs/Total Recurring Operating Costs equals the sum of Staff Costs and Bonuses (Paid and Accrued) for the period
divided by Total Recurring Operating Costs ;
11 Personnel Costs/Average Total Assets equals the sum of Staff Costs and Bonuses (Paid and Accrued) for the period divided by
average Total Assets ;
12 Client Deposits include Corporate, other Financial institutions and Retail deposits;
13 Liquid Assets include Cash, Cash Balances With the NBR, Cash Balances With Banks, Treasuries and Other Fixed Income
Instruments;
14 Total Deposits include Interbank Deposits and Client Deposits;
15 Shareholders’ Equity equals to Total Shareholders’ Equity;
16 NPLs are loans overdue by more than 90 days
17 NPL Coverage ratio equals Loan Loss Reserve as of the period end divided by NPLs as of the same period;
18 Large exposures include loans that in aggregate comprise 10% of Core Capital;
19 Cost Of Risk equals Net Provision For Loan Losses of the period, plus provisions for (less recovery of) other assets, divided by
average Gross Loans To Clients for the same period;
20 Total Capital Adequacy equals Total Qualifying Capital as of the period end divided by Total Risk Weighted Assets as of the
same date, both calculated in accordance with the requirements of the National Bank of Rwanda.
21 Y-o-Y refers to year on year change on the FRw values
22 Q-o-Q refers to quarter on quarter change on the FRw values
23 YE refer to Year End figures as at 31 December.

More Related Content

What's hot

Dec 2009 results
Dec 2009 results Dec 2009 results
Dec 2009 results wgjlubbe
 
Dec 2008 results
Dec 2008 results Dec 2008 results
Dec 2008 results wgjlubbe
 
Financial Markets Review (April 2015)
Financial Markets Review (April 2015) Financial Markets Review (April 2015)
Financial Markets Review (April 2015)
Snam
 
BancABC Consolidated financial statements for the year ended 31 DECEMBER 2015
BancABC Consolidated financial statements for the year ended 31 DECEMBER 2015BancABC Consolidated financial statements for the year ended 31 DECEMBER 2015
BancABC Consolidated financial statements for the year ended 31 DECEMBER 2015
wgjlubbe
 
Dec 2012 results
Dec 2012 resultsDec 2012 results
Dec 2012 resultswgjlubbe
 
Abch group results booklet dec 2013
Abch group results booklet dec 2013Abch group results booklet dec 2013
Abch group results booklet dec 2013
wgjlubbe
 
Abch group results booklet 2010_final
Abch group results booklet 2010_finalAbch group results booklet 2010_final
Abch group results booklet 2010_finalwgjlubbe
 
jsc-bank-of-georgia-announces-consolidated-q3-and-yeartodate-2007-results-pub...
jsc-bank-of-georgia-announces-consolidated-q3-and-yeartodate-2007-results-pub...jsc-bank-of-georgia-announces-consolidated-q3-and-yeartodate-2007-results-pub...
jsc-bank-of-georgia-announces-consolidated-q3-and-yeartodate-2007-results-pub...Lado Gurgenidze
 
Abc interim report 2010 booklet
Abc interim report 2010 bookletAbc interim report 2010 booklet
Abc interim report 2010 bookletwgjlubbe
 
Abch results presentation june 2013 v6
Abch results presentation june 2013 v6Abch results presentation june 2013 v6
Abch results presentation june 2013 v6wgjlubbe
 
Results booklet 2011
Results booklet 2011Results booklet 2011
Results booklet 2011wgjlubbe
 
June 2012 results
June 2012 results June 2012 results
June 2012 results wgjlubbe
 
June 2008 results
June 2008 results June 2008 results
June 2008 results wgjlubbe
 
IR Presentation 1Q2019
IR Presentation 1Q2019IR Presentation 1Q2019
IR Presentation 1Q2019
ngothithungan1
 
15676 banc abc afs
15676 banc abc afs15676 banc abc afs
15676 banc abc afs
Marius Nel
 
Preliminary Yearly Results 2015 - Banca IFIS Group
Preliminary Yearly Results 2015 - Banca IFIS GroupPreliminary Yearly Results 2015 - Banca IFIS Group
Preliminary Yearly Results 2015 - Banca IFIS Group
Banca Ifis
 
Mr castilla
Mr castillaMr castilla
Mr castilla
inperu
 
Abch annual report dec 2011 final
Abch annual report dec 2011 finalAbch annual report dec 2011 final
Abch annual report dec 2011 finalwgjlubbe
 
Liberty Bank Research Note - Q2 2014 and 1H 2014 Results
Liberty Bank Research Note - Q2 2014 and 1H 2014 ResultsLiberty Bank Research Note - Q2 2014 and 1H 2014 Results
Liberty Bank Research Note - Q2 2014 and 1H 2014 Results
Liberty Securities
 

What's hot (19)

Dec 2009 results
Dec 2009 results Dec 2009 results
Dec 2009 results
 
Dec 2008 results
Dec 2008 results Dec 2008 results
Dec 2008 results
 
Financial Markets Review (April 2015)
Financial Markets Review (April 2015) Financial Markets Review (April 2015)
Financial Markets Review (April 2015)
 
BancABC Consolidated financial statements for the year ended 31 DECEMBER 2015
BancABC Consolidated financial statements for the year ended 31 DECEMBER 2015BancABC Consolidated financial statements for the year ended 31 DECEMBER 2015
BancABC Consolidated financial statements for the year ended 31 DECEMBER 2015
 
Dec 2012 results
Dec 2012 resultsDec 2012 results
Dec 2012 results
 
Abch group results booklet dec 2013
Abch group results booklet dec 2013Abch group results booklet dec 2013
Abch group results booklet dec 2013
 
Abch group results booklet 2010_final
Abch group results booklet 2010_finalAbch group results booklet 2010_final
Abch group results booklet 2010_final
 
jsc-bank-of-georgia-announces-consolidated-q3-and-yeartodate-2007-results-pub...
jsc-bank-of-georgia-announces-consolidated-q3-and-yeartodate-2007-results-pub...jsc-bank-of-georgia-announces-consolidated-q3-and-yeartodate-2007-results-pub...
jsc-bank-of-georgia-announces-consolidated-q3-and-yeartodate-2007-results-pub...
 
Abc interim report 2010 booklet
Abc interim report 2010 bookletAbc interim report 2010 booklet
Abc interim report 2010 booklet
 
Abch results presentation june 2013 v6
Abch results presentation june 2013 v6Abch results presentation june 2013 v6
Abch results presentation june 2013 v6
 
Results booklet 2011
Results booklet 2011Results booklet 2011
Results booklet 2011
 
June 2012 results
June 2012 results June 2012 results
June 2012 results
 
June 2008 results
June 2008 results June 2008 results
June 2008 results
 
IR Presentation 1Q2019
IR Presentation 1Q2019IR Presentation 1Q2019
IR Presentation 1Q2019
 
15676 banc abc afs
15676 banc abc afs15676 banc abc afs
15676 banc abc afs
 
Preliminary Yearly Results 2015 - Banca IFIS Group
Preliminary Yearly Results 2015 - Banca IFIS GroupPreliminary Yearly Results 2015 - Banca IFIS Group
Preliminary Yearly Results 2015 - Banca IFIS Group
 
Mr castilla
Mr castillaMr castilla
Mr castilla
 
Abch annual report dec 2011 final
Abch annual report dec 2011 finalAbch annual report dec 2011 final
Abch annual report dec 2011 final
 
Liberty Bank Research Note - Q2 2014 and 1H 2014 Results
Liberty Bank Research Note - Q2 2014 and 1H 2014 ResultsLiberty Bank Research Note - Q2 2014 and 1H 2014 Results
Liberty Bank Research Note - Q2 2014 and 1H 2014 Results
 

Similar to Bank of Kigali Announces Reviewed Q3 2015 & 9M 2015

GTI Research-UBA9Months 2015 Report
GTI Research-UBA9Months  2015 ReportGTI Research-UBA9Months  2015 Report
GTI Research-UBA9Months 2015 ReportChuks Anyanwu
 
Bank of Baroda Q4FY15: Profits miss estimates
Bank of Baroda Q4FY15: Profits miss estimatesBank of Baroda Q4FY15: Profits miss estimates
Bank of Baroda Q4FY15: Profits miss estimates
IndiaNotes.com
 
Csl maintains buy rating for uba
Csl maintains buy rating for ubaCsl maintains buy rating for uba
Csl maintains buy rating for uba
CSL Stockbroking Ltd.
 
9M FY2014 Results Analyst Briefing as at 31 December 2013 from Alliance Finan...
9M FY2014 Results Analyst Briefing as at 31 December 2013 from Alliance Finan...9M FY2014 Results Analyst Briefing as at 31 December 2013 from Alliance Finan...
9M FY2014 Results Analyst Briefing as at 31 December 2013 from Alliance Finan...
Alliance Bank Malaysia Berhad
 
9M FY2015 Results Analyst Briefing as at 31 December 2014 from Alliance Finan...
9M FY2015 Results Analyst Briefing as at 31 December 2014 from Alliance Finan...9M FY2015 Results Analyst Briefing as at 31 December 2014 from Alliance Finan...
9M FY2015 Results Analyst Briefing as at 31 December 2014 from Alliance Finan...
Alliance Bank Malaysia Berhad
 
Full Year Analyst Briefing as at 31 March 2015
Full Year Analyst Briefing as at 31 March 2015Full Year Analyst Briefing as at 31 March 2015
Full Year Analyst Briefing as at 31 March 2015
Alliance Bank Malaysia Berhad
 
Sterling bank annual report 2015
Sterling bank annual report 2015Sterling bank annual report 2015
Sterling bank annual report 2015
Michael Olafusi
 
BI&P- Indusval- 3Q14 Earnings Release
BI&P- Indusval- 3Q14 Earnings ReleaseBI&P- Indusval- 3Q14 Earnings Release
BI&P- Indusval- 3Q14 Earnings Release
BI&P - Banco Indusval & Partners - Investor Relations
 
Close brothersi ntspresentation2015
Close brothersi ntspresentation2015Close brothersi ntspresentation2015
Close brothersi ntspresentation2015
Company Spotlight
 
Half Year Analyst Briefing as at 30 September 2014
Half Year Analyst Briefing as at 30 September 2014Half Year Analyst Briefing as at 30 September 2014
Half Year Analyst Briefing as at 30 September 2014
Alliance Bank Malaysia Berhad
 
HDFC Bank result update: Q4FY15 PAT up 21% YoY, Motilal Oswal maintains 'Buy'
HDFC Bank result update: Q4FY15 PAT up 21% YoY, Motilal Oswal maintains 'Buy'HDFC Bank result update: Q4FY15 PAT up 21% YoY, Motilal Oswal maintains 'Buy'
HDFC Bank result update: Q4FY15 PAT up 21% YoY, Motilal Oswal maintains 'Buy'
IndiaNotes.com
 
BI&P- Indusval- 1Q14 Earnings Release
BI&P- Indusval- 1Q14 Earnings ReleaseBI&P- Indusval- 1Q14 Earnings Release
BI&P- Indusval- 1Q14 Earnings Release
BI&P - Banco Indusval & Partners - Investor Relations
 
Ccall 1 q12_ing
Ccall 1 q12_ingCcall 1 q12_ing
Ccall 1 q12_ing
ItauRI
 
First Quarter FY2015 Analyst Briefing
First Quarter FY2015 Analyst Briefing First Quarter FY2015 Analyst Briefing
First Quarter FY2015 Analyst Briefing
Alliance Bank Malaysia Berhad
 
3 q11 conference call presentation
3 q11 conference call presentation3 q11 conference call presentation
3 q11 conference call presentationBancoABCRI
 
Half Year Analyst Briefing as at 30 September 2013
Half Year Analyst Briefing as at 30 September 2013Half Year Analyst Briefing as at 30 September 2013
Half Year Analyst Briefing as at 30 September 2013
Alliance Bank Malaysia Berhad
 
2015 2 q apresentação en
2015 2 q apresentação en2015 2 q apresentação en
2015 2 q apresentação enProvidência
 
2Q10 Results Conference Call
2Q10 Results Conference Call2Q10 Results Conference Call
2Q10 Results Conference Call
Kianne Paganini
 
Liberty bank unaudited ifrs based q4 2013 and 2013 results
Liberty bank unaudited ifrs based q4 2013 and 2013 resultsLiberty bank unaudited ifrs based q4 2013 and 2013 results
Liberty bank unaudited ifrs based q4 2013 and 2013 results
LibertyBank
 
Access bank annual report 2015
Access bank annual report 2015Access bank annual report 2015
Access bank annual report 2015
Michael Olafusi
 

Similar to Bank of Kigali Announces Reviewed Q3 2015 & 9M 2015 (20)

GTI Research-UBA9Months 2015 Report
GTI Research-UBA9Months  2015 ReportGTI Research-UBA9Months  2015 Report
GTI Research-UBA9Months 2015 Report
 
Bank of Baroda Q4FY15: Profits miss estimates
Bank of Baroda Q4FY15: Profits miss estimatesBank of Baroda Q4FY15: Profits miss estimates
Bank of Baroda Q4FY15: Profits miss estimates
 
Csl maintains buy rating for uba
Csl maintains buy rating for ubaCsl maintains buy rating for uba
Csl maintains buy rating for uba
 
9M FY2014 Results Analyst Briefing as at 31 December 2013 from Alliance Finan...
9M FY2014 Results Analyst Briefing as at 31 December 2013 from Alliance Finan...9M FY2014 Results Analyst Briefing as at 31 December 2013 from Alliance Finan...
9M FY2014 Results Analyst Briefing as at 31 December 2013 from Alliance Finan...
 
9M FY2015 Results Analyst Briefing as at 31 December 2014 from Alliance Finan...
9M FY2015 Results Analyst Briefing as at 31 December 2014 from Alliance Finan...9M FY2015 Results Analyst Briefing as at 31 December 2014 from Alliance Finan...
9M FY2015 Results Analyst Briefing as at 31 December 2014 from Alliance Finan...
 
Full Year Analyst Briefing as at 31 March 2015
Full Year Analyst Briefing as at 31 March 2015Full Year Analyst Briefing as at 31 March 2015
Full Year Analyst Briefing as at 31 March 2015
 
Sterling bank annual report 2015
Sterling bank annual report 2015Sterling bank annual report 2015
Sterling bank annual report 2015
 
BI&P- Indusval- 3Q14 Earnings Release
BI&P- Indusval- 3Q14 Earnings ReleaseBI&P- Indusval- 3Q14 Earnings Release
BI&P- Indusval- 3Q14 Earnings Release
 
Close brothersi ntspresentation2015
Close brothersi ntspresentation2015Close brothersi ntspresentation2015
Close brothersi ntspresentation2015
 
Half Year Analyst Briefing as at 30 September 2014
Half Year Analyst Briefing as at 30 September 2014Half Year Analyst Briefing as at 30 September 2014
Half Year Analyst Briefing as at 30 September 2014
 
HDFC Bank result update: Q4FY15 PAT up 21% YoY, Motilal Oswal maintains 'Buy'
HDFC Bank result update: Q4FY15 PAT up 21% YoY, Motilal Oswal maintains 'Buy'HDFC Bank result update: Q4FY15 PAT up 21% YoY, Motilal Oswal maintains 'Buy'
HDFC Bank result update: Q4FY15 PAT up 21% YoY, Motilal Oswal maintains 'Buy'
 
BI&P- Indusval- 1Q14 Earnings Release
BI&P- Indusval- 1Q14 Earnings ReleaseBI&P- Indusval- 1Q14 Earnings Release
BI&P- Indusval- 1Q14 Earnings Release
 
Ccall 1 q12_ing
Ccall 1 q12_ingCcall 1 q12_ing
Ccall 1 q12_ing
 
First Quarter FY2015 Analyst Briefing
First Quarter FY2015 Analyst Briefing First Quarter FY2015 Analyst Briefing
First Quarter FY2015 Analyst Briefing
 
3 q11 conference call presentation
3 q11 conference call presentation3 q11 conference call presentation
3 q11 conference call presentation
 
Half Year Analyst Briefing as at 30 September 2013
Half Year Analyst Briefing as at 30 September 2013Half Year Analyst Briefing as at 30 September 2013
Half Year Analyst Briefing as at 30 September 2013
 
2015 2 q apresentação en
2015 2 q apresentação en2015 2 q apresentação en
2015 2 q apresentação en
 
2Q10 Results Conference Call
2Q10 Results Conference Call2Q10 Results Conference Call
2Q10 Results Conference Call
 
Liberty bank unaudited ifrs based q4 2013 and 2013 results
Liberty bank unaudited ifrs based q4 2013 and 2013 resultsLiberty bank unaudited ifrs based q4 2013 and 2013 results
Liberty bank unaudited ifrs based q4 2013 and 2013 results
 
Access bank annual report 2015
Access bank annual report 2015Access bank annual report 2015
Access bank annual report 2015
 

More from Lado Gurgenidze

Bank of Kigali Announces Changes in Board of Directors
Bank of Kigali Announces Changes in Board of DirectorsBank of Kigali Announces Changes in Board of Directors
Bank of Kigali Announces Changes in Board of Directors
Lado Gurgenidze
 
LG Conservative Party Conference Speech Sep 08
LG Conservative Party Conference Speech Sep 08LG Conservative Party Conference Speech Sep 08
LG Conservative Party Conference Speech Sep 08
Lado Gurgenidze
 
Issuer georgia-06-08
Issuer georgia-06-08Issuer georgia-06-08
Issuer georgia-06-08
Lado Gurgenidze
 
Financial services sector_act_140108
Financial services sector_act_140108Financial services sector_act_140108
Financial services sector_act_140108
Lado Gurgenidze
 
Georgia can be a guiding light to other states The Telegraph
Georgia can be a guiding light to other states   The TelegraphGeorgia can be a guiding light to other states   The Telegraph
Georgia can be a guiding light to other states The Telegraph
Lado Gurgenidze
 
Georgia EM Article 2008-05
Georgia EM Article 2008-05Georgia EM Article 2008-05
Georgia EM Article 2008-05
Lado Gurgenidze
 
Georgia's Search for Liberty AEI June 2009
Georgia's Search for Liberty AEI June 2009Georgia's Search for Liberty AEI June 2009
Georgia's Search for Liberty AEI June 2009
Lado Gurgenidze
 
Government of Georgia Submits the Draft Liberty Act
Government of Georgia Submits the Draft Liberty ActGovernment of Georgia Submits the Draft Liberty Act
Government of Georgia Submits the Draft Liberty Act
Lado Gurgenidze
 
BoG Alert 19 November 2007 Renaissance Capital
BoG Alert 19 November 2007 Renaissance CapitalBoG Alert 19 November 2007 Renaissance Capital
BoG Alert 19 November 2007 Renaissance Capital
Lado Gurgenidze
 
BK letter of appreciation Sep 2015
BK letter of appreciation Sep 2015BK letter of appreciation Sep 2015
BK letter of appreciation Sep 2015
Lado Gurgenidze
 
Georgian Economy - Back in Business 080825
Georgian Economy - Back in Business 080825Georgian Economy - Back in Business 080825
Georgian Economy - Back in Business 080825Lado Gurgenidze
 
Bayport Q3 2015 Investor Update Published
Bayport Q3 2015 Investor Update PublishedBayport Q3 2015 Investor Update Published
Bayport Q3 2015 Investor Update PublishedLado Gurgenidze
 
The Georgian Economy October 2008
The Georgian Economy October 2008The Georgian Economy October 2008
The Georgian Economy October 2008Lado Gurgenidze
 

More from Lado Gurgenidze (14)

Milken Institute 2009
Milken Institute 2009Milken Institute 2009
Milken Institute 2009
 
Bank of Kigali Announces Changes in Board of Directors
Bank of Kigali Announces Changes in Board of DirectorsBank of Kigali Announces Changes in Board of Directors
Bank of Kigali Announces Changes in Board of Directors
 
LG Conservative Party Conference Speech Sep 08
LG Conservative Party Conference Speech Sep 08LG Conservative Party Conference Speech Sep 08
LG Conservative Party Conference Speech Sep 08
 
Issuer georgia-06-08
Issuer georgia-06-08Issuer georgia-06-08
Issuer georgia-06-08
 
Financial services sector_act_140108
Financial services sector_act_140108Financial services sector_act_140108
Financial services sector_act_140108
 
Georgia can be a guiding light to other states The Telegraph
Georgia can be a guiding light to other states   The TelegraphGeorgia can be a guiding light to other states   The Telegraph
Georgia can be a guiding light to other states The Telegraph
 
Georgia EM Article 2008-05
Georgia EM Article 2008-05Georgia EM Article 2008-05
Georgia EM Article 2008-05
 
Georgia's Search for Liberty AEI June 2009
Georgia's Search for Liberty AEI June 2009Georgia's Search for Liberty AEI June 2009
Georgia's Search for Liberty AEI June 2009
 
Government of Georgia Submits the Draft Liberty Act
Government of Georgia Submits the Draft Liberty ActGovernment of Georgia Submits the Draft Liberty Act
Government of Georgia Submits the Draft Liberty Act
 
BoG Alert 19 November 2007 Renaissance Capital
BoG Alert 19 November 2007 Renaissance CapitalBoG Alert 19 November 2007 Renaissance Capital
BoG Alert 19 November 2007 Renaissance Capital
 
BK letter of appreciation Sep 2015
BK letter of appreciation Sep 2015BK letter of appreciation Sep 2015
BK letter of appreciation Sep 2015
 
Georgian Economy - Back in Business 080825
Georgian Economy - Back in Business 080825Georgian Economy - Back in Business 080825
Georgian Economy - Back in Business 080825
 
Bayport Q3 2015 Investor Update Published
Bayport Q3 2015 Investor Update PublishedBayport Q3 2015 Investor Update Published
Bayport Q3 2015 Investor Update Published
 
The Georgian Economy October 2008
The Georgian Economy October 2008The Georgian Economy October 2008
The Georgian Economy October 2008
 

Bank of Kigali Announces Reviewed Q3 2015 & 9M 2015

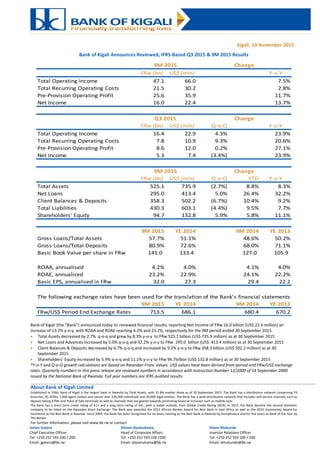
  • 1. About Bank of Kigali Limited Established in 1966, Bank of Kigali is the largest bank in Rwanda by Total Assets, with 31.8% market share as of 30 September 2015. The Bank has a distribution network comprising 74 branches, 81 ATMs, 1,006 agent outlets and serves over 339,000 individuals and 29,000 legal entities. The Bank has a wide distribution network that includes self-service channels such as deposit-taking ATMs and Point of Sale terminals as well as channels that are geared towards promoting financial inclusion such as mobile vans. The Bank has a short term credit rating of A1+ and a long term rating of AA-, with a stable outlook, from Global Credit Rating (GCR). In 2011, the Bank became the second domestic company to be listed on the Rwandan Stock Exchange. The Bank was awarded the 2015 African Banker Award for Best Bank in East Africa as well as the 2015 Euromoney Award for Excellence as the Best Bank in Rwanda. Since 2009, the Bank has been recognised for six years running as the Best Bank in Rwanda by Emeafinance and for five years as Bank of the Year by The Banker. For further information, please visit www.bk.rw or contact: James Gatera Shivon Byamukama Diane Mukunde Chief Executive Officer Head of Corporate Affairs Investor Relations Officer Tel: +250 252 593 100 / 200 Tel: +250 252 593 100 /200 Tel: +250 252 593 100 / 200 Email: jgatera@bk.rw Email: sbyamukama@bk.rw Email: dmukunde@bk.rw Kigali, 19 November 2015 Bank of Kigali Announces Reviewed, IFRS-Based Q3 2015 & 9M 2015 Results Bank of Kigali (the “Bank”) announced today its reviewed financial results, reporting Net Income of FRw 16.0 billion (US$ 22.4 million) an increase of 13.7% y-o-y, with ROAA and ROAE reaching 4.2% and 23.2%, respectively for the 9M period ended 30 September 2015.  Total Assets decreased by 2.7% q-o-q and grew by 8.3% y-o-y to FRw 525.1 billion (US$ 735.9 million) as at 30 September 2015  Net Loans and Advances increased by 5.0% q-o-q and 32.2% y-o-y to FRw 295.0 billion (US$ 413.4 million) as at 30 September 2015  Client Balances & Deposits decreased by 6.7% q-o-q and increased by 9.2% y-o-y to FRw 358.3 billion (US$ 502.2 million) as at 30 September 2015  Shareholders’ Equity increased by 5.9% q-o-q and 11.1% y-o-y to FRw 94.7billion (US$ 132.8 million) as at 30 September 2015 *Y-o-Y and Q-o-Q growth calculations are based on Rwandan Franc values. US$ values have been derived from period-end FRw/US$ exchange rates. Quarterly numbers in this press release are reviewed numbers in accordance with Instruction Number 12/2000 of 14 September 2000 issued by the National Bank of Rwanda. Full year numbers are IFRS audited results. FRw (bn) US$ (mln) Y-o-Y Total Operating Income 47.1 66.0 7.5% Total Recurring Operating Costs 21.5 30.2 2.8% Pre-Provision Operating Profit 25.6 35.9 11.7% Net Income 16.0 22.4 13.7% FRw (bn) US$ (mln) Q-o-Q Y-o-Y Total Operating Income 16.4 22.9 4.3% 23.9% Total Recurring Operating Costs 7.8 10.9 9.3% 20.6% Pre-Provision Operating Profit 8.6 12.0 0.2% 27.1% Net Income 5.3 7.4 (3.4%) 23.9% FRw (bn) US$ (mln) Q-o-Q YTD Y-o-Y Total Assets 525.1 735.9 (2.7%) 8.8% 8.3% Net Loans 295.0 413.4 5.0% 26.4% 32.2% Client Balances & Deposits 358.3 502.2 (6.7%) 10.4% 9.2% Total Liabilities 430.3 603.1 (4.4%) 9.5% 7.7% Shareholders' Equity 94.7 132.8 5.9% 5.8% 11.1% 9M 2015 YE 2014 9M 2014 YE 2013 Gross Loans/Total Assets 57.7% 51.1% 48.6% 50.2% Gross Loans/Total Deposits 80.9% 72.6% 68.0% 71.1% Basic Book Value per share in FRw 141.0 133.4 127.0 105.9 ROAA, annualised 4.2% 4.0% 4.1% 4.0% ROAE, annualised 23.2% 22.9% 24.1% 22.2% Basic EPS, annualised in FRw 32.0 27.3 29.4 22.2 The following exchange rates have been used for the translation of the Bank's financial statements 9M 2015 YE 2014 9M 2014 YE 2013 FRw/US$ Period End Exchange Rates 713.5 686.1 680.4 670.2 9M 2015 Q3 2015 Change Change Change 9M 2015
  • 2. 2 Market Share by Total Assets Market Share by Net Loans Market Share by Clients Balances & Deposits Market Share by Equity *Market share data are based on the Q3 2015 unaudited quarterly results submitted by commercial banks to the National Bank of Rwanda Bank of Kigali Growth vs. Commercial Banks’ Growth, CAGR YE 2010 – 2015 Total Assets grew by 8.8% YTD to FRw 525.1billion Total Assets Growth 9M 2015 2014 2013 2012 Bank of Kigali 8.8% 14.3% 30.9% 12.1% Banking Sector 15.0% 20.8% 21.0% 15.1% Net Loans grew by 26.4% YTD to FRw 295.0 billion Net Loan Book Growth 9M 2015 2014 2013 2012 Bank of Kigali 26.4% 17.3% 7.5% 50.3% Banking Sector 20.1% 21.6% 12.4% 29.8% Client Balances and Deposits increased by 10.4% YTD to FRw 358.3 billion Client Balances & Deposits Growth 9M 2015 2014 2013 2012 Bank of Kigali 10.4% 15.7% 32.4% 15.1% Banking Sector 12.7% 20.4% 20.6% 14.5% Shareholders’ Equity decreased by 5.8% YTD to FRw 94.7 billion Shareholders’ Equity Growth 9M 2015 2014 2013 2012 Bank of Kigali 5.8% 26.5% 12.2% 1.9% Banking Sector 16.8% 5.0% 18.1% 19.2% 17.8% 23.0% 17.6% 19.6% 21.5% 23.8% 21.4% 24.0% 0.0% 5.0% 10.0% 15.0% 20.0% 25.0% 30.0% Total Assets Net Loans Client Deposits Shareholders' Equity Commercial Banks Bank of Kigali
  • 3. 3 Q3 2015 Financial Highlights Net Interest Income increased by 9.7% q-o-q to FRw 12.0 billion. Net Non-Interest Income amounted to FRw 4.4 billion, a decrease of 7.9% q-o-q mostly impacted by lower FX related margins. Net Fees and Commission Income rose by 5.5% q-o-q to FRw 2.9 billion. Total Operating Income reached FRw 16.4 billion an increase of 4.3% q-o-q. Total operating costs increased by 9.3% q-o-q to FRw 7.8 billion mostly relating to an increase in administration and general expenses of 18.7% q-o-q as result of increasing distribution channels. The Bank reported Net Income of FRw 5.3 billion for the quarter. As at 30 September 2015 the Bank’s Total Assets stood at FRw 525.1 billion, up 8.3% y-o-y. Gross Loans increased by 3.9% q-o-q and 28.6% y-o-y to FRw 303.1 billion; while Net Loans increased by 5.0% q-o-q and 32.2% y-o-y to FRw 295.0 billion. Gross Loans/Total Assets ratio stood at 57.7% as at 30 September 2015, increasing from 48.6% in the same quarter 2014. Client Balances & Deposits reached FRw 358.3 billion, recording an increase of 9.2% y-o-y. Shareholders’ Equity equaled FRw 94.7 billion, up 5.9% q-o-q and 11.1% y-o-y. Liquid Assets divided by Total Deposits stood at 53.3% as at 30 September 2015, down from 66.1% in Q3 2014 9M 2015 Financial Highlights Net Interest Income increased by 16.9% y-o-y to FRw 33.9 billion. Net Non-Interest Income amounted to FRw 13.2 billion, a decrease of 11.0% y-o-y significantly impacted by the FX related income margins. Net fees and commission income increased by 3.3% y-o-y to FRw 8.2 billion; with total operating income reaching FRw 47.1 billion, up 7.5% y-o-y. Total operating costs increased marginally by 2.8% y-o-y to FRw 21.5 billion as the Bank continued to benefit from cost management and efficiency measures, thus resulting into lower cost to income ratio of 45.7% for the period, compared with 47.7% same period last year. The Bank reported Net Income of FRw 16.0 billion in 9M 2015, up 13.7% y-o-y. 9M 2015 annualised ROAA stood at 4.2%, whereas annualised ROAE stood at 23.2% compared to 4.1% and 24.1%, respectively, in 9M 2014. Monthly Revenue Monthly Pre-Provision Profit Monthly Net Income Monthly Gross Loans & Advances To Clients Monthly Clients Balances & Deposits Monthly Gross Loans/Clients Balances & Deposits
  • 4. 4 9M 2015 Business Highlights  As at 30 September 2015, the Bank served 339,750 Retail customers and 29,066 Corporate clients;  Expanded the Agency Banking Network to 1,006 agents as at 30 September 2015 and processed over 462,000 transactions worth almost FRw 43.4 billion;  As of 30 September 2015, the Bank had 74 branches, 81 ATMs and 748 POS terminals that accepted most international cards including VISA & MasterCard;  As at 30 September 2015, the Bank had 269,334 Mobiserve users, up from 230,636 users as of 31 December 2014;  Retail clients’ balances and deposits reached FRw 76.9 billion as at 30 September 2015, up 4.8% YTD;  Corporate clients’ balances and deposits were FRw 192.2 billion as at 30 September 2015, up 3.4% YTD. Clients Balances & Deposits Total Loans & Advances “We are very pleased with our third quarter 2015 performance, our competitive brand equity and continued dedication to efficiently serve our customers has been worthwhile. Our Net income grew by 13.7% y-o-y and Total Assets by 8.8% YTD. We managed to grow our Net Loan book to FRw 295.0 billion a 26.4% increase YTD. The figures show that the Bank has sustainably defended its position as a market leader in Rwanda across all key balance sheet metrics, with market share over 30%,”commented James Gatera, Chief Executive Officer.
  • 5. 5 Income Statement For the quarter ended 30September 2015 Total Operating Income Net Income Growth, Growth, IFRS based FRw (Bn) US$ (Mln) FRw (Bn) US$ (Mln) FRw (Bn) US$ (Mln) Q-o-Q Y-o-Y FRw/Euro Exchange Rate, e-o-p 830.4 807.9 868.3 FRw/US$ Exchange Rate, e-o-p 713.5 701.5 683.8 Interest Income 15.5 21.8 14.3 20.4 12.9 18.8 8.5% 20.6% Interest Expense 3.5 5.0 3.4 4.8 3.5 5.1 4.8% 1.7% Net Interest Income 12.0 16.8 10.9 15.6 9.4 13.7 9.7% 27.6% Net Fee & Commission Income 2.9 4.1 2.8 3.9 2.2 3.3 5.5% 23.7% Net Income From Documentary Operations 0.1 0.2 0.1 0.2 0.1 0.1 7.3% 31.8% FX related Income 1.2 1.6 1.8 2.6 1.3 1.9 (34.7%) (7.6%) Other Non-interest Income 0.2 0.2 0.1 0.1 0.2 0.3 170.2% 100.2% Net Non-Interest Income 4.4 6.1 4.8 6.8 3.8 5.6 (7.9%) 14.9% Total Operating Income 16.4 22.9 15.7 22.4 13.2 19.3 4.3% 23.9% Recurring Operating Costs Personnel Cost 3.0 4.2 3.1 4.4 2.5 3.7 (4.2%) 19.3% Bonus Pool 0.9 1.2 0.5 0.7 0.9 1.4 72.0% (9.1%) Administration and General expenses 2.9 4.1 2.5 3.7 2.2 3.1 18.7% 40.9% Depreciation & Amortisation 1.0 1.4 1.0 1.4 0.9 1.3 (3.3%) 7.7% Total Recuring Operating Costs 7.8 10.9 7.1 10.2 6.5 9.5 9.3% 20.6% Pre-Provision Operating Profit 8.6 12.0 8.6 12.2 6.7 9.8 0.2% 27.1% Net Loan Loss Provisions 2.5 3.5 2.1 2.9 1.8 2.7 21.6% 37.4% Gains on recovery 0.5 0.8 0.4 0.5 0.4 0.7 54.2% 29.6% Net Impairement on Loans & advances 2.0 2.7 1.7 2.4 1.4 2.0 14.3% 40.0% Profit Before Tax 6.6 9.3 6.9 9.8 5.3 7.8 (3.3%) 23.9% Income Tax Expense 1.3 1.9 1.5 2.0 1.1 1.6 (2.7%) 23.8% Net Income 5.3 7.4 5.4 7.8 4.2 6.2 (3.4%) 23.9% Q3 2015 Q2 2015 Q3 2014
  • 6. 6 Income Statement For the nine months period ending 30 September 2015 Notes: (1) Growth calculations are based on FRw values (2) US$ values have been derived from period-end FRw/US$ exchange rates set out on page 1 of this press release Growth, IFRS based FRw (Bn) US$ (Mln) FRw (Bn) US$ (Mln) Y-o-Y FRw/Euro Exchange Rate, e-o-p 830.4 868.3 FRw/US$ Exchange Rate, e-o-p 713.5 683.8 Interest Income 43.9 61.6 38.4 56.2 14.3% Interest Expense 10.0 14.1 9.4 13.8 6.0% Net Interest Income 33.9 47.5 29.0 42.4 16.9% Net Fee & Commission Income 8.2 11.4 7.4 10.8 3.3% Net Income From Documentary Operations 0.3 0.4 0.5 0.7 (35.6%) FX Related Income 4.5 6.3 6.2 9.1 (27.8%) Other Non-interest Income 0.2 0.4 0.7 1.1 (3.2%) Net Non-Interest Income 13.2 18.5 14.8 21.7 (11.0%) Total Operating Income 47.1 66.0 43.8 64.1 7.5% Recurring Operating Costs Personnel Cost 9.1 12.7 7.0 10.2 30.3% Bonus Pool 1.9 2.6 3.1 4.6 (40.8%) Administration and General expenses 7.6 10.7 8.1 11.8 (5.1%) Depreciation & Amortisation 2.9 4.1 2.7 4.0 6.8% Total Recuring Operating Costs 21.5 30.1 20.9 30.6 2.8% Pre-Provision Operating Profit 25.6 35.9 22.9 33.5 11.7% Net Loan Loss Provisions 6.7 9.3 6.2 9.0 8.0% Gains on recovery 1.3 1.8 1.1 1.5 23.0% Net Impairement on Loans & advances 5.4 7.5 5.1 7.5 4.9% Profit Before Tax 20.2 28.4 17.8 26.0 13.7% Income Tax Expense 4.2 6.0 3.7 5.4 13.6% Net Income 16.0 22.4 14.1 20.6 13.7% 9M 2015 9M2014
  • 7. 7 Statement of Financial Position As at 30 September 2015 Change Change Change IFRS based Bn Mln Bn Mln Bn Mln Bn Mln Q-o-Q YTD Y-o-Y FRw US$ FRw US$ FRw US$ FRw US$ Cash 12.7 17.7 11.4 16.2 12.0 17.5 11.0 16.1 11.3% 5.3% 14.8% Balances With BNR 23.7 33.2 18.6 26.6 31.9 46.6 23.9 34.9 27.2% (25.8%) (0.8%) Cash Balances With Banks 90.5 126.9 94.0 133.9 103.0 150.1 121.3 177.4 (3.7%) (12.1%) (25.4%) Treasuries 3.8 5.3 24.7 35.2 15.0 21.9 13.0 19.0 (84.8%) (75.0%) (71.2%) Other Fixed Income Instruments 69.0 96.8 77.4 110.4 58.6 85.4 59.6 87.2 (10.8%) 17.8% 15.8% Gross Loans 303.1 424.7 291.5 415.6 246.7 359.6 235.6 344.6 3.9% 22.8% 28.6% Loan Loss Reserve 8.1 11.3 10.6 15.1 13.3 19.3 12.5 18.3 (23.8%) (39.2%) (35.4%) Net Loans To Clients 295.0 413.4 281.0 400.5 233.4 340.3 223.1 326.3 5.0% 26.4% 32.2% Net Investments 0.2 0.3 0.2 0.3 0.2 0.3 0.2 0.3 0.0% (0.1%) 1.3% Net Property, Plant & Equipment 22.6 31.7 21.2 30.3 20.5 29.9 20.4 29.8 6.4% 10.2% 11.0% Intangible Assets 0.3 0.5 0.3 0.4 0.2 0.3 0.2 0.3 22.9% 44.4% 57.5% Net Other Assets 7.3 10.1 10.7 15.2 7.7 11.2 12.2 17.9 (32.1%) (5.3%) (40.4%) Total Assets 525.1 735.9 539.5 769.0 482.6 703.4 485.0 709.2 (2.7%) 8.8% 8.3% Interbank Deposits 16.5 23.1 18.6 26.5 15.2 22.2 18.2 26.6 (11.5%) 8.2% (9.5%) Client Balances & Deposits 358.3 502.2 383.9 547.2 324.6 473.1 328.1 479.9 (6.7%) 10.4% 9.2% Borrowed Funds 44.2 62.0 37.5 53.5 39.9 58.2 41.3 60.3 17.9% 10.8% 7.2% Dividends payable 0.0 0.0 0.0 0.1 0.0 0.0 0.0 0.0 (40.3%) 440.2% 439.5% Other Liabilities 11.4 15.8 10.0 14.2 13.3 19.4 12.1 17.7 12.7% (15.6%) (7.2%) Total Liabilities 430.4 603.1 450.0 641.5 393.1 572.9 399.7 584.5 (4.4%) 9.5% 7.7% Ordinary Shares 6.7 9.4 6.7 9.6 6.7 9.8 6.7 9.8 0.0% 0.1% 0.2% Reserves 65.8 92.3 65.7 93.6 58.0 84.5 57.8 84.6 0.2% 13.5% 13.8% Revaluation Reserve 6.2 8.7 6.3 9.0 6.5 9.5 6.6 9.7 (1.6%) (4.7%) (6.2%) Retained Earnings 16.0 22.4 10.8 15.3 18.3 26.7 14.1 20.6 48.8% (12.6%) 13.7% Shareholder's Equity 94.7 132.8 89.5 127.5 89.5 130.5 85.3 124.7 5.9% 5.8% 11.1% Total liabilities & Shareholders' Equity 525.1 735.9 539.5 769.0 482.6 703.4 485.0 709.2 (2.7%) 8.8% 8.3% Q3 2015 Q2 2015 Q4 2014 Q3 2014 Total Assets Net Loans and Advances Client Balances & Deposits Shareholders’ Equity
  • 8. 8 Key Performance Ratios Quarterly ratios are annualised, where applicable Q3 2015 Q2 2015 Q3 2014 9M 2015 9M 2014 YE 2014 YE 2013 YE 2012 YE 2011 YE 2010 Profitability Return on Average Assets, % 4.2% 4.3% 3.7% 4.2% 4.1% 4.0% 4.0% 3.9% 3.6% 3.5% Return on Average Equity, % 22.8% 24.3% 21.7% 23.2% 24.1% 22.9% 22.2% 18.9% 18.6% 24.5% Net Interest Margin , % 10.8% 9.6% 9.4% 10.2% 9.6% 9.9% 11.1% 9.6% 8.4% 8.3% Loan Yield, % 20.8% 19.3% 20.6% 19.4% 20.7% 20.5% 20.5% 17.0% 16.9% 15.8% Interest Expense/Interest Income,% 22.8% 23.6% 27.1% 22.8% 24.5% 24.4% 22.2% 26.0% 26.8% 25.6% Cost of Funds, % 3.4% 3.2% 3.7% 3.2% 3.3% 3.4% 3.3% 3.4% 3.1% 2.8% Efficiency Cost/Income Ratio 47.7% 45.5% 49.0% 45.7% 47.7% 47.9% 48.4% 52.8% 48.4% 47.5% Costs/Average Assets, % 6.2% 5.6% 5.7% 5.7% 6.2% 6.2% 7.0% 6.6% 5.9% 5.8% Personnel Costs/Total Recurring Operating Costs 49.3% 50.7% 53.3% 50.8% 48.3% 51.8% 45.0% 47.4% 51.8% 52.3% Personnel Costs/Average Total Assets, Annualised 3.1% 2.8% 3.0% 2.9% 2.2% 3.2% 3.1% 3.1% 2.9% 3.0% Personnel Costs/Total Operating Income 23.5% 23.0% 26.1% 23.2% 23.0% 24.8% 21.8% 25.0% 25.1% 25.0% Net Income/Total Operating Income 32.1% 34.7% 32.1% 34.0% 32.1% 31.5% 27.6% 30.7% 29.5% 29.2% Total Operating Income/Average Assets % 13.0% 12.3% 11.6% 12.5% 9.7% 12.9% 14.4% 12.6% 12.1% 12.1% Liquidity Net Loans/Total Assets,% 56.2% 52.1% 46.0% 56.2% 46.0% 48.4% 47.1% 57.3% 42.8% 51.3% Liquid Assets / Total Assets 38.0% 41.9% 47.2% 38.0% 47.2% 45.7% 46.0% 31.9% 45.1% 37.0% Liquid Assets / Total Deposits 53.3% 56.2% 66.1% 53.3% 66.1% 64.9% 65.2% 44.7% 64.9% 47.3% Liquid Assets / Total Liabilities 46.4% 50.2% 57.3% 46.4% 57.3% 56.1% 55.2% 39.6% 57.4% 44.1% Total Deposits / Total Assets 71.4% 74.6% 71.4% 71.4% 71.4% 70.4% 70.5% 71.3% 69.5% 78.2% Total Deposits / Total Liabilities 87.1% 89.4% 86.6% 87.1% 86.6% 86.5% 84.7% 88.7% 88.4% 93.2% Interbank Borrowings / Total Deposits 4.4% 4.6% 5.3% 4.4% 5.3% 4.5% 5.8% 8.0% 9.5% 12.2% Gross Loans/Total Assets 57.7% 54.0% 48.6% 57.7% 48.6% 51.1% 50.2% 60.1% 45.4% 53.4% Gross Loans / Total Deposits 80.9% 72.4% 68.0% 80.9% 68.0% 72.6% 71.1% 84.2% 65.3% 68.3% Interest Earning Assets/Total Assets 88.8% 90.4% 88.6% 88.8% 88.6% 87.7% 88.4% 80.5% 82.0% 81.6% Leverage (Total Liabilities/Equity), Times 4.5 5.0 4.7 4.5 4.7 4.4 5.0 4.1 3.7 5.2 Asset Quality NPLs /Total Loans, % 5.4% 5.8% 6.7% 5.4% 6.7% 6.6% 6.9% 6.5% 8.3% 8.5% NPL Coverage Ratio 40.4% 62.3% 78.6% 40.4% 78.6% 81.8% 87.4% 70.3% 69.1% 45.8% Loan Loss reserve / Gross Loans ,% 2.7% 3.6% 5.3% 2.7% 5.3% 5.4% 6.1% 4.6% 5.8% 3.9% Average Loan Loss reserve / Average Gross Loans ,% 3.9% 4.4% 5.7% 3.9% 5.7% 5.7% 5.4% 5.1% 4.9% 4.3% Large Exposures / Gross Loans 22.9% 18.5% 16.3% 22.9% 16.3% 18.0% 5.4% 6.5% 8.8% 14.3% Cost of Risk, Annualised 2.8% 2.5% 2.5% 2.6% 3.0% 3.3% 4.4% 2.2% 3.8% 2.0% Capital Adequacy Core Capital / Risk Weighted Assets 22.4% 21.9% 25.7% 22.4% 25.7% 25.8% 23.1% 22.4% 28.1% 18.7% Total Qualifying Capital / Risk Weighted Assets 22.8% 22.4% 26.3% 22.8% 26.3% 26.3% 23.7% 23.2% 29.1% 20.1% Off Balance Sheet Items / Total Qualifying Capital 485.5% 481.8% 455.1% 485.5% 455.1% 428.4% 542.5% 524.3% 363.1% 351.2% Large Exposures / Core Capital 86.1% 69.5% 53.9% 86.1% 53.9% 53.5% 17.9% 22.6% 21.3% 61.1% NPLs less Provisions / Core Capital 14.8% 8.2% 4.8% 14.8% 4.8% 3.5% 2.9% 6.8% 6.2% 19.7% Market Sensitivity Forex Exposure / Core Capital (23.7%) (20.9%) (26.8%) (23.7%) (26.8%) (20.4%) (9.1%) (41.2%) 11.7% 11.5% Forex Loans / Forex Deposits 20.5% 18.7% 4.9% 20.5% 4.9% 8.4% 0.7% 1.0% 0.8% 1.0% Forex Assets / Forex Liabilities 85.9% 87.7% 87.2% 85.9% 87.2% 87.5% 93.8% 61.0% 105.3% 106.7% Forex Loans / Gross Loans 6.2% 6.1% 2.2% 6.2% 2.2% 3.3% 0.3% 0.3% 0.3% 0.4% Forex Deposits/Total Deposits 36.2% 32.9% 42.9% 24.6% 31.4% 39.9% 44.8% 25.3% 23.8% 27.4% Selected Operating Data Full Time Employees 1,118 1,116 1,029 1,118 1,029 1,019 980 877 602 454 Assets per FTE (FRw in billion) 0.5 0.5 0.5 0.5 0.5 0.5 0.4 0.4 0.5 0.4 Number of Active Branches 74 73 70 74 70 70 65 59 44 33 Number of Mobibank 9 9 9 9 9 9 5 5 - - Number of ATMS 81 79 76 81 76 76 65 55 26 26 Number of POS Terminals 748 670 660 748 660 656 568 405 202 97 Number of Retail current accounts 302,483 286,934 254,752 302,483 254,752 266,239 231,409 191,632 124,248 50,073 Number of BK Yacu Agent 1,006 944 829 1,006 829 861 569 30 - -
  • 9. 9 Definitions 1 Return On Average Total Assets (ROAA) equals Net Income of the period divided by average Total Assets for the same period; 2 Return On Average Total Equity (ROAE) equals Net Income of the period divided by average Total Shareholders’ Equity for the same period; 3 Average Interest Earning Assets are calculated on a quarterly basis; Interest Earning Assets include: Cash & Balances With Banks, Treasuries and Net Loans To Clients; 4 Net Interest Margin equals Net Interest Income of the period divided by Average Interest Earning Assets for the same period; 5 Loan Yield equals Interest Income of the period on loans & advances divided by average Gross Loans for the same period; 6 Cost Of Funds equals Interest Expense of the period divided by average Total Liabilities for the same period; 7 Total Operating Income includes Net Interest Income and Non-Interest Income; 8 Costs include Total Recurring Operating Costs and Bonuses (Paid and Accrued); 9 Cost/Income equals Total Recurring Operating Costs plus Bonuses (Paid and Accrued) for the period divided by Total Operating Income; 10 Personnel Costs/Total Recurring Operating Costs equals the sum of Staff Costs and Bonuses (Paid and Accrued) for the period divided by Total Recurring Operating Costs ; 11 Personnel Costs/Average Total Assets equals the sum of Staff Costs and Bonuses (Paid and Accrued) for the period divided by average Total Assets ; 12 Client Deposits include Corporate, other Financial institutions and Retail deposits; 13 Liquid Assets include Cash, Cash Balances With the NBR, Cash Balances With Banks, Treasuries and Other Fixed Income Instruments; 14 Total Deposits include Interbank Deposits and Client Deposits; 15 Shareholders’ Equity equals to Total Shareholders’ Equity; 16 NPLs are loans overdue by more than 90 days 17 NPL Coverage ratio equals Loan Loss Reserve as of the period end divided by NPLs as of the same period; 18 Large exposures include loans that in aggregate comprise 10% of Core Capital; 19 Cost Of Risk equals Net Provision For Loan Losses of the period, plus provisions for (less recovery of) other assets, divided by average Gross Loans To Clients for the same period; 20 Total Capital Adequacy equals Total Qualifying Capital as of the period end divided by Total Risk Weighted Assets as of the same date, both calculated in accordance with the requirements of the National Bank of Rwanda. 21 Y-o-Y refers to year on year change on the FRw values 22 Q-o-Q refers to quarter on quarter change on the FRw values 23 YE refer to Year End figures as at 31 December.