The document discusses the significance of measuring the band gap of materials in the semiconductor and nanomaterial industries, detailing how it can be determined using UV absorption spectra and Tauc plots. It explains the concept of band gap, the method to derive the optical band gap, and the role of linear regions in Tauc plots for varying types of electronic transitions. The document also emphasizes the importance of understanding deviations from linear behavior in Tauc plots to accurately identify band gap values.

![3
The term “band gap” refers to the energy difference between the top of the valence band
to the bottom of the conduction band (See Figure 1); electrons are able to jump from one
band to another.
In order for an electron to jump from a valence band to a conduction band, it requires a
specific minimum amount of energy for the transition, the band gap energy.
A diagram illustrating the band gap is shown in Figure 1.
Measuring the band gap is important in the semiconductor and nanomaterial industries.
The band gap energy of insulators is large (> 4eV), but lower for semiconductors (<
3eV).
The band gap properties of a semiconductor can be controlled by using different
semiconductor alloys such as GaAlAs, InGaAs, and InAlAs [1].
1.Jayant Dharma, PerkinElmer Technical Center, Aniruddha Pisal, Global Application Laboratory, PerkinElmer,
Inc., Shelton, CT USA. file:///C:/Users/intel/Desktop/APP_UVVISNIRMeasureBandGapEnergyValue.pdf
21PYB102J Unit-IV Lecture-45](https://image.slidesharecdn.com/bandgapcalculation1-241202100301-94380aa7/85/band-gap-calculation-semiconductor-and-computaonal-method-3-320.jpg)
![4
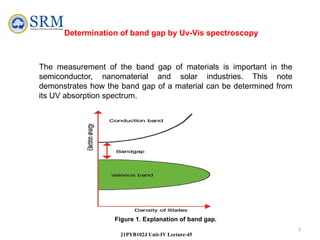
Tauc plot
A Tauc plot is used to determine the optical band gap, or Tauc gap, in semiconductors.
The Tauc gap is often used to characterize practical optical properties of amorphous
materials. While investigating the optical and electronic properties of amorphous
germanium, Tauc et al, proposed and substantiated a method for determining the band
gap using optical absorbance data plotted appropriately with respect to energy [2].
This was further developed in Davis and Mott’s more general work on amorphous
semiconductors [3,4]. They show that the optical absorption strength depends on the
difference between the photon energy and the band gap as shown in (Eq. 1):
( )
𝛼ℎ𝑣 1/𝑛
= ( − )
𝐴 ℎ𝑣 𝐸𝑔 (1)
where h is Planck’s constant, ν is the photon’s frequency, α is the absorption coefficient,
Eg is the band gap and A is a proportionality constant.
2.Tauc, J., R. Grigorovici and A. Vancu, Optical properties and electronic structure of amorphous germanium.
Physica Status Solidi, 1966. 15: p. 627-637.
3.Davis, E.A. and N.F. Mott, Conduction in non-crystalline systems V. Conductivity, optical absorption and
photoconductivity in amorphous semiconductors. Philosophical Magazine, 1970. 22: p. 903.
4.Mott, N.F. and E.A. Davis, Electronic processes in non-crystalline materials. 2nd ed. 1979: Clarendon Press
(Oxford and New York).
21PYB102J Unit-IV Lecture-45](https://image.slidesharecdn.com/bandgapcalculation1-241202100301-94380aa7/85/band-gap-calculation-semiconductor-and-computaonal-method-4-320.jpg)
![6
Tauc plot
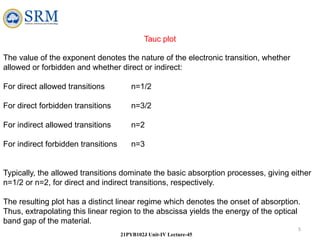
Figure 2: Example Tauc Plot from UV-Vis analysis of a ZnO thin film that illustrates the method of fitting
the linear region to evaluate the band-gap at the X-axis intercept, here about 3.27 eV [5].
5.Wang, M.D., D.Y. Zhu, Y. Liu, L. Zhang, C.X. Zheng, Z.H. He, D.H. Chen and L.S. Wen, Determination of
thickness and optical constants of ZnO thin films prepared by filtered cathode vacuum arc deposition. Chinese
Physics Letters, 2008. 25(2): p. 743-746.
21PYB102J Unit-IV Lecture-45](https://image.slidesharecdn.com/bandgapcalculation1-241202100301-94380aa7/85/band-gap-calculation-semiconductor-and-computaonal-method-6-320.jpg)
![7
Tauc plot
Figure 2 gives one example Tauc plot for ZnO where the absorption coefficient times the
photon energy to the second power is plotted versus the incident photon energy[4].
The second power was used as zinc oxide is well known to have a direct allowed
transition.
The characteristic features of Tauc plots are evident:
• at low photon energies the absorption approaches zero – the material is
transparent;
• near the band gap value the absorption gets stronger and shows a region of
linearity in this squared-exponent plot.
• This linear region has been used to extrapolate to the X-axis intercept to find
the band gap value (here about 3.27 eV).
• At even higher energies the absorption processes saturate and the curve again
deviates from linear.
21PYB102J Unit-IV Lecture-45](https://image.slidesharecdn.com/bandgapcalculation1-241202100301-94380aa7/85/band-gap-calculation-semiconductor-and-computaonal-method-7-320.jpg)
![8
Tauc plot
To select and justify a linear region for extrapolation one must understand the reasons
for these lower and upper deviations from linear behavior.
•On the low energy end, the deviation from linearity can be associated with defect
absorption states that are near the band edge. This phenomenon has been investigated
by Urbach [6] and in subsequent years, therefore, identified as an “Urbach Tail.” These
states are usually described by an exponential function, corresponding to a typical
distribution of density of states, evident in the absorption behavior seen in the example
Tauc plot (Figure 2).
•On the high energy end, saturation of available transition states is responsible for a
leveling out of absorption strength in most collected spectra [7].
6.Urbach, F., The Long-Wavelength Edge of Photographic Sensitivity and of the Electronic Absorption of Solids.
Physical Review 1953. 92: p. 1324.
7.Brian D. Viezbicke., Shane Patel., Benjamin E. Davis, and Dunbar P. Birnie, III., Evaluation of the Tauc Method
for Optical Absorption Edge Determination: ZnO Thin Films as a Model System. Physica Status Solidi, B 2015
252(8), 1700-1710.
21PYB102J Unit-IV Lecture-45](https://image.slidesharecdn.com/bandgapcalculation1-241202100301-94380aa7/85/band-gap-calculation-semiconductor-and-computaonal-method-8-320.jpg)