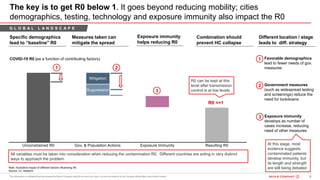
Downloaded 154 times


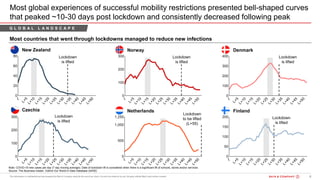
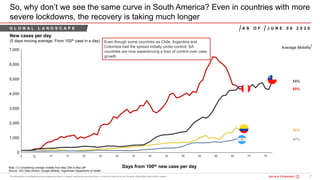

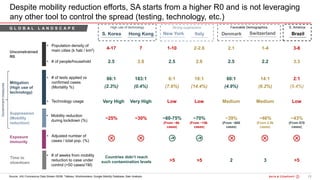
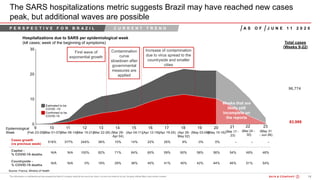
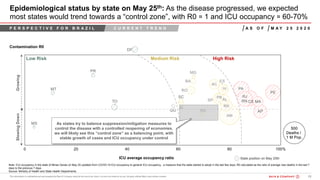

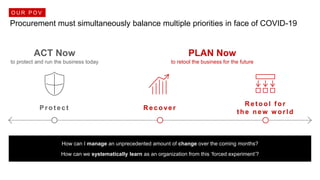

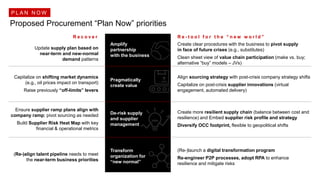


This document discusses the impact of COVID-19 on procurement and the economy, emphasizing the urgent need for businesses to protect health and maintain operations amidst rapidly changing conditions. It highlights the differences in recovery rates across regions, particularly comparing South America to other areas, and underscores that businesses must adapt quickly to evolving customer needs and supply chain disruptions. Additionally, it predicts a challenging economic landscape for various sectors while emphasizing the importance of strategic decision-making during this crisis.


