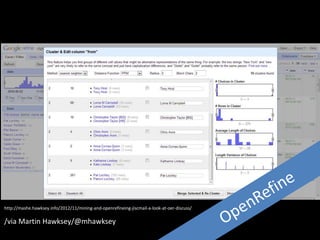
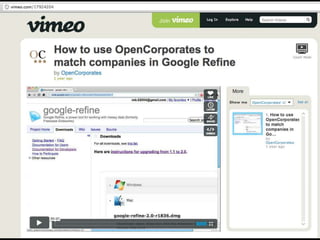
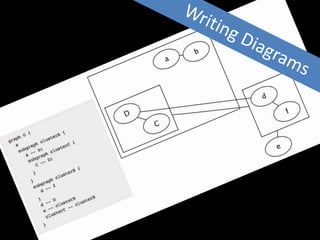
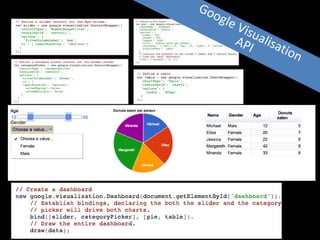
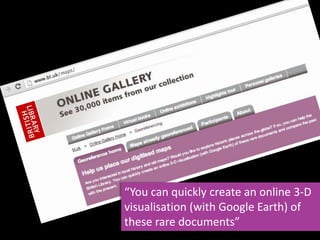
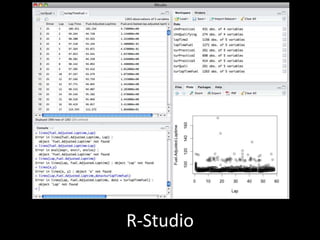
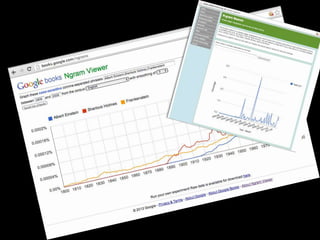
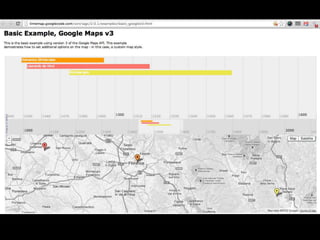
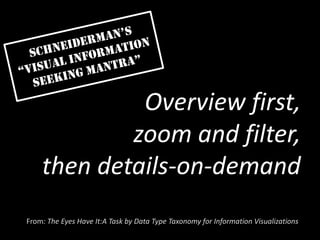
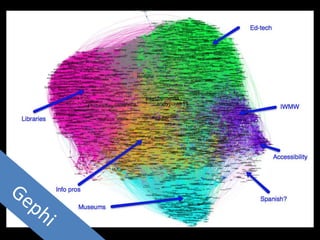
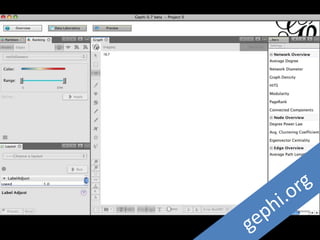
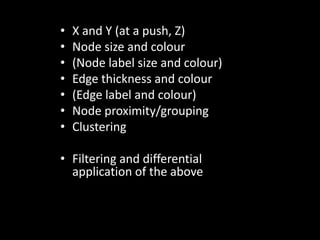
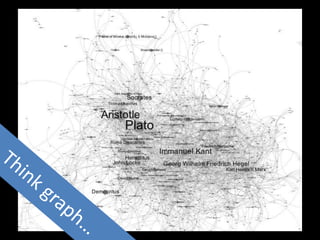
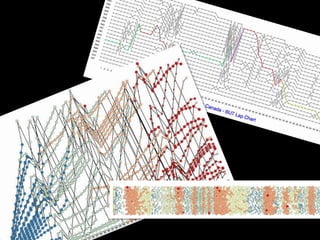
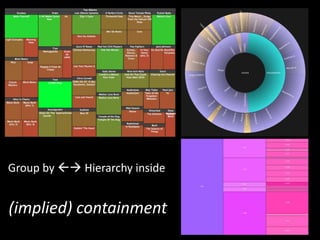
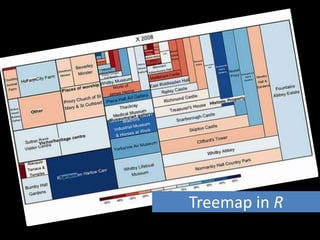
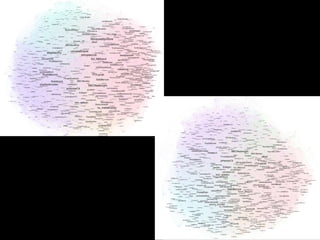
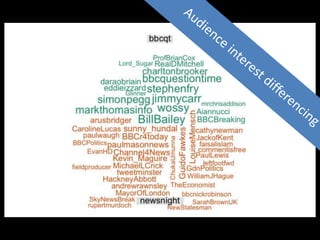
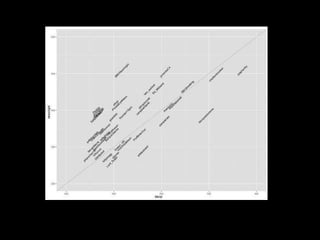
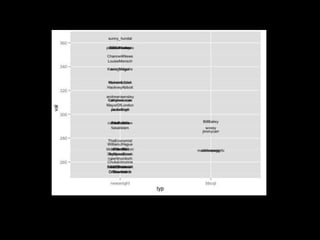
Tools & techniques
for working with
datasets
                             Tony Hirst
              Dept of Communication and Systems
                            The Open University
Quick wins and
half-hour hacks
Building a
toolbox…
http://mashe.hawksey.info/2012/11/mining-and-openrefineing-jiscmail-a-look-at-oer-discuss/

/via Martin Hawksey/@mhawksey
“You can quickly create an online 3-D
visualisation (with Google Earth) of
these rare documents”
R-Studio
All at once
      or
one at a time?
Macroscopes
@mediaczar


             (Accession Plot)
Google Maps, 1884 edition?
Overview first,
            zoom and filter,
    then details-on-demand
From: The Eyes Have It:A Task by Data Type Taxonomy for Information Visualizations
•   X and Y (at a push, Z)
•   Node size and colour
•   (Node label size and colour)
•   Edge thickness and colour
•   (Edge label and colour)
•   Node proximity/grouping
•   Clustering

• Filtering and differential
  application of the above
Group by  Hierarchy inside


(implied) containment
Treemap in R
Similarities
    and
differences
Single page
   app +
  linkage
Templated data views
blog.ouseful.info
 @psychemedia

B llabs

Editor's Notes

  • #38 Let pi,j be the rate at which word i occurs in document j, and pj be the average across documents( sum Pij/ndocs)The size of each word is mapped to its maximum deviation ( maxi(pi,j- pj ) ), and its angular position is determined by the document where that maximum occurs.