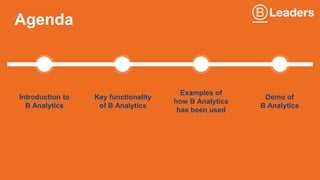
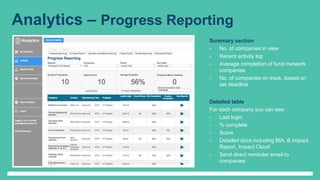
Benchmarking
Agenda
Introduction to
B Analytics
Key functionality
of B Analytics
Examples of
how B Analytics
has been used
Demo of
B Analytics
What is B Analytics?
Key functionality of B Analytics
Track overall progress of companies in your network/fund
Track company by company progress in terms of score, completion,
access to detailed reports
Benchmark performance against 10,000s of businesses who have
completed the B Impact Assessment (BIA). This can be done at an Impact
Area level, Impact Topic level and question level
Visual representation of where most points have been attained and where
highest improvement potential lies
Extract reports including graphs, tables, raw data
How have companies used B
Analytics?
Fund
Measure performance
of companies within
a fund
Business
network
Measure performance
of companies within
business network
Supply chain
Business measures
performance of
companies in supply
chain
Let’s take a look…
B Analytics dashboard
B Analytics Dashboard
- Landing page on B Analytics platform
- Shows summary of companies in
fund/network
- Fields shown include:
 No. of companies logged on in past
2/7/30/90 days
 No. of companies in progress on BIA
 Average completion rate
 Login history over period of time
 Total companies registered over period
of time
Analytics – Progress Reporting
Summary section
- No. of companies in view
- Recent activity log
- Average completion of fund /network
companies
- No. of companies on track, based on
set deadline
Detailed table
For each company you can see:
- Last login
- % complete
- Score
- Detailed docs including BIA, B Impact
Report, Impact Cloud
- Send direct reminder email to
companies
Analytics – B Impact Report
Filter B Impact Report
- Filter for specific BIA
areas, e.g.
Governance,
Environment,
Community, Workers,
Customers
- (All) Company filter
shows the average
score of all companies
in the network or fund
- Filter to view a specific
company
- Filter for time frames,
e.g. 2015, 2016 or all
time
- Filter for benchmark
data, e.g. B Corps,
ordinary businesses
Scorecard
- Compares fund, network
or individual company’s
score to benchmark
- Splits score between
Impact Areas
- Filter by one specific
Impact Area to see
more detailed
breakdown of score
- Black diamond
represents benchmark
- Coloured circle
represents company’s
score
- Focuses improvement
Analytics – Question Level Benchmarking
Question Level Benchmarking
- Plots fund, network or individual
company’s performance against
a benchmark
- Plots average score of fund or
network
- Lists every question answered
in the BIA
- Possible to filter by specific
company, impact area, impact
topic, size, period, market,
sector, industry or country
- Benchmark company’s data
against performance of 10,000s
of companies who have
completed the BIA
Analytics – Impact Cloud
Impact Cloud
- Visualisation of company’s or
network/fund’s points earned in BIA
- Two views available:
1. Impact attained i.e. points earned
2. Improvement potential i.e. points
available
- Enables identification of areas of highest
impact and areas of highest potential
improvement
- Data can be aggregated at the company
level or at the fund/network level
- Select a bubble and view the question and
answers given by the network or by each
company
- Possible to filter by company, period,
impact area, impact topic, question
Analytics – Flexible Reporting
Flexible Reporting
- Enables export of data from B
Analytics
- Able to export as CSV, Excel, Image,
PDF
- Select a specific question, analyse
results, select analysis e.g. pie chart,
bar graph, summary table
- Available for standard BIA and
custom questions
- Available for quantitative and
qualitative answers
- Possible to filter data by company,
period, market, sector, size, statistic
(sum, average, median)
Analytics – Download data
Download All Data
- Enables user to download all raw
data
- Filters available for impact area,
impact topic, question, period
- Data can be uploaded to a separate
performance management tool if
required
Keen to use B Analytics?
Costs: $4k for B Analytics licence
Additional $4k to join a cohort. Cohort
includes 6x monthly webinars to guide you
through the process
Free 15 day trial is available for those
companies who are interested in testing out
the tool
Available on individual company basis from
early 2017
B Analytics youtube.com channel
available with training modules
If you have any questions, please email
georgie.morris@bcorporation.uk

B Leaders Module 3: Benchmarking

  • 1.
  • 2.
    Agenda Introduction to B Analytics Keyfunctionality of B Analytics Examples of how B Analytics has been used Demo of B Analytics
  • 3.
    What is BAnalytics?
  • 4.
    Key functionality ofB Analytics Track overall progress of companies in your network/fund Track company by company progress in terms of score, completion, access to detailed reports Benchmark performance against 10,000s of businesses who have completed the B Impact Assessment (BIA). This can be done at an Impact Area level, Impact Topic level and question level Visual representation of where most points have been attained and where highest improvement potential lies Extract reports including graphs, tables, raw data
  • 5.
    How have companiesused B Analytics? Fund Measure performance of companies within a fund Business network Measure performance of companies within business network Supply chain Business measures performance of companies in supply chain
  • 6.
  • 7.
    B Analytics dashboard BAnalytics Dashboard - Landing page on B Analytics platform - Shows summary of companies in fund/network - Fields shown include:  No. of companies logged on in past 2/7/30/90 days  No. of companies in progress on BIA  Average completion rate  Login history over period of time  Total companies registered over period of time
  • 8.
    Analytics – ProgressReporting Summary section - No. of companies in view - Recent activity log - Average completion of fund /network companies - No. of companies on track, based on set deadline Detailed table For each company you can see: - Last login - % complete - Score - Detailed docs including BIA, B Impact Report, Impact Cloud - Send direct reminder email to companies
  • 9.
    Analytics – BImpact Report Filter B Impact Report - Filter for specific BIA areas, e.g. Governance, Environment, Community, Workers, Customers - (All) Company filter shows the average score of all companies in the network or fund - Filter to view a specific company - Filter for time frames, e.g. 2015, 2016 or all time - Filter for benchmark data, e.g. B Corps, ordinary businesses Scorecard - Compares fund, network or individual company’s score to benchmark - Splits score between Impact Areas - Filter by one specific Impact Area to see more detailed breakdown of score - Black diamond represents benchmark - Coloured circle represents company’s score - Focuses improvement
  • 10.
    Analytics – QuestionLevel Benchmarking Question Level Benchmarking - Plots fund, network or individual company’s performance against a benchmark - Plots average score of fund or network - Lists every question answered in the BIA - Possible to filter by specific company, impact area, impact topic, size, period, market, sector, industry or country - Benchmark company’s data against performance of 10,000s of companies who have completed the BIA
  • 11.
    Analytics – ImpactCloud Impact Cloud - Visualisation of company’s or network/fund’s points earned in BIA - Two views available: 1. Impact attained i.e. points earned 2. Improvement potential i.e. points available - Enables identification of areas of highest impact and areas of highest potential improvement - Data can be aggregated at the company level or at the fund/network level - Select a bubble and view the question and answers given by the network or by each company - Possible to filter by company, period, impact area, impact topic, question
  • 12.
    Analytics – FlexibleReporting Flexible Reporting - Enables export of data from B Analytics - Able to export as CSV, Excel, Image, PDF - Select a specific question, analyse results, select analysis e.g. pie chart, bar graph, summary table - Available for standard BIA and custom questions - Available for quantitative and qualitative answers - Possible to filter data by company, period, market, sector, size, statistic (sum, average, median)
  • 13.
    Analytics – Downloaddata Download All Data - Enables user to download all raw data - Filters available for impact area, impact topic, question, period - Data can be uploaded to a separate performance management tool if required
  • 14.
    Keen to useB Analytics? Costs: $4k for B Analytics licence Additional $4k to join a cohort. Cohort includes 6x monthly webinars to guide you through the process Free 15 day trial is available for those companies who are interested in testing out the tool Available on individual company basis from early 2017 B Analytics youtube.com channel available with training modules
  • 15.
    If you haveany questions, please email georgie.morris@bcorporation.uk

Editor's Notes

  • #2 3.00 – 3.10
  • #3 3.00-3.10: Understanding the BIA - Key features and structure of BIA 3.10-3.25: Governance of the BIA - How Standards are developed 3.25-3.45: Live demo of the BIA 3.45-4.15: The certification process including Standards review, DQ and background checks
  • #16 3.00 – 3.10