Downloaded 252 times


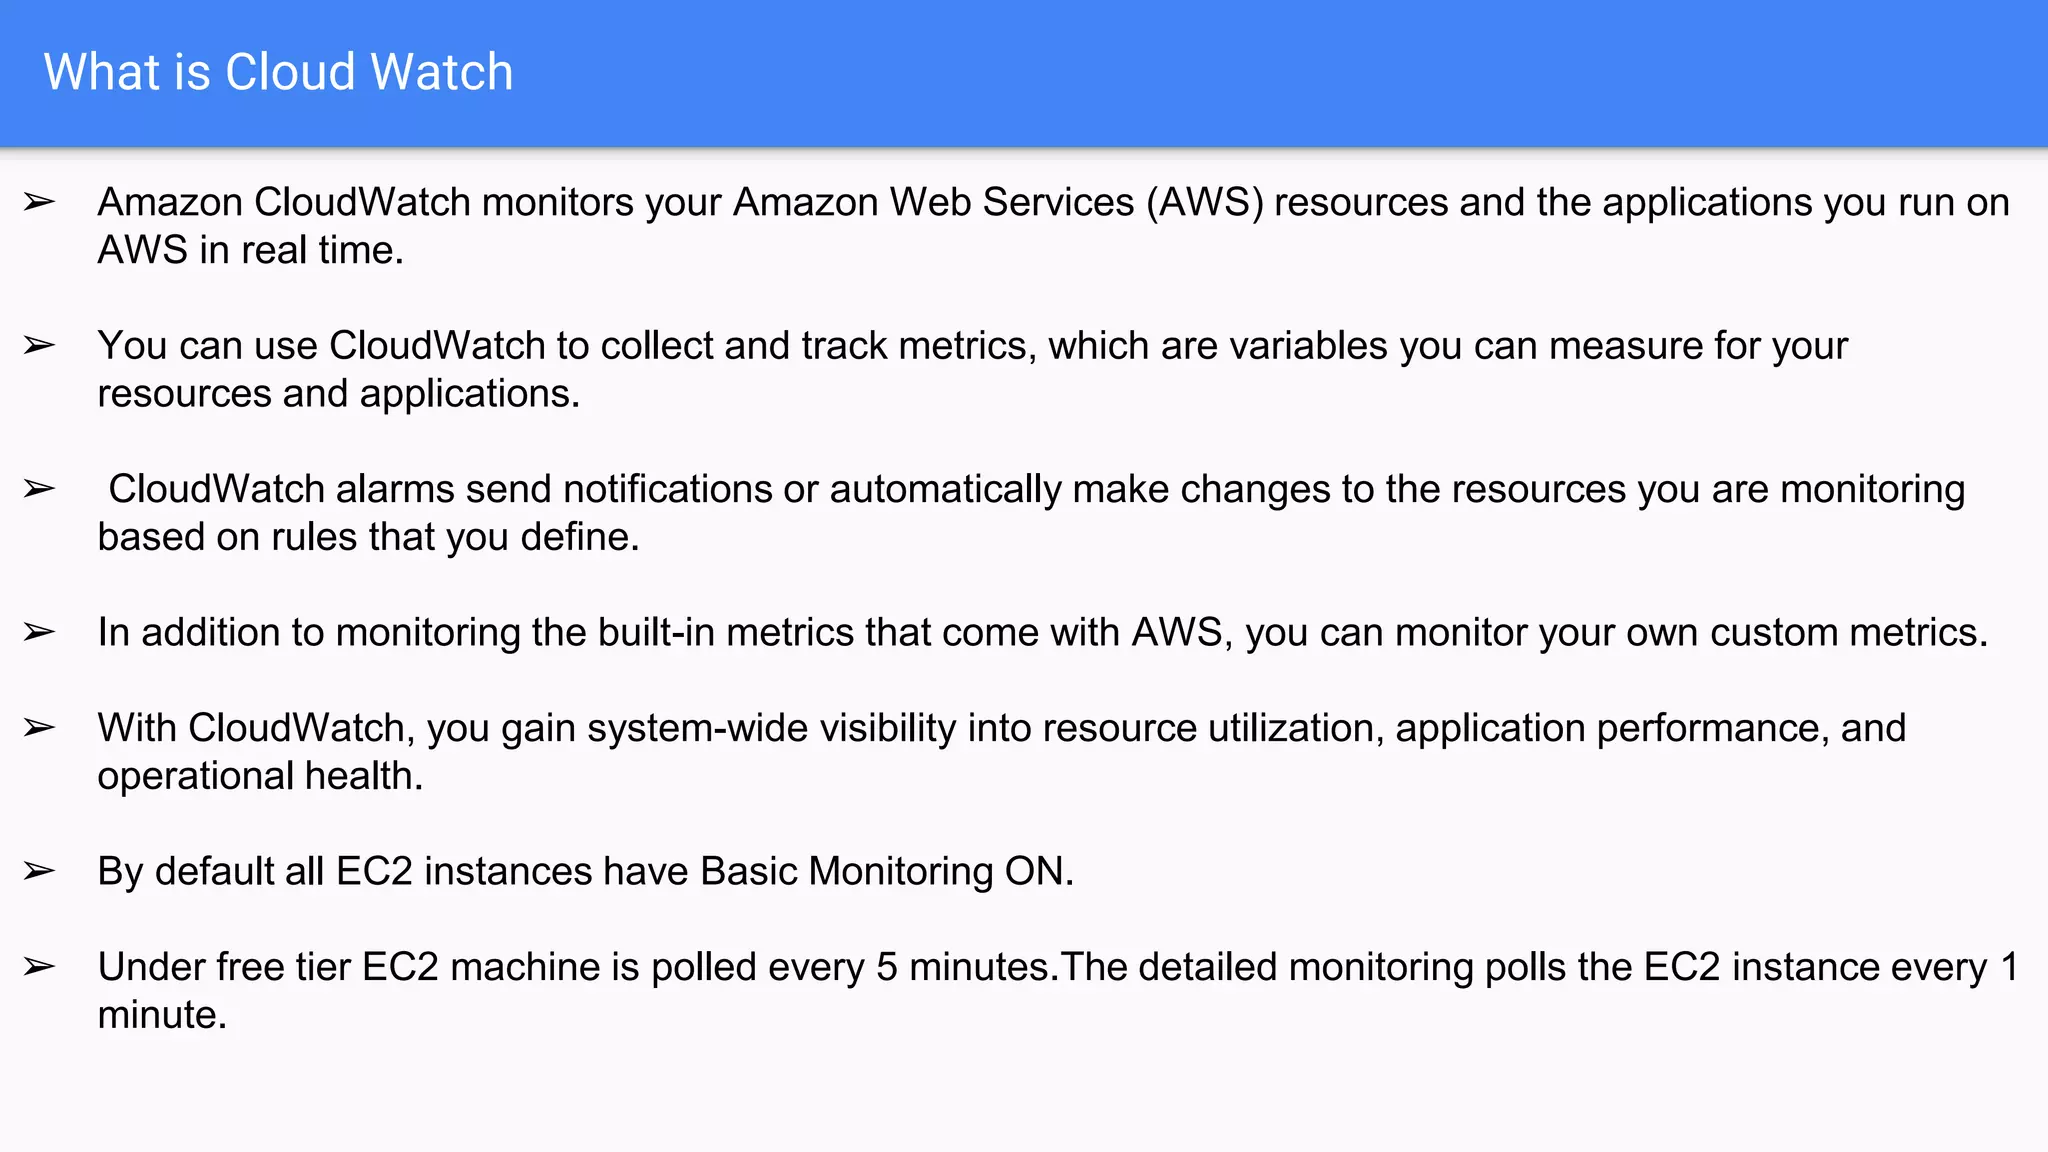
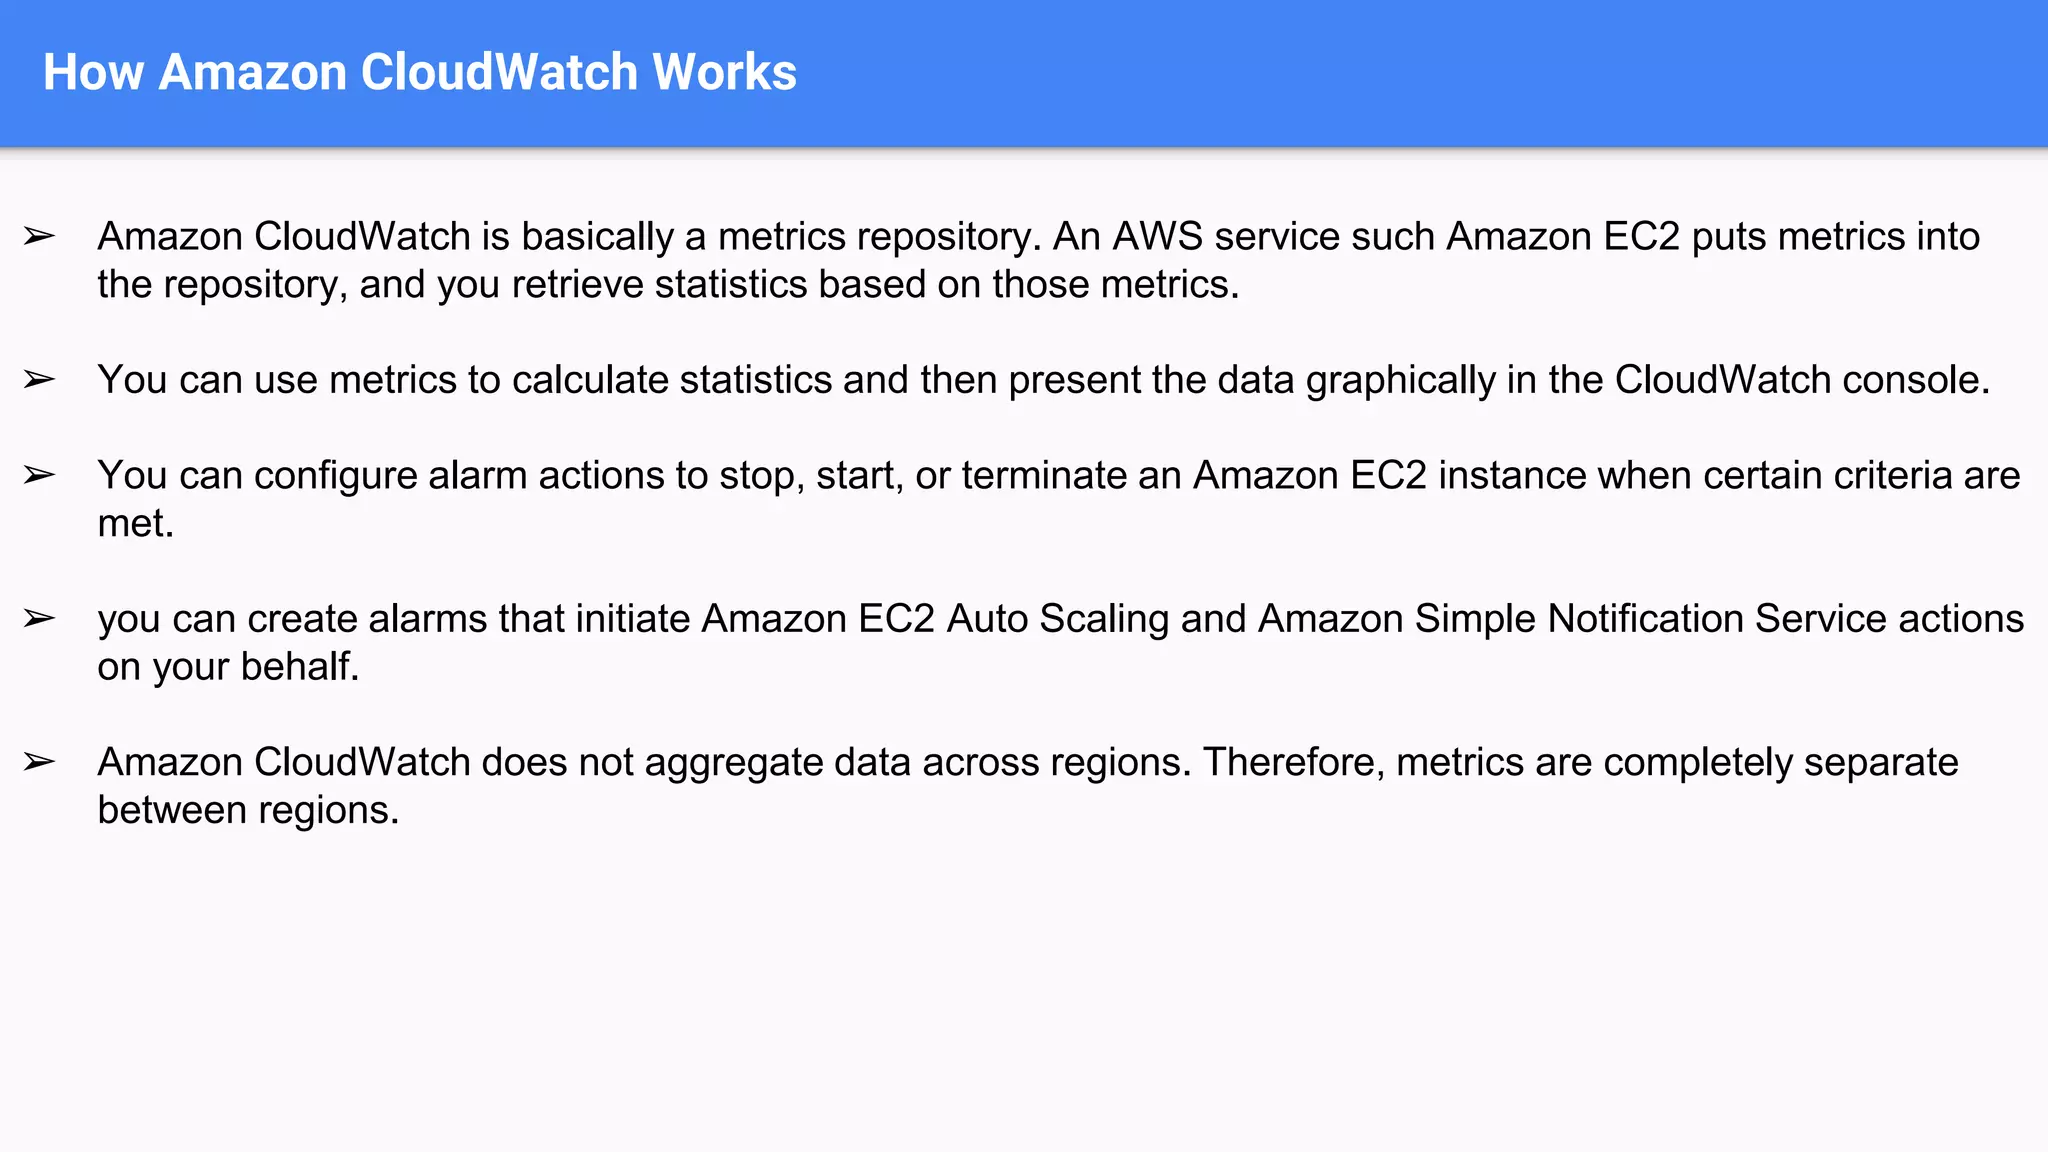

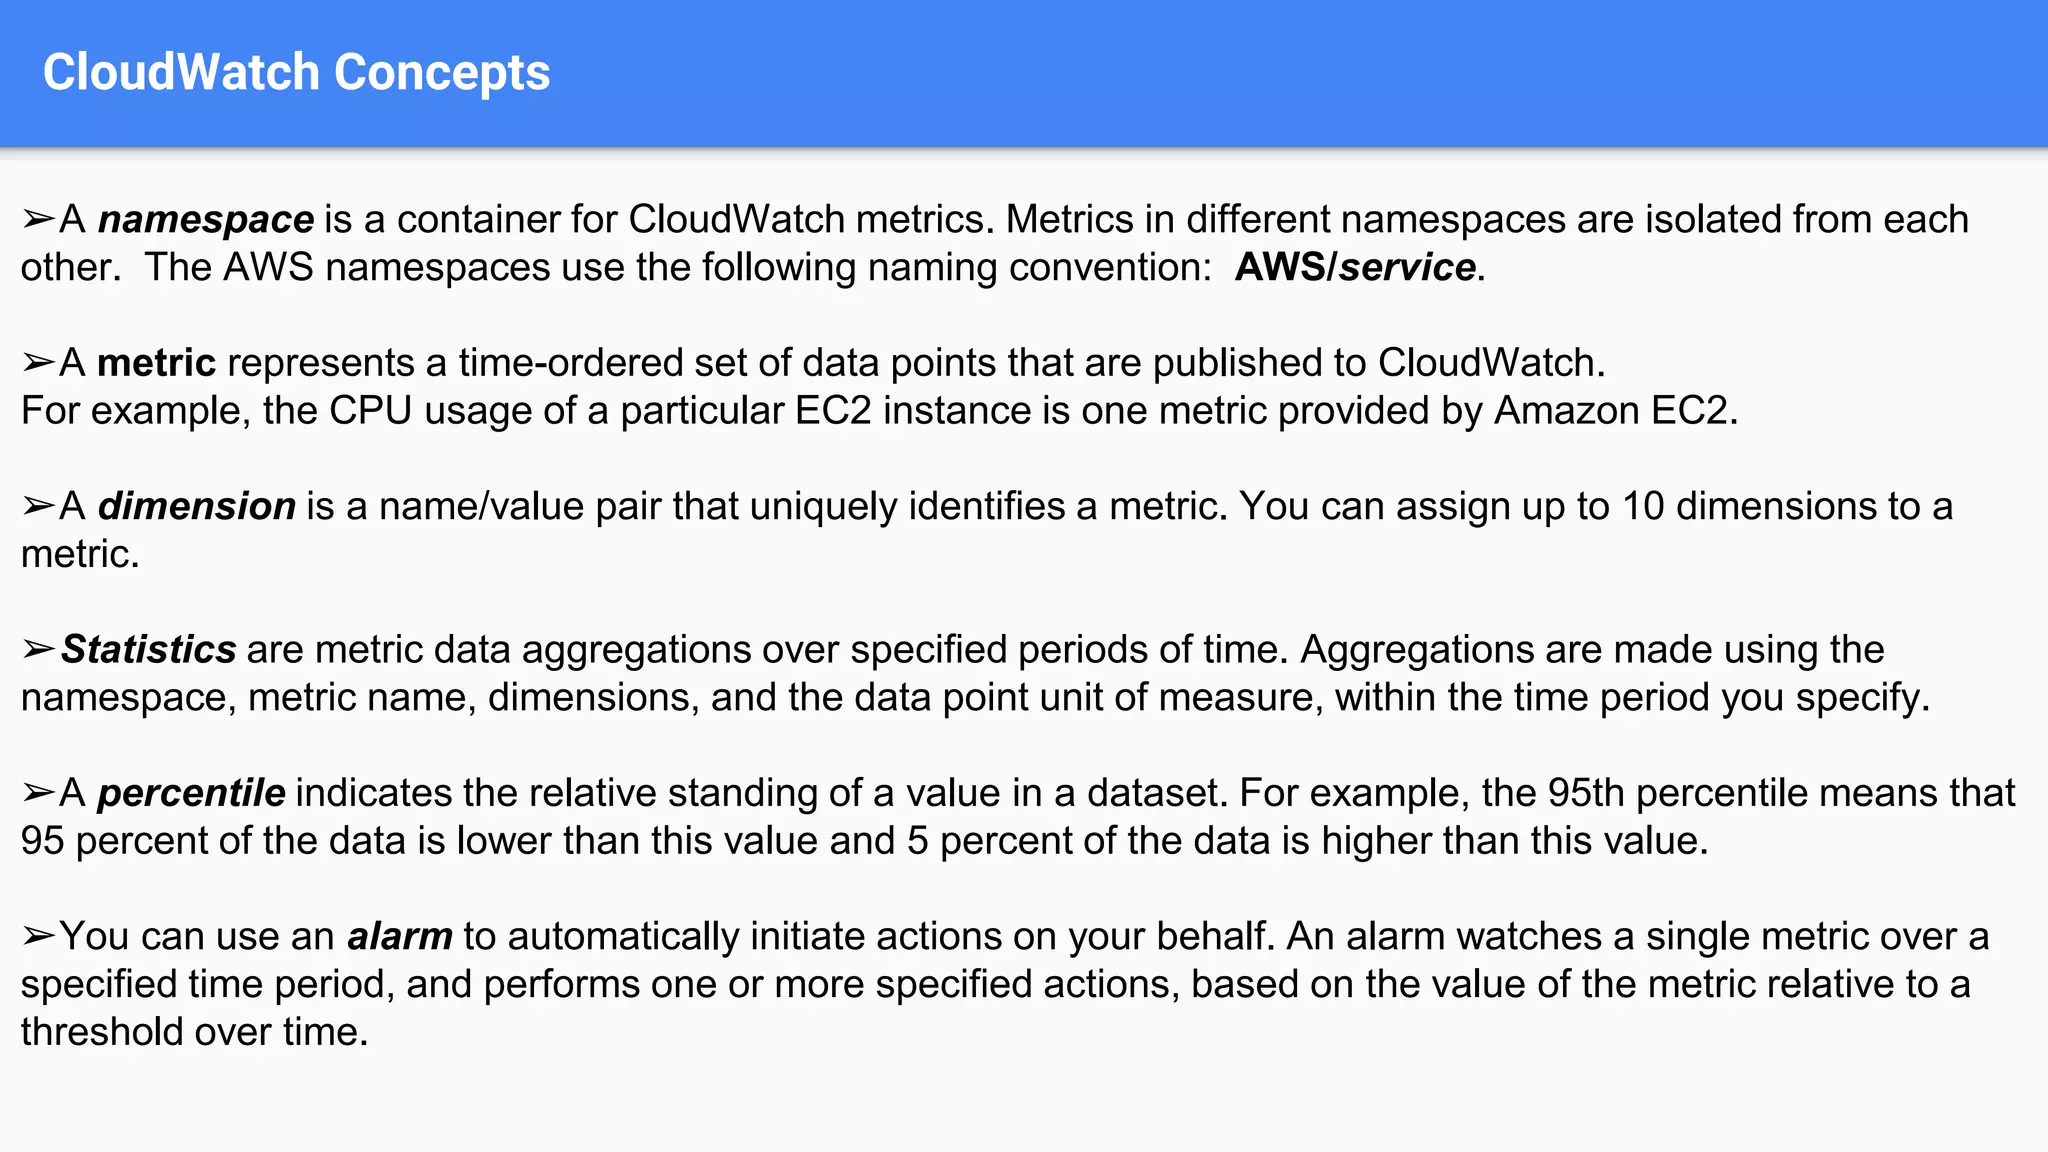
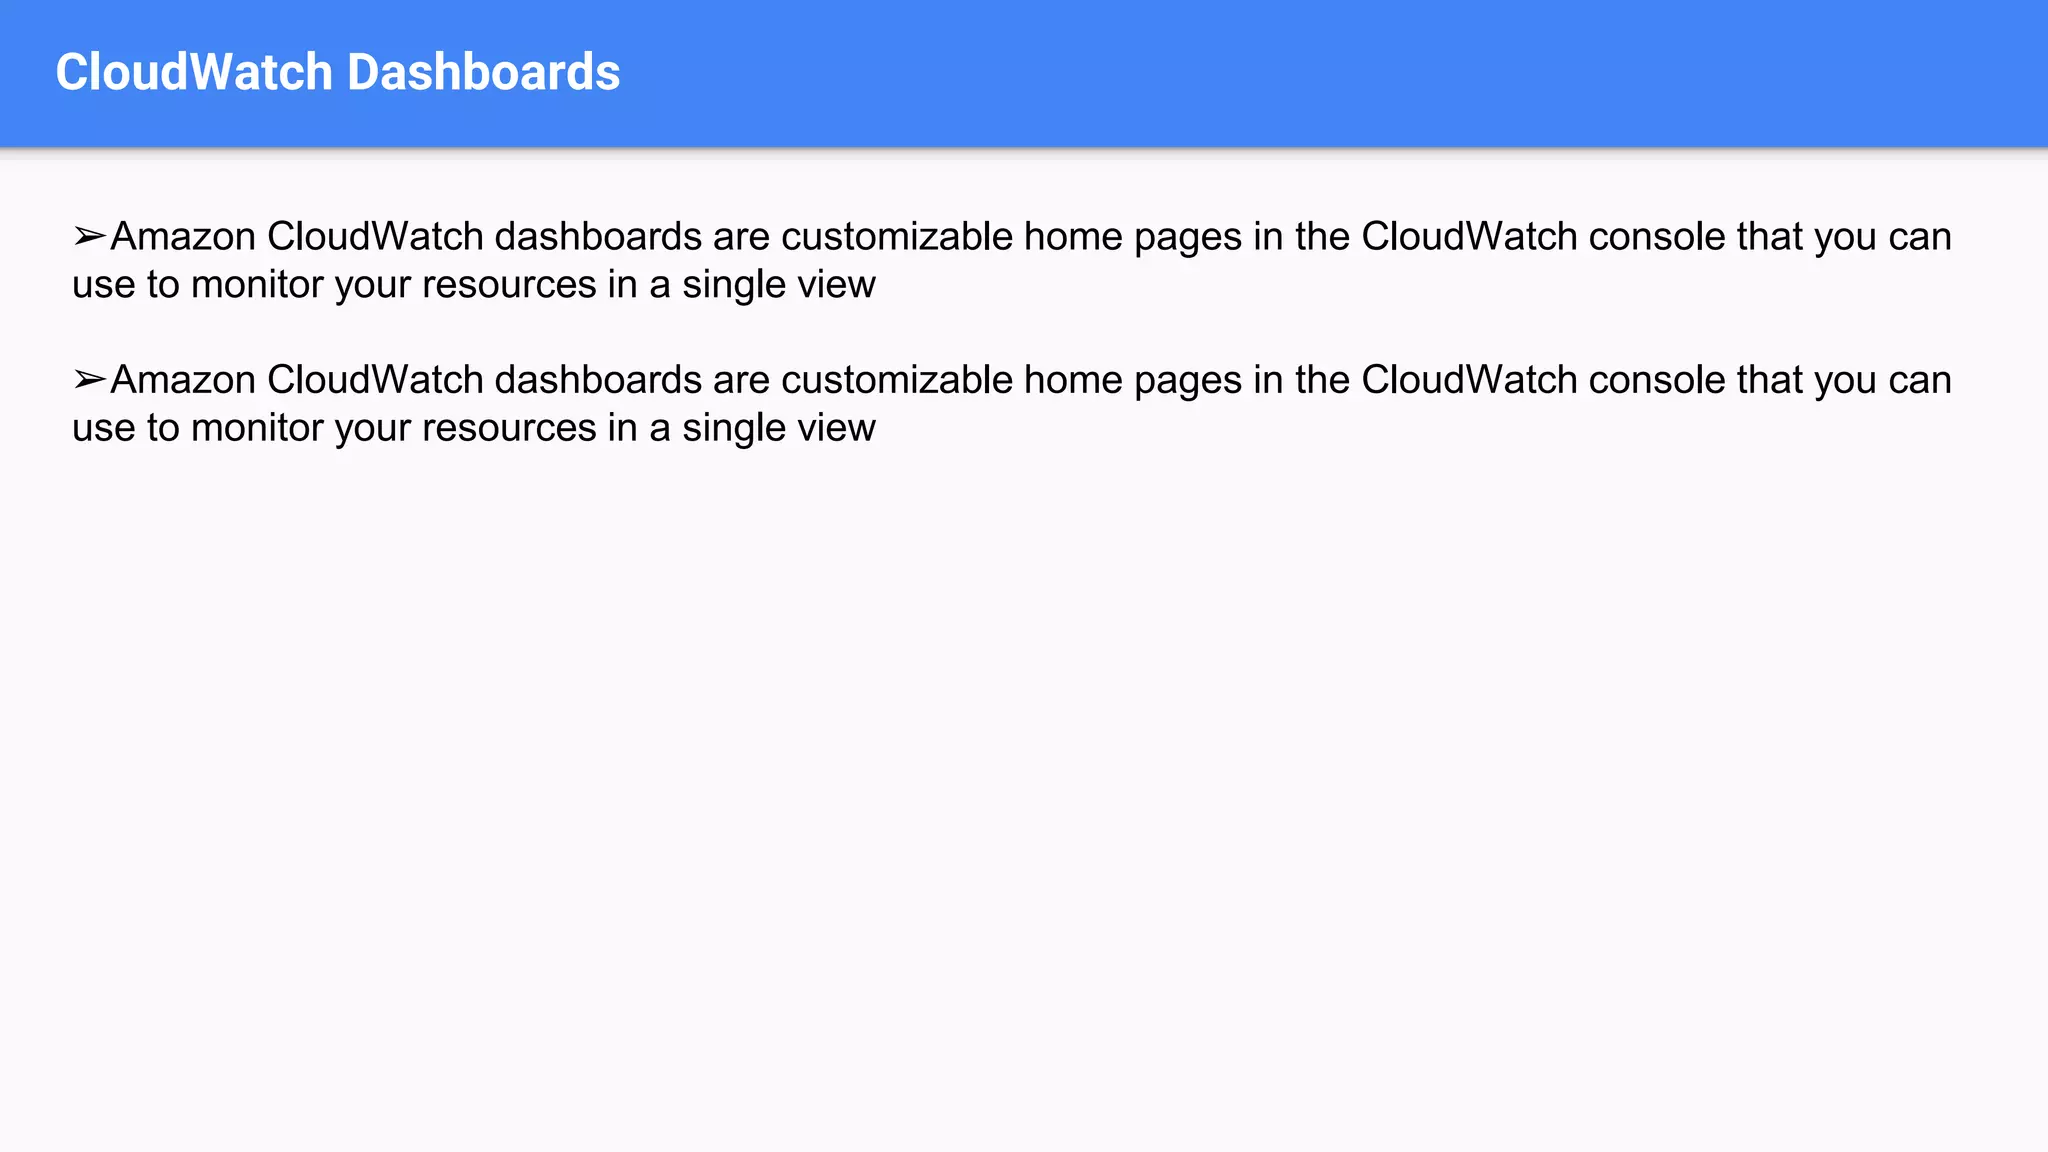

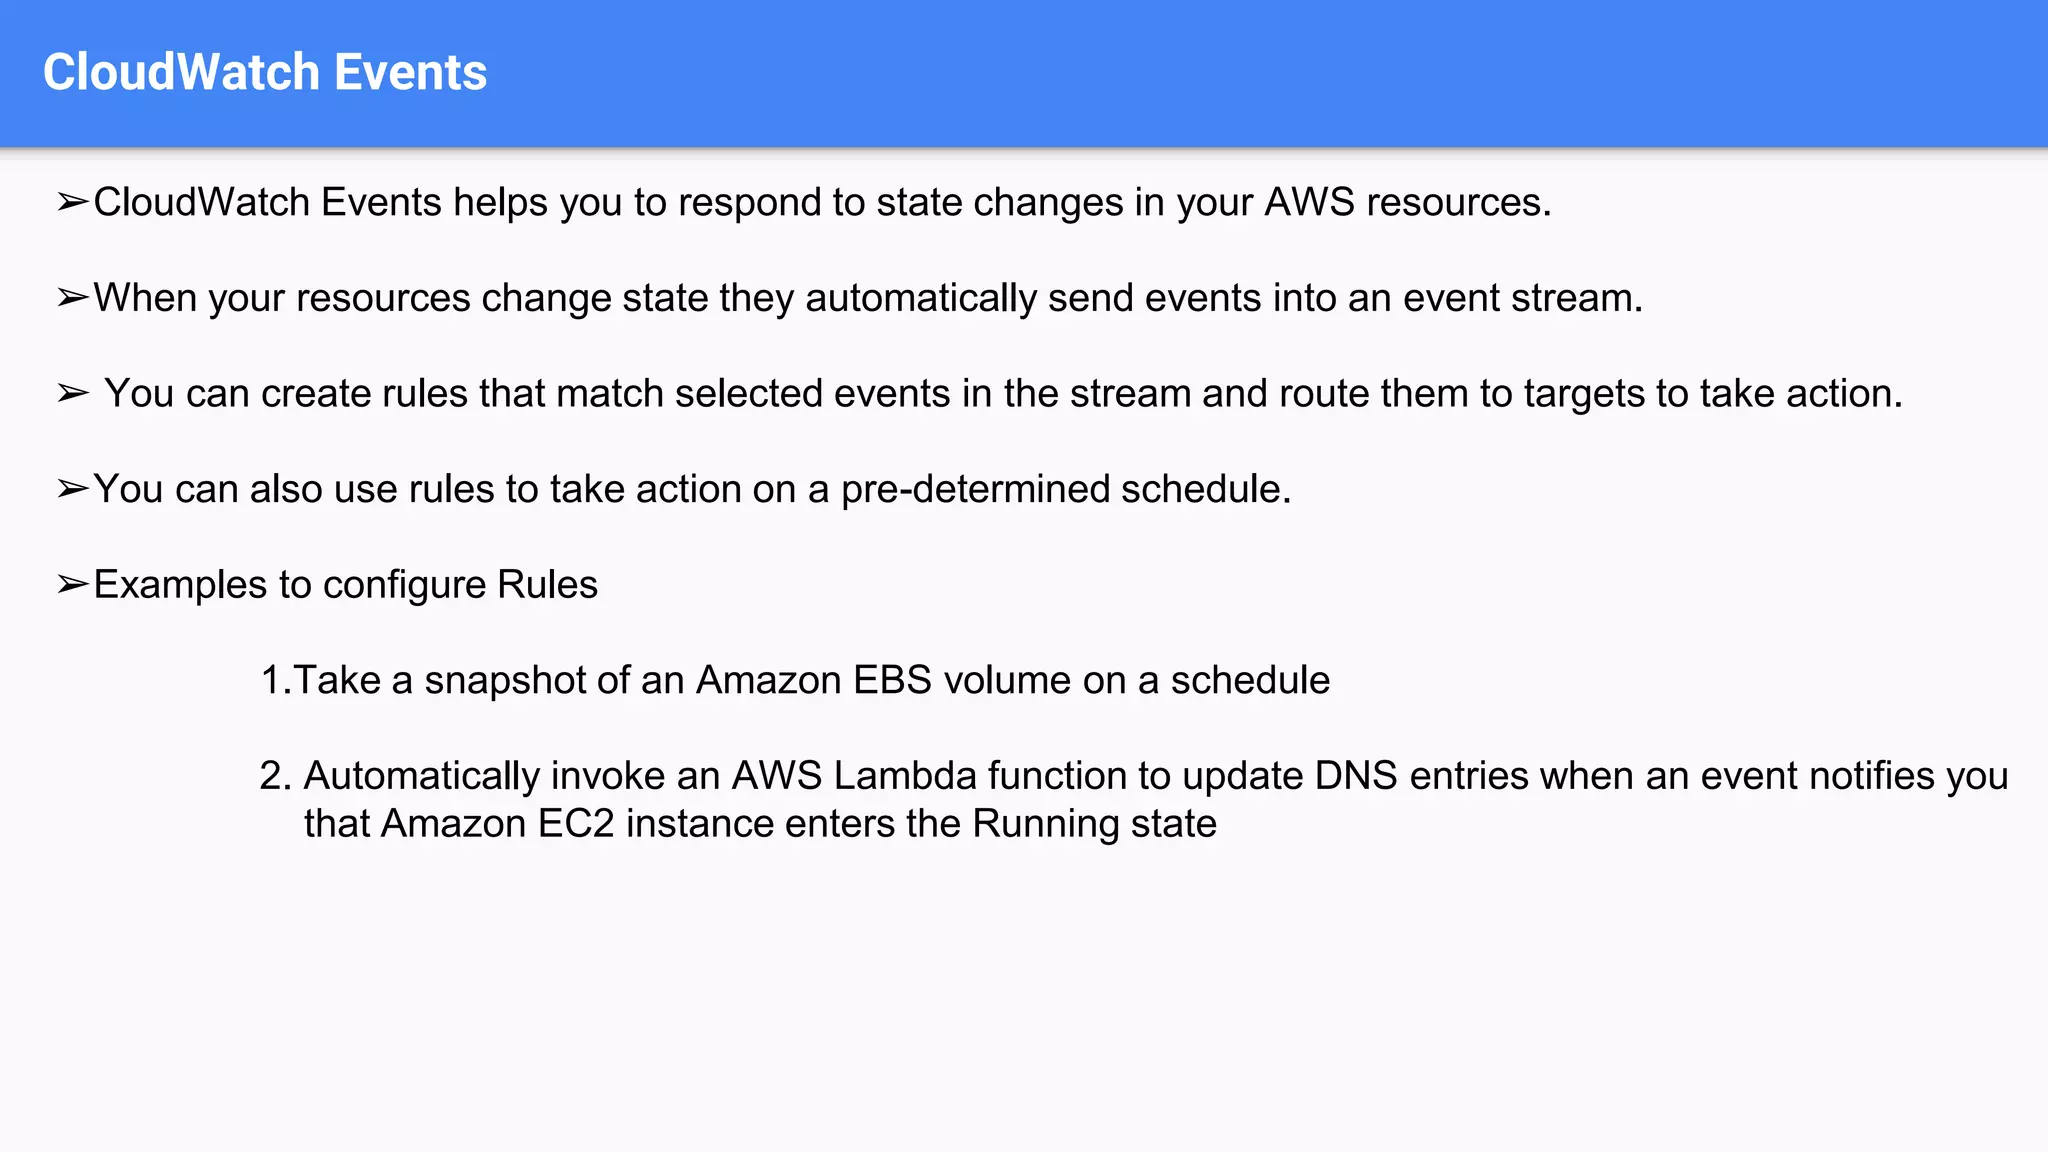
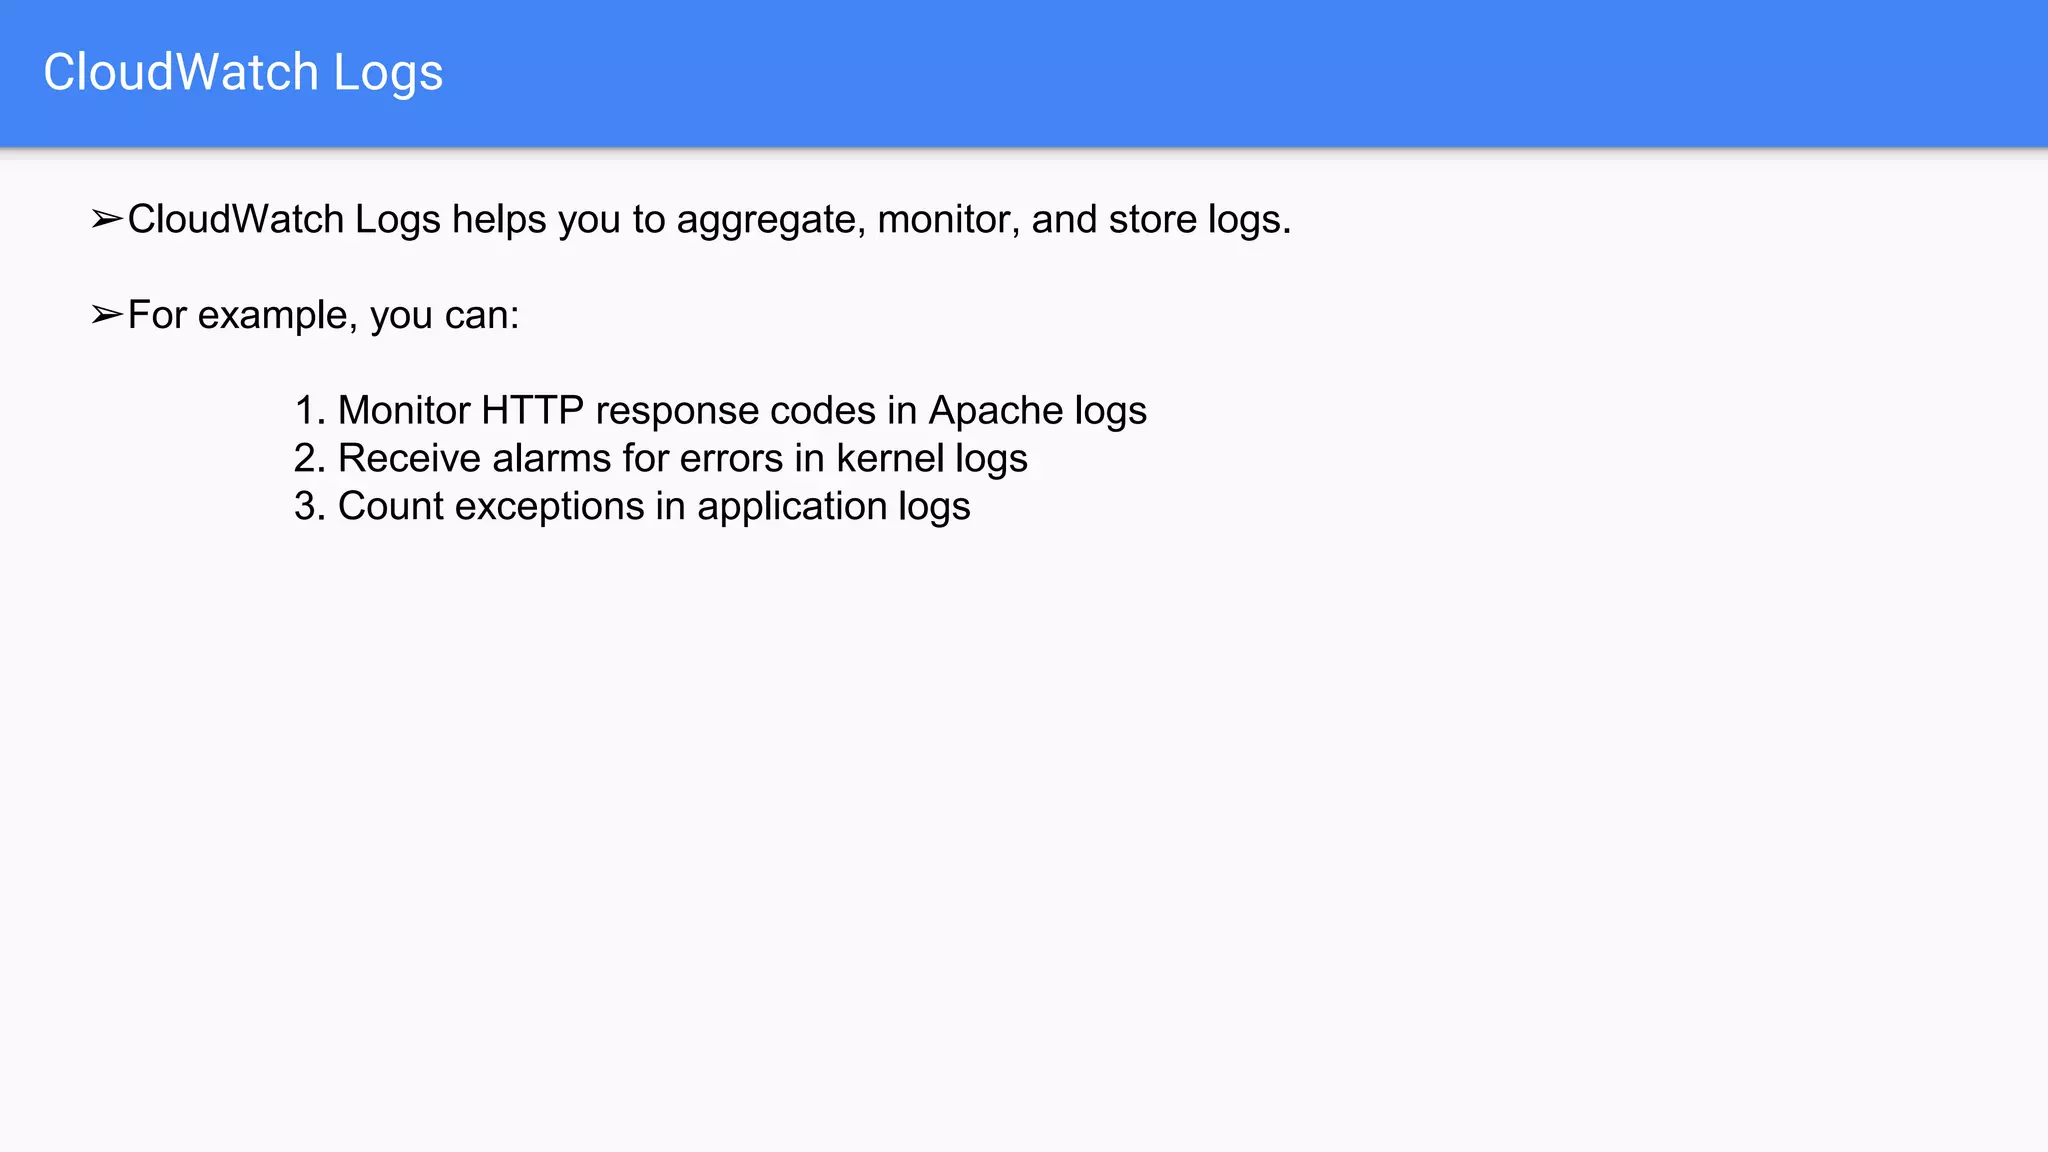

Amazon CloudWatch is a monitoring service for AWS resources, allowing users to collect metrics, set alarms, and gain visibility into resource utilization and application performance. Users can create customizable dashboards, monitor both built-in and custom metrics, and respond to state changes with CloudWatch Events. It supports detailed monitoring, alarm creation, and log aggregation for enhanced operational insights.


![[Webinar] Following the Agile Footprint - zekeLabs](https://cdn.slidesharecdn.com/ss_thumbnails/followingtheagilefootprint-webinar-200130092825-thumbnail.jpg?width=640&height=640&fit=bounds)


