Download to read offline

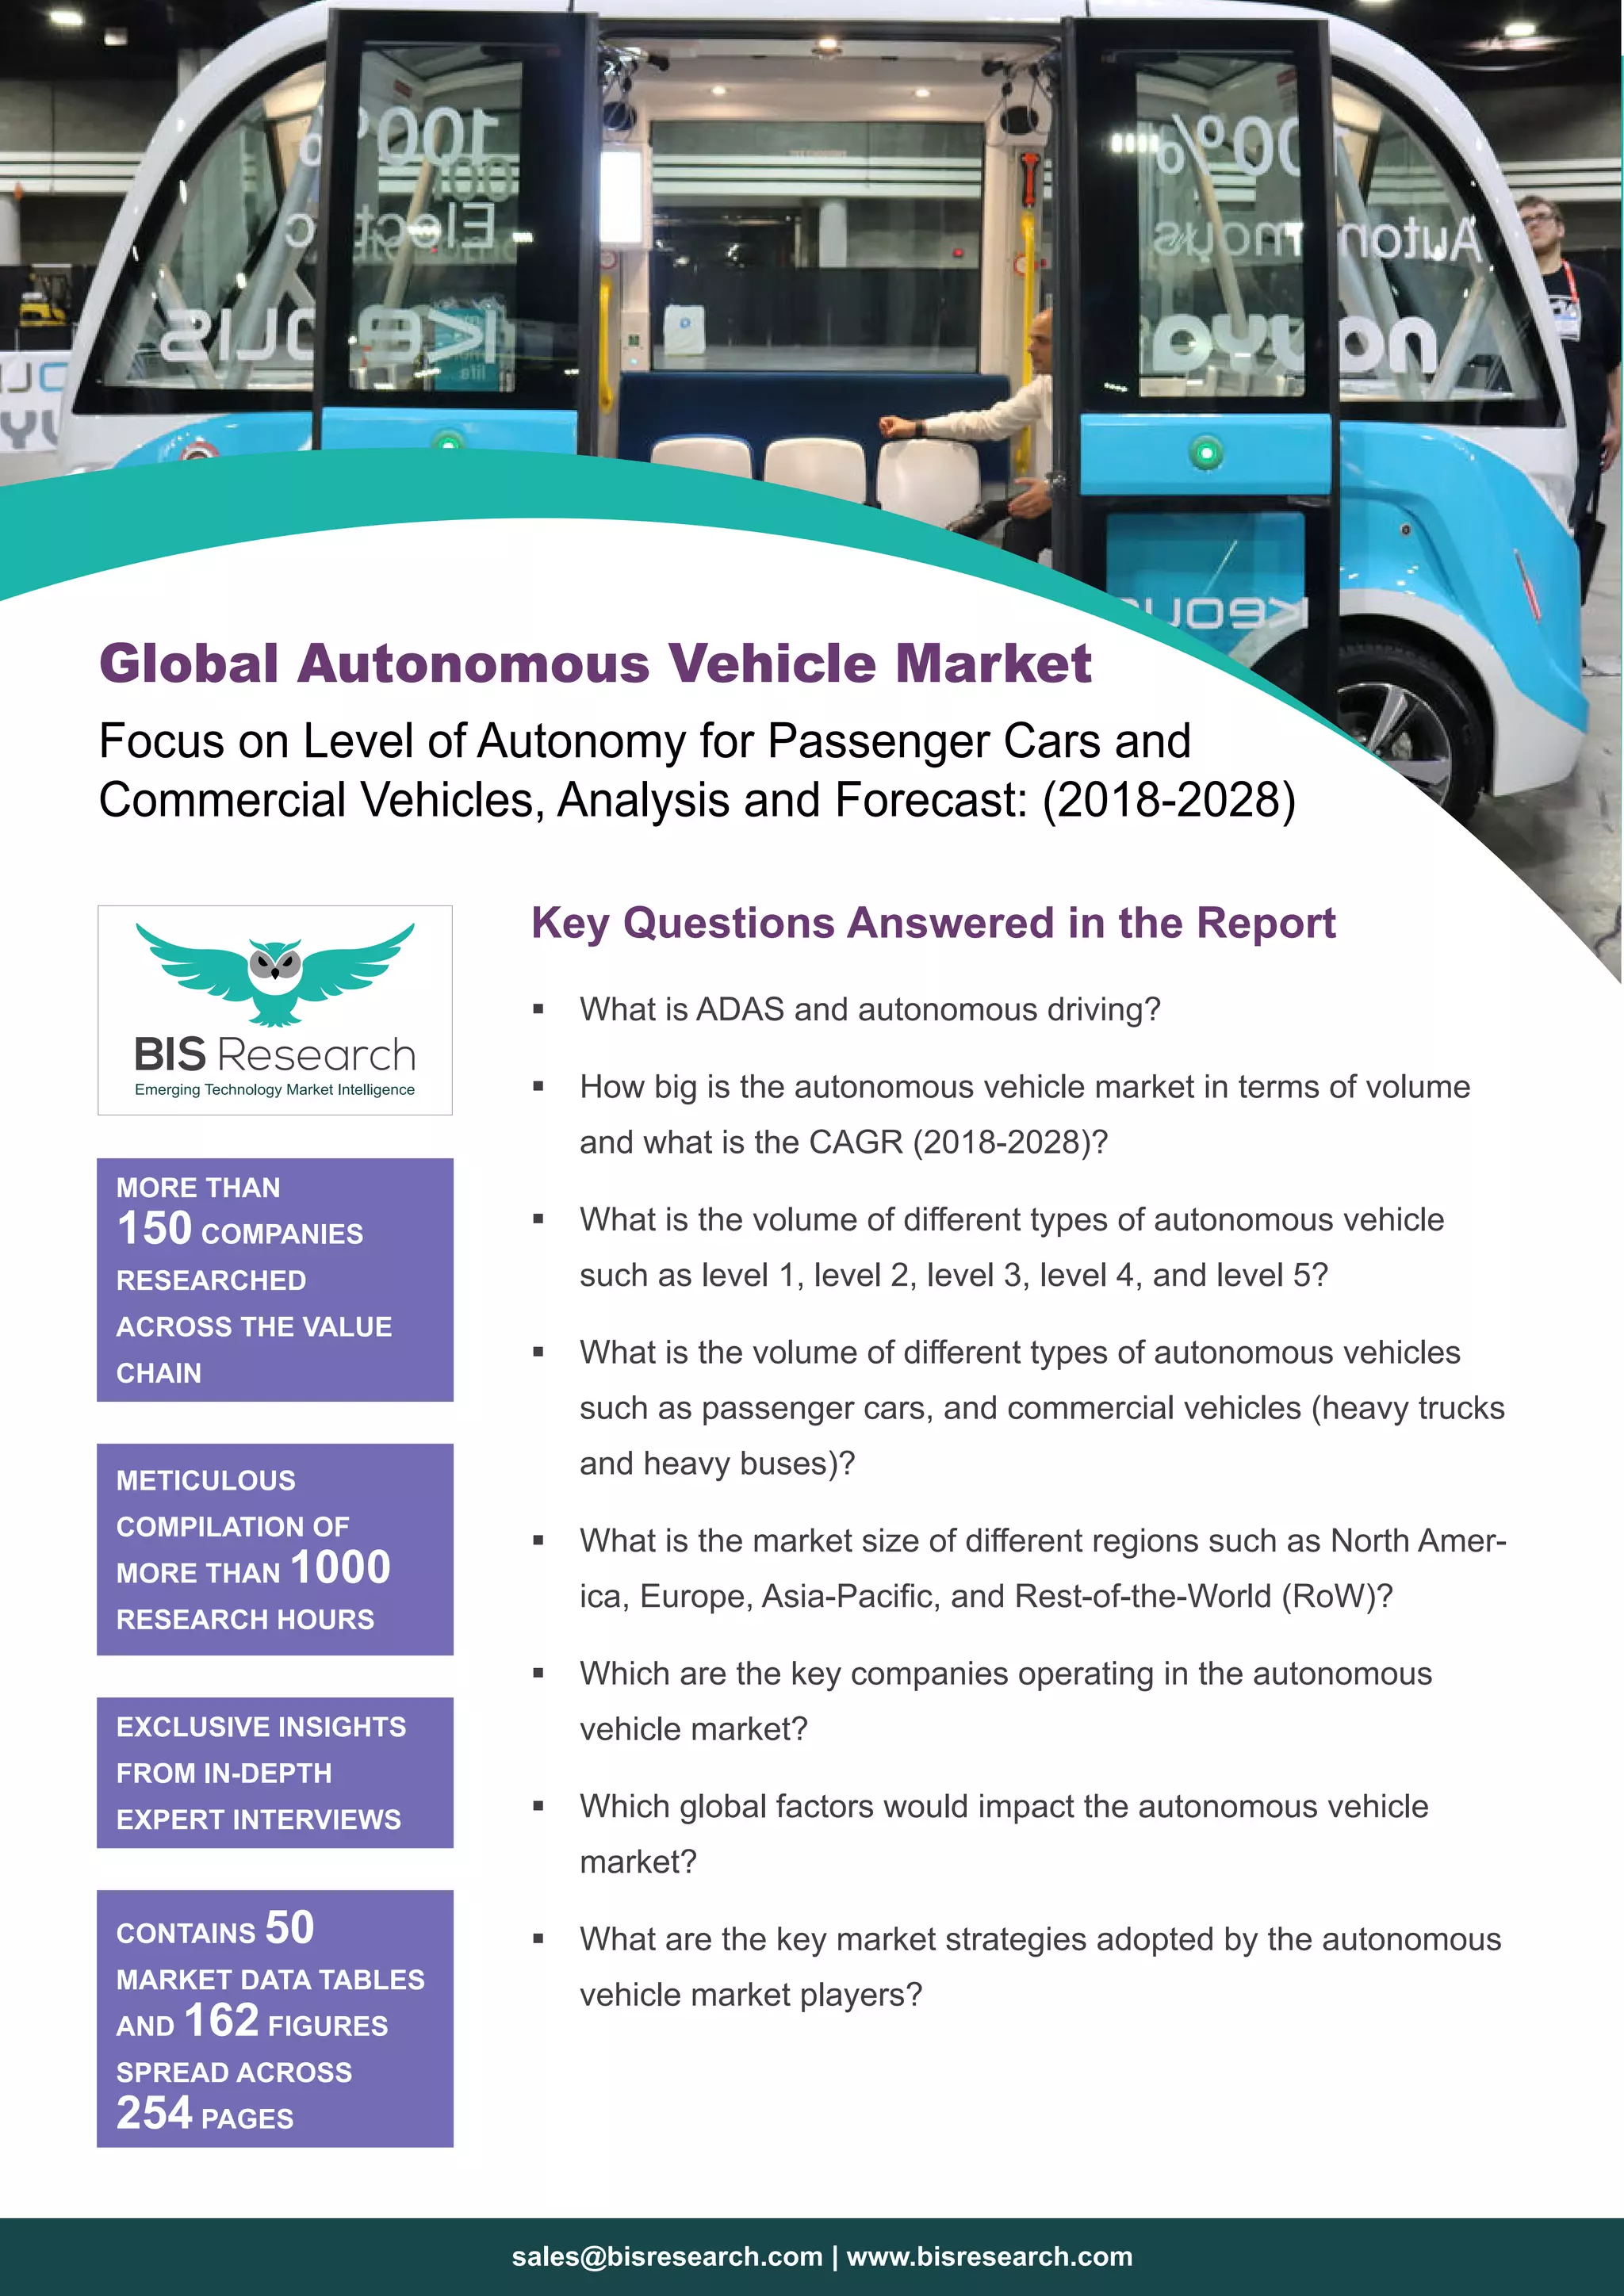


The document provides a comprehensive analysis of the global autonomous vehicle market, detailing its size, volume by vehicle type and level of autonomy, as well as key players and market dynamics from 2018 to 2028. It includes insights from over 150 companies, along with data tables and figures that illustrate market trends and forecasts for different regions. The report also discusses regulatory landscapes, challenges, and opportunities associated with autonomous vehicles.