In our latest population map we bring to you a visualised overview of Australia’s Population and Generational Profile, to help you understand the demographics of this great country.
McCrindle 2025 |Source: McCrindle, ABS
22
23
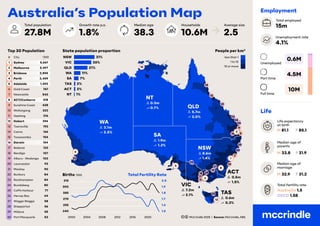
Australia’s Population Map
City
Sydney
Melbourne
Brisbane
Perth
Adelaide
Gold Coast
Newcastle
ACT/Canberra
Sunshine Coast
Wollongong
Geelong
Hobart
Townsville
Cairns
Toowoomba
Darwin
Ballarat
Bendigo
Albury - Wodonga
Launceston
Mackay
Bunbury
Rockhampton
Bundaberg
Coffs Harbour
Hervey Bay
Wagga Wagga
Shepparton
Mildura
Port Macquarie
#
1
2
3
4
5
6
7
8
9
10
11
12
13
14
15
16
17
18
19
20
21
22
23
24
25
26
27
28
29
30
‘ 000
5,667
5,497
2,855
2,459
1,492
767
542
518
428
323
316
256
192
166
154
154
122
107
103
93
90
84
84
80
77
64
58
56
55
53
Top 30 Population
27.8M 1.8%
Growth rate p.a.
10.6M
Households
38.3
Median age
2.5
Average size
Total population
NSW
8.6m
1.4%
NT
0.3m
0.7% QLD
5.7m
2.0%
VIC
7.2m
2.1%
WA
3.1m
2.5%
SA
1.9m
1.2%
TAS
0.6m
0.3%
ACT
0.5m
1.5%
State population proportion
NSW
VIC
QLD
WA
SA
TAS
NT
31%
26%
21%
11%
7%
2%
ACT 2%
1%
less than 1
1 to 10
10 or more
Births ‘000 Total Fertility Rate
2008
2000 2004
240
285
270
255
315
300
1.5
2.0
1.9
1.6
1.7
1.8
2020
2016
2012
Employment
Life
Unemployment rate
4.1%
Total employed
15m
Full time
Part time
Unemployed
0.6M
4.5M
10M
Life expectancy
at birth
M 81.1 F 85.1
Median age of
parents
M 33.8 F 31.9
Median age of
marriage
M 32.9 F 31.2
Total Fertility rate
Australia 1.5
OECD 1.58
People per km2
2.
‘35 ‘45 ‘55‘65 ‘75 ‘85 ‘95 ‘05 ‘15 ‘25
1930 1940 1950 1960 1970 1980 1990 2000 2010 2020
1940 1960 1980 2000 2020
0
00
00
00
00
BB X Y Z α
B
Population by year of birth
Population by year of birth
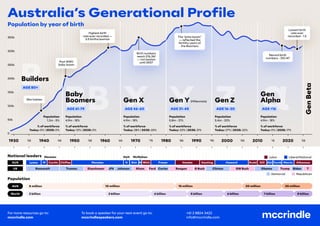
Builders
National leaders
Lyons M Menzies H Gtn M Whit Fraser Hawke Keating Howard Rudd Gill Abt Turnb
Liberal/National
Morris Albanese
Labor
Curtin Chifley
Population
Nixon
Eisenhower Ford Reagan G Bush GW Bush Trump T
Roosevelt
AUS 5 million 10 million 15 million 20 million 25 million
World
AUS
US
3 billion
2 billion 4 billion 5 billion 7 billion 8 billion
6 billion
Truman JFK Johnson Carter Clinton Obama Biden
Democrat
100k
50k
0
150k
200k
300k
250k
350k
AGE 80+
Baby
Boomers
Population
4.9m - 18%
% of workforce
Today: 12% | 2035: 0%
AGE 61-79
Gen X
Population
4.9m - 18%
% of workforce
Today: 28% | 2035: 20%
AGE 46-60
Gen Y (Millennials)
Population
5.8m - 21%
% of workforce
Today: 33% | 2035: 31%
AGE 31-45
Gen Z
Population
5.4m - 20%
% of workforce
Today: 27% | 2035: 32%
AGE 16-30
Gen
Alpha
Gen
Beta
Population
4.9m - 18%
% of workforce
Today: 0% | 2035: 17%
Republican
AGE 16
For more resources go to:
mccrindle.com
To book a speaker for your next event go to:
mccrindlespeakers.com
+61 2 8824 3422
info@mccrindle.com
Population
1.2m - 5%
% of workforce
Today: 0% | 2035: 0%
Australia’s Generational Profile
Menzies Holt McMahon
Record birth
numbers - 315,147
War babies
Highest birth
rate ever recorded —
3.5 births/woman
The “echo boom”
— reflected the
fertility years of
the Boomers
Birth numbers
reach 276,361
— not beaten
until 2007
Post WWII
baby boom
Lowest birth
rate ever
recorded - 1.5


![제 23회 보아즈(BOAZ) 빅데이터 컨퍼런스 - [MBOAX] : ABSA를 활용한 소비자 반응 분석 기반 운영 효율화 대시보드 설계](https://cdn.slidesharecdn.com/ss_thumbnails/3-1boaz23rdconferencemboax-260203102709-9d519923-thumbnail.jpg?width=640&height=640&fit=bounds)


