
Download as PDF, PPTX
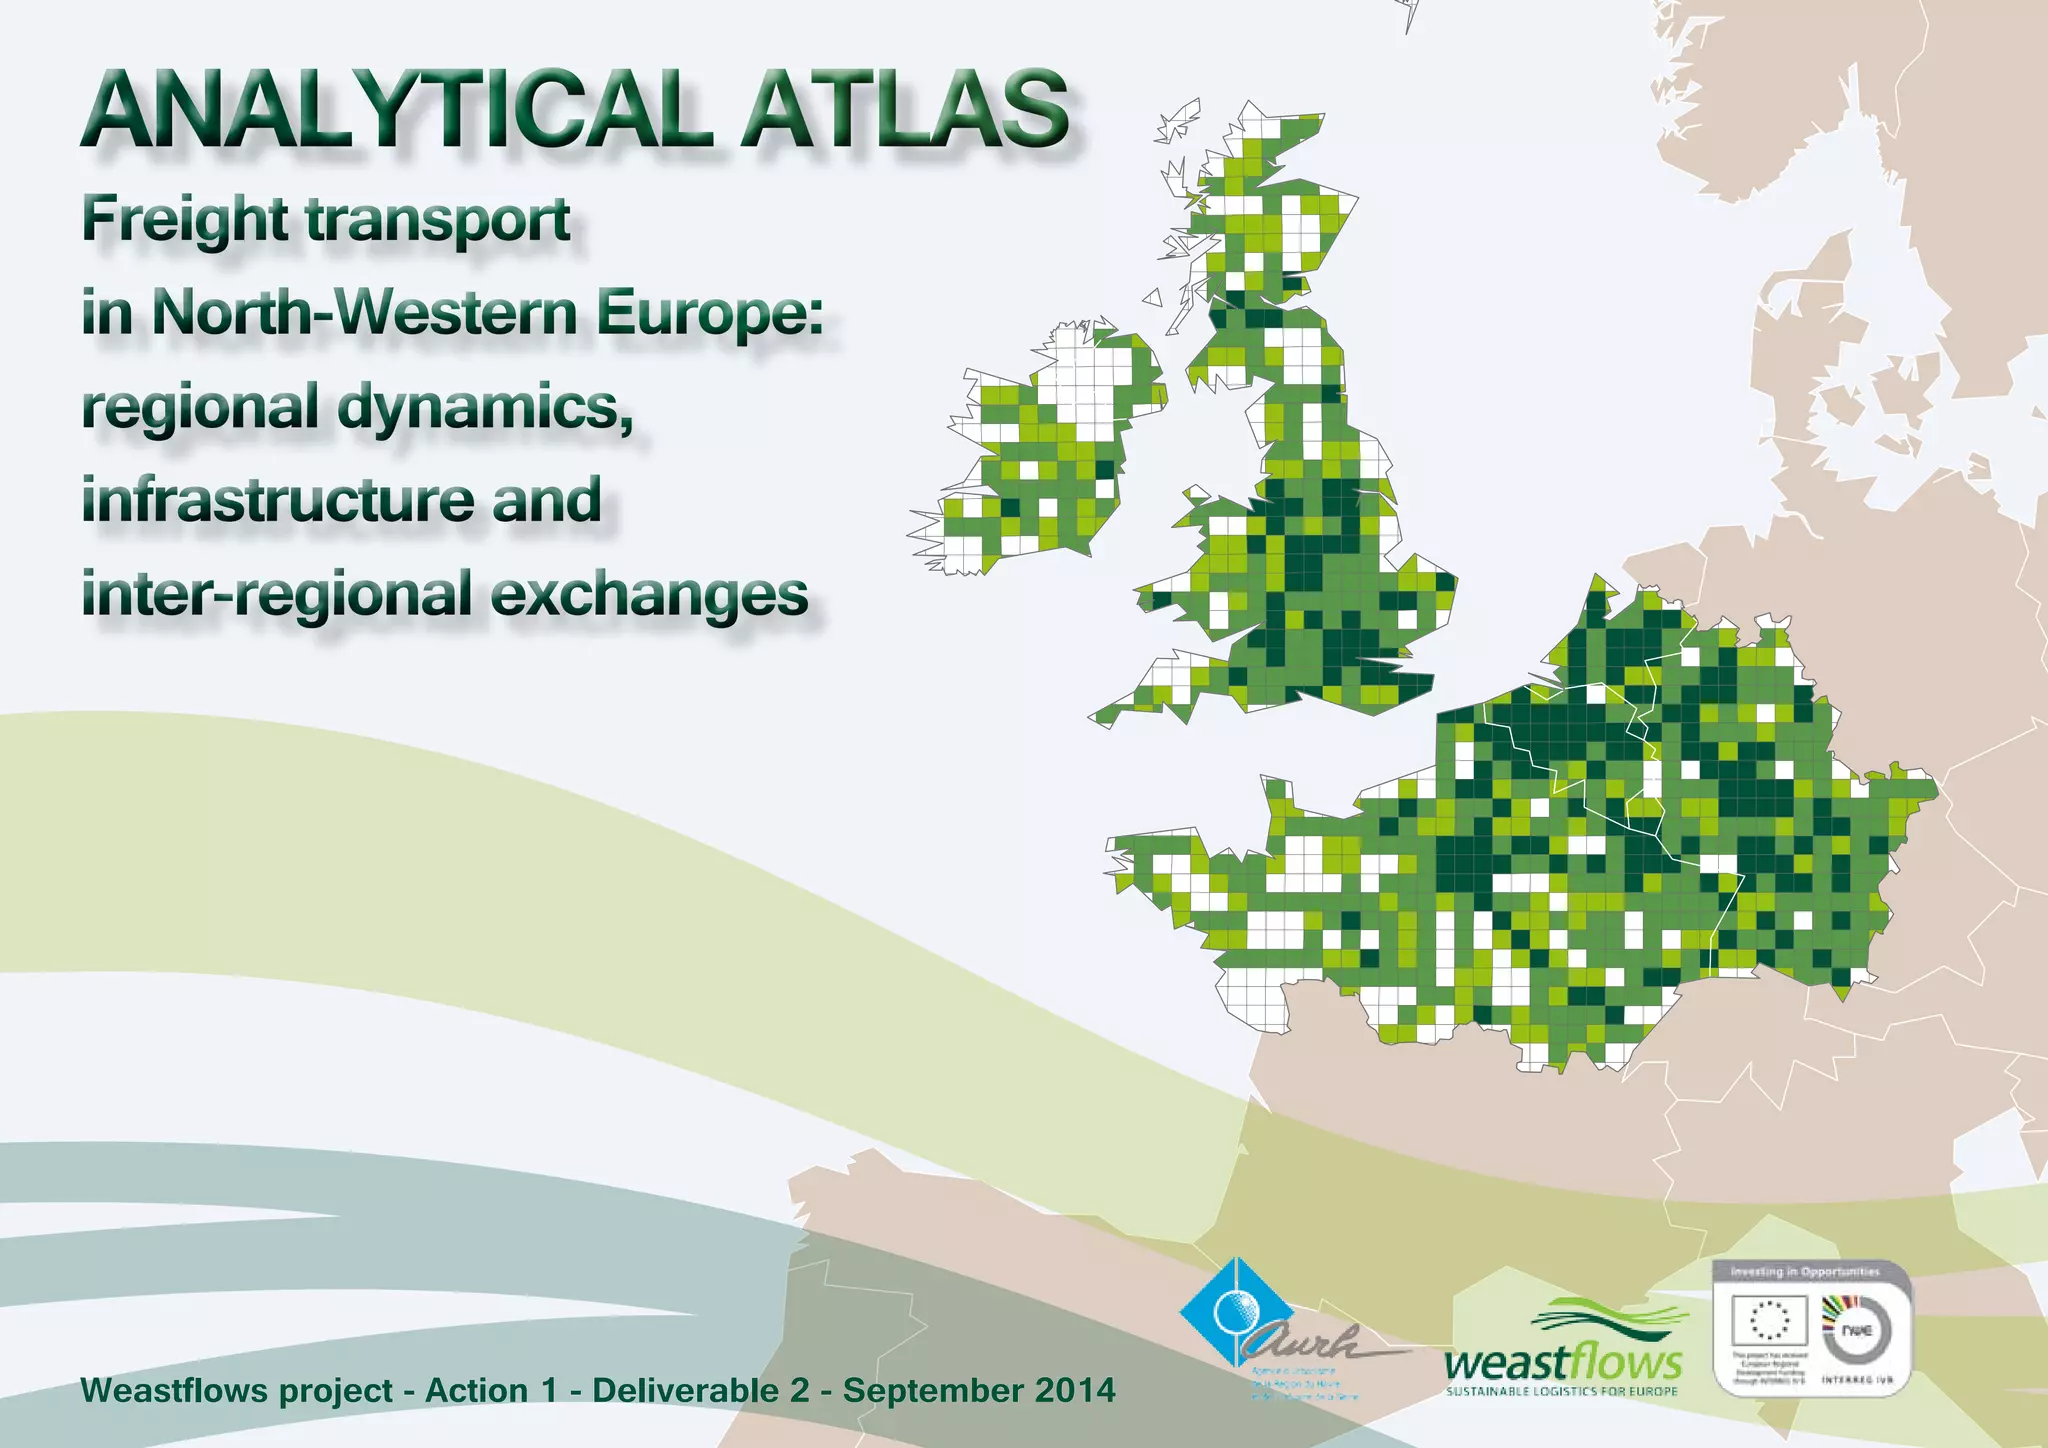
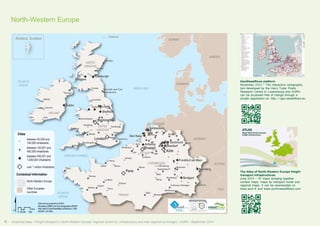
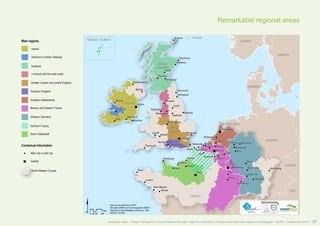

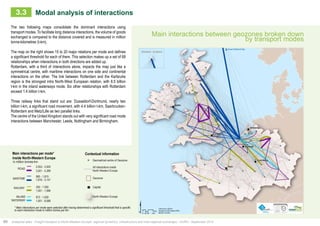
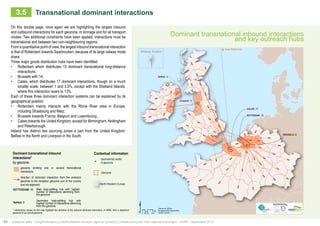
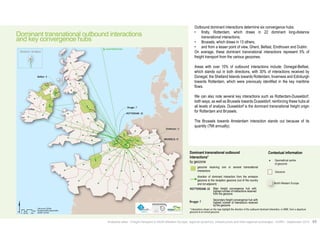
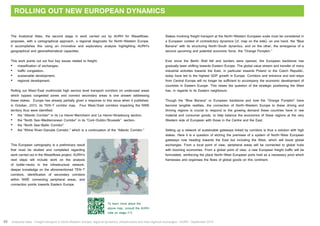
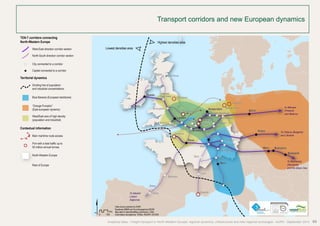
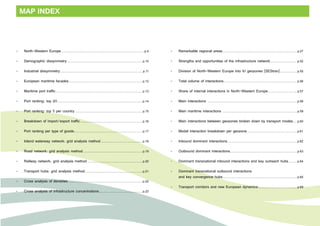
This document provides a summary of freight transport in Northwestern Europe, analyzing infrastructure, regional dynamics, and inter-regional exchanges. It is divided into three parts: 1) A geographical analysis of the region, examining territorial organization, maritime organization, and transport infrastructure networks. 2) A focus on 11 key regions in Northwestern Europe, providing quantitative and qualitative analysis of each. 3) An analysis of interactions between regions, including a general analysis broken down by region, key interactions, modal analysis, and dominant interactions between regions.


