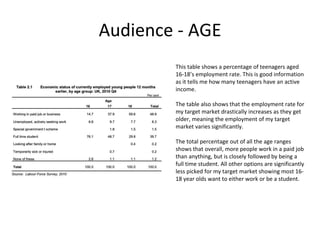
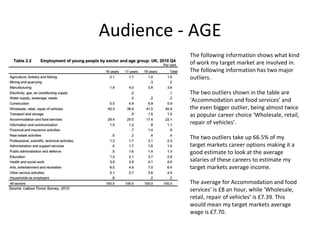
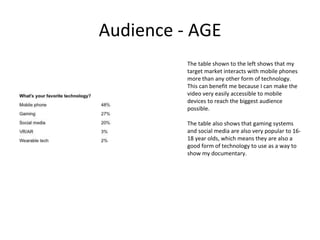
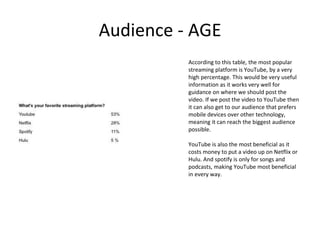
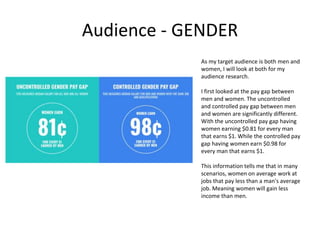
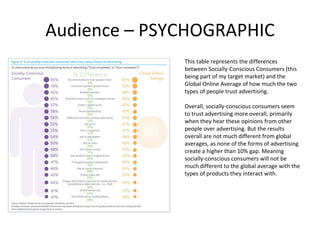
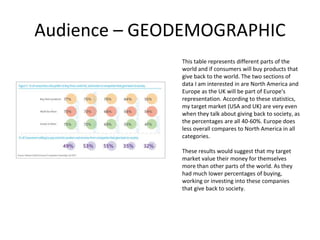
Audience Research
Laurence Archer
Audience - AGE
This table shows a percentage of teenagers aged
16-18’s employment rate. This is good information
as it tells me how many teenagers have an active
income.
The table also shows that the employment rate for
my target market drastically increases as they get
older, meaning the employment of my target
market varies significantly.
The total percentage out of all the age ranges
shows that overall, more people work in a paid job
than anything, but is closely followed by being a
full time student. All other options are significantly
less picked for my target market showing most 16-
18 year olds want to either work or be a student.
Audience - AGE
The following information shows what kind
of work my target market are involved in.
The following information has two major
outliers.
The two outliers shown in the table are
‘Accommodation and food services’ and
the even bigger outlier, being almost twice
as popular career choice ‘Wholesale, retail,
repair of vehicles’.
The two outliers take up 66.5% of my
target markets career options making it a
good estimate to look at the average
salaries of these careers to estimate my
target markets average income.
The average for Accommodation and food
services’ is £8 an hour, while ‘Wholesale,
retail, repair of vehicles’ is £7.39. This
would mean my target markets average
wage is £7.70.
Audience - AGE
The table shown to the left shows that my
target market interacts with mobile phones
more than any other form of technology.
This can benefit me because I can make the
video very easily accessible to mobile
devices to reach the biggest audience
possible.
The table also shows that gaming systems
and social media are also very popular to 16-
18 year olds, which means they are also a
good form of technology to use as a way to
show my documentary.
Audience - AGE
According to this table, the most popular
streaming platform is YouTube, by a very
high percentage. This would be very useful
information as it works very well for
guidance on where we should post the
video. If we post the video to YouTube then
it can also get to our audience that prefers
mobile devices over other technology,
meaning it can reach the biggest audience
possible.
YouTube is also the most beneficial as it
costs money to put a video up on Netflix or
Hulu. And spotify is only for songs and
podcasts, making YouTube most beneficial
in every way.
Audience - GENDER
As my target audience is both men and
women, I will look at both for my
audience research.
I first looked at the pay gap between
men and women. The uncontrolled
and controlled pay gap between men
and women are significantly different.
With the uncontrolled pay gap having
women earning $0.81 for every man
that earns $1. While the controlled pay
gap having women earn $0.98 for
every man that earns $1.
This information tells me that in many
scenarios, women on average work at
jobs that pay less than a man's average
job. Meaning women will gain less
income than men.
Audience - GENDER
Audience - GENDER
Audience – PSYCHOGRAPHIC
This table represents the differences
between Socially-Conscious Consumers (this
being part of my target market) and the
Global Online Average of how much the two
types of people trust advertising.
Overall, socially-conscious consumers seem
to trust advertising more overall, primarily
when they hear these opinions from other
people over advertising. But the results
overall are not much different from global
averages, as none of the forms of advertising
create a higher than 10% gap. Meaning
socially-conscious consumers will not be
much different to the global average with the
types of products they interact with.
Audience – PSYCHOGRAPHIC
Audience – GEODEMOGRAPHIC
This table represents different parts of the
world and if consumers will buy products that
give back to the world. The two sections of
data I am interested in are North America and
Europe as the UK will be part of Europe's
representation. According to these statistics,
my target market (USA and UK) are very even
when they talk about giving back to society, as
the percentages are all 40-60%. Europe does
less overall compares to North America in all
categories.
These results would suggest that my target
market value their money for themselves
more than other parts of the world. As they
had much lower percentages of buying,
working or investing into these companies
that give back to society.
Audience – GEODEMOGRAPHIC
Audience – PRIMARY RESEARCH
Other Audience Catagories
Bibliography
Bibliography
1. (2011)Employers and the recruitment of young people (16-18 year olds):
An evidence review (Conducted 01/10/20)
2. (2019) The 10 Most Popular Things for Teens in 2019(Conducted 01/10/20)
3. (2020) THE STATE OF THE GENDER PAY GAP 2020 (Conducted 02/10/20)
4. (2019)Psychographics and personas: how to get to the truth about why
people buy(Conducted 02/10/20)
5. (2012)WHO IS THE GLOBAL, SOCIALLY-CONSCIOUS
CONSUMER?(Conducted 02/10/20)

Audience research

  • 1.
  • 2.
    Audience - AGE Thistable shows a percentage of teenagers aged 16-18’s employment rate. This is good information as it tells me how many teenagers have an active income. The table also shows that the employment rate for my target market drastically increases as they get older, meaning the employment of my target market varies significantly. The total percentage out of all the age ranges shows that overall, more people work in a paid job than anything, but is closely followed by being a full time student. All other options are significantly less picked for my target market showing most 16- 18 year olds want to either work or be a student.
  • 3.
    Audience - AGE Thefollowing information shows what kind of work my target market are involved in. The following information has two major outliers. The two outliers shown in the table are ‘Accommodation and food services’ and the even bigger outlier, being almost twice as popular career choice ‘Wholesale, retail, repair of vehicles’. The two outliers take up 66.5% of my target markets career options making it a good estimate to look at the average salaries of these careers to estimate my target markets average income. The average for Accommodation and food services’ is £8 an hour, while ‘Wholesale, retail, repair of vehicles’ is £7.39. This would mean my target markets average wage is £7.70.
  • 4.
    Audience - AGE Thetable shown to the left shows that my target market interacts with mobile phones more than any other form of technology. This can benefit me because I can make the video very easily accessible to mobile devices to reach the biggest audience possible. The table also shows that gaming systems and social media are also very popular to 16- 18 year olds, which means they are also a good form of technology to use as a way to show my documentary.
  • 5.
    Audience - AGE Accordingto this table, the most popular streaming platform is YouTube, by a very high percentage. This would be very useful information as it works very well for guidance on where we should post the video. If we post the video to YouTube then it can also get to our audience that prefers mobile devices over other technology, meaning it can reach the biggest audience possible. YouTube is also the most beneficial as it costs money to put a video up on Netflix or Hulu. And spotify is only for songs and podcasts, making YouTube most beneficial in every way.
  • 6.
    Audience - GENDER Asmy target audience is both men and women, I will look at both for my audience research. I first looked at the pay gap between men and women. The uncontrolled and controlled pay gap between men and women are significantly different. With the uncontrolled pay gap having women earning $0.81 for every man that earns $1. While the controlled pay gap having women earn $0.98 for every man that earns $1. This information tells me that in many scenarios, women on average work at jobs that pay less than a man's average job. Meaning women will gain less income than men.
  • 7.
  • 8.
  • 9.
    Audience – PSYCHOGRAPHIC Thistable represents the differences between Socially-Conscious Consumers (this being part of my target market) and the Global Online Average of how much the two types of people trust advertising. Overall, socially-conscious consumers seem to trust advertising more overall, primarily when they hear these opinions from other people over advertising. But the results overall are not much different from global averages, as none of the forms of advertising create a higher than 10% gap. Meaning socially-conscious consumers will not be much different to the global average with the types of products they interact with.
  • 10.
  • 11.
    Audience – GEODEMOGRAPHIC Thistable represents different parts of the world and if consumers will buy products that give back to the world. The two sections of data I am interested in are North America and Europe as the UK will be part of Europe's representation. According to these statistics, my target market (USA and UK) are very even when they talk about giving back to society, as the percentages are all 40-60%. Europe does less overall compares to North America in all categories. These results would suggest that my target market value their money for themselves more than other parts of the world. As they had much lower percentages of buying, working or investing into these companies that give back to society.
  • 12.
  • 13.
  • 14.
  • 15.
  • 16.
    Bibliography 1. (2011)Employers andthe recruitment of young people (16-18 year olds): An evidence review (Conducted 01/10/20) 2. (2019) The 10 Most Popular Things for Teens in 2019(Conducted 01/10/20) 3. (2020) THE STATE OF THE GENDER PAY GAP 2020 (Conducted 02/10/20) 4. (2019)Psychographics and personas: how to get to the truth about why people buy(Conducted 02/10/20) 5. (2012)WHO IS THE GLOBAL, SOCIALLY-CONSCIOUS CONSUMER?(Conducted 02/10/20)