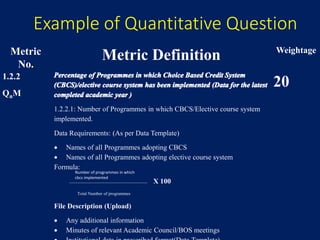
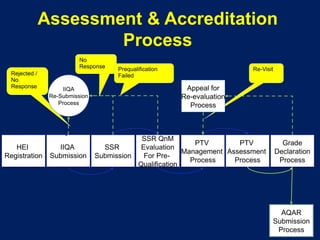
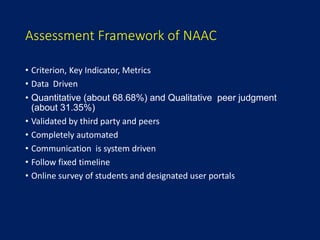
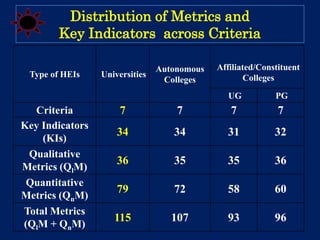
The document outlines the assessment framework of NAAC, detailing the criteria, key indicators, and metrics used in evaluating higher education institutions. It includes a mix of quantitative and qualitative evaluations, emphasizing a data-driven approach validated by peer judgments. The framework consists of seven criteria with specific weightages and indicators aimed at measuring various aspects of institutional quality, such as curricular aspects, teaching-learning processes, research, and governance.
![Quality Indicator Framework(QIF)
Components – (Universities)
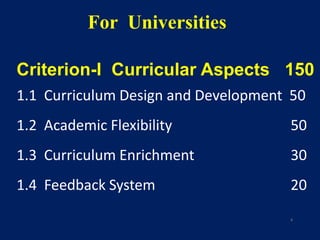
• CRITERION 1: Curricular Aspects [W-150]
4 KEY INDICATORS = ∑ QL METRICS (2) + ∑ QN METRICS (9)
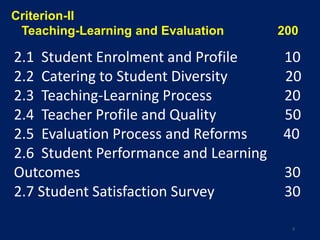
• CRITERION 2 : Teaching- Learning and Evaluation [W-200]
7 KEY INDICATORS = ∑ QL METRICS (6) + ∑ QN METRICS (13)
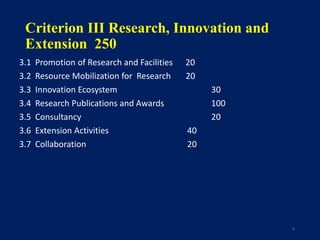
• CRITERION 3: Research, Extension and Innovations [W-250]
7 KEY INDICATORS = ∑ QL METRICS (4) + ∑ QN METRICS (25)
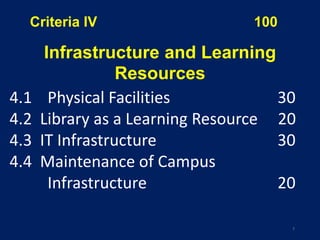
• CRITERION 4: Infrastructure and Learning Resources [W-100]
4 KEY INDICATORS = ∑ QL METRICS (6) + ∑ QN METRICS (9)
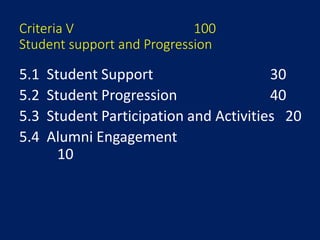
• CRITERION 5 : Student Support and Progression [W-100]
4 KEY INDICATORS = ∑ QL METRICS (2) + ∑ QN METRICS (10)
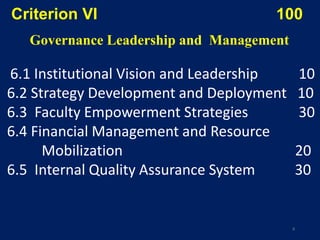
• CRITERION 6 : Governance, Leadership and Management [W-100]
5 KEY INDICATORS = ∑ QL METRICS (9) + ∑ QN METRICS (7)
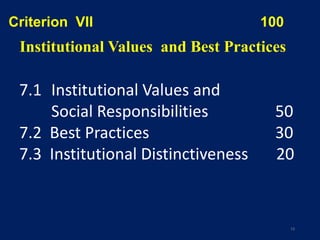
• CRITERION 7: Institutional Values and Best Practices [W-100]
3 KEY INDICATORS = ∑ QL METRICS (7) + ∑ QN METRICS (6)
W=Weight
QL= Qualitative Metric
QN= Quantitative Metric](https://image.slidesharecdn.com/assessment-230118145416-e8e9b05b/85/Assessment-ppt-3-320.jpg)