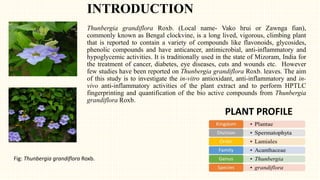
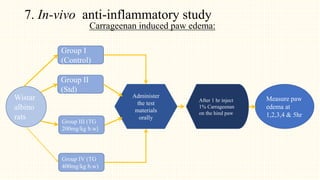
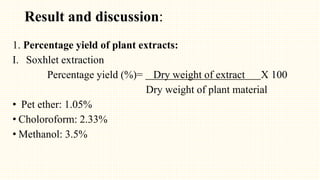
1. The study aimed to evaluate the in-vitro and in-vivo antioxidant and anti-inflammatory properties of Thunbergia grandiflora and perform HPTLC fingerprinting and quantification of bioactive compounds.
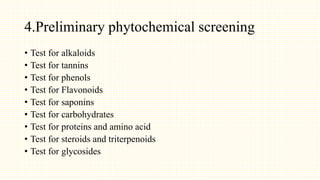
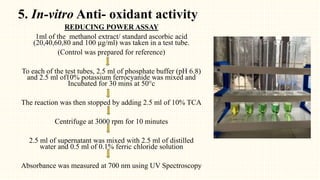
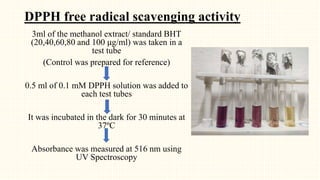
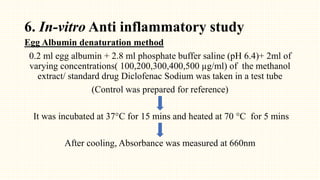
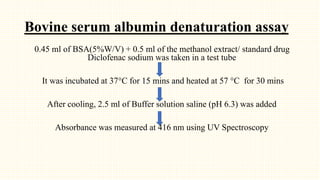
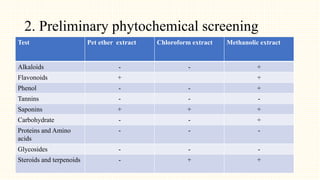
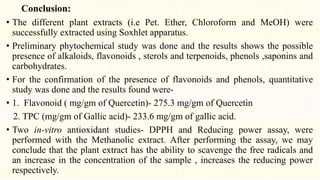
2. Preliminary phytochemical screening of plant extracts showed the presence of alkaloids, flavonoids, phenols, saponins, carbohydrates, steroids and terpenoids. In-vitro assays demonstrated antioxidant and anti-inflammatory effects.
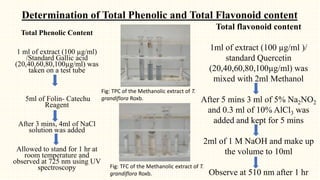
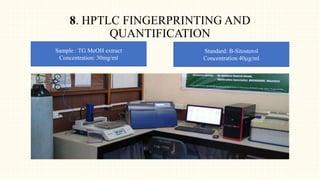
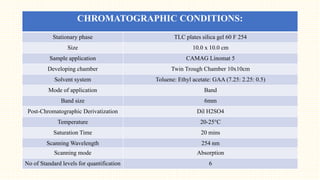
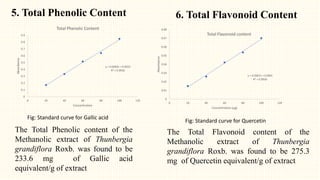
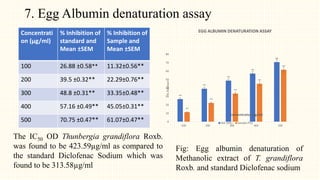
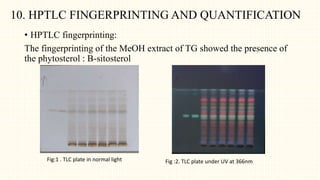
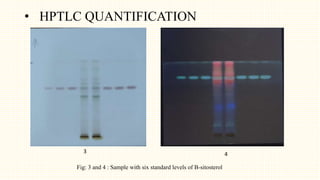
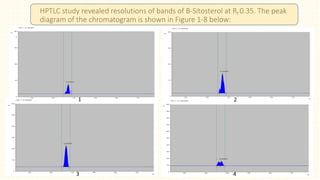
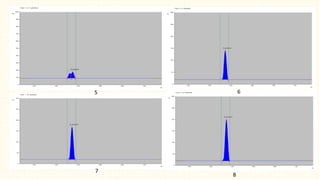
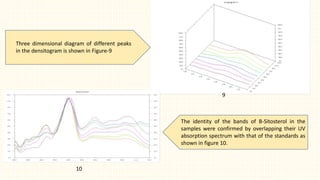
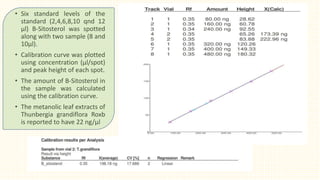
3. HPTLC fingerprinting was conducted and total phenolic content was found to be 233.6 mg GAE/g extract while total flavonoid content was 275.3 mg QE/g