Application Diagnosis with Zend Server TracingKevin SchroederZend Technologies
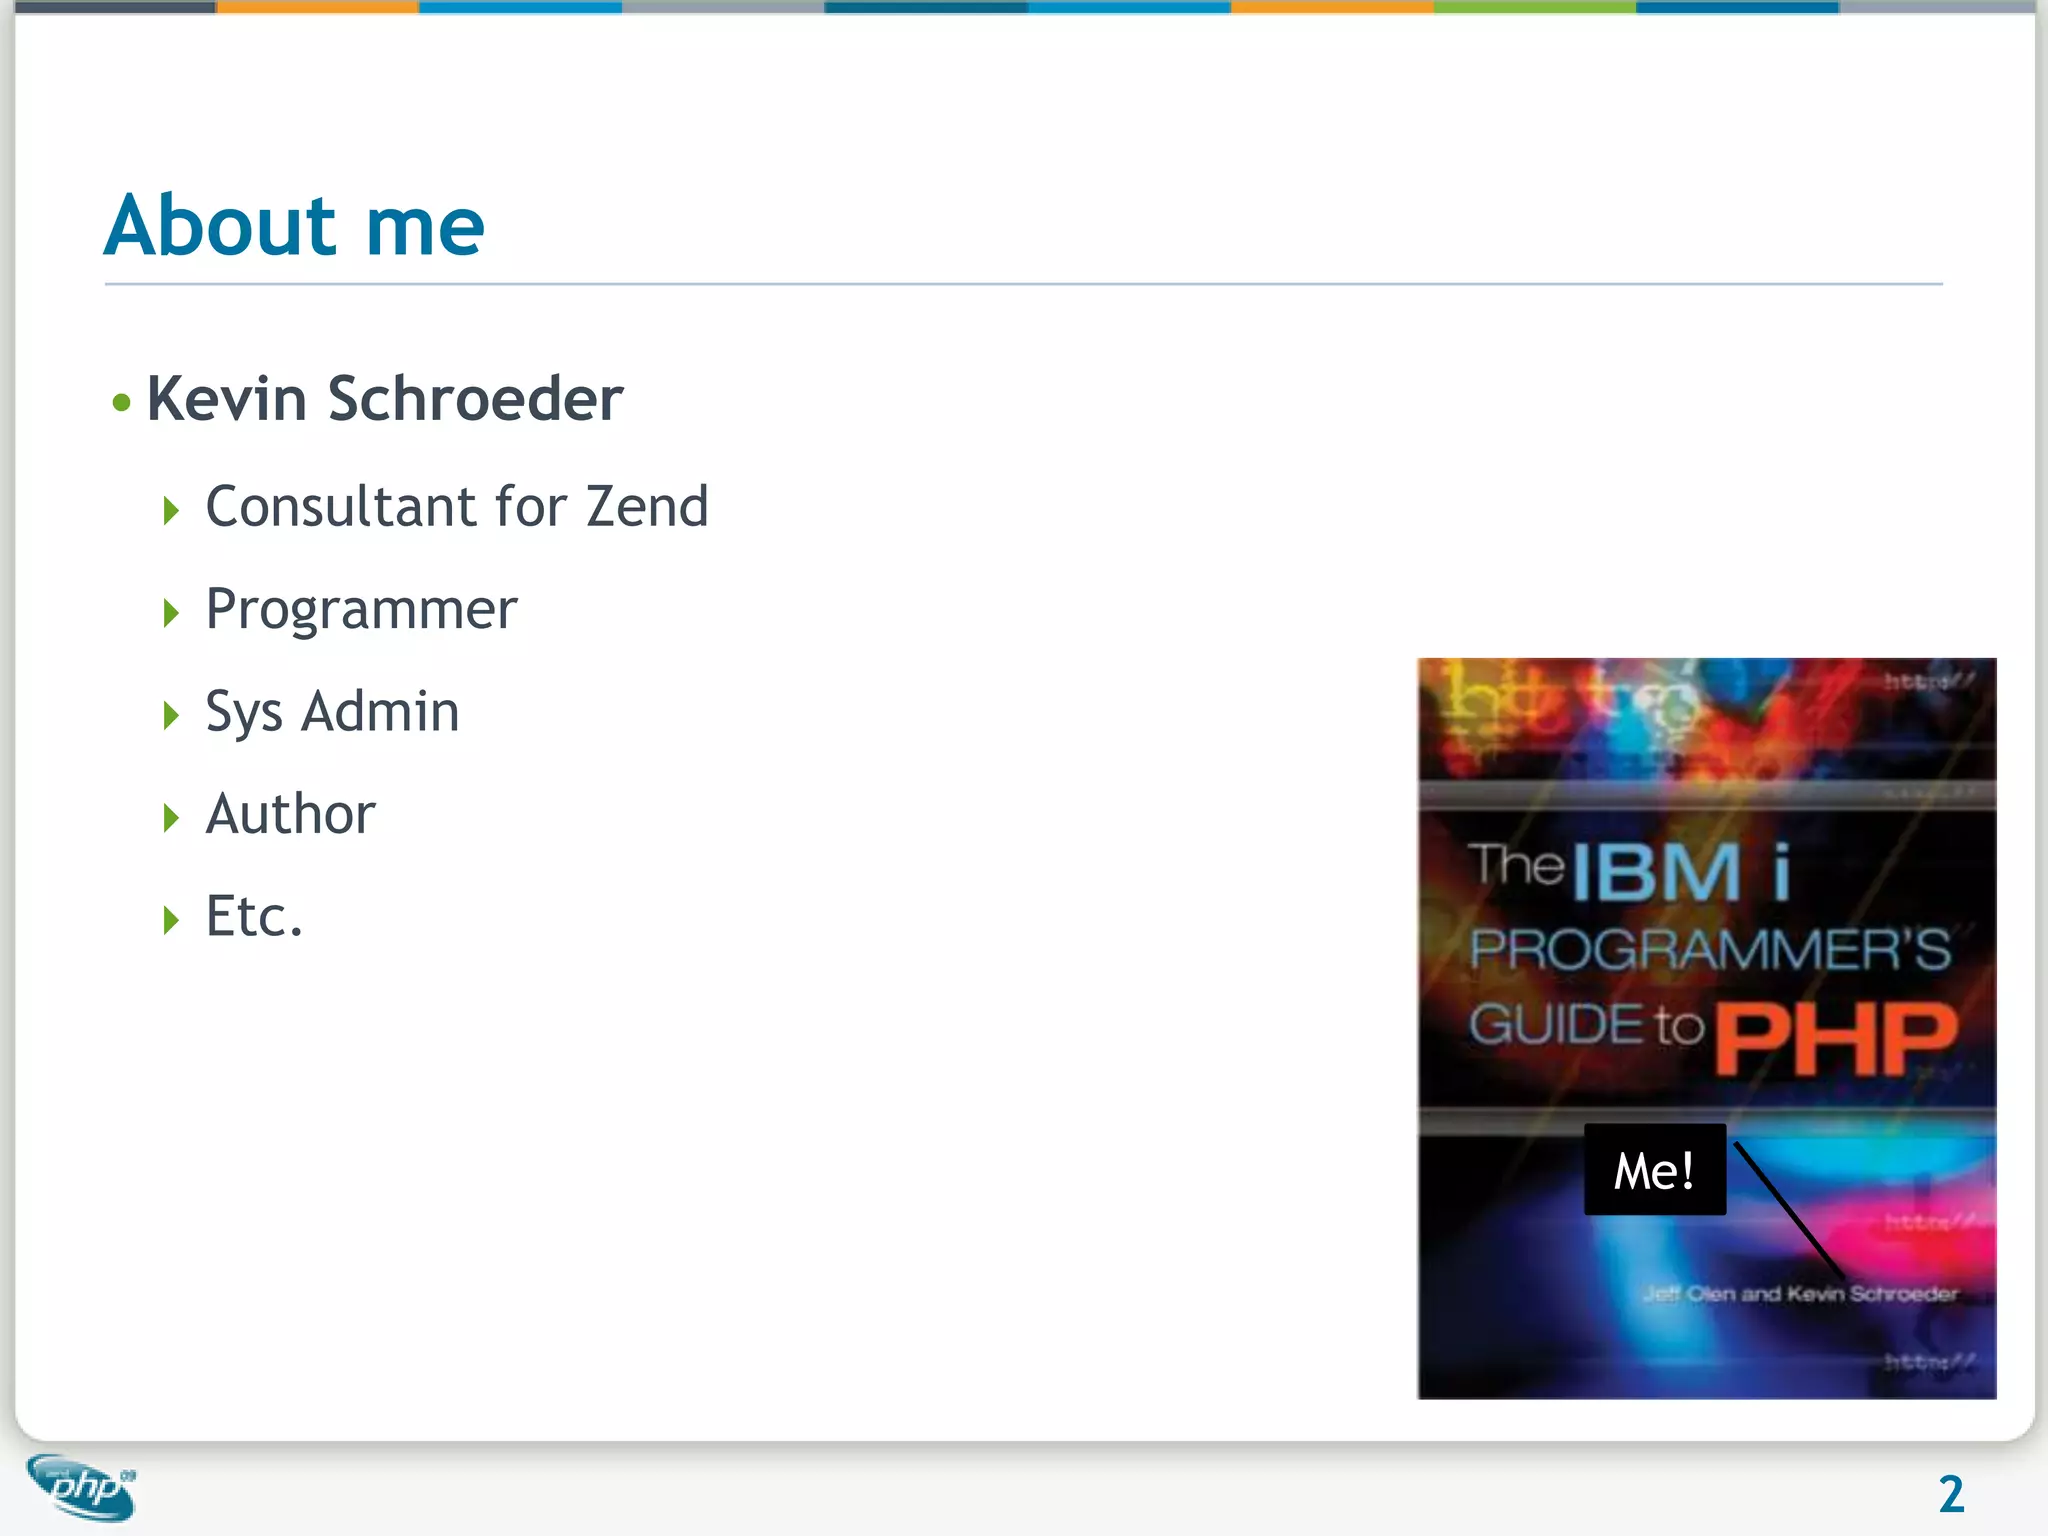
About meKevin SchroederConsultant for ZendProgrammerSys AdminAuthorEtc.Me!
"As soon as we started programming, we found to our surprise that it wasn't as easy to get programs right as we had thought. Debugging had to be discovered. I can remember the exact instant when I realized that a large part of my life from then on was going to spent in finding mistakes in my own programs" 		- Maurice Wilkes, 1949
Why do we need diagnostic tools?
Let’s see that again in slow motion
The pointNOT to highlight an individual companyWhy not?How many web-based applications look like this when an error occurs?AnswerAll of themWeb requests are intended to be short and quickIf an error occurs, recover, quit and go on to the next request
Debugging the old wayvar_dump($var)(I still use this occasionally)Some obvious problemsWhat if you forget to remove it?Are you doing this in a production environment?  If you are …Very limited scope
Debugging the better way – ZS DebuggingYou can see what the variable values are at run time and modify them tooGood for developmentNot good for production
MonitoringMUCH better for production systemsYou get a lot of really good information to help replay the issue
MonitoringYou are able to debug or profile the event on a remote machine
Events that can be monitored
Instrumentation on the next levelZend Code Tracing
Code Tracing: Rapid Problem ResolutionSimilar in concept to a black box flight recorder - Eliminates the need to reproduce problems in order to find root causeActivated automatically (through rules) or manuallyRecords live application execution Function callsArguments and return valuesErrorsDurationUseful in all parts of the software development lifecycle
Practical Code Tracing FunctionalityBy capturing PHP applications code in real time:Code Tracing enables to capture problems when they occur.Code Tracing recorded data eliminate the need to reproduce the steps led up to a failure.Code Tracing enables to analyze PHP applications execution both in production and in test lab environments, by that, it enables to quickly find the root cause of problems.14Insert->Header & Footer
Supported WorkflowsManual workflow: Used while performing unit tests during development or when running functional tests in QA. Calling URLs as part of the testing processMonitoring events workflowUsed when running automated tests and load tests and when running your application in staging or production environments. Code tracing extends the monitoring rules mechanism by enabling to save trace data when a monitoring event is generated. Suitable for production in Standby mode
Detailed Runtime InstrumentationPinpoint root cause by viewing the sequence of events that led up to an error
Detailed Runtime InstrumentationOptimize your code by analyzing application performance at the function level
Code Tracing – Monitoring Level ModesAlways onCollects trace data when monitoring event is kicked offCollects trace data for manual requests.InactiveCollects data only for manual requests.StandbyOff (turn code tracing extension off)
Code Tracing – Operating ModesStandby modeA monitoring event activates code tracingTrace mode:OnStandbyTracing switches back for “Standby” modeTracing is activated for X  minutesTimeA monitoring event with an “Activate Trace” action is generatedCollect trace data according to the monitoring set of rules
The basicsTrace a Request
Interpreting the resultsScreenshots are boring.  Let’s look at live data
SetupAttaching traces to events	Tracing can be attached to any PHP-specific events
Tracing Events – Standby ModeSet zend_monitor.event_tracing_modeActive, Inactive or StandbyDetermines integration with tracer mechanism in case of events that require a trace data dumpCreate an Event Action – “Enable Tracing” will changeTracing Process SignalsTracing can also be initiated upon a fatal signal
Tracing LogStep 1 – Make sure that you have it set to logStep 2 – Set the verbosity between 1 and 5Restart
Example log file[Tracing Log 08.10.2009 14:14:56 DBG1] 5387 Tracer request startup [Tracing Log 08.10.2009 14:14:56 DBG3] 5387 Setting dump reason to 0 [Tracing Log 08.10.2009 14:14:56 DBG3] 5387 Dump reason is now 0 [Tracing Log 08.10.2009 14:14:56 DBG1] 5387 Remote address is 127.0.0.1 [Tracing Log 08.10.2009 14:14:56 DBG2] 5387 Allow hostmask is 127.0.0.1/32,10.0.0.0/8,192.168.0.0/16,172.16.0.0/12 [Tracing Log 08.10.2009 14:14:56 DBG2] 5387 Deny hostmask is  [Tracing Log 08.10.2009 14:14:56 DBG1] 5387 Remote access allowed [Tracing Log 08.10.2009 14:14:56 DBG1] 5387 Request parameter requires dump [Tracing Log 08.10.2009 14:14:56 DBG3] 5387 Setting dump reason to 2 [Tracing Log 08.10.2009 14:14:56 NOTICE] 5387 Installing signal handler [Tracing Log 08.10.2009 14:14:56 DBG2] 5387 Staring trace generation [Tracing Log 08.10.2009 14:14:56 DBG2] 5387 Tracer request startup done [Tracing Log 08.10.2009 14:14:56 DBG3] 5387 Options updated to 7FFF [Tracing Log 08.10.2009 14:14:57 DBG1] 5387 Tracer request shutdown [Tracing Log 08.10.2009 14:14:57 WARNING] 5387 Code tracing buffer full [Tracing Log 08.10.2009 14:14:57 DBG1] Using socket /usr/local/zend/tmp/monitor_events.sock rules /usr/local/zend/etc/events_rules.xml [Tracing Log 08.10.2009 14:14:58 NOTICE] Event type 1 (0) reported [Tracing Log 08.10.2009 14:14:58 NOTICE] 5387 Generating trace dump, format 2 [Tracing Log 08.10.2009 14:14:58 DBG2] 5387 Dump name is /usr/local/zend/var/codetracing/dump.5387.1 Monitoring Event was triggered
Functional ExamplesUncaught exceptionsDestructor being calledPrepared Statements
Where did all my memory go?Memory usageLarge variable going out of scope
Impact
The all-important question…“Where should I use this?”Development – Possibly, though profiling and debugging may be more pertinentTesting – AbsolutelyStaging – AbsolutelyProduction - AbsolutelyIn Standby modeActivated on a subset of servers
Questions?Want to join in the public beta?  Go to http://www.zend.com/en/products/server/zend-server-5-newfor more information kevin@zend.com
Additional Information
What happens when you have too much dataNeed to up the zend_codetracing.buffer_size setting
Increasing the buffer size to 5MBThat’s  better
Settings
Settings
Settings
Settings
Application Diagnosis with Zend Server Tracing

Application Diagnosis with Zend Server Tracing

  • 1.
    Application Diagnosis withZend Server TracingKevin SchroederZend Technologies
  • 2.
    About meKevin SchroederConsultantfor ZendProgrammerSys AdminAuthorEtc.Me!
  • 3.
    "As soon aswe started programming, we found to our surprise that it wasn't as easy to get programs right as we had thought. Debugging had to be discovered. I can remember the exact instant when I realized that a large part of my life from then on was going to spent in finding mistakes in my own programs" - Maurice Wilkes, 1949
  • 4.
    Why do weneed diagnostic tools?
  • 5.
    Let’s see thatagain in slow motion
  • 6.
    The pointNOT tohighlight an individual companyWhy not?How many web-based applications look like this when an error occurs?AnswerAll of themWeb requests are intended to be short and quickIf an error occurs, recover, quit and go on to the next request
  • 7.
    Debugging the oldwayvar_dump($var)(I still use this occasionally)Some obvious problemsWhat if you forget to remove it?Are you doing this in a production environment? If you are …Very limited scope
  • 8.
    Debugging the betterway – ZS DebuggingYou can see what the variable values are at run time and modify them tooGood for developmentNot good for production
  • 9.
    MonitoringMUCH better forproduction systemsYou get a lot of really good information to help replay the issue
  • 10.
    MonitoringYou are ableto debug or profile the event on a remote machine
  • 11.
    Events that canbe monitored
  • 12.
    Instrumentation on thenext levelZend Code Tracing
  • 13.
    Code Tracing: RapidProblem ResolutionSimilar in concept to a black box flight recorder - Eliminates the need to reproduce problems in order to find root causeActivated automatically (through rules) or manuallyRecords live application execution Function callsArguments and return valuesErrorsDurationUseful in all parts of the software development lifecycle
  • 14.
    Practical Code TracingFunctionalityBy capturing PHP applications code in real time:Code Tracing enables to capture problems when they occur.Code Tracing recorded data eliminate the need to reproduce the steps led up to a failure.Code Tracing enables to analyze PHP applications execution both in production and in test lab environments, by that, it enables to quickly find the root cause of problems.14Insert->Header & Footer
  • 15.
    Supported WorkflowsManual workflow:Used while performing unit tests during development or when running functional tests in QA. Calling URLs as part of the testing processMonitoring events workflowUsed when running automated tests and load tests and when running your application in staging or production environments. Code tracing extends the monitoring rules mechanism by enabling to save trace data when a monitoring event is generated. Suitable for production in Standby mode
  • 16.
    Detailed Runtime InstrumentationPinpointroot cause by viewing the sequence of events that led up to an error
  • 17.
    Detailed Runtime InstrumentationOptimizeyour code by analyzing application performance at the function level
  • 18.
    Code Tracing –Monitoring Level ModesAlways onCollects trace data when monitoring event is kicked offCollects trace data for manual requests.InactiveCollects data only for manual requests.StandbyOff (turn code tracing extension off)
  • 19.
    Code Tracing –Operating ModesStandby modeA monitoring event activates code tracingTrace mode:OnStandbyTracing switches back for “Standby” modeTracing is activated for X minutesTimeA monitoring event with an “Activate Trace” action is generatedCollect trace data according to the monitoring set of rules
  • 20.
  • 21.
    Interpreting the resultsScreenshotsare boring. Let’s look at live data
  • 22.
    SetupAttaching traces toevents Tracing can be attached to any PHP-specific events
  • 23.
    Tracing Events –Standby ModeSet zend_monitor.event_tracing_modeActive, Inactive or StandbyDetermines integration with tracer mechanism in case of events that require a trace data dumpCreate an Event Action – “Enable Tracing” will changeTracing Process SignalsTracing can also be initiated upon a fatal signal
  • 24.
    Tracing LogStep 1– Make sure that you have it set to logStep 2 – Set the verbosity between 1 and 5Restart
  • 25.
    Example log file[TracingLog 08.10.2009 14:14:56 DBG1] 5387 Tracer request startup [Tracing Log 08.10.2009 14:14:56 DBG3] 5387 Setting dump reason to 0 [Tracing Log 08.10.2009 14:14:56 DBG3] 5387 Dump reason is now 0 [Tracing Log 08.10.2009 14:14:56 DBG1] 5387 Remote address is 127.0.0.1 [Tracing Log 08.10.2009 14:14:56 DBG2] 5387 Allow hostmask is 127.0.0.1/32,10.0.0.0/8,192.168.0.0/16,172.16.0.0/12 [Tracing Log 08.10.2009 14:14:56 DBG2] 5387 Deny hostmask is [Tracing Log 08.10.2009 14:14:56 DBG1] 5387 Remote access allowed [Tracing Log 08.10.2009 14:14:56 DBG1] 5387 Request parameter requires dump [Tracing Log 08.10.2009 14:14:56 DBG3] 5387 Setting dump reason to 2 [Tracing Log 08.10.2009 14:14:56 NOTICE] 5387 Installing signal handler [Tracing Log 08.10.2009 14:14:56 DBG2] 5387 Staring trace generation [Tracing Log 08.10.2009 14:14:56 DBG2] 5387 Tracer request startup done [Tracing Log 08.10.2009 14:14:56 DBG3] 5387 Options updated to 7FFF [Tracing Log 08.10.2009 14:14:57 DBG1] 5387 Tracer request shutdown [Tracing Log 08.10.2009 14:14:57 WARNING] 5387 Code tracing buffer full [Tracing Log 08.10.2009 14:14:57 DBG1] Using socket /usr/local/zend/tmp/monitor_events.sock rules /usr/local/zend/etc/events_rules.xml [Tracing Log 08.10.2009 14:14:58 NOTICE] Event type 1 (0) reported [Tracing Log 08.10.2009 14:14:58 NOTICE] 5387 Generating trace dump, format 2 [Tracing Log 08.10.2009 14:14:58 DBG2] 5387 Dump name is /usr/local/zend/var/codetracing/dump.5387.1 Monitoring Event was triggered
  • 26.
  • 27.
    Where did allmy memory go?Memory usageLarge variable going out of scope
  • 28.
  • 29.
    The all-important question…“Whereshould I use this?”Development – Possibly, though profiling and debugging may be more pertinentTesting – AbsolutelyStaging – AbsolutelyProduction - AbsolutelyIn Standby modeActivated on a subset of servers
  • 30.
    Questions?Want to joinin the public beta? Go to http://www.zend.com/en/products/server/zend-server-5-newfor more information kevin@zend.com
  • 31.
  • 32.
    What happens whenyou have too much dataNeed to up the zend_codetracing.buffer_size setting
  • 33.
    Increasing the buffersize to 5MBThat’s better
  • 34.
  • 35.
  • 36.
  • 37.

Editor's Notes

  • #20 When code tracing is activated we ignore other activation requests.