Download to read offline


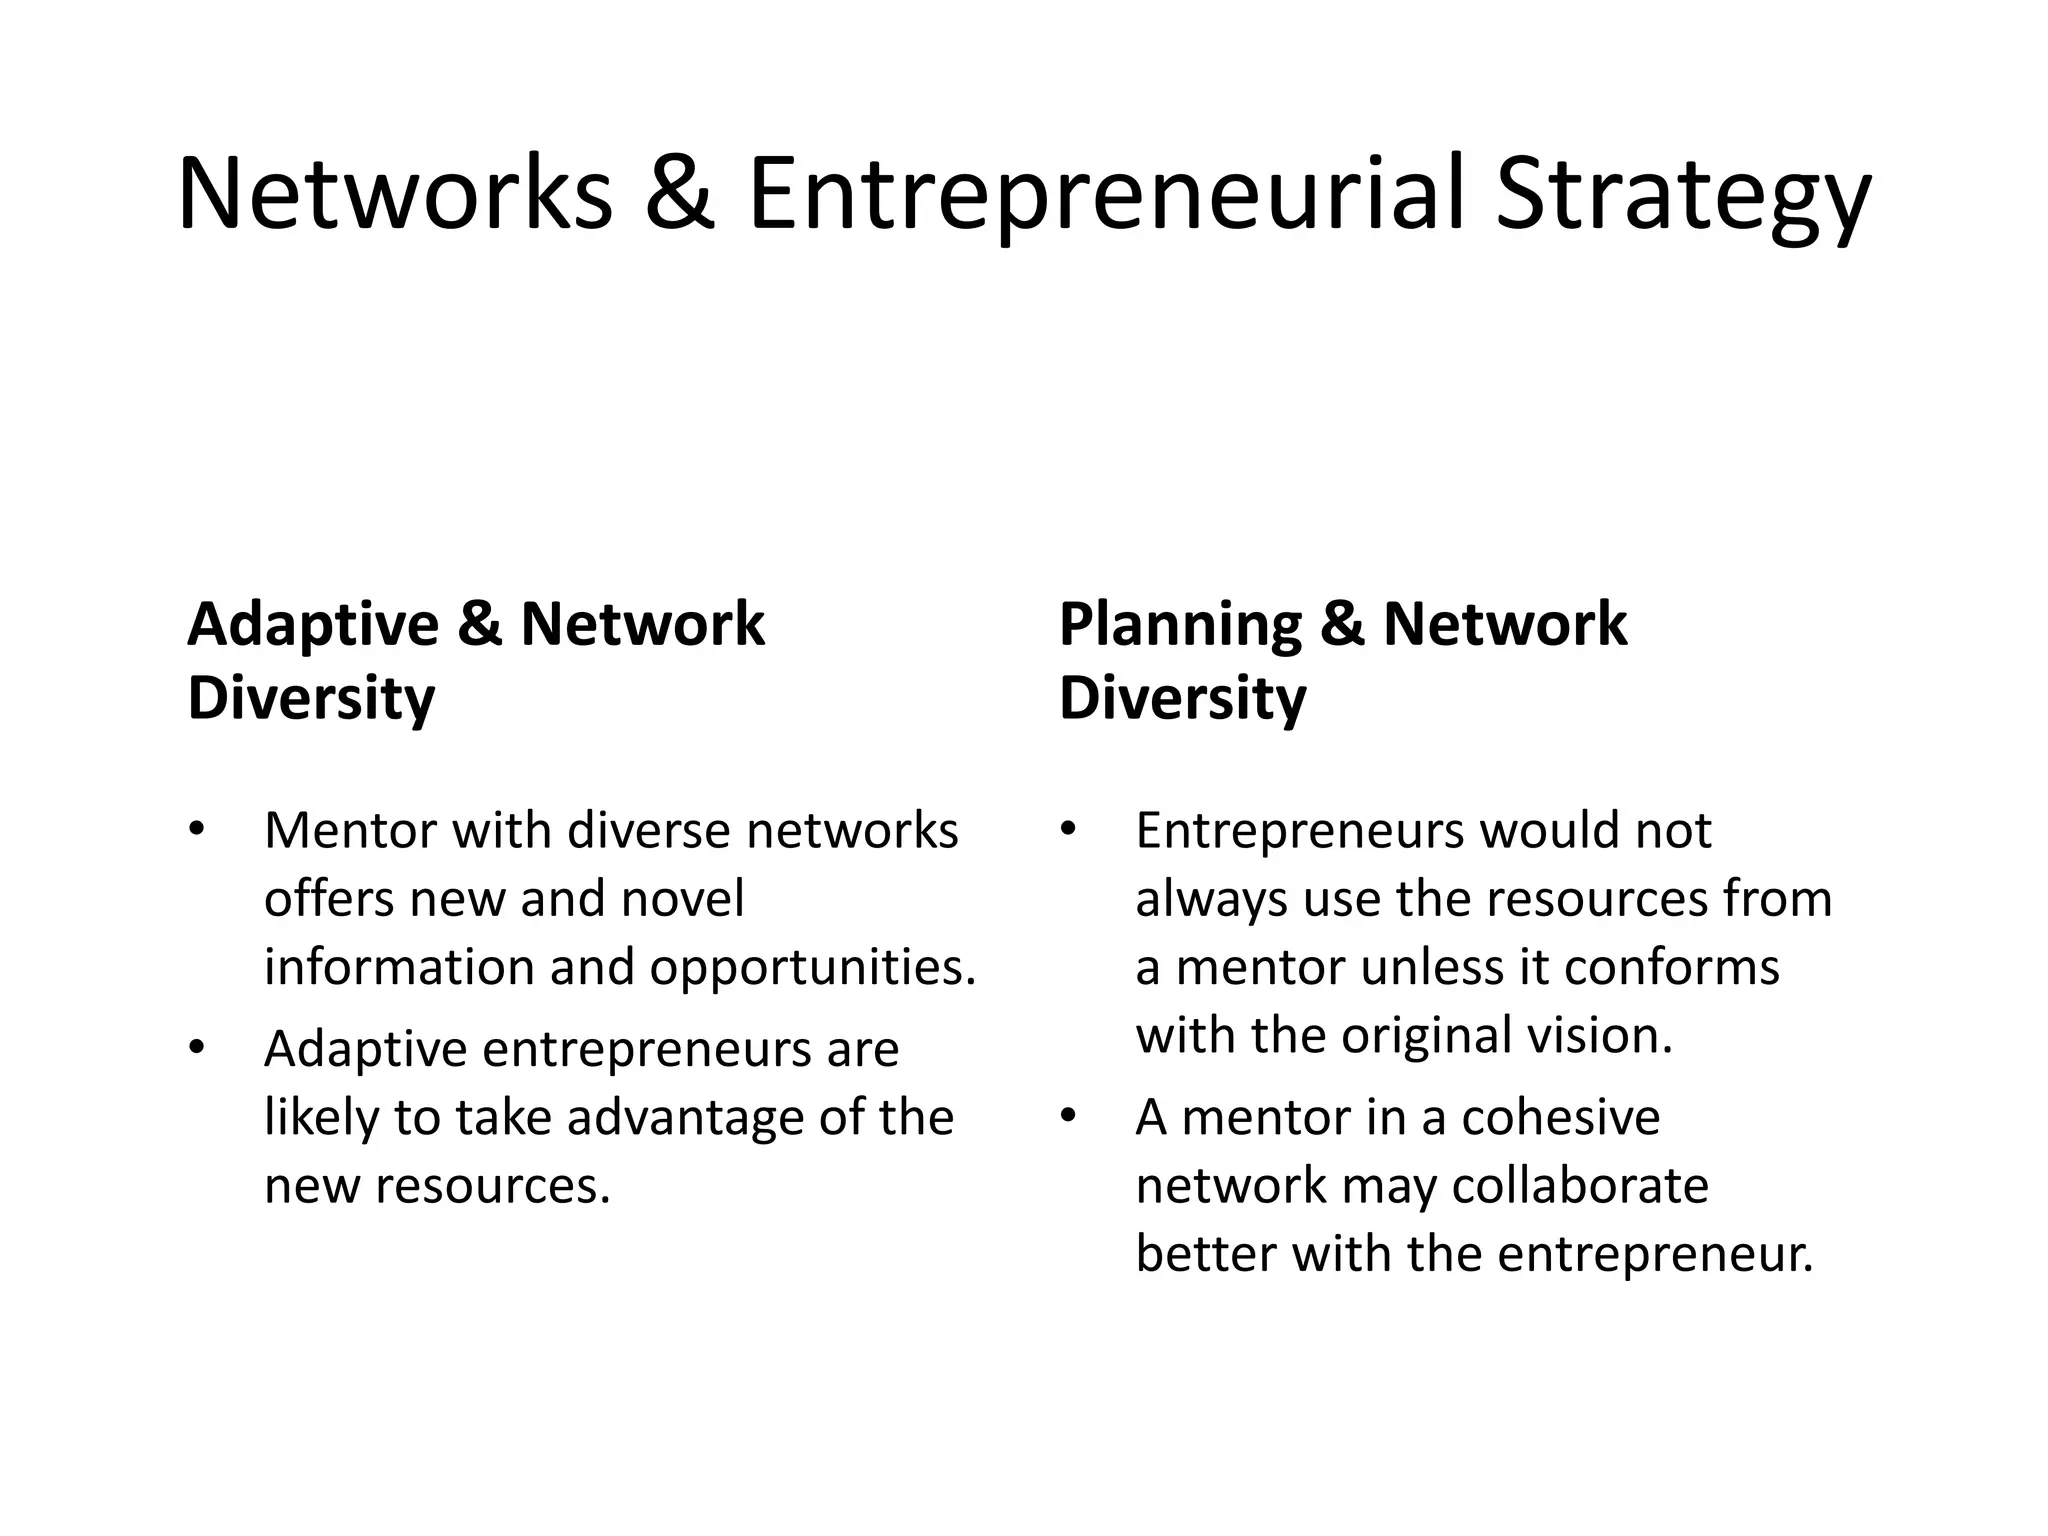


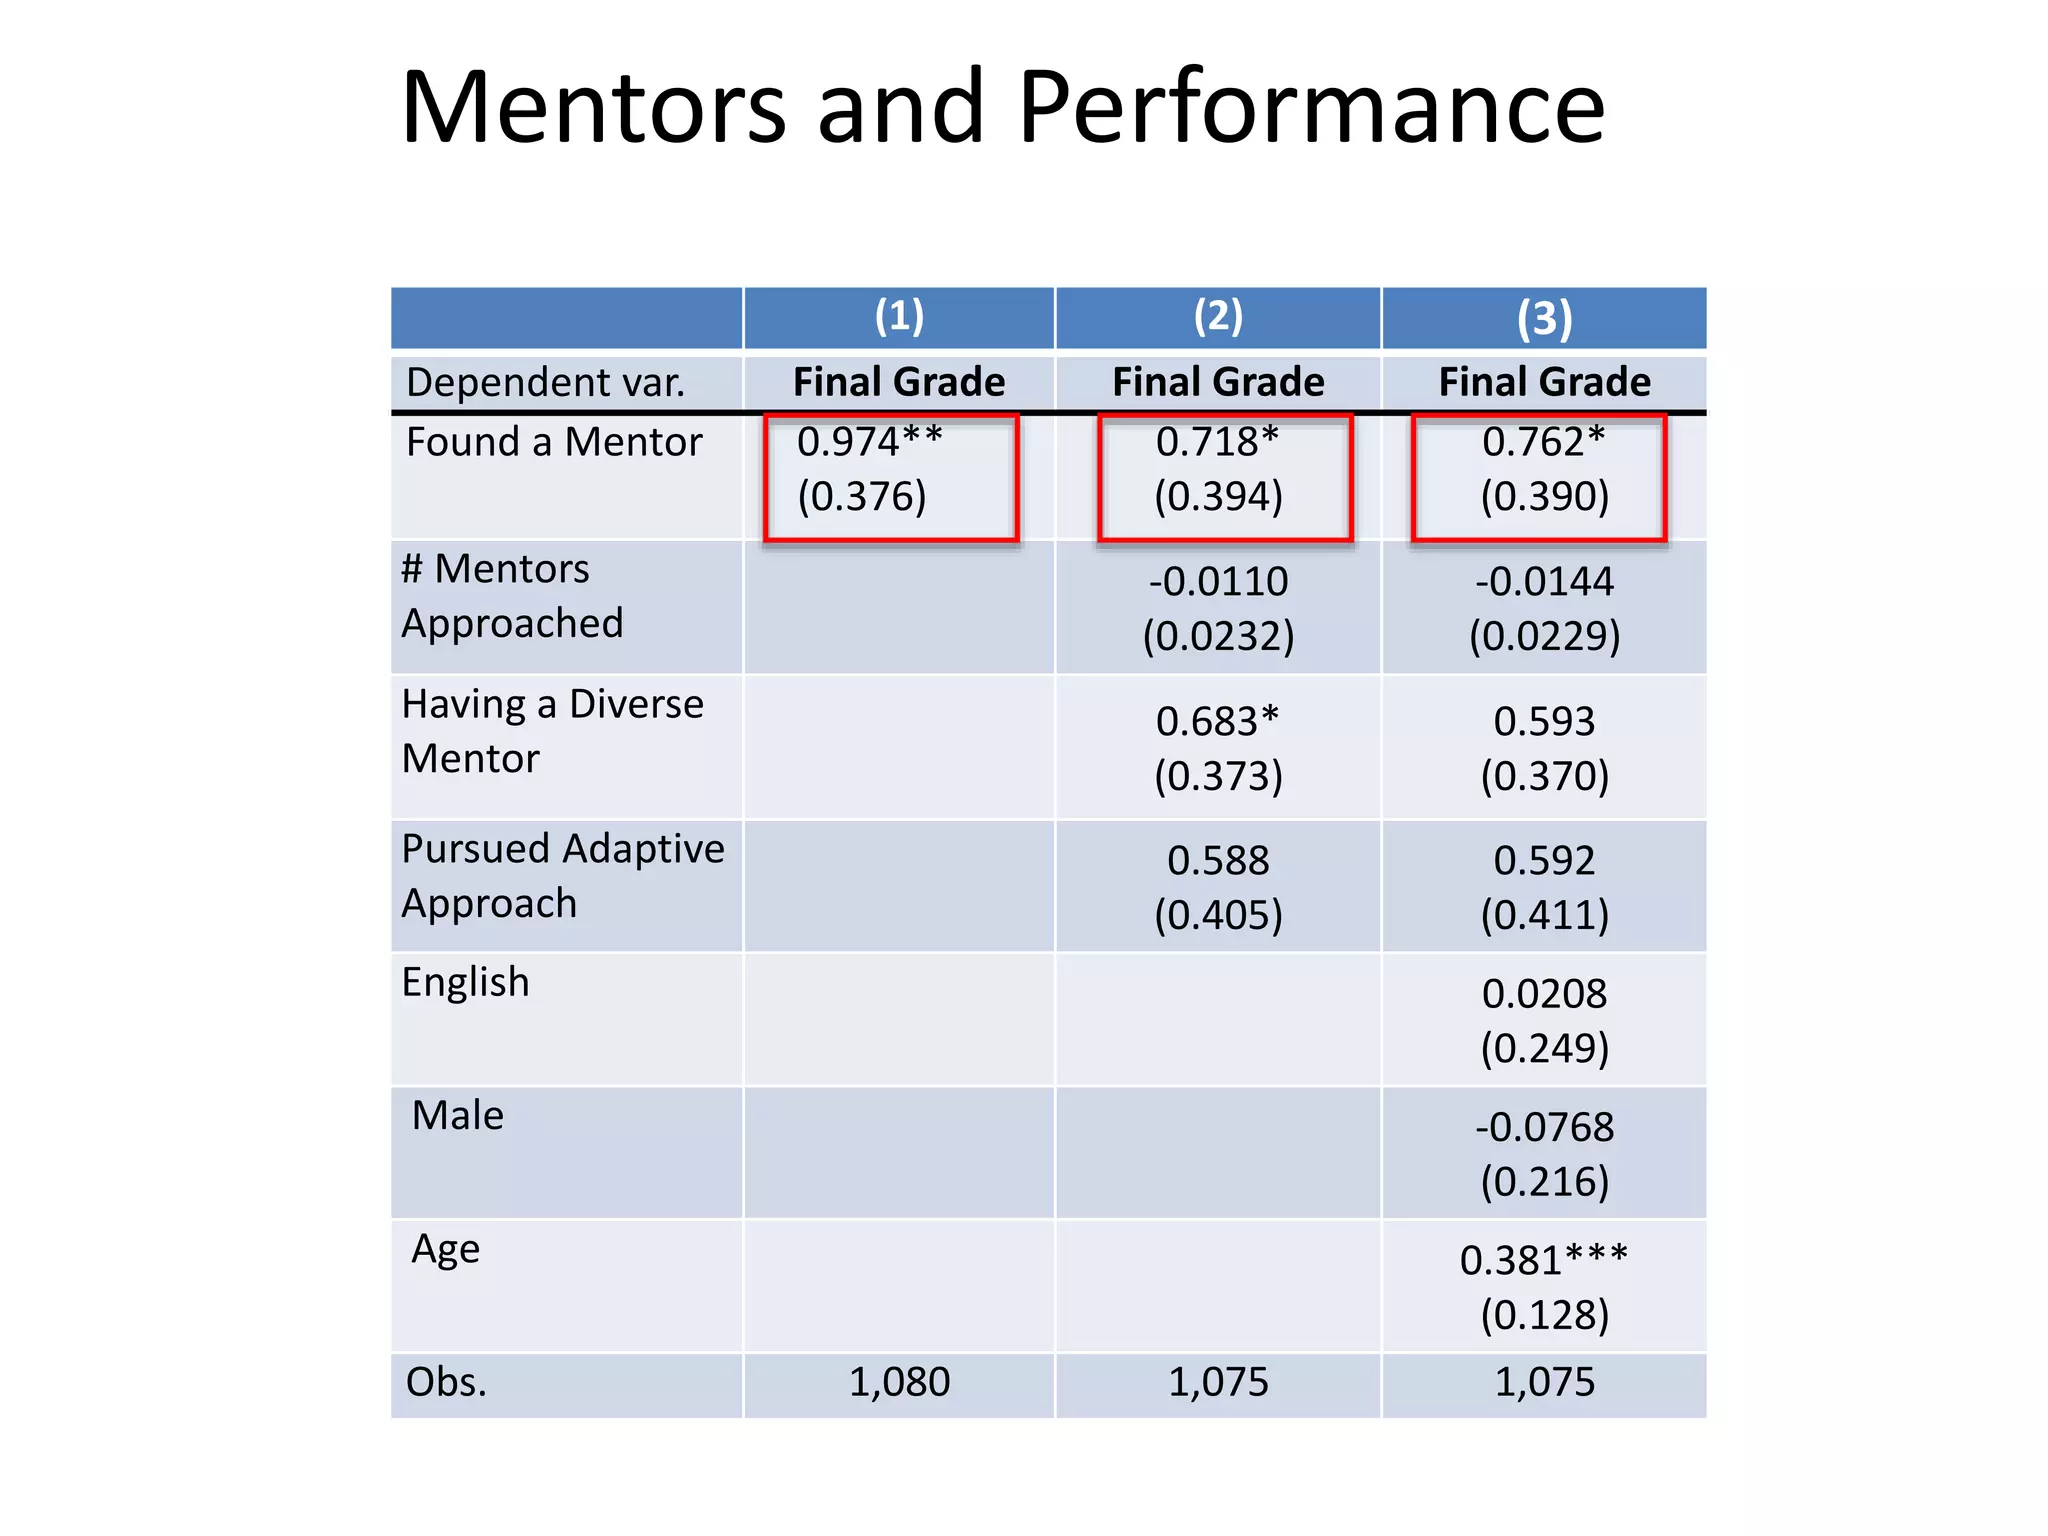

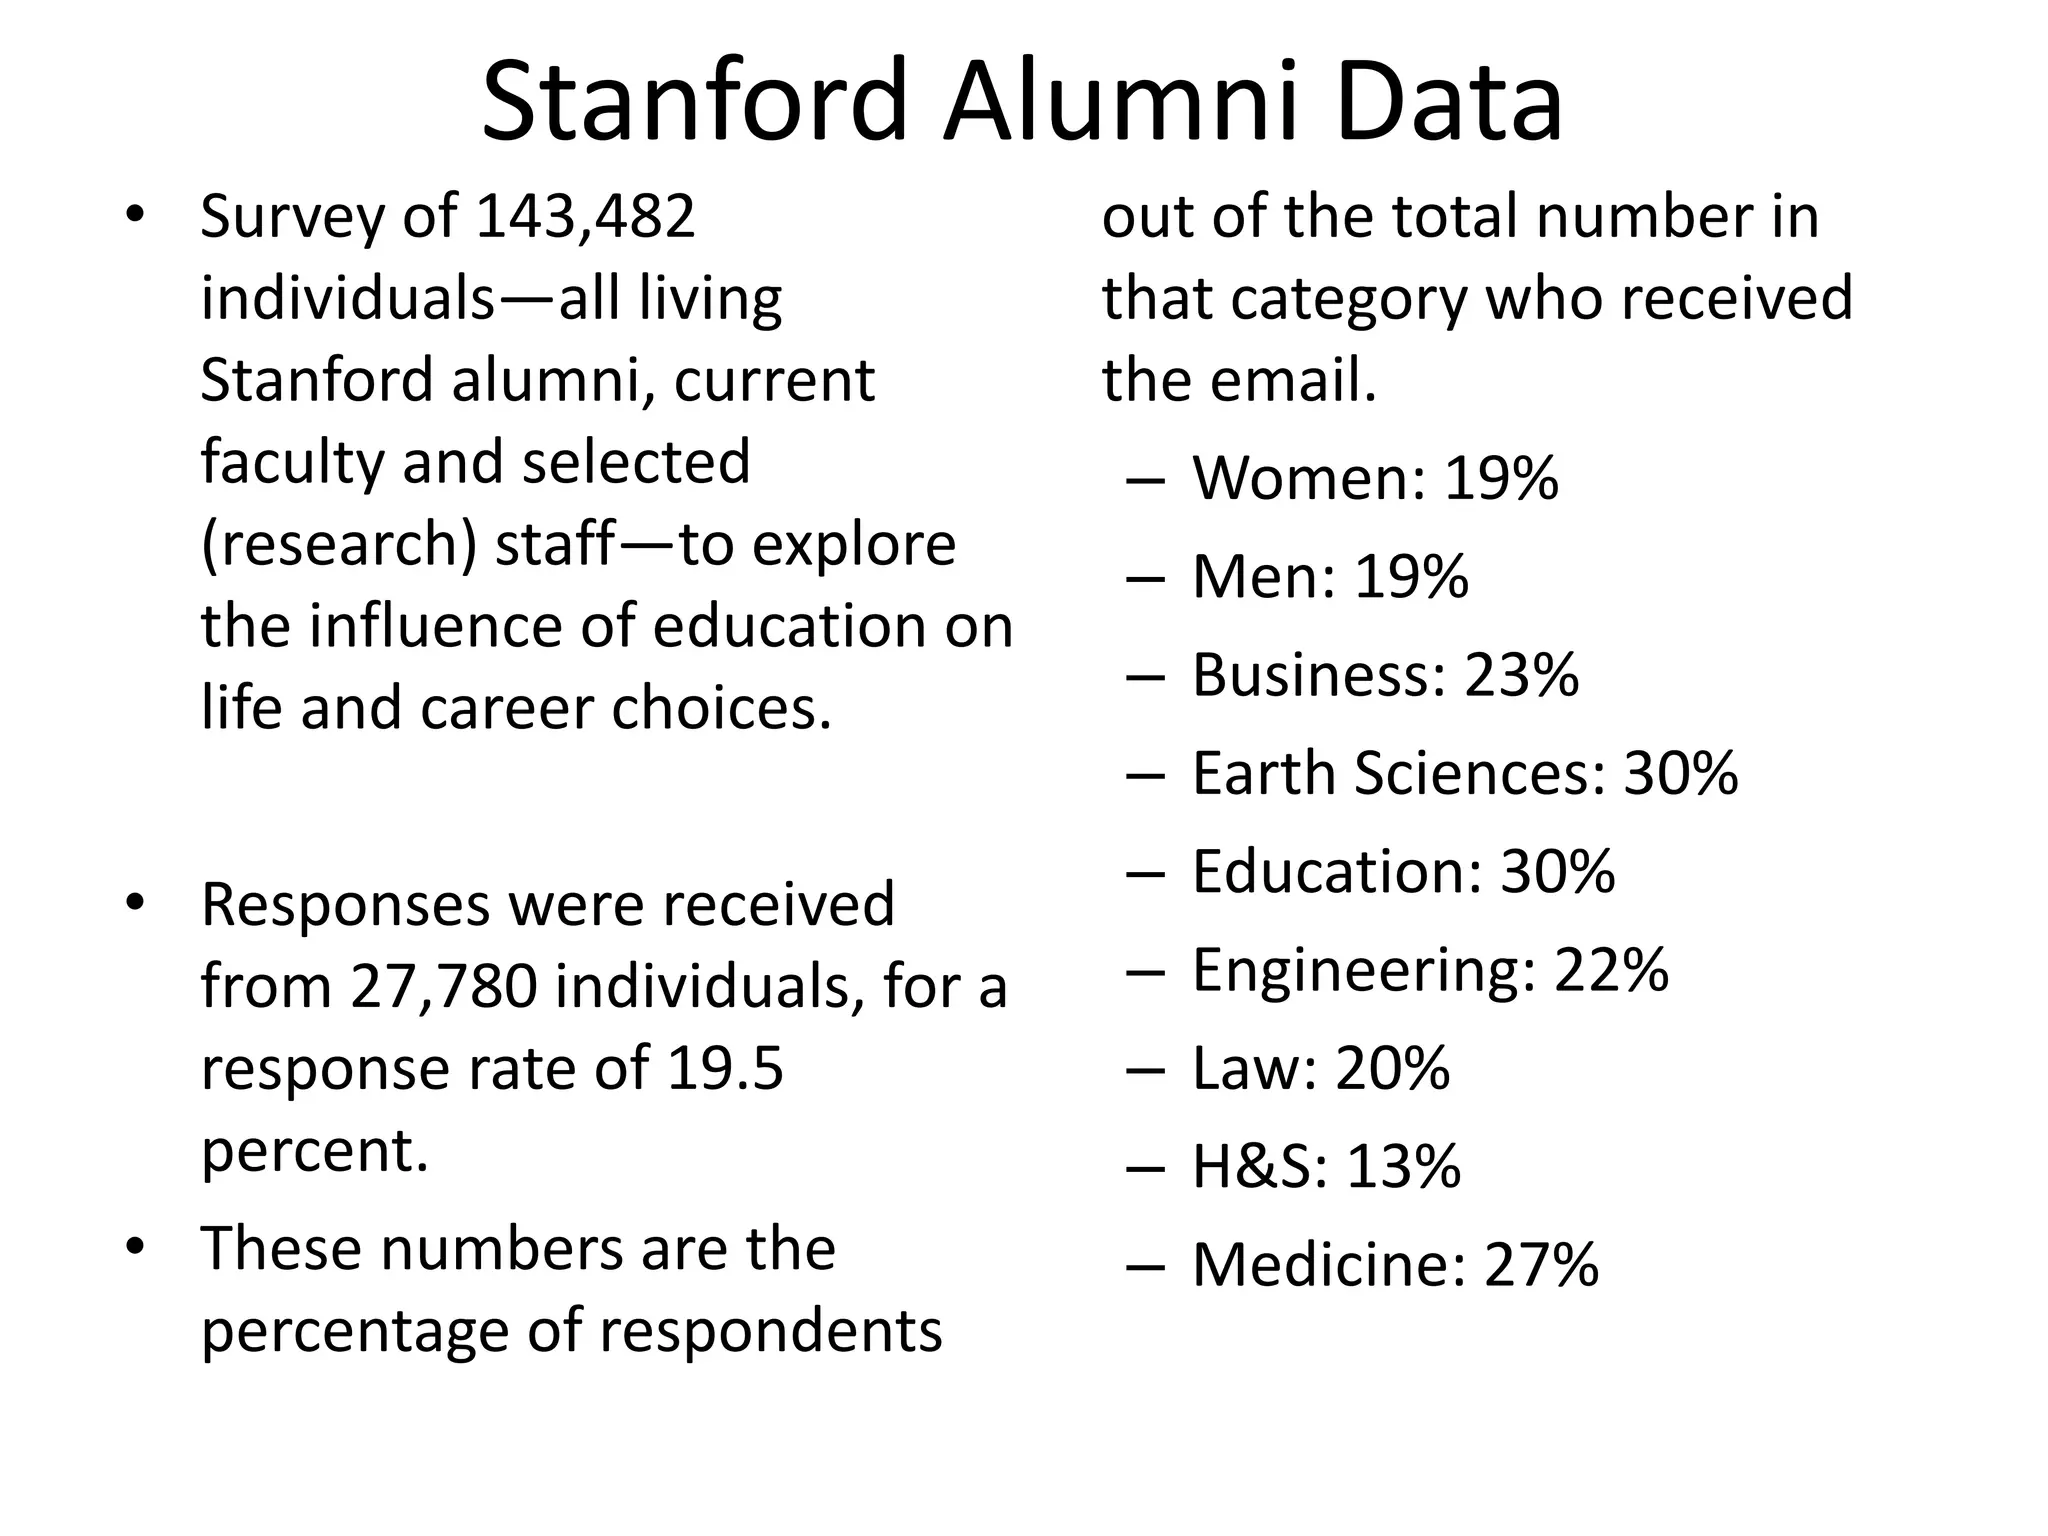
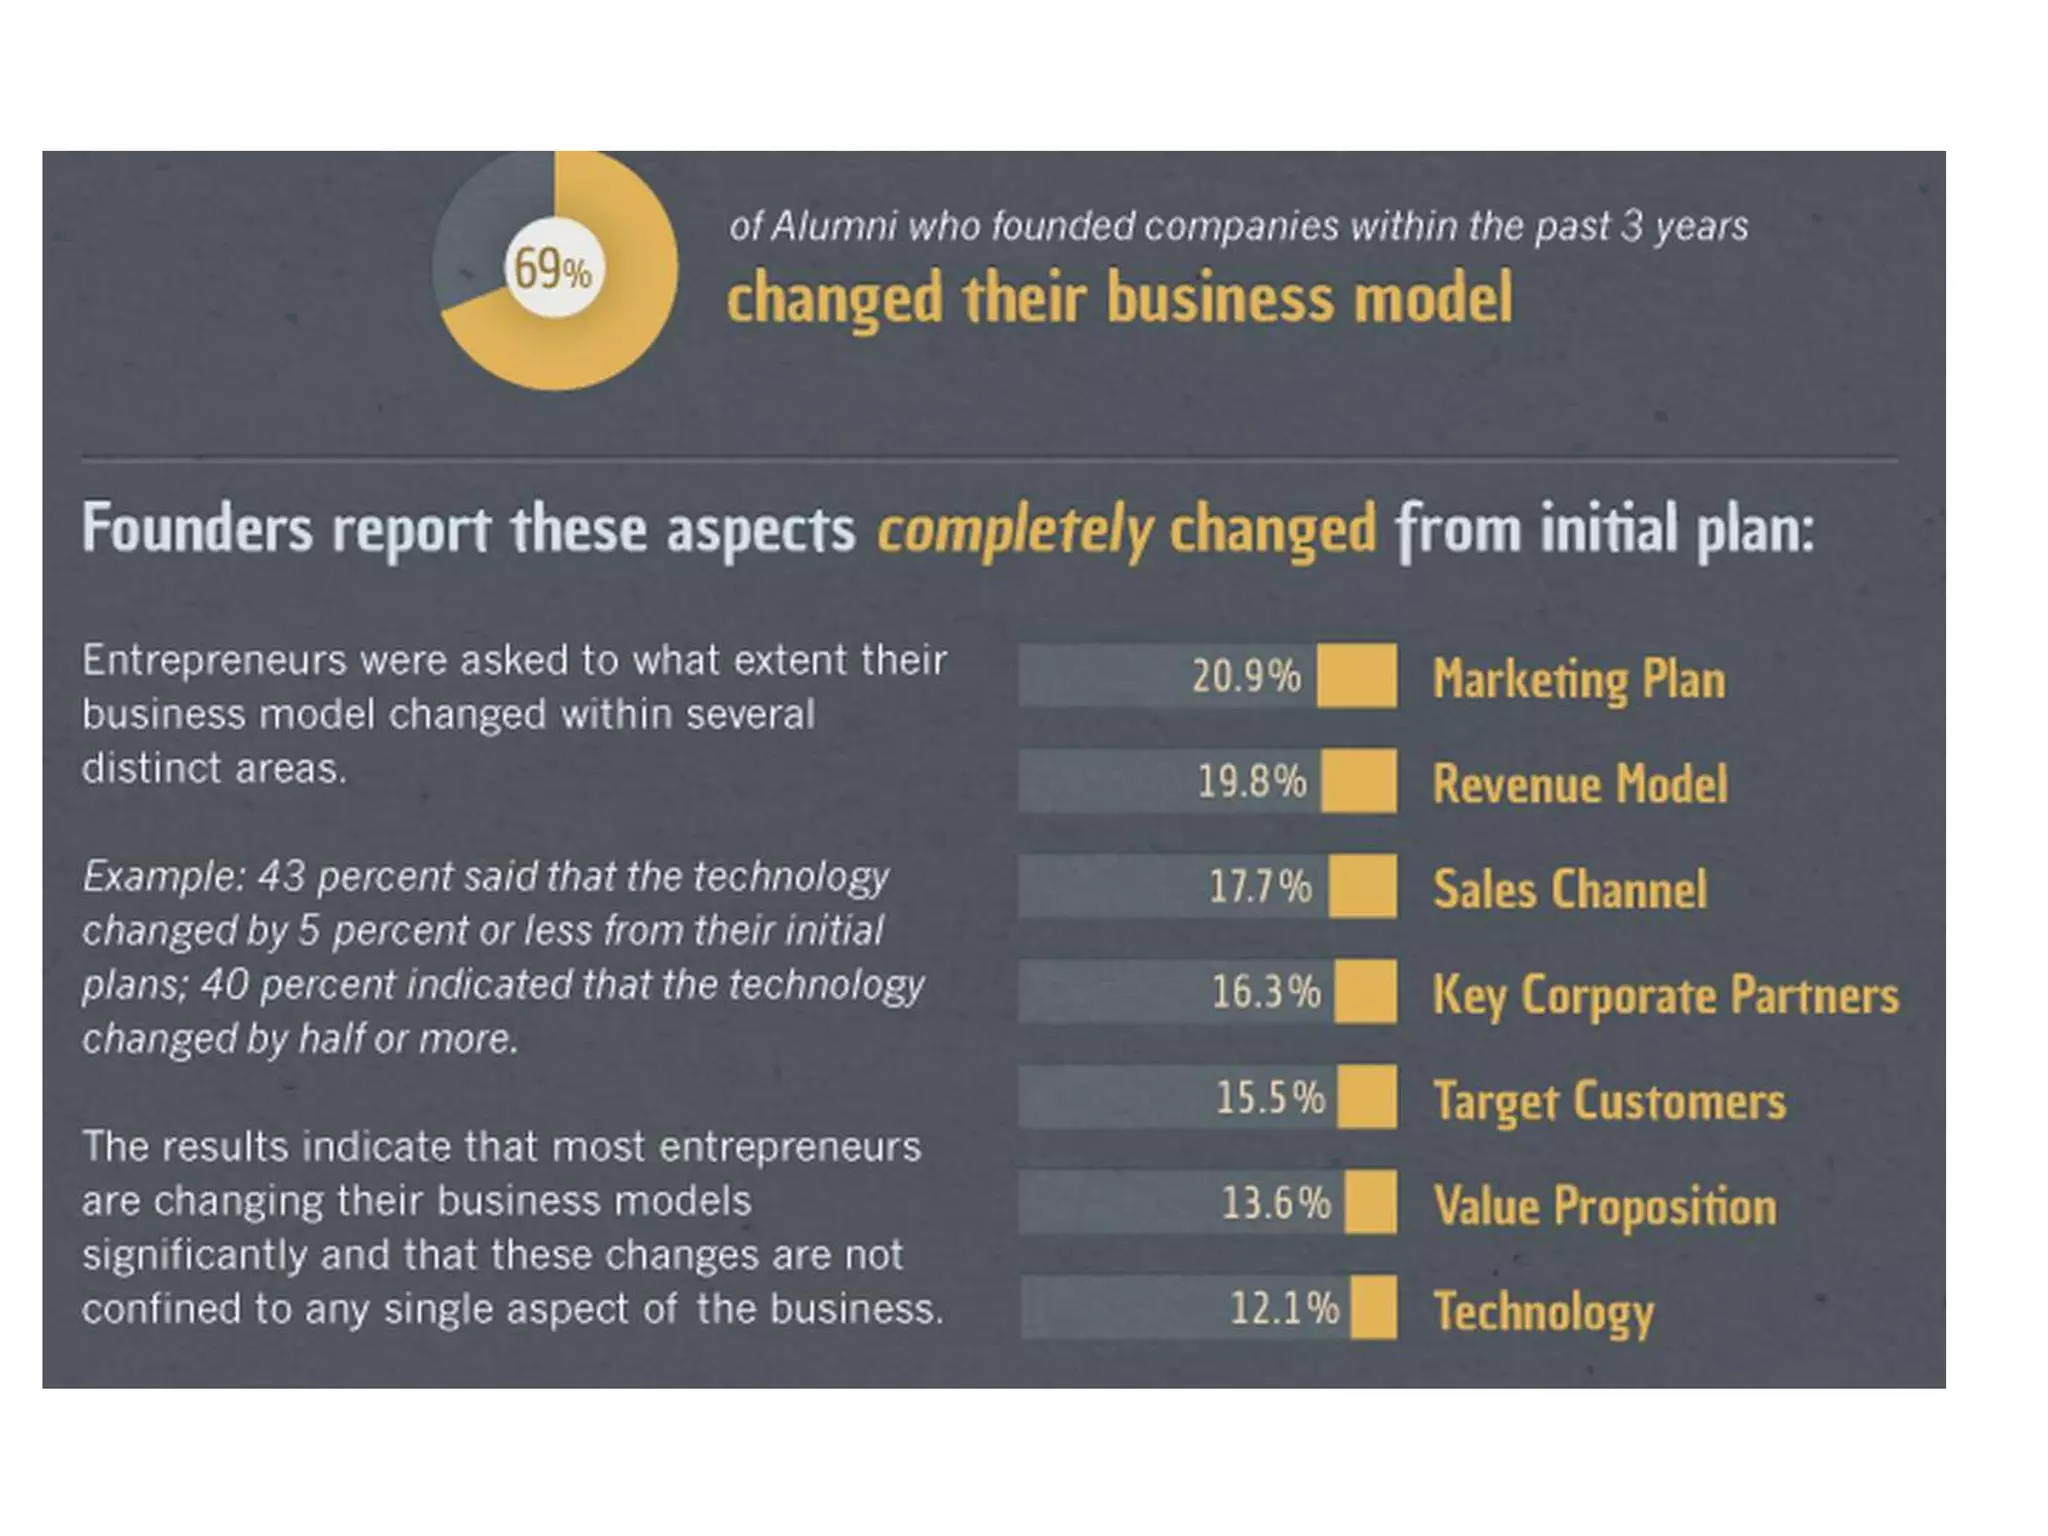

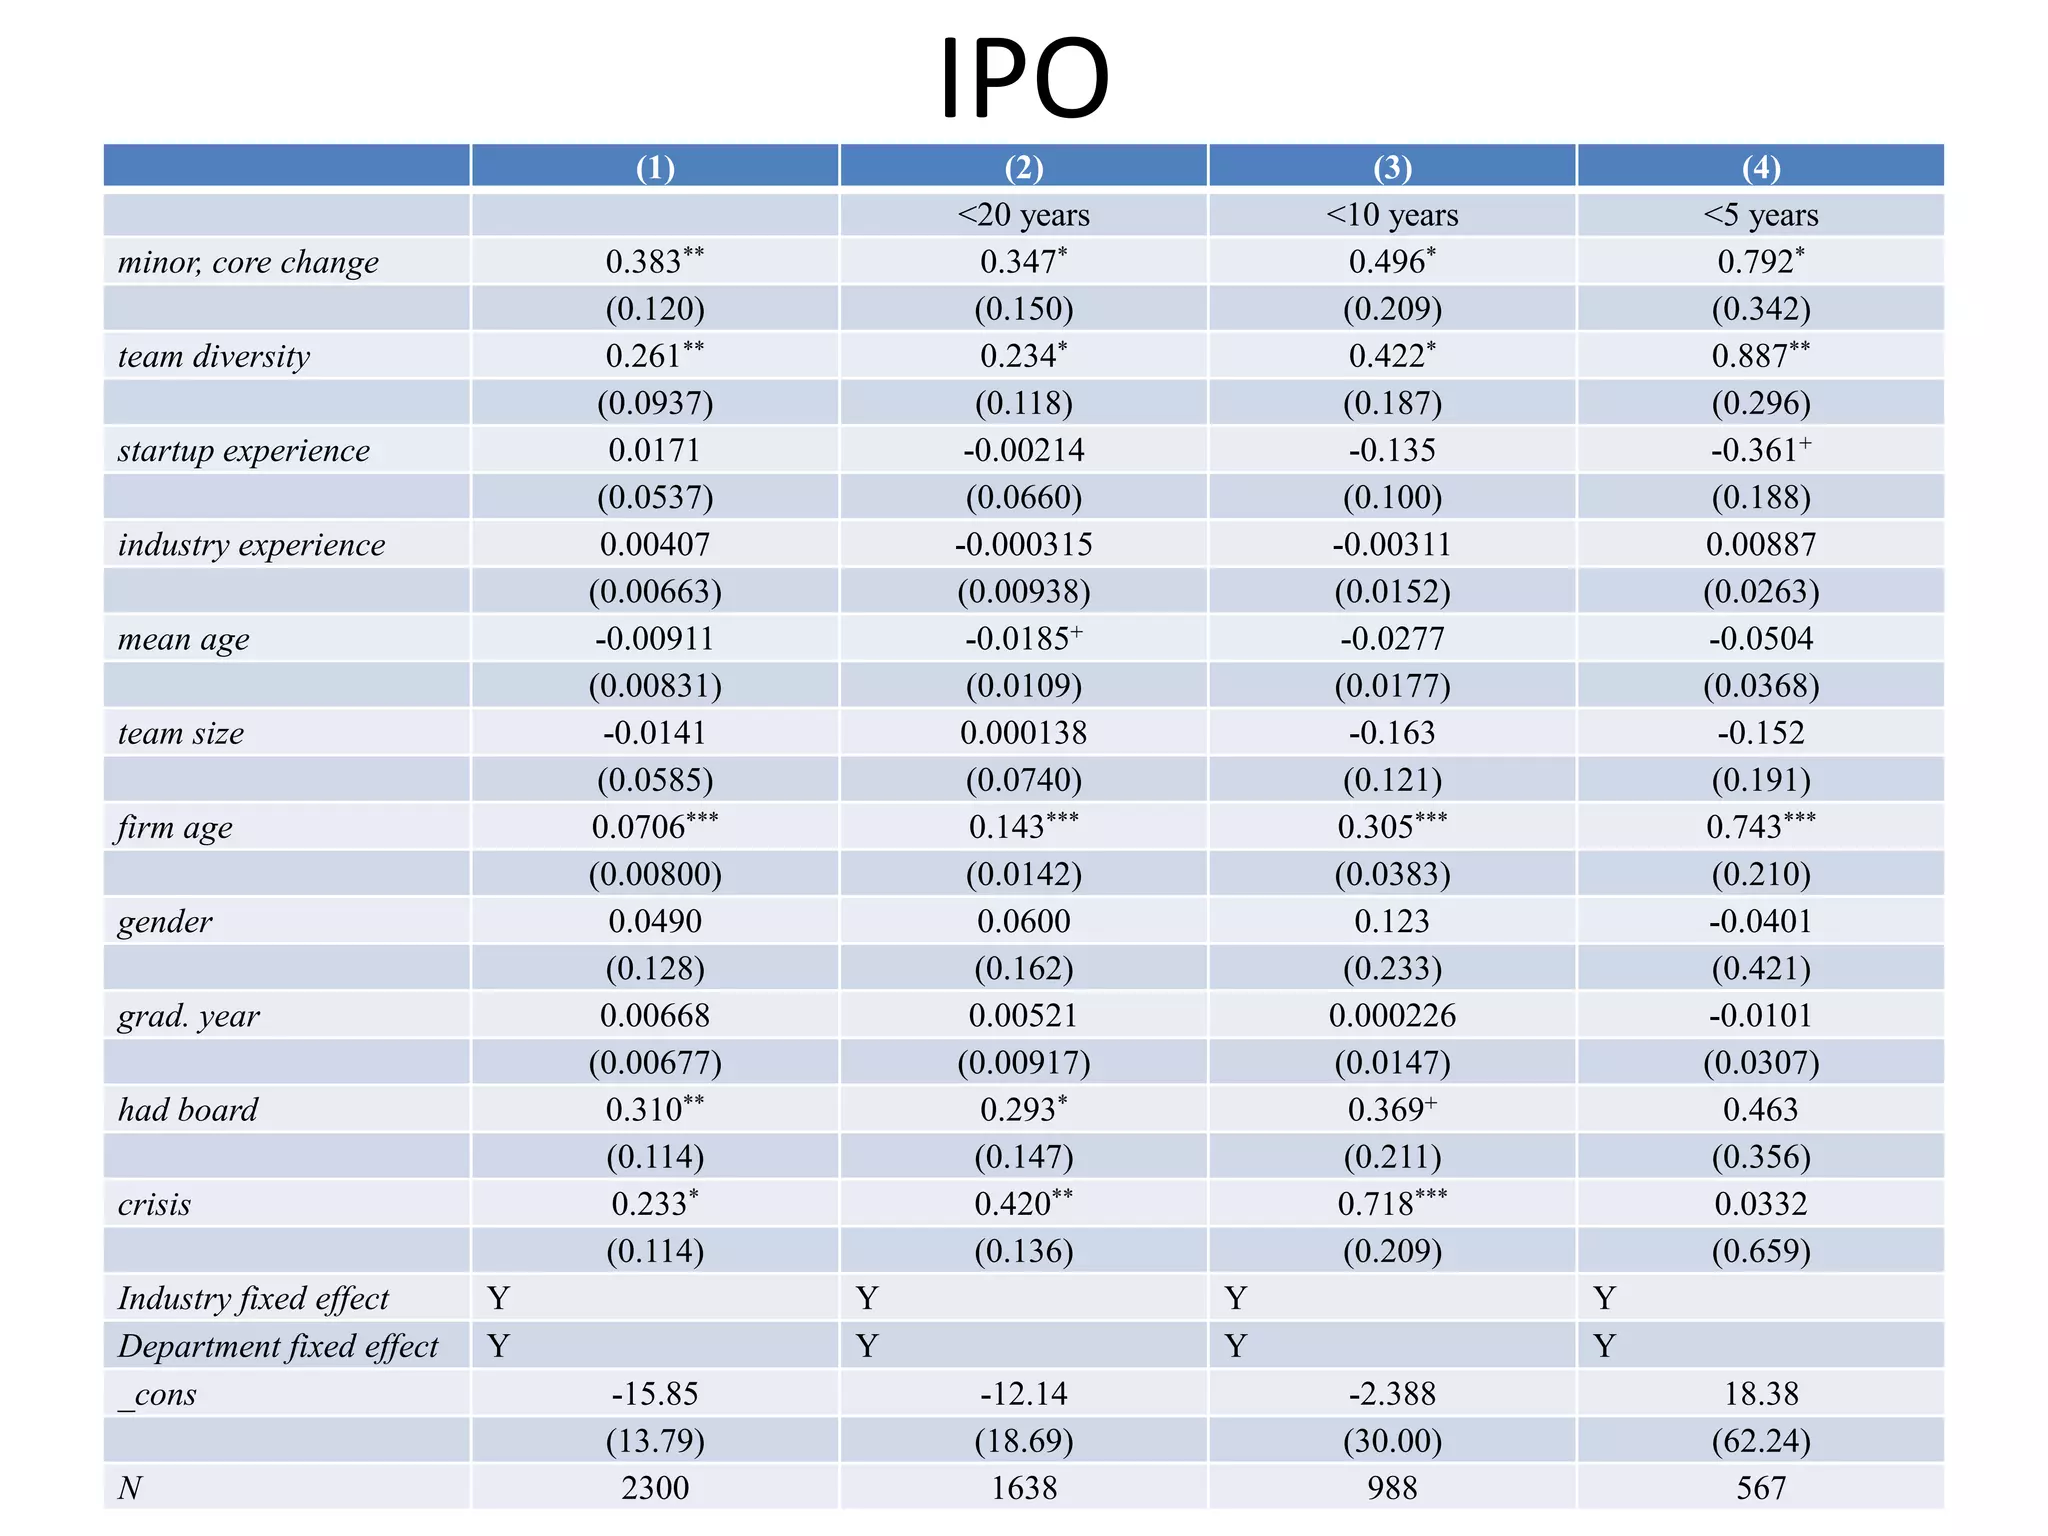
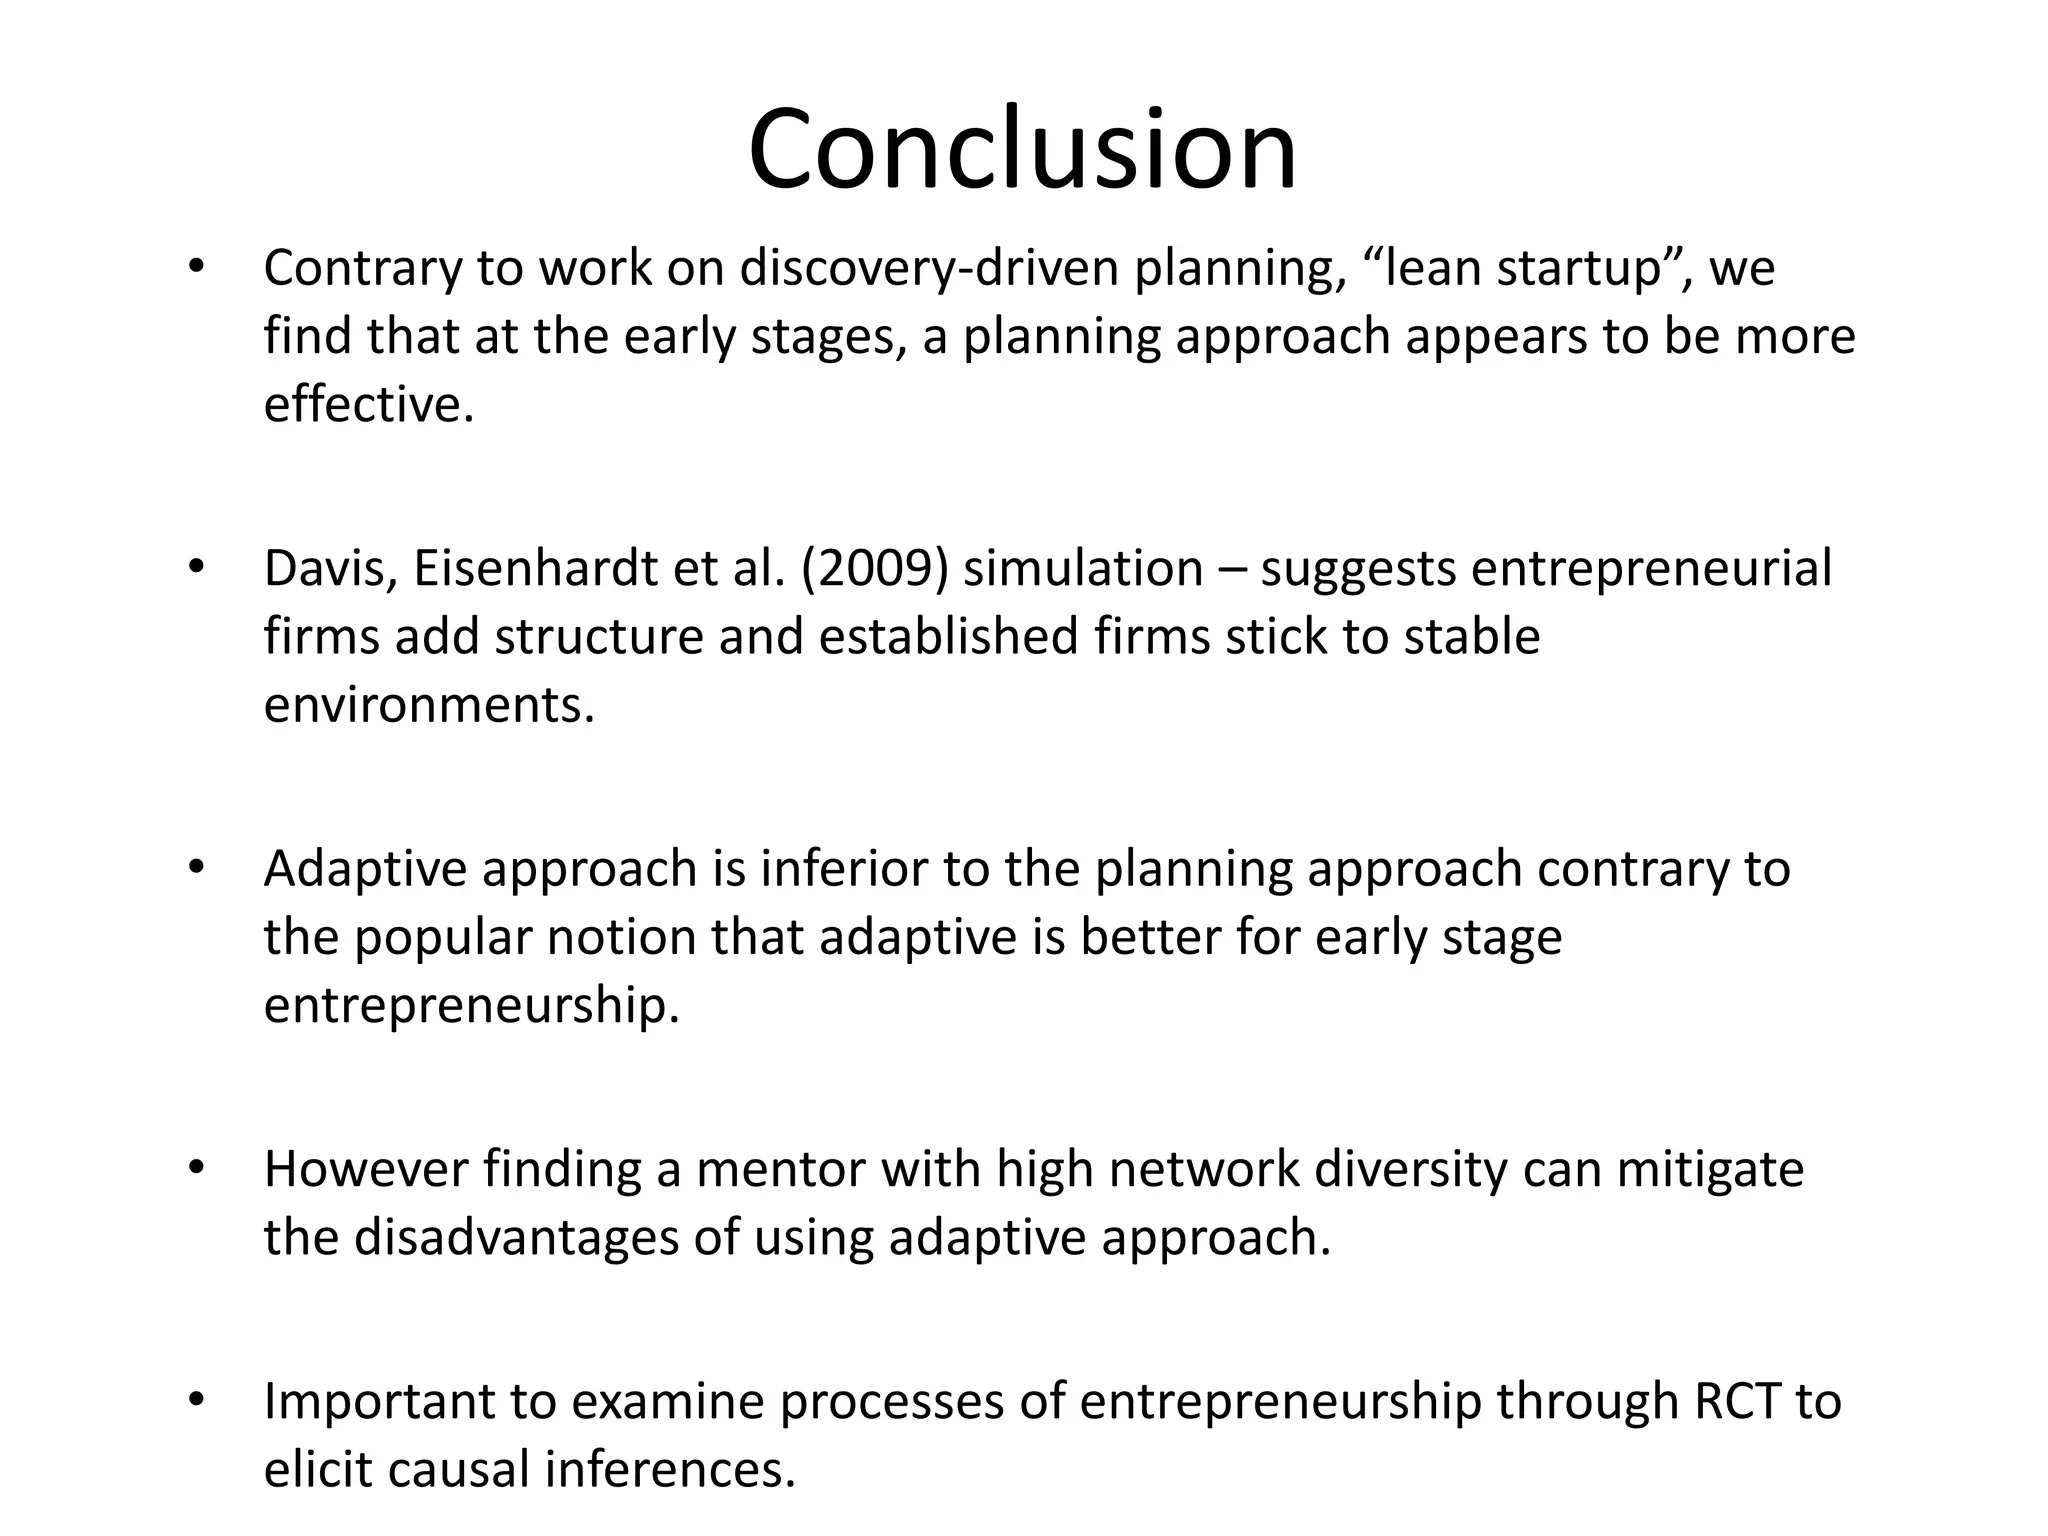

- Two studies on early-stage entrepreneurship: a MOOC experiment and analysis of Stanford alumni data - The MOOC experiment found that entrepreneurs with mentors who had diverse networks performed better when using an adaptive approach, while a planning approach generally led to better outcomes - The alumni data study examined the effects of strategic changes in startups, finding that changes to minor areas of a business close to the core and a diverse founding team were associated with increased chances of IPO


