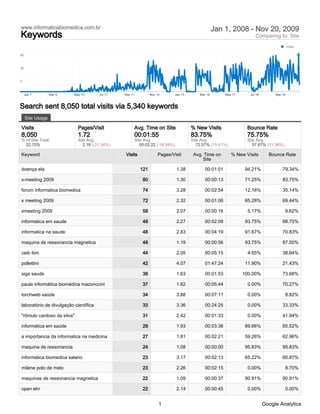
The document is a report on website traffic and keyword search data from www.informaticabiomedica.com.br between January 2008 and November 2019. It provides statistics on total visits, pages per visit, time on site, new visits, and bounce rate. It also lists the top performing search keywords, number of visits from each keyword, and associated statistics. The top keyword was "doença ela" which drove 121 visits. Overall the site saw 8,050 total visits from 5,340 keywords during this period.
Mississauga Lasik CE 2008 by Dr. Jeff MachatMachat LASIK
The document discusses laser refractive surgery. It notes that over 12 million North Americans have had laser vision correction in the past 20 years. It describes the two main procedures as PRK/LASEK where laser pulses are applied to the front of the eye, and LASIK where a corneal flap is created and laser pulses are applied underneath. It emphasizes that fear is often the main deterrent for patients considering the procedures.
Integrated Cost / Schedule Risk Analysis presented methods for analyzing risks in project schedules and costs using simulation techniques like Monte Carlo. It discussed how considering duration risks of individual activities and combining them using simulations captures schedule risks better than deterministic critical path methods. It also showed that schedules with parallel paths merging have higher risks (merge bias) than single path schedules due to uncertainties accumulating at merge points.
Python é amplamente utilizado na ciência para obter, processar e visualizar dados, bem como comunicar resultados. Alguns pacotes populares são IPython para notebooks interativos, NumPy para arrays, Matplotlib para gráficos, Scipy para cálculos, e Scikit-Learn para mineração de dados. Python oferece uma poderosa alternativa a outros softwares científicos.
The document summarizes website analytics data from July 1 to September 30, 2011 and compares it to the previous period of April 1 to June 30, 2011. There was an increase in visits, pageviews, time on site, and unique visitors over the period. Top pages included webinars and short course materials. The majority of traffic came from direct visits and bounce rate and new visits also increased compared to the previous period.
Analytics Forum Ibm 20090810 20090909 (Dashboard Report)Raony Guimarães
This document provides analytics data for a forum website from August 10, 2009 to September 9, 2009. It summarizes key metrics such as visits (7,343), pageviews (43,638), average time on site (00:06:06), bounce rate (32.77%), and new visits (36.74%). The top traffic sources were direct (41.06%) and search engines (37.19%). The majority of visits came from Brazil (6,938 visits, 94.48% of total), with the top city being Ribeirao Preto (4,104 visits). The most viewed page was the forum index page (/infobio/forum/index.php).
Analytics Forum Ibm 20080101 20091120 (Dashboard Report) 1Raony Guimarães
This document provides analytics data from Google Analytics for a forum website called "Forum IBM" between January 2008 and November 2009. It summarizes key metrics about visits, visitors, traffic sources, technical details, maps, and content for the site over this time period. The highest visiting country was Brazil, which accounted for over 112,000 visits from 311 cities. The top city was Ribeirao Preto with over 52,000 visits.
O documento discute o câncer, seu diagnóstico e tratamento. Também descreve as atividades do Hospital A.C. Camargo em informática médica e bioinformática, incluindo o gerenciamento de projetos de pesquisa, banco de tumores e prontuários eletrônicos.
Broadband.co.za Google Analytics ReportBlogatize.net
This document summarizes analytics data for the website www.broadbands.co.za from October 8, 2011 to January 1, 2012. It shows that there were 121 visits from 82 unique visitors over this period. The top three traffic sources were organic searches on Google, direct visits, and referrals from myblogguest.com. South Africa was the dominant country that visits came from.
Analitycs no LinkIrado.com.br de 13 a 31 de janeirobianco11
The document provides analytics data for a website from January 13, 2010 to January 31, 2010. It shows traffic sources, site usage metrics, and a breakdown of traffic and metrics by individual source/medium. A total of 3,491 visits came from 244 sources during this period. Direct traffic and referrals from semprefilmes.net and comofazerweb.com were among the top traffic sources.
Analitycs no LinkIrado.com.br de 01 a 10 de Marçobianco11
The document is a report from Google Analytics summarizing website traffic and usage for the site linkirado.net from January 13, 2010 to March 10, 2010. It shows that the site received 17,587 visits from 452 sources and mediums during this period. Key metrics included a 2.38 pages per visit on average, an average time on site of 3 minutes and 19 seconds, and a 50.11% new visit rate and 67.36% bounce rate overall. The top traffic sources are listed with their individual metrics.
This document is a labor budget and utilization report for a company with multiple employees from 1998-2003 and projections for 2004. It includes each employee's name, position, hourly pay rate, utilization rates by year, standard hours, paid time off allocation, monthly costs, and other payroll details.
This document summarizes website usage statistics from Brazil between August 1, 2009 and October 19, 2009. It shows that the site received 1,171 visits from 97 cities in Brazil, with most visits coming from Fortaleza (625 visits). On average, visitors viewed 2.56 pages per visit and spent 4 minutes and 29 seconds on the site. The bounce rate for the site was 66.01%.
The document summarizes website usage statistics from a single day (February 16, 2011) for the site diycyborg.ning.com. It shows that the site had 545 total visits from 60 countries, with the top three countries being the United States (109 visits), Italy (84 visits), and Spain (36 visits). On average, visitors viewed 5.4 pages per visit and spent 5 minutes and 27 seconds on the site. Nearly half of visits were from new visitors and over a third resulted in visitors bouncing without viewing additional pages.
The document analyzes website usage data from internationalflightonline.com between October 1, 2007 and October 26, 2011. It shows trends in total visits, bounce rates, new visits and other metrics over time. It also lists the top performing keywords that drove traffic to the site, and provides statistics on visits, time on site, bounce rates for each keyword.
This is a presentation highlighting the key findings from the report "Understanding the Relationship Between Nonprofits and Social Media in Duval County, FL" completed in the Fall of 2011, presented at the Florida Political Science Association in Tampa, FL on March 14, 2012.
This document summarizes web traffic analytics for the custom dimension "Dom Pedro" from June 1, 2009 to June 29, 2009. It shows there were 29,665 total visits from 115 countries, with the top countries being Portugal (17,367 visits), United Kingdom (3,946 visits), and United States (1,856 visits). Key metrics like pages per visit, bounce rate, time on site, and average time on site are provided for both the total site and top 10 countries.
The document discusses various issues related to digital advertising metrics, including non-human traffic, click fraud, and viewability. It notes that while the majority of campaigns have low levels of non-human traffic, a meaningful portion have moderate to high levels that can significantly impact metrics and budgets. The document also discusses how the rise of programmatic media buying and reduced oversight has contributed to increased fraud. Marketers are encouraged to look beyond top-line metrics and closely evaluate where their budgets are actually going.
IPOS10 T177- Implementation of a Screening Programme for Cancer Related Distr...Alex J Mitchell
1) The document discusses implementing a screening programme to detect cancer-related distress. It examines whether screening influences detection of distress and quality of care.
2) Results showed screening modestly improved detection sensitivity from 49.7% to 55.8% and specificity remained similar. Detection rates of distress, anxiety, and depression were higher after implementing screening.
3) Nurses reported screening helped communication with patients about psychosocial issues and informed clinical judgement, particularly for those with high distress.
The document provides market index data and statistics for several US stock market indices as of Wednesday, August 26, 2009. It includes data on the S&P 100, Nasdaq 100, S&P 500, Russell 1000, Russell 2000, and Russell 3000 indices such as price changes, number of constituent stocks, moving averages, and levels of stocks breaking out above or below common thresholds. Overall, the majority of indices were up over the past day and week according to the data, with some mixed performance at longer timeframes. Volume was down across most indices compared to the previous day.
This document contains analytics data from the website www.careerpoint.ac.in from January 1, 2016 to May 4, 2016. It shows key metrics such as pageviews, unique pageviews, average time on page, entrances, bounce rate, and exit rate for the top 50 pages on the site during this period. The most viewed page was for the keyword "(not set)" with over 134,000 pageviews, while the page with the longest average time was for the keyword "jee" at over 6 minutes.
This document summarizes web analytics data for a custom dimension called "Dom Pedro" from June 1 to June 29, 2009. It shows there were 1,856 visits from 26 sources. The majority of visits (1,344) and bounce rate (81.7%) came from hotelrooms.com referrals. Overall visits accounted for 6.26% of total site traffic and average time on site was lower than average.
The document provides market index data for several US stock market indices as of July 28, 2009. It includes daily and weekly statistics on price changes, advancing and declining stocks, and moving average positions. The S&P 500 was down 18.4% on the day. Most indices saw over 40% of component stocks declining for the day, with advances outperforming declines on a weekly basis for many indices. Moving averages were mostly in bullish positions across short, intermediate and long-term periods.
The document provides stock market index data for several US stock market indices including the S&P 100, Nasdaq 100, S&P 500, Russell 1000, Russell 2000, and Russell 3000. For each index, it includes daily and weekly statistics on price changes, moving averages, highs and lows, and other metrics. All indices showed declines in price of 25-50% over the period analyzed.
This document provides stock market index data for several major US stock indexes as of Thursday, August 27, 2009. It includes daily and weekly performance statistics as well as information on moving averages and highs/lows for indexes such as the S&P 500, Nasdaq 100, Russell 1000, Russell 2000 and Russell 3000. The indexes showed mixed performance for the day, week and time periods measured, with price changes ranging from up 17% to down 5.58%.
The document provides stock market index data for several major US stock indexes as of Friday, November 13, 2009. It includes daily and weekly statistics on price movement, trading volume, and percentages of stocks within each index above or below moving averages. The S&P 500 and other indexes saw price increases of over 50% and high percentages of stocks above moving averages for periods of 3 days, 3 weeks, and longer.
The document contains market index data from various US stock markets as of July 27, 2009. It provides price and volume information for indexes like the S&P 100, Nasdaq 100, S&P 500, and Russell indexes. Metrics such as moving averages, highs/lows, and breakouts are also included to analyze the performance and trends of these indexes.
The document provides market index data for several US stock market indices as of Tuesday, November 3, 2009. It includes information such as the daily price change, percentage of advancers and decliners, moving average data, and high/low statistics for the S&P 100, Nasdaq 100, S&P 500, Russell 1000, Russell 2000, and Russell 3000.
Trusted Execution Environment for Decentralized Process MiningLucaBarbaro3
Presentation of the paper "Trusted Execution Environment for Decentralized Process Mining" given during the CAiSE 2024 Conference in Cyprus on June 7, 2024.
5th LF Energy Power Grid Model Meet-up SlidesDanBrown980551
5th Power Grid Model Meet-up
It is with great pleasure that we extend to you an invitation to the 5th Power Grid Model Meet-up, scheduled for 6th June 2024. This event will adopt a hybrid format, allowing participants to join us either through an online Mircosoft Teams session or in person at TU/e located at Den Dolech 2, Eindhoven, Netherlands. The meet-up will be hosted by Eindhoven University of Technology (TU/e), a research university specializing in engineering science & technology.
Power Grid Model
The global energy transition is placing new and unprecedented demands on Distribution System Operators (DSOs). Alongside upgrades to grid capacity, processes such as digitization, capacity optimization, and congestion management are becoming vital for delivering reliable services.
Power Grid Model is an open source project from Linux Foundation Energy and provides a calculation engine that is increasingly essential for DSOs. It offers a standards-based foundation enabling real-time power systems analysis, simulations of electrical power grids, and sophisticated what-if analysis. In addition, it enables in-depth studies and analysis of the electrical power grid’s behavior and performance. This comprehensive model incorporates essential factors such as power generation capacity, electrical losses, voltage levels, power flows, and system stability.
Power Grid Model is currently being applied in a wide variety of use cases, including grid planning, expansion, reliability, and congestion studies. It can also help in analyzing the impact of renewable energy integration, assessing the effects of disturbances or faults, and developing strategies for grid control and optimization.
What to expect
For the upcoming meetup we are organizing, we have an exciting lineup of activities planned:
-Insightful presentations covering two practical applications of the Power Grid Model.
-An update on the latest advancements in Power Grid -Model technology during the first and second quarters of 2024.
-An interactive brainstorming session to discuss and propose new feature requests.
-An opportunity to connect with fellow Power Grid Model enthusiasts and users.
More Related Content
Similar to Analytics Www.Informaticabiomedica.Com.Br 20080101 20091120 (Keywords Report)
Analitycs no LinkIrado.com.br de 13 a 31 de janeirobianco11
The document provides analytics data for a website from January 13, 2010 to January 31, 2010. It shows traffic sources, site usage metrics, and a breakdown of traffic and metrics by individual source/medium. A total of 3,491 visits came from 244 sources during this period. Direct traffic and referrals from semprefilmes.net and comofazerweb.com were among the top traffic sources.
Analitycs no LinkIrado.com.br de 01 a 10 de Marçobianco11
The document is a report from Google Analytics summarizing website traffic and usage for the site linkirado.net from January 13, 2010 to March 10, 2010. It shows that the site received 17,587 visits from 452 sources and mediums during this period. Key metrics included a 2.38 pages per visit on average, an average time on site of 3 minutes and 19 seconds, and a 50.11% new visit rate and 67.36% bounce rate overall. The top traffic sources are listed with their individual metrics.
This document is a labor budget and utilization report for a company with multiple employees from 1998-2003 and projections for 2004. It includes each employee's name, position, hourly pay rate, utilization rates by year, standard hours, paid time off allocation, monthly costs, and other payroll details.
This document summarizes website usage statistics from Brazil between August 1, 2009 and October 19, 2009. It shows that the site received 1,171 visits from 97 cities in Brazil, with most visits coming from Fortaleza (625 visits). On average, visitors viewed 2.56 pages per visit and spent 4 minutes and 29 seconds on the site. The bounce rate for the site was 66.01%.
The document summarizes website usage statistics from a single day (February 16, 2011) for the site diycyborg.ning.com. It shows that the site had 545 total visits from 60 countries, with the top three countries being the United States (109 visits), Italy (84 visits), and Spain (36 visits). On average, visitors viewed 5.4 pages per visit and spent 5 minutes and 27 seconds on the site. Nearly half of visits were from new visitors and over a third resulted in visitors bouncing without viewing additional pages.
The document analyzes website usage data from internationalflightonline.com between October 1, 2007 and October 26, 2011. It shows trends in total visits, bounce rates, new visits and other metrics over time. It also lists the top performing keywords that drove traffic to the site, and provides statistics on visits, time on site, bounce rates for each keyword.
This is a presentation highlighting the key findings from the report "Understanding the Relationship Between Nonprofits and Social Media in Duval County, FL" completed in the Fall of 2011, presented at the Florida Political Science Association in Tampa, FL on March 14, 2012.
This document summarizes web traffic analytics for the custom dimension "Dom Pedro" from June 1, 2009 to June 29, 2009. It shows there were 29,665 total visits from 115 countries, with the top countries being Portugal (17,367 visits), United Kingdom (3,946 visits), and United States (1,856 visits). Key metrics like pages per visit, bounce rate, time on site, and average time on site are provided for both the total site and top 10 countries.
The document discusses various issues related to digital advertising metrics, including non-human traffic, click fraud, and viewability. It notes that while the majority of campaigns have low levels of non-human traffic, a meaningful portion have moderate to high levels that can significantly impact metrics and budgets. The document also discusses how the rise of programmatic media buying and reduced oversight has contributed to increased fraud. Marketers are encouraged to look beyond top-line metrics and closely evaluate where their budgets are actually going.
IPOS10 T177- Implementation of a Screening Programme for Cancer Related Distr...Alex J Mitchell
1) The document discusses implementing a screening programme to detect cancer-related distress. It examines whether screening influences detection of distress and quality of care.
2) Results showed screening modestly improved detection sensitivity from 49.7% to 55.8% and specificity remained similar. Detection rates of distress, anxiety, and depression were higher after implementing screening.
3) Nurses reported screening helped communication with patients about psychosocial issues and informed clinical judgement, particularly for those with high distress.
The document provides market index data and statistics for several US stock market indices as of Wednesday, August 26, 2009. It includes data on the S&P 100, Nasdaq 100, S&P 500, Russell 1000, Russell 2000, and Russell 3000 indices such as price changes, number of constituent stocks, moving averages, and levels of stocks breaking out above or below common thresholds. Overall, the majority of indices were up over the past day and week according to the data, with some mixed performance at longer timeframes. Volume was down across most indices compared to the previous day.
This document contains analytics data from the website www.careerpoint.ac.in from January 1, 2016 to May 4, 2016. It shows key metrics such as pageviews, unique pageviews, average time on page, entrances, bounce rate, and exit rate for the top 50 pages on the site during this period. The most viewed page was for the keyword "(not set)" with over 134,000 pageviews, while the page with the longest average time was for the keyword "jee" at over 6 minutes.
This document summarizes web analytics data for a custom dimension called "Dom Pedro" from June 1 to June 29, 2009. It shows there were 1,856 visits from 26 sources. The majority of visits (1,344) and bounce rate (81.7%) came from hotelrooms.com referrals. Overall visits accounted for 6.26% of total site traffic and average time on site was lower than average.
The document provides market index data for several US stock market indices as of July 28, 2009. It includes daily and weekly statistics on price changes, advancing and declining stocks, and moving average positions. The S&P 500 was down 18.4% on the day. Most indices saw over 40% of component stocks declining for the day, with advances outperforming declines on a weekly basis for many indices. Moving averages were mostly in bullish positions across short, intermediate and long-term periods.
The document provides stock market index data for several US stock market indices including the S&P 100, Nasdaq 100, S&P 500, Russell 1000, Russell 2000, and Russell 3000. For each index, it includes daily and weekly statistics on price changes, moving averages, highs and lows, and other metrics. All indices showed declines in price of 25-50% over the period analyzed.
This document provides stock market index data for several major US stock indexes as of Thursday, August 27, 2009. It includes daily and weekly performance statistics as well as information on moving averages and highs/lows for indexes such as the S&P 500, Nasdaq 100, Russell 1000, Russell 2000 and Russell 3000. The indexes showed mixed performance for the day, week and time periods measured, with price changes ranging from up 17% to down 5.58%.
The document provides stock market index data for several major US stock indexes as of Friday, November 13, 2009. It includes daily and weekly statistics on price movement, trading volume, and percentages of stocks within each index above or below moving averages. The S&P 500 and other indexes saw price increases of over 50% and high percentages of stocks above moving averages for periods of 3 days, 3 weeks, and longer.
The document contains market index data from various US stock markets as of July 27, 2009. It provides price and volume information for indexes like the S&P 100, Nasdaq 100, S&P 500, and Russell indexes. Metrics such as moving averages, highs/lows, and breakouts are also included to analyze the performance and trends of these indexes.
The document provides market index data for several US stock market indices as of Tuesday, November 3, 2009. It includes information such as the daily price change, percentage of advancers and decliners, moving average data, and high/low statistics for the S&P 100, Nasdaq 100, S&P 500, Russell 1000, Russell 2000, and Russell 3000.
Similar to Analytics Www.Informaticabiomedica.Com.Br 20080101 20091120 (Keywords Report) (20)
Trusted Execution Environment for Decentralized Process MiningLucaBarbaro3
Presentation of the paper "Trusted Execution Environment for Decentralized Process Mining" given during the CAiSE 2024 Conference in Cyprus on June 7, 2024.
5th LF Energy Power Grid Model Meet-up SlidesDanBrown980551
5th Power Grid Model Meet-up
It is with great pleasure that we extend to you an invitation to the 5th Power Grid Model Meet-up, scheduled for 6th June 2024. This event will adopt a hybrid format, allowing participants to join us either through an online Mircosoft Teams session or in person at TU/e located at Den Dolech 2, Eindhoven, Netherlands. The meet-up will be hosted by Eindhoven University of Technology (TU/e), a research university specializing in engineering science & technology.
Power Grid Model
The global energy transition is placing new and unprecedented demands on Distribution System Operators (DSOs). Alongside upgrades to grid capacity, processes such as digitization, capacity optimization, and congestion management are becoming vital for delivering reliable services.
Power Grid Model is an open source project from Linux Foundation Energy and provides a calculation engine that is increasingly essential for DSOs. It offers a standards-based foundation enabling real-time power systems analysis, simulations of electrical power grids, and sophisticated what-if analysis. In addition, it enables in-depth studies and analysis of the electrical power grid’s behavior and performance. This comprehensive model incorporates essential factors such as power generation capacity, electrical losses, voltage levels, power flows, and system stability.
Power Grid Model is currently being applied in a wide variety of use cases, including grid planning, expansion, reliability, and congestion studies. It can also help in analyzing the impact of renewable energy integration, assessing the effects of disturbances or faults, and developing strategies for grid control and optimization.
What to expect
For the upcoming meetup we are organizing, we have an exciting lineup of activities planned:
-Insightful presentations covering two practical applications of the Power Grid Model.
-An update on the latest advancements in Power Grid -Model technology during the first and second quarters of 2024.
-An interactive brainstorming session to discuss and propose new feature requests.
-An opportunity to connect with fellow Power Grid Model enthusiasts and users.
TrustArc Webinar - 2024 Global Privacy SurveyTrustArc
How does your privacy program stack up against your peers? What challenges are privacy teams tackling and prioritizing in 2024?
In the fifth annual Global Privacy Benchmarks Survey, we asked over 1,800 global privacy professionals and business executives to share their perspectives on the current state of privacy inside and outside of their organizations. This year’s report focused on emerging areas of importance for privacy and compliance professionals, including considerations and implications of Artificial Intelligence (AI) technologies, building brand trust, and different approaches for achieving higher privacy competence scores.
See how organizational priorities and strategic approaches to data security and privacy are evolving around the globe.
This webinar will review:
- The top 10 privacy insights from the fifth annual Global Privacy Benchmarks Survey
- The top challenges for privacy leaders, practitioners, and organizations in 2024
- Key themes to consider in developing and maintaining your privacy program
Best 20 SEO Techniques To Improve Website Visibility In SERPPixlogix Infotech
Boost your website's visibility with proven SEO techniques! Our latest blog dives into essential strategies to enhance your online presence, increase traffic, and rank higher on search engines. From keyword optimization to quality content creation, learn how to make your site stand out in the crowded digital landscape. Discover actionable tips and expert insights to elevate your SEO game.
Introduction of Cybersecurity with OSS at Code Europe 2024Hiroshi SHIBATA
I develop the Ruby programming language, RubyGems, and Bundler, which are package managers for Ruby. Today, I will introduce how to enhance the security of your application using open-source software (OSS) examples from Ruby and RubyGems.
The first topic is CVE (Common Vulnerabilities and Exposures). I have published CVEs many times. But what exactly is a CVE? I'll provide a basic understanding of CVEs and explain how to detect and handle vulnerabilities in OSS.
Next, let's discuss package managers. Package managers play a critical role in the OSS ecosystem. I'll explain how to manage library dependencies in your application.
I'll share insights into how the Ruby and RubyGems core team works to keep our ecosystem safe. By the end of this talk, you'll have a better understanding of how to safeguard your code.
Digital Marketing Trends in 2024 | Guide for Staying AheadWask
https://www.wask.co/ebooks/digital-marketing-trends-in-2024
Feeling lost in the digital marketing whirlwind of 2024? Technology is changing, consumer habits are evolving, and staying ahead of the curve feels like a never-ending pursuit. This e-book is your compass. Dive into actionable insights to handle the complexities of modern marketing. From hyper-personalization to the power of user-generated content, learn how to build long-term relationships with your audience and unlock the secrets to success in the ever-shifting digital landscape.
GraphRAG for Life Science to increase LLM accuracyTomaz Bratanic
GraphRAG for life science domain, where you retriever information from biomedical knowledge graphs using LLMs to increase the accuracy and performance of generated answers
Ivanti’s Patch Tuesday breakdown goes beyond patching your applications and brings you the intelligence and guidance needed to prioritize where to focus your attention first. Catch early analysis on our Ivanti blog, then join industry expert Chris Goettl for the Patch Tuesday Webinar Event. There we’ll do a deep dive into each of the bulletins and give guidance on the risks associated with the newly-identified vulnerabilities.
Fueling AI with Great Data with Airbyte WebinarZilliz
This talk will focus on how to collect data from a variety of sources, leveraging this data for RAG and other GenAI use cases, and finally charting your course to productionalization.
Taking AI to the Next Level in Manufacturing.pdfssuserfac0301
Read Taking AI to the Next Level in Manufacturing to gain insights on AI adoption in the manufacturing industry, such as:
1. How quickly AI is being implemented in manufacturing.
2. Which barriers stand in the way of AI adoption.
3. How data quality and governance form the backbone of AI.
4. Organizational processes and structures that may inhibit effective AI adoption.
6. Ideas and approaches to help build your organization's AI strategy.
Salesforce Integration for Bonterra Impact Management (fka Social Solutions A...Jeffrey Haguewood
Sidekick Solutions uses Bonterra Impact Management (fka Social Solutions Apricot) and automation solutions to integrate data for business workflows.
We believe integration and automation are essential to user experience and the promise of efficient work through technology. Automation is the critical ingredient to realizing that full vision. We develop integration products and services for Bonterra Case Management software to support the deployment of automations for a variety of use cases.
This video focuses on integration of Salesforce with Bonterra Impact Management.
Interested in deploying an integration with Salesforce for Bonterra Impact Management? Contact us at sales@sidekicksolutionsllc.com to discuss next steps.
Your One-Stop Shop for Python Success: Top 10 US Python Development Providersakankshawande
Simplify your search for a reliable Python development partner! This list presents the top 10 trusted US providers offering comprehensive Python development services, ensuring your project's success from conception to completion.
leewayhertz.com-AI in predictive maintenance Use cases technologies benefits ...alexjohnson7307
Predictive maintenance is a proactive approach that anticipates equipment failures before they happen. At the forefront of this innovative strategy is Artificial Intelligence (AI), which brings unprecedented precision and efficiency. AI in predictive maintenance is transforming industries by reducing downtime, minimizing costs, and enhancing productivity.
A Comprehensive Guide to DeFi Development Services in 2024Intelisync
DeFi represents a paradigm shift in the financial industry. Instead of relying on traditional, centralized institutions like banks, DeFi leverages blockchain technology to create a decentralized network of financial services. This means that financial transactions can occur directly between parties, without intermediaries, using smart contracts on platforms like Ethereum.
In 2024, we are witnessing an explosion of new DeFi projects and protocols, each pushing the boundaries of what’s possible in finance.
In summary, DeFi in 2024 is not just a trend; it’s a revolution that democratizes finance, enhances security and transparency, and fosters continuous innovation. As we proceed through this presentation, we'll explore the various components and services of DeFi in detail, shedding light on how they are transforming the financial landscape.
At Intelisync, we specialize in providing comprehensive DeFi development services tailored to meet the unique needs of our clients. From smart contract development to dApp creation and security audits, we ensure that your DeFi project is built with innovation, security, and scalability in mind. Trust Intelisync to guide you through the intricate landscape of decentralized finance and unlock the full potential of blockchain technology.
Ready to take your DeFi project to the next level? Partner with Intelisync for expert DeFi development services today!
Ocean lotus Threat actors project by John Sitima 2024 (1).pptxSitimaJohn
Ocean Lotus cyber threat actors represent a sophisticated, persistent, and politically motivated group that poses a significant risk to organizations and individuals in the Southeast Asian region. Their continuous evolution and adaptability underscore the need for robust cybersecurity measures and international cooperation to identify and mitigate the threats posed by such advanced persistent threat groups.
HCL Notes and Domino License Cost Reduction in the World of DLAUpanagenda
Webinar Recording: https://www.panagenda.com/webinars/hcl-notes-and-domino-license-cost-reduction-in-the-world-of-dlau/
The introduction of DLAU and the CCB & CCX licensing model caused quite a stir in the HCL community. As a Notes and Domino customer, you may have faced challenges with unexpected user counts and license costs. You probably have questions on how this new licensing approach works and how to benefit from it. Most importantly, you likely have budget constraints and want to save money where possible. Don’t worry, we can help with all of this!
We’ll show you how to fix common misconfigurations that cause higher-than-expected user counts, and how to identify accounts which you can deactivate to save money. There are also frequent patterns that can cause unnecessary cost, like using a person document instead of a mail-in for shared mailboxes. We’ll provide examples and solutions for those as well. And naturally we’ll explain the new licensing model.
Join HCL Ambassador Marc Thomas in this webinar with a special guest appearance from Franz Walder. It will give you the tools and know-how to stay on top of what is going on with Domino licensing. You will be able lower your cost through an optimized configuration and keep it low going forward.
These topics will be covered
- Reducing license cost by finding and fixing misconfigurations and superfluous accounts
- How do CCB and CCX licenses really work?
- Understanding the DLAU tool and how to best utilize it
- Tips for common problem areas, like team mailboxes, functional/test users, etc
- Practical examples and best practices to implement right away