Download to read offline

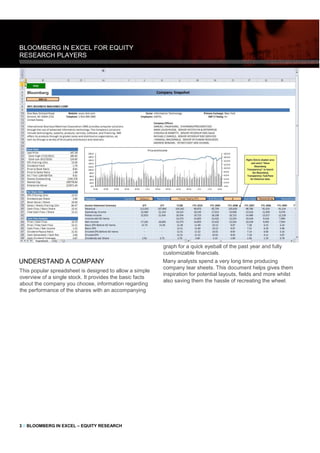
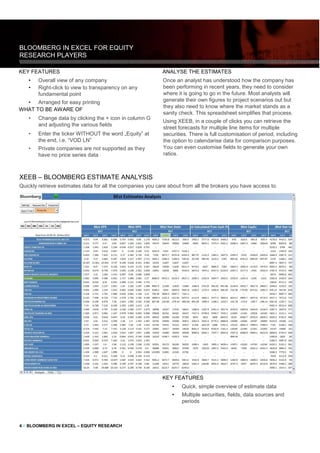
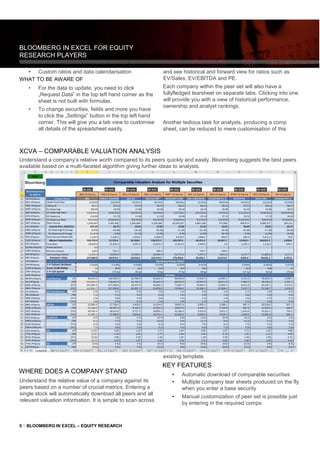
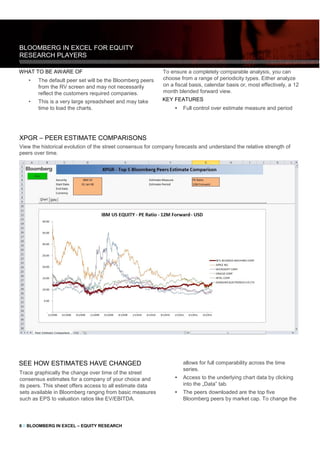
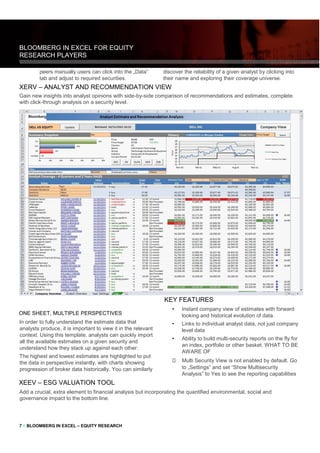

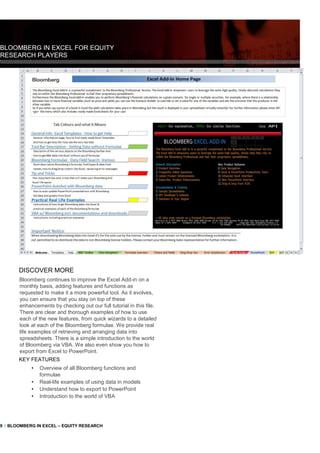

This document provides summaries of Excel templates available from Bloomberg that are useful for equity research. It describes templates for company snapshots (XCS4), estimate analysis (XEEB), comparable valuation (XCVA), historical estimate analysis (XPGR), estimate revision analysis (XERV), ESG valuation (XEEB), and an API tutorial (XAPI). Each template summary includes key features, what to be aware of, and how analysts can use the templates to efficiently analyze companies, estimates, valuations, and incorporate ESG factors into financial models.


