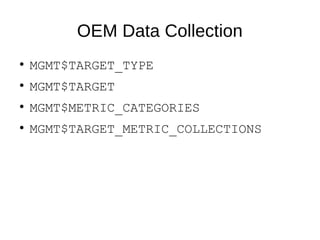
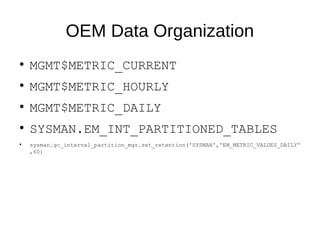
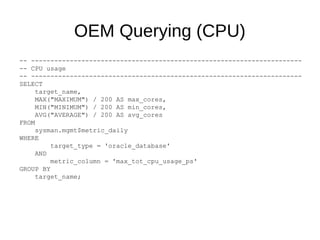
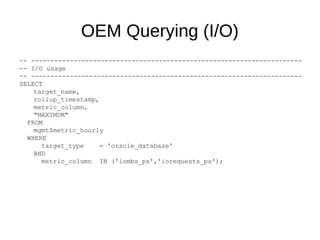
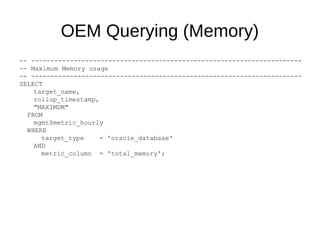
Using SQL on OEM Data
●
OEM Data Collection
●
OEM Data Organization
●
OEM Querying
OEM Data Collection
●
MGMT$TARGET_TYPE
●
MGMT$TARGET
●
MGMT$METRIC_CATEGORIES
●
MGMT$TARGET_METRIC_COLLECTIONS
OEM Data Organization
●
MGMT$METRIC_CURRENT
●
MGMT$METRIC_HOURLY
●
MGMT$METRIC_DAILY
●
SYSMAN.EM_INT_PARTITIONED_TABLES
●
sysman.gc_interval_partition_mgr.set_retention('SYSMAN','EM_METRIC_VALUES_DAILY'
,60)
OEM Querying (CPU)
-- ----------------------------------------------------------------------
-- CPU usage
-- ----------------------------------------------------------------------
SELECT
target_name,
MAX("MAXIMUM") / 200 AS max_cores,
MIN("MINIMUM") / 200 AS min_cores,
AVG("AVERAGE") / 200 AS avg_cores
FROM
sysman.mgmt$metric_daily
WHERE
target_type = 'oracle_database'
AND
metric_column = 'max_tot_cpu_usage_ps'
GROUP BY
target_name;
OEM Querying (I/O)
-- ----------------------------------------------------------------------
-- I/O usage
-- ----------------------------------------------------------------------
SELECT
target_name,
rollup_timestamp,
metric_column,
"MAXIMUM"
FROM
mgmt$metric_hourly
WHERE
target_type = 'oracle_database'
AND
metric_column IN ('iombs_ps','iorequests_ps');
OEM Querying (Memory)
-- ----------------------------------------------------------------------
-- Maximum Memory usage
-- ----------------------------------------------------------------------
SELECT
target_name,
rollup_timestamp,
"MAXIMUM"
FROM
mgmt$metric_hourly
WHERE
target_type = 'oracle_database'
AND
metric_column = 'total_memory';

Using SQL on OEM Data

Editor's Notes

  • #2 The public interface to OEM data is through the public views whose names start with MGMT$ This is the documented interface These are accessible through your OEM administrator accounts These are what you see through the EMCLI command In the SYSMAN schema, there is a plethora of other tables and views which are undocumented by Oracle. Use these at your own risk. These are for very advanced queries that access data that is not available through the public interface. In OEM 12C and 13C, the reference is “Enterprise Manager Cloud Control Management Repository Views Reference”
  • #3 Target types (target_type) of interest: ‘host’ ‘oracle_database’ ‘rac_database’ ‘cluster’ Can use either target_name or target_guid to reference a target target_name is case sensitive – use REGEXP_LIKE(target_name, ‘...’, ‘i’) Not all metrics are collected for all targets – use MGMT$TARGET_METRIC_COLLECTIONS to find: If metric is collected for a target (IS_ENABLED=1) Frequency of collection (FREQUENCY_CODE) ‘Interval’ If metric is saved in history (UPLOAD_POLICY > 0)
  • #4 Latest collections are in MGMT$METRIC_CURRENT Kept for seven (7) days COLLECTION_TIMESTAMP Rolled up into hourly summaries (MGMT$METRIC_HOURLY) at midnight kept for 32 days ROLLUP_TIMESTAMP Rolled up into daily summaries (MGMT$METRIC_DAILY) kept for three (3) years by default. Can be extended through ROLLUP_TIMESTAMP Summaries given minimum, average, maximum, and standard deviation for numeric metrics Mostly useless because of known peaks like backups, overnight batch jobs, etc. SELECT table_name, partitions_retained, partition_size FROM sysman.em_int_partitioned_tables WHERE table_name LIKE 'EM_METRIC_VALUES%';
  • #5 Assumes CPU Threads are being used Metric is actually centi-seconds
  • #6 I/O Megabytes/second = iombs_ps I/O requests/second = iorequests_ps
  • #7 Maximum memory usage in MB