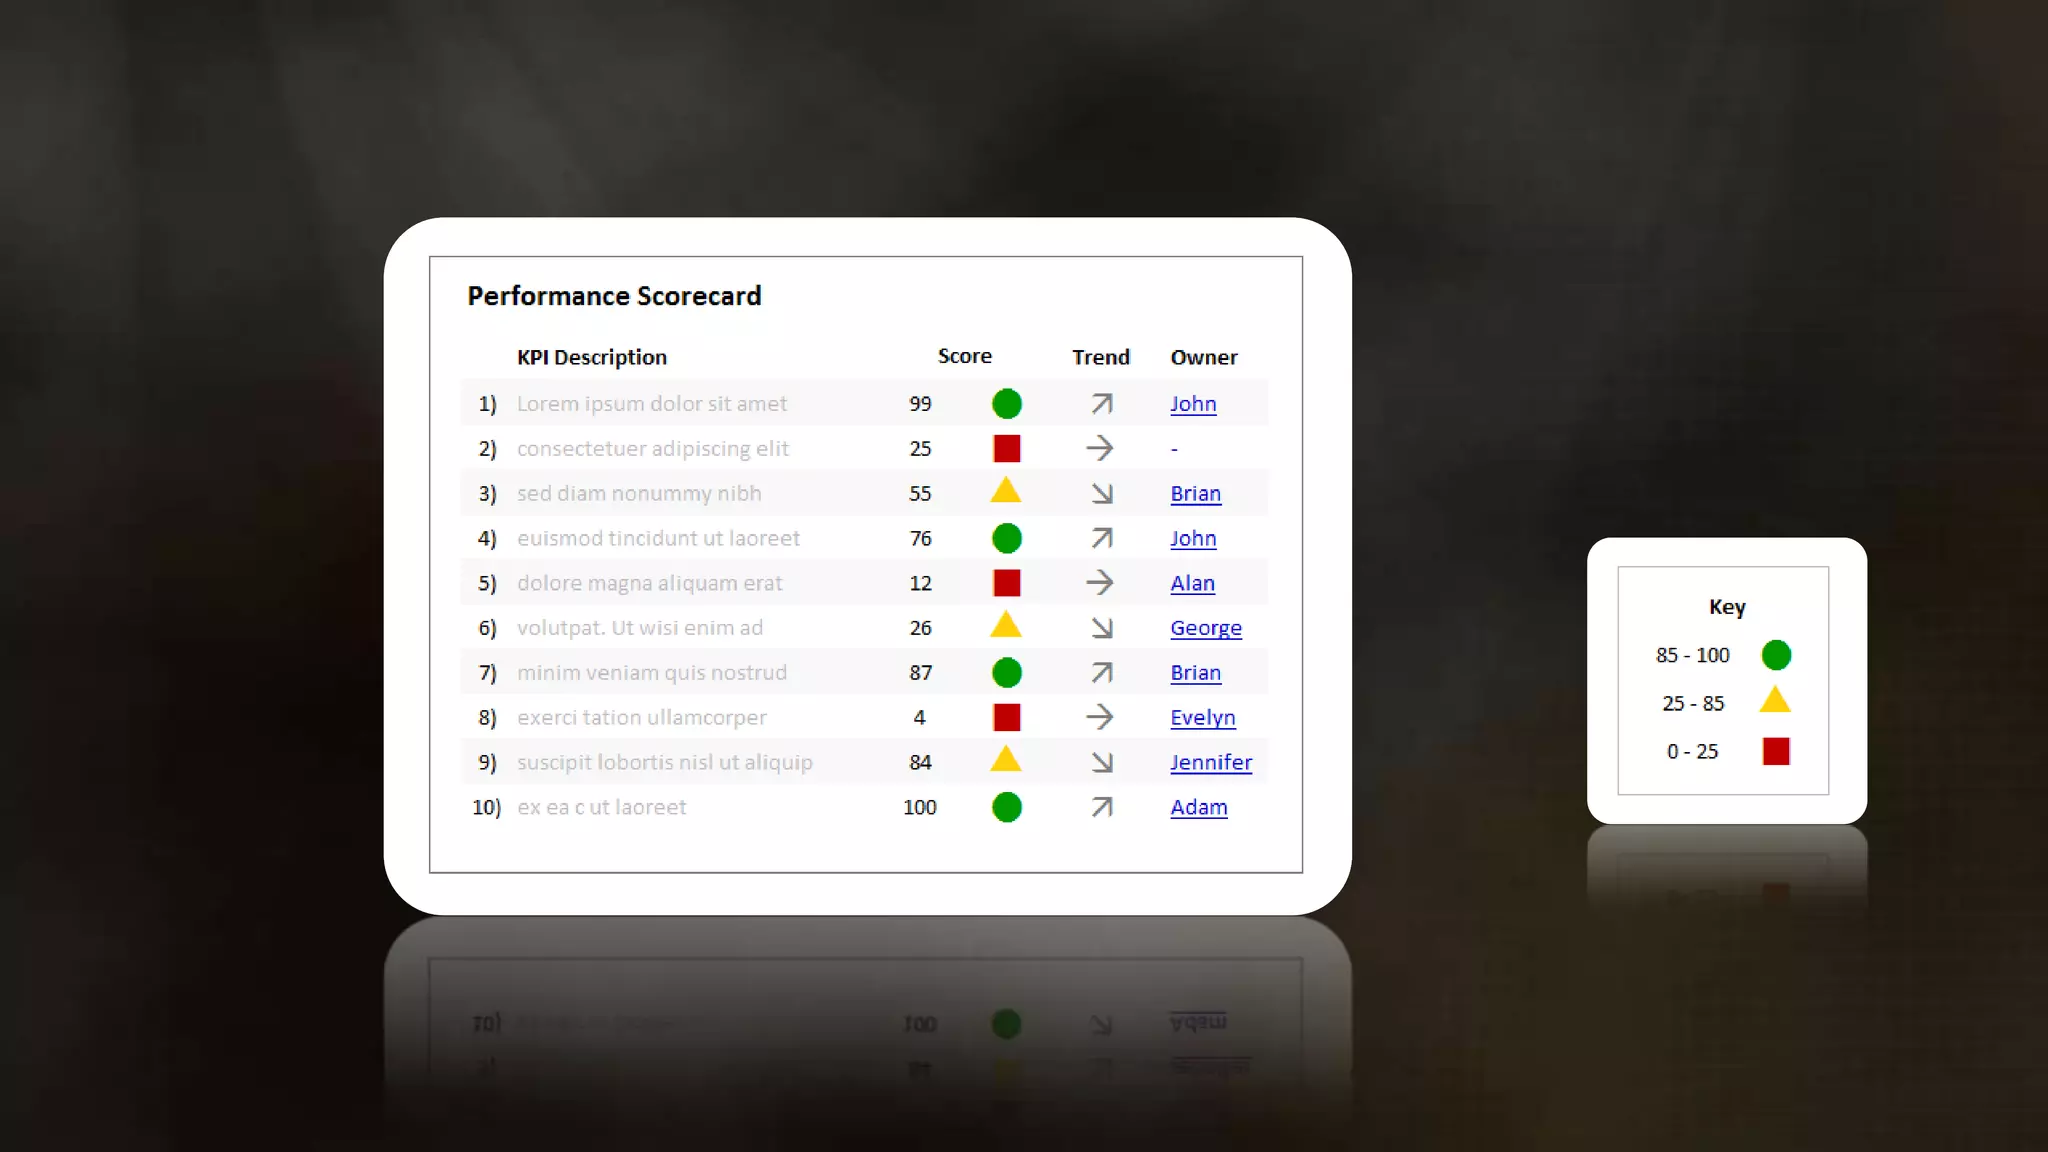
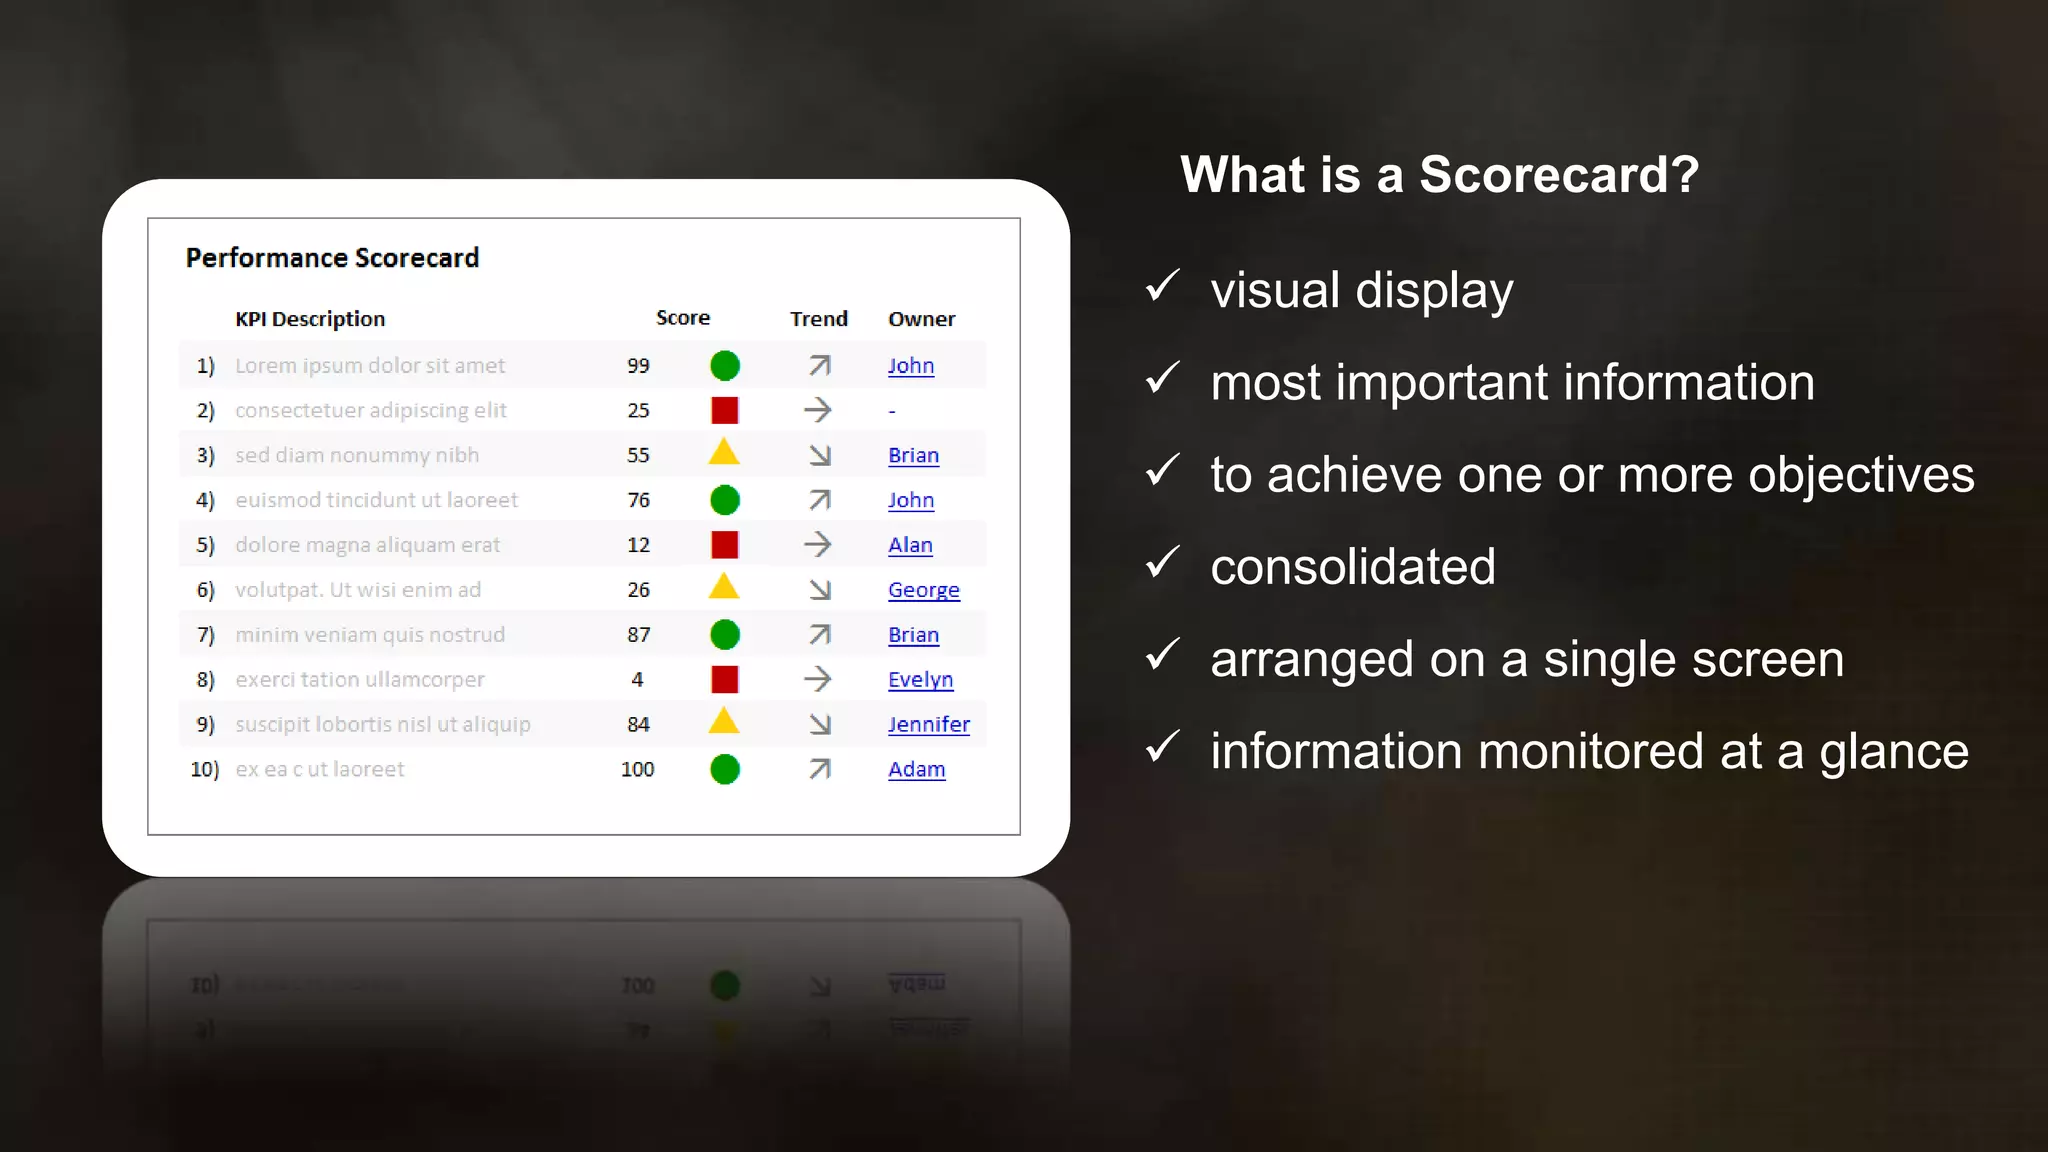
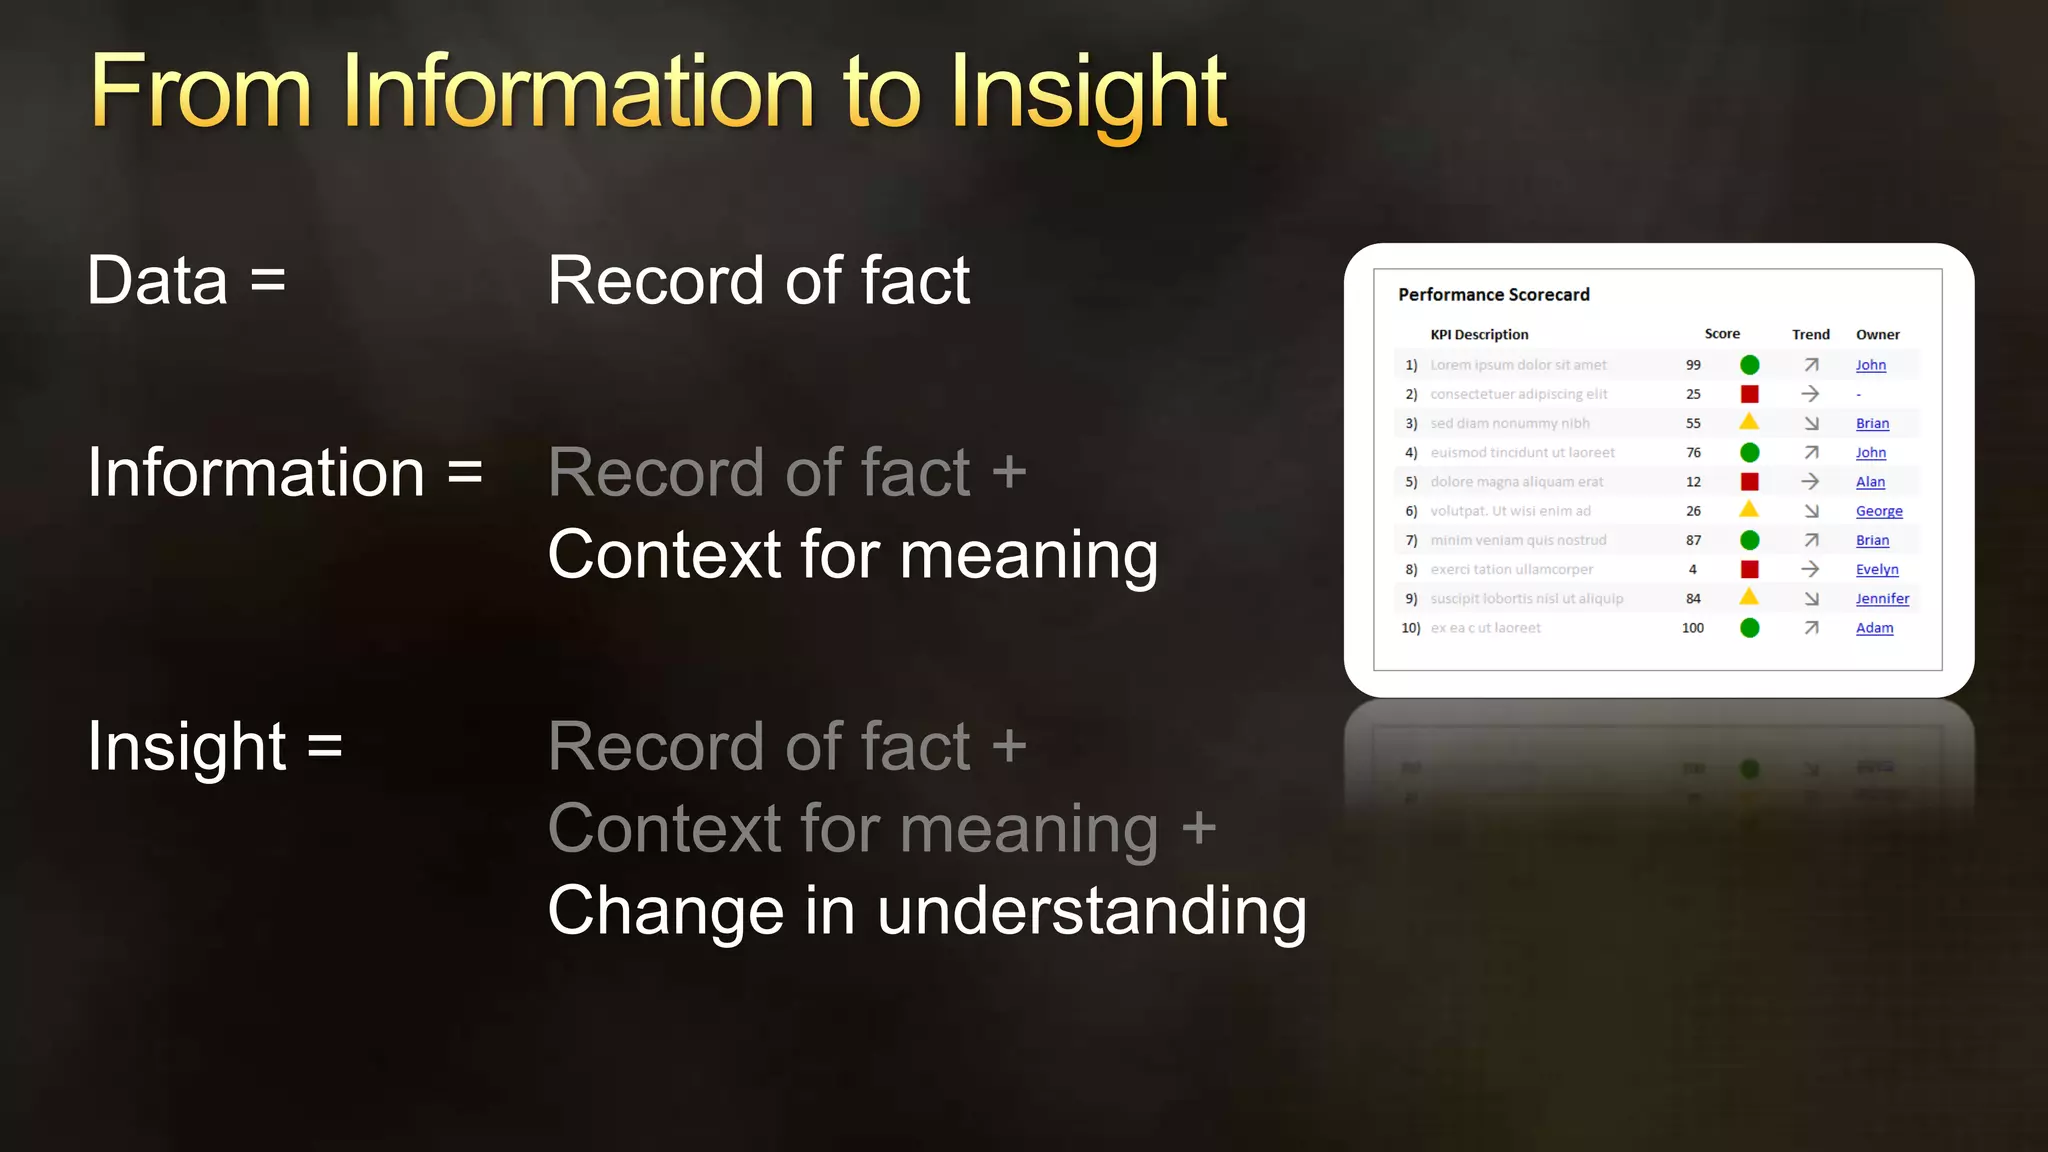
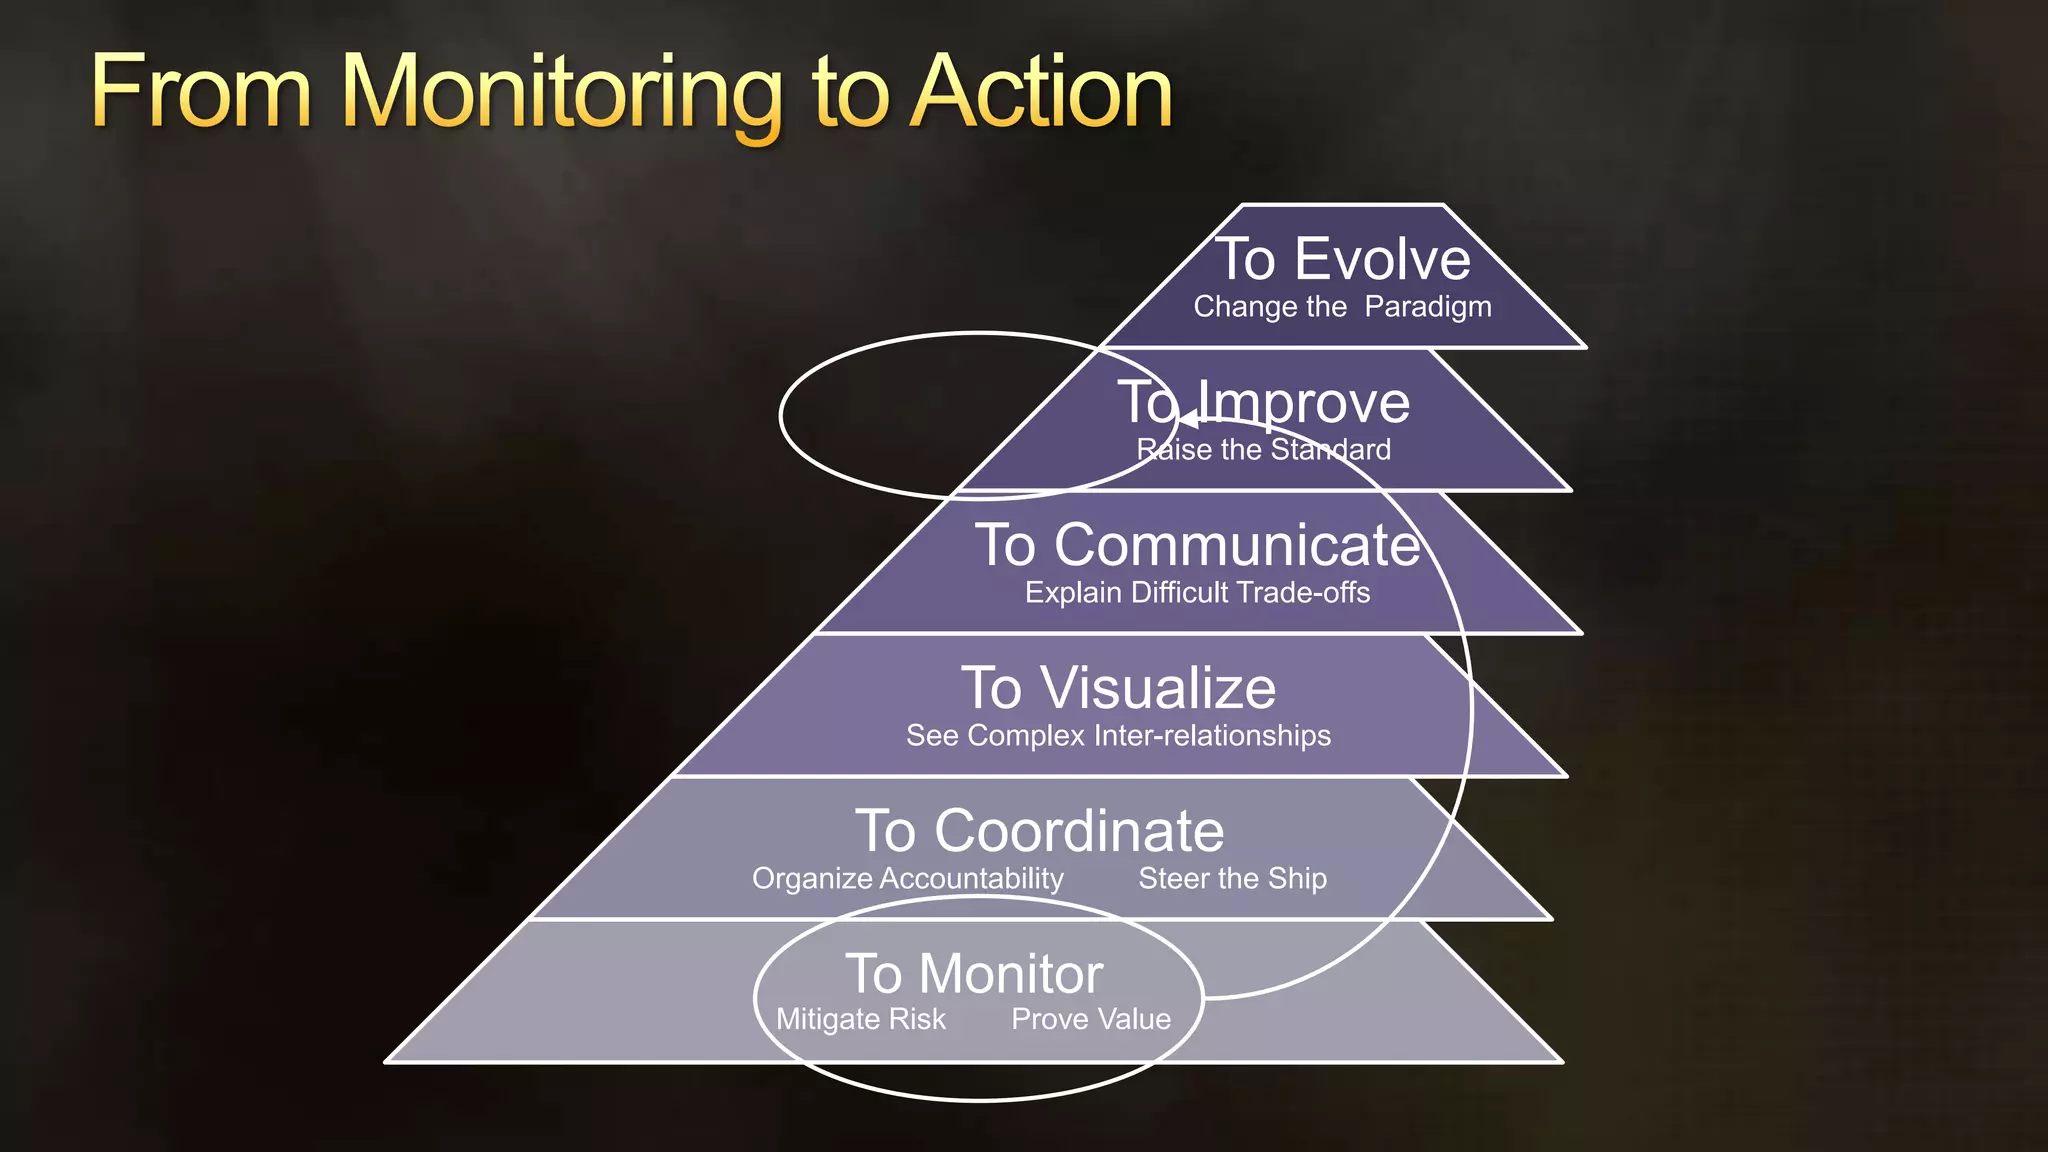
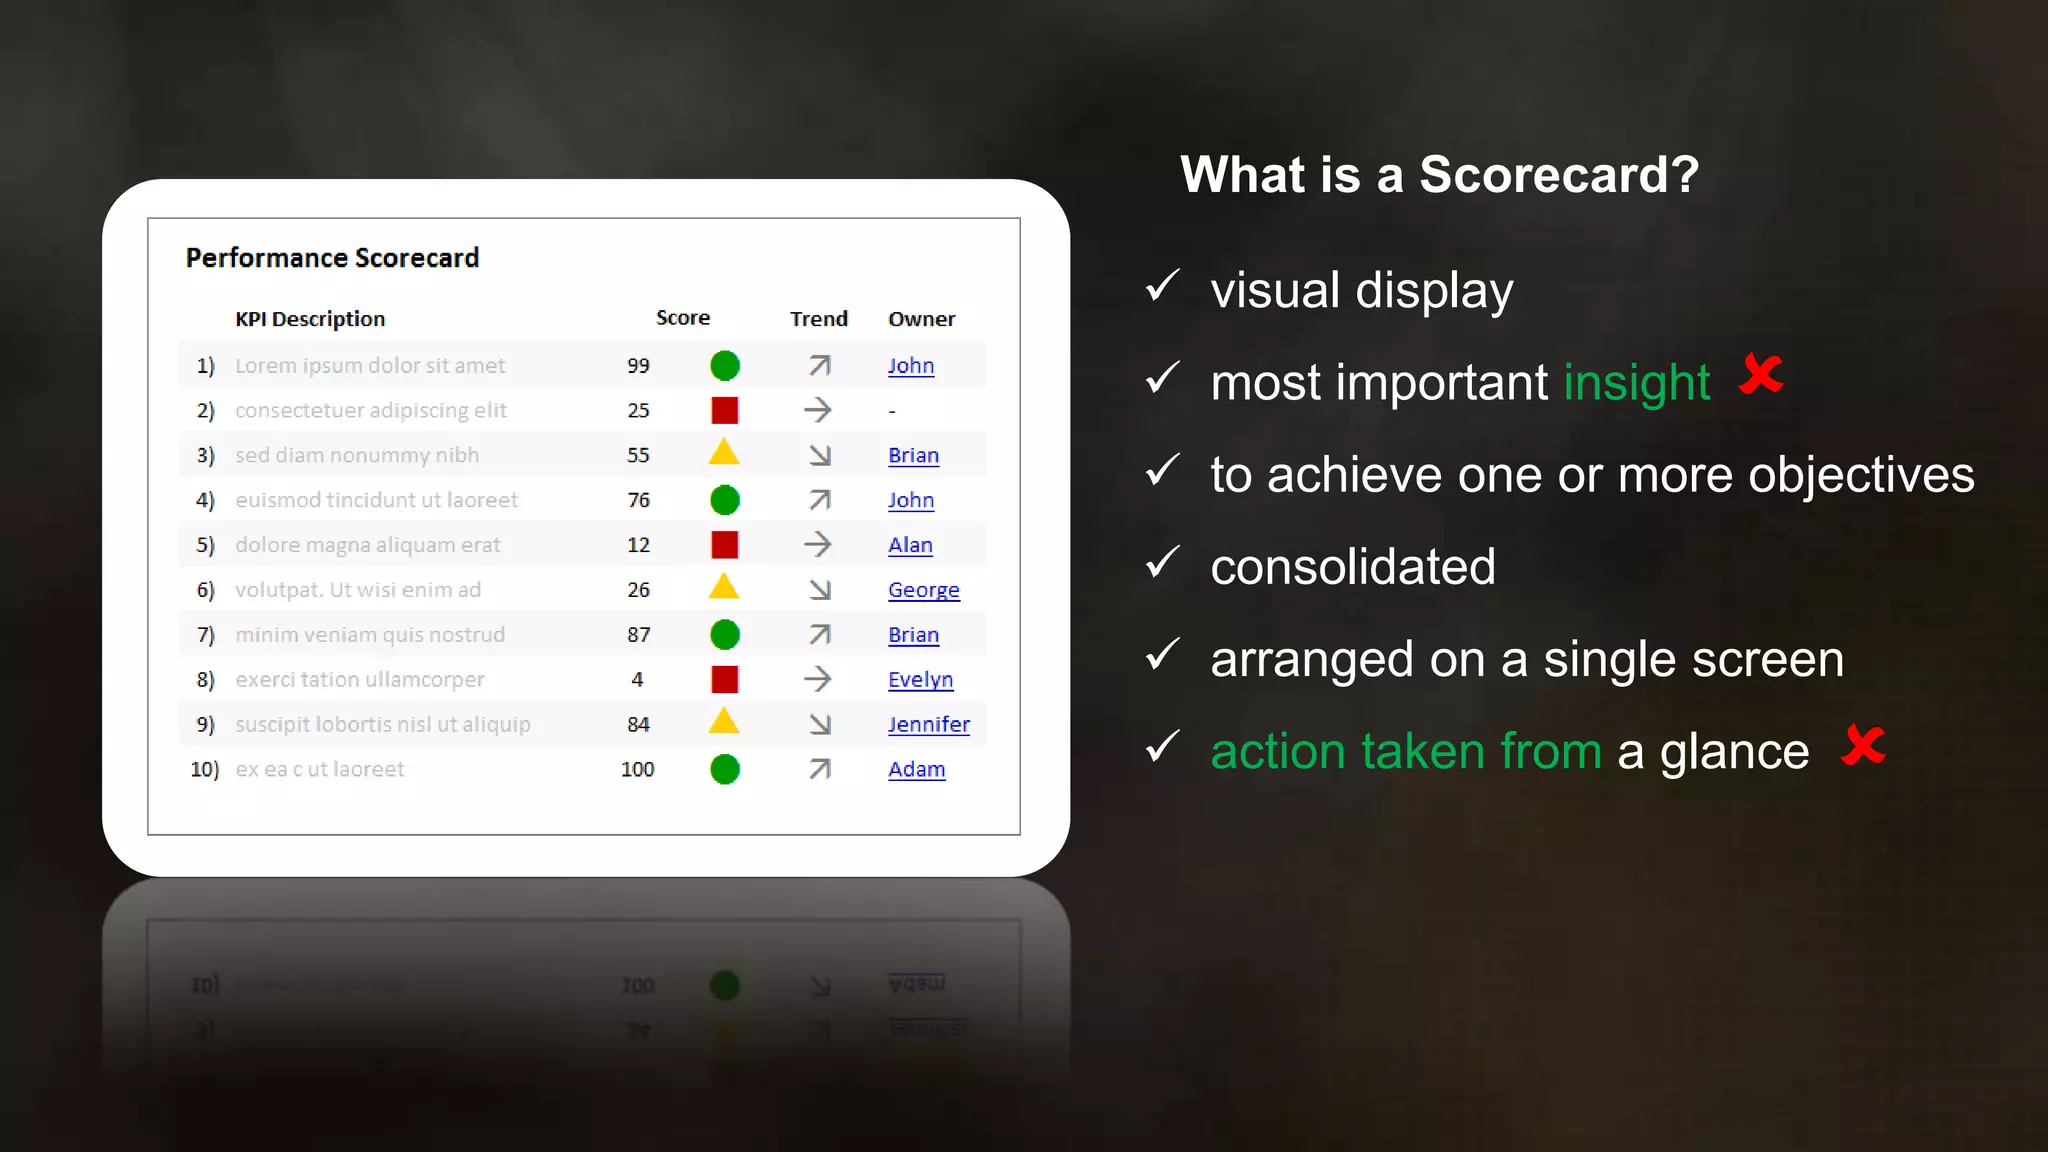
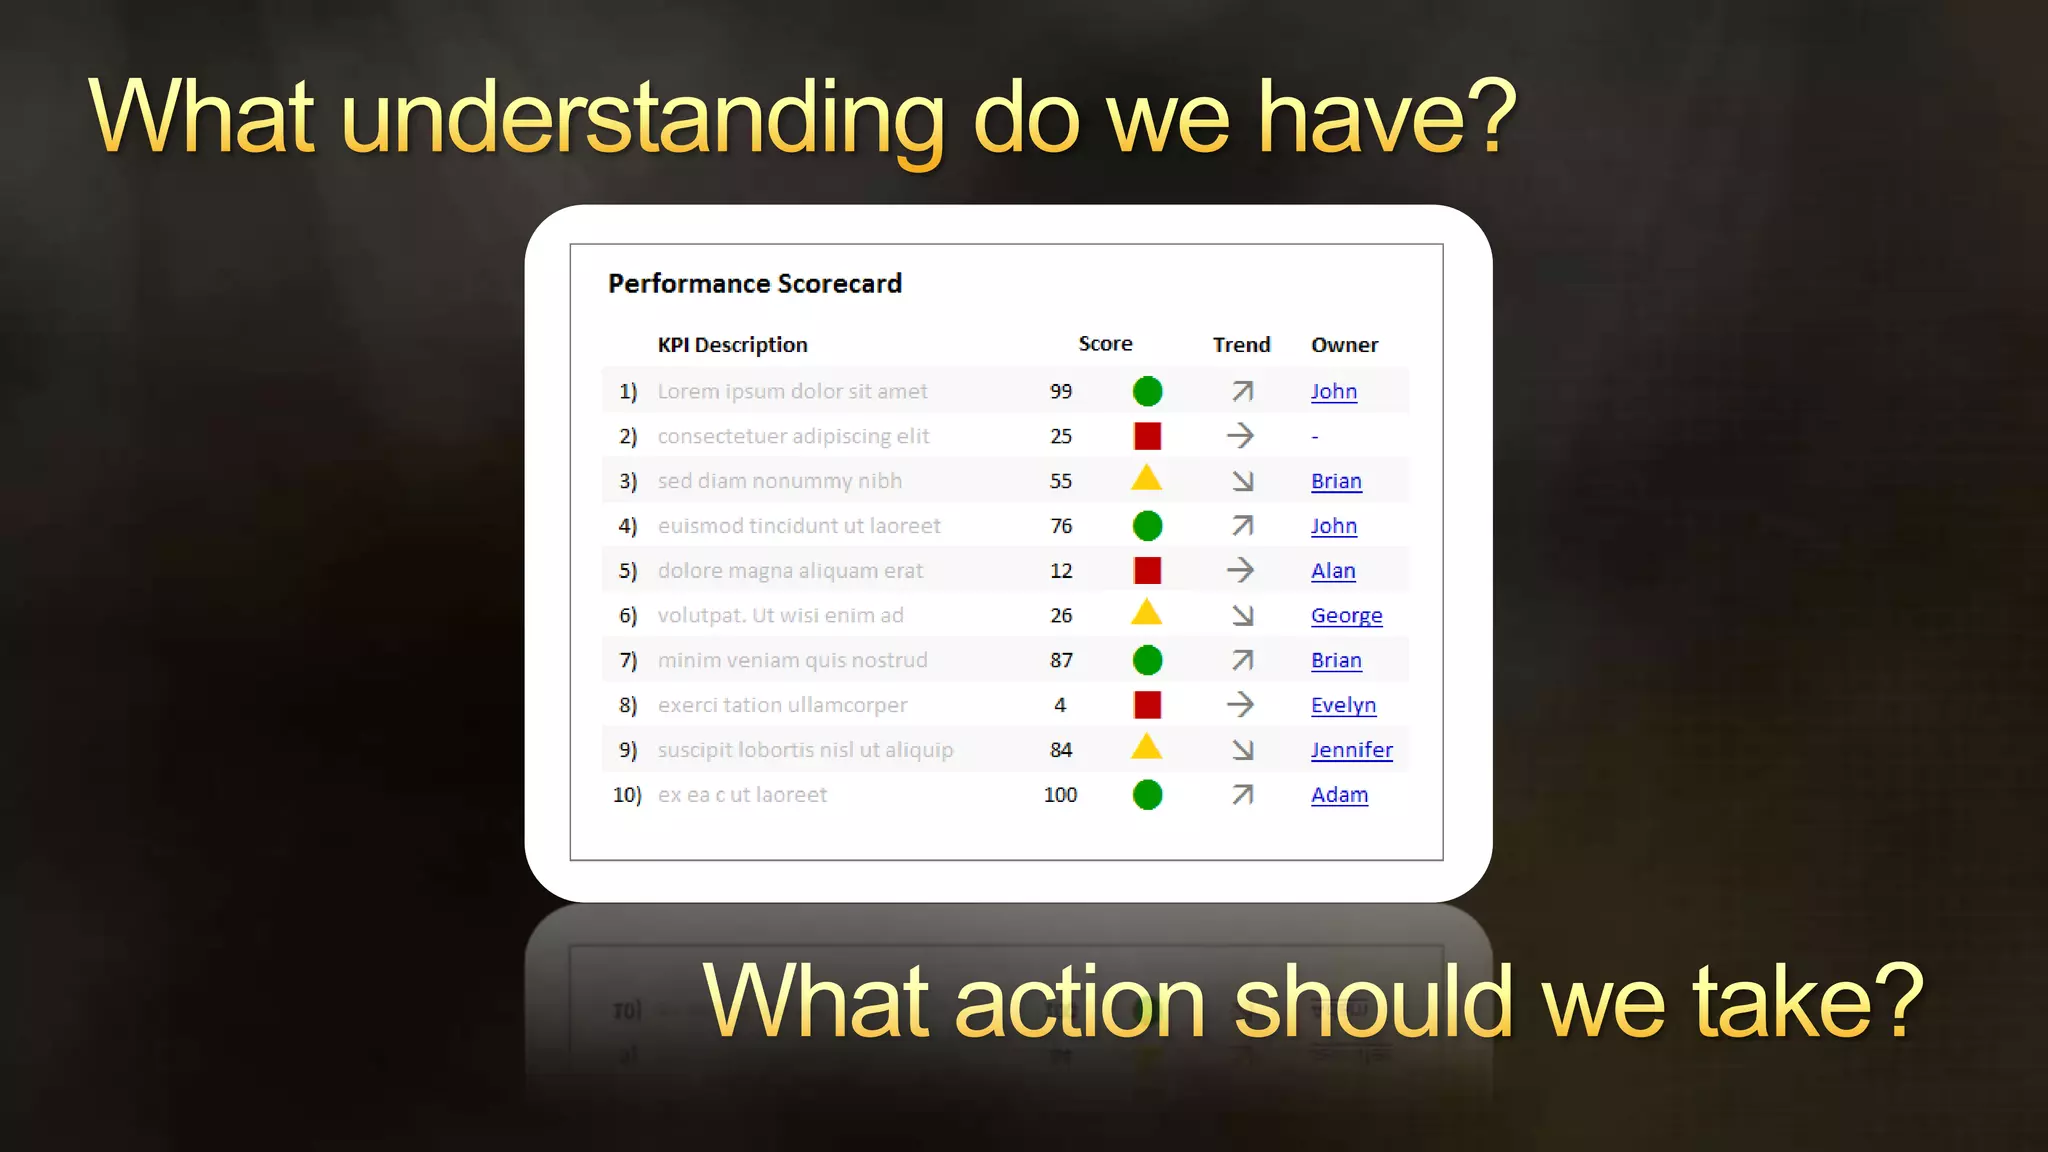
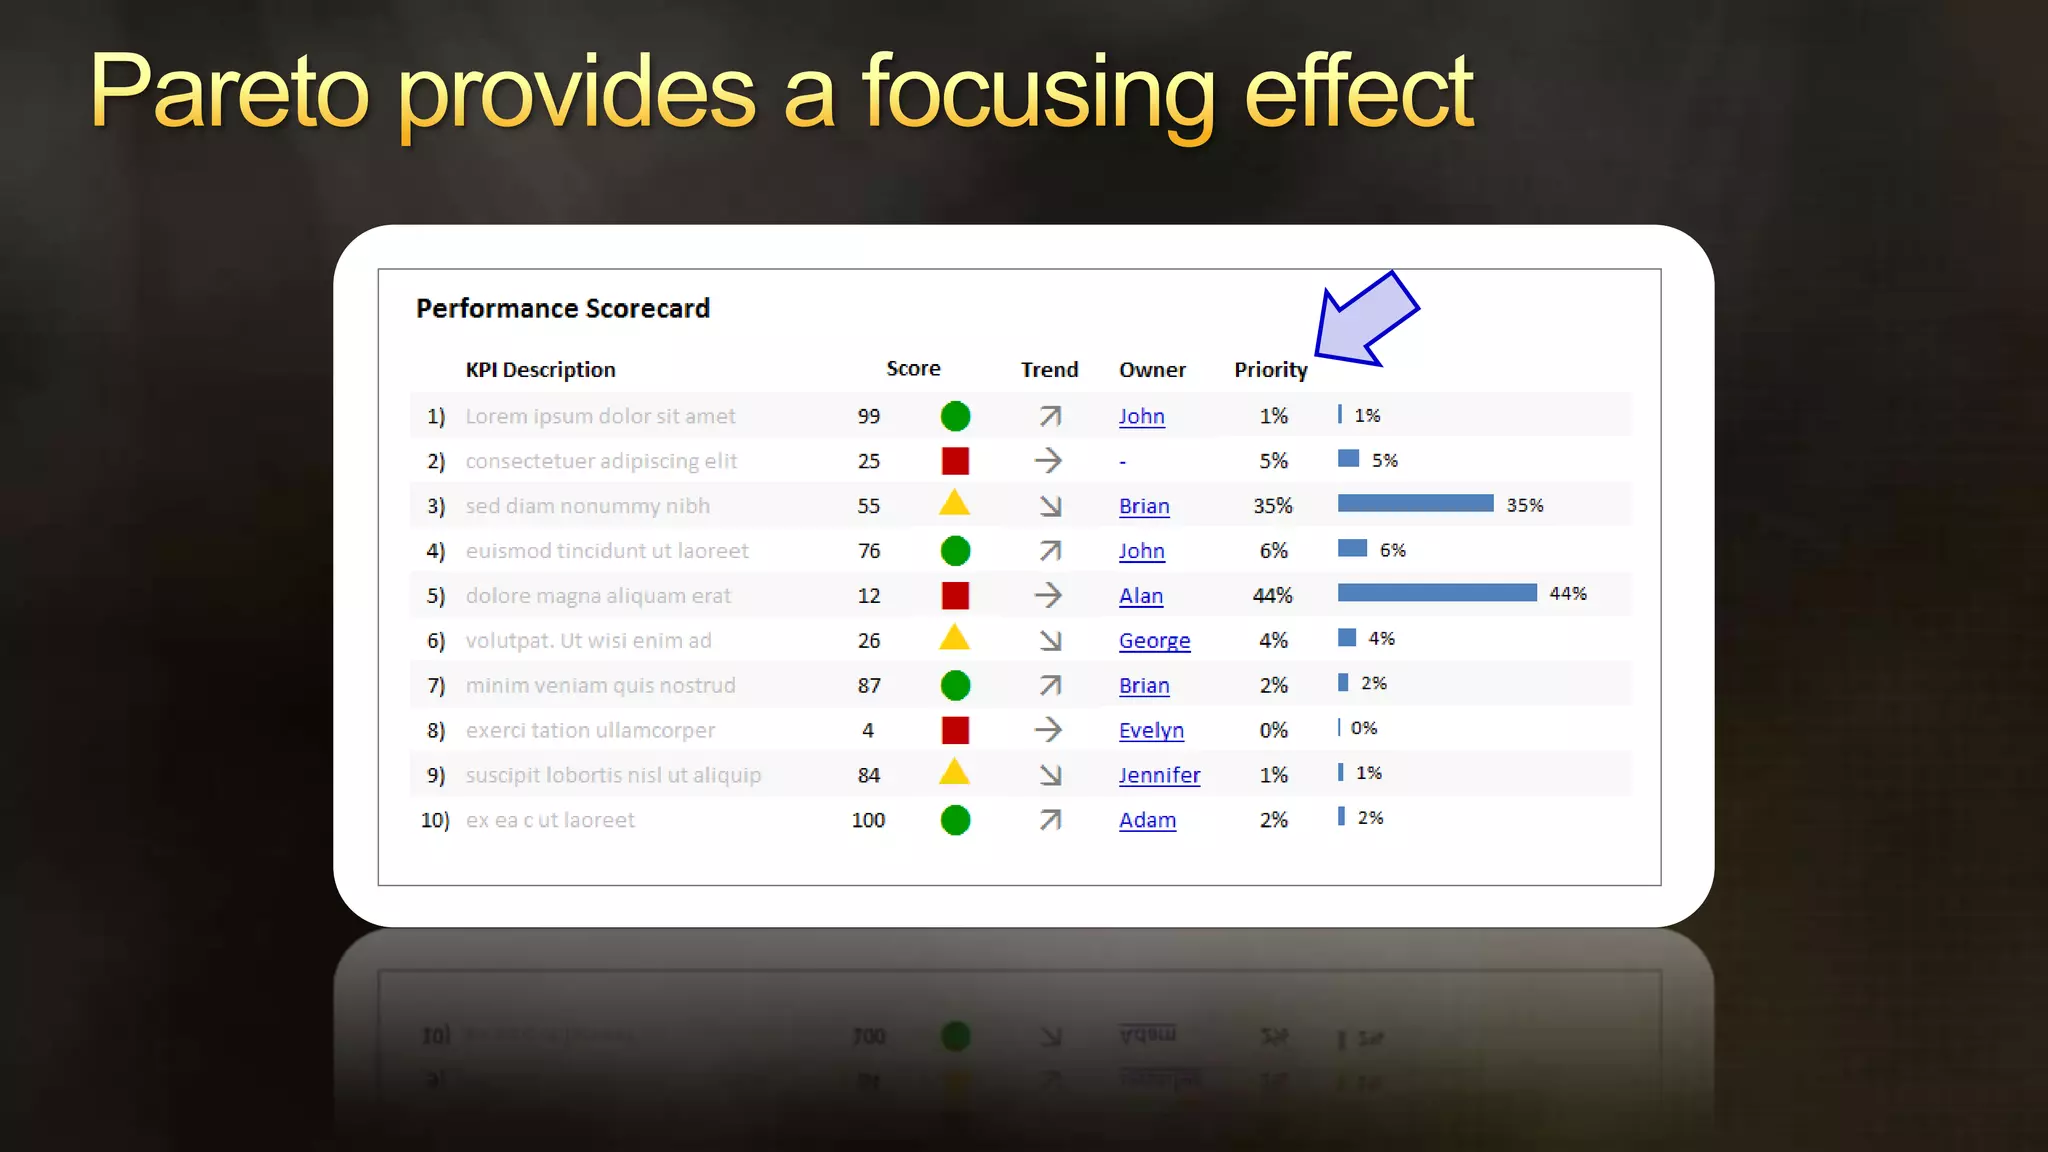
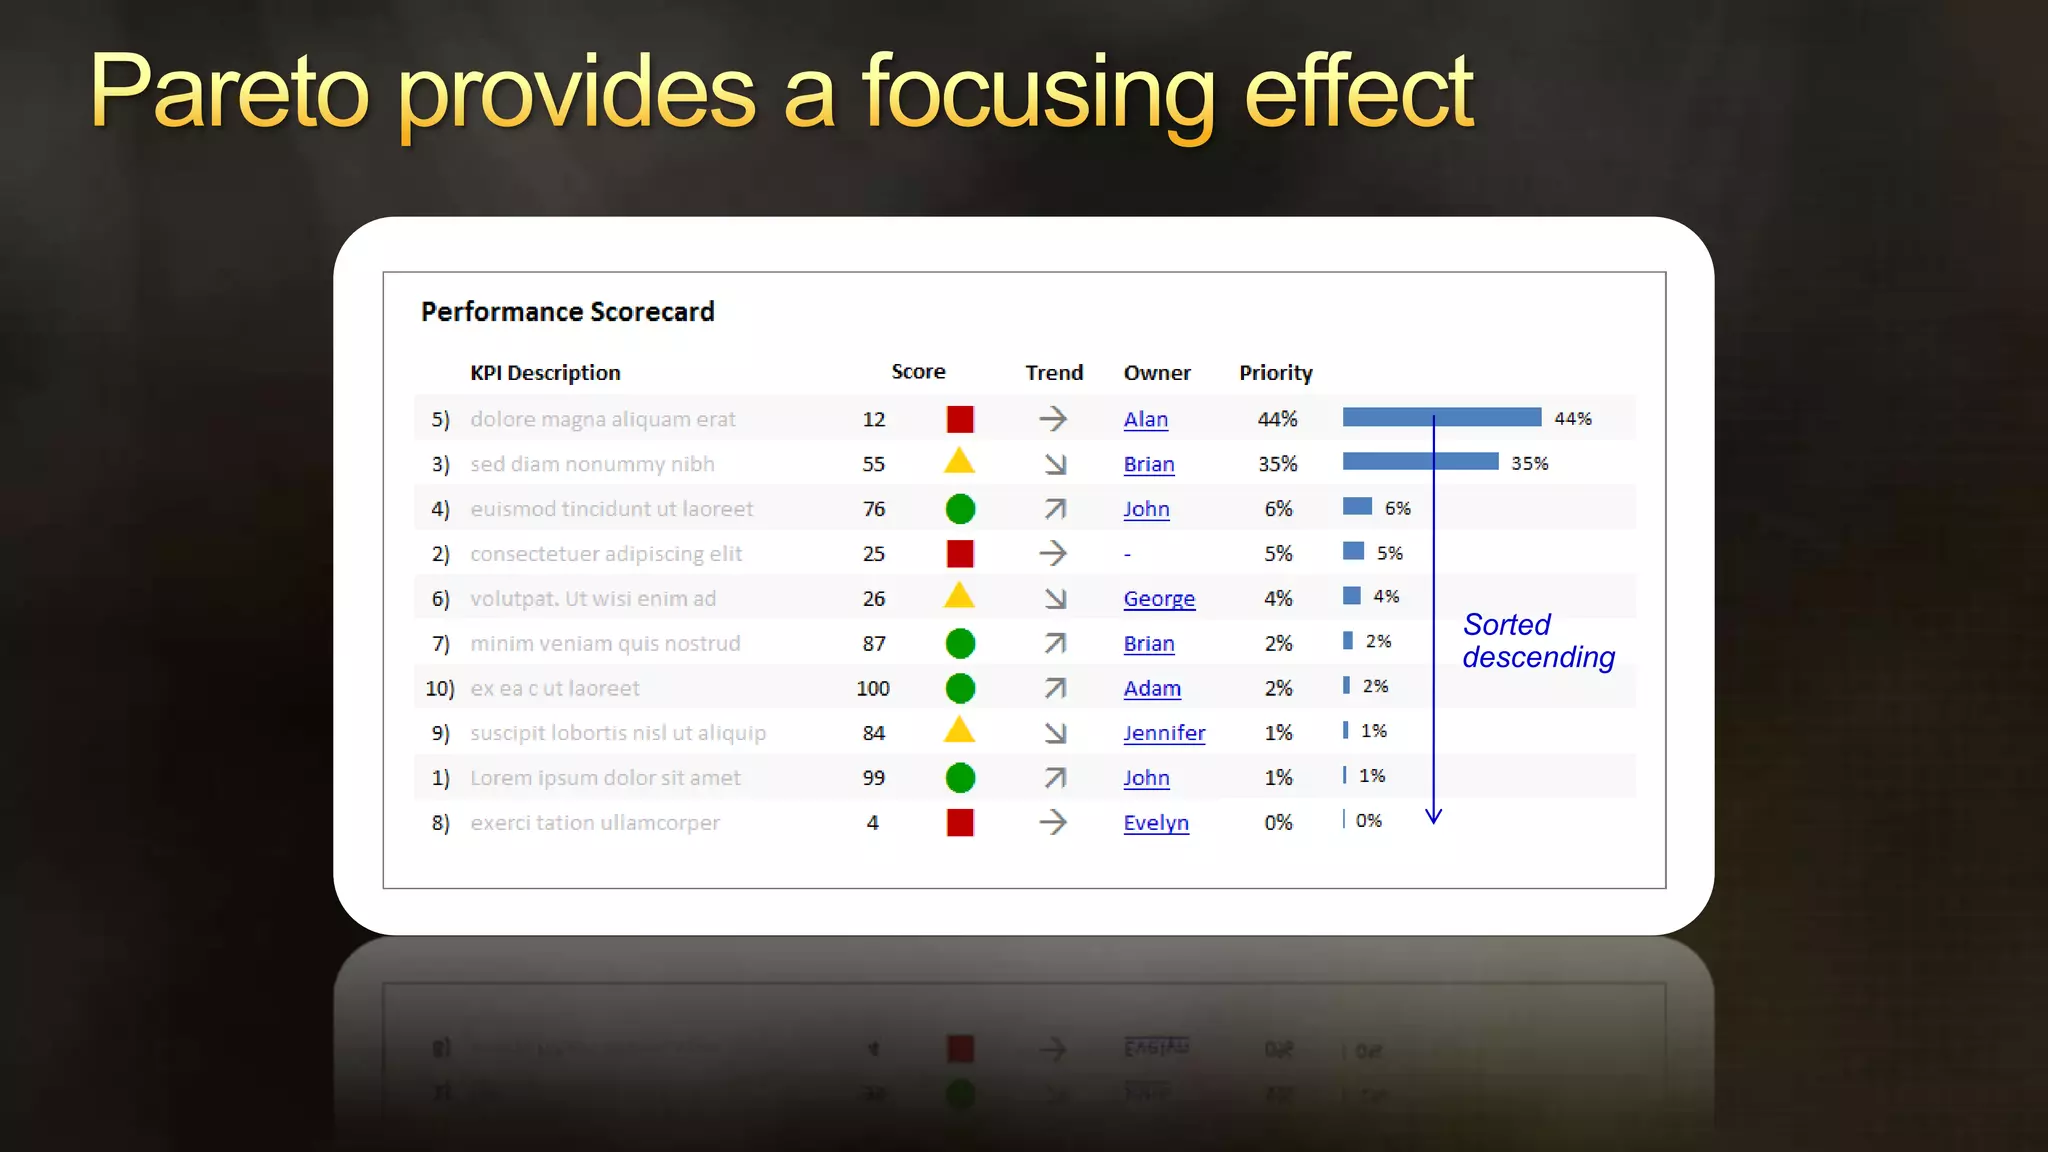
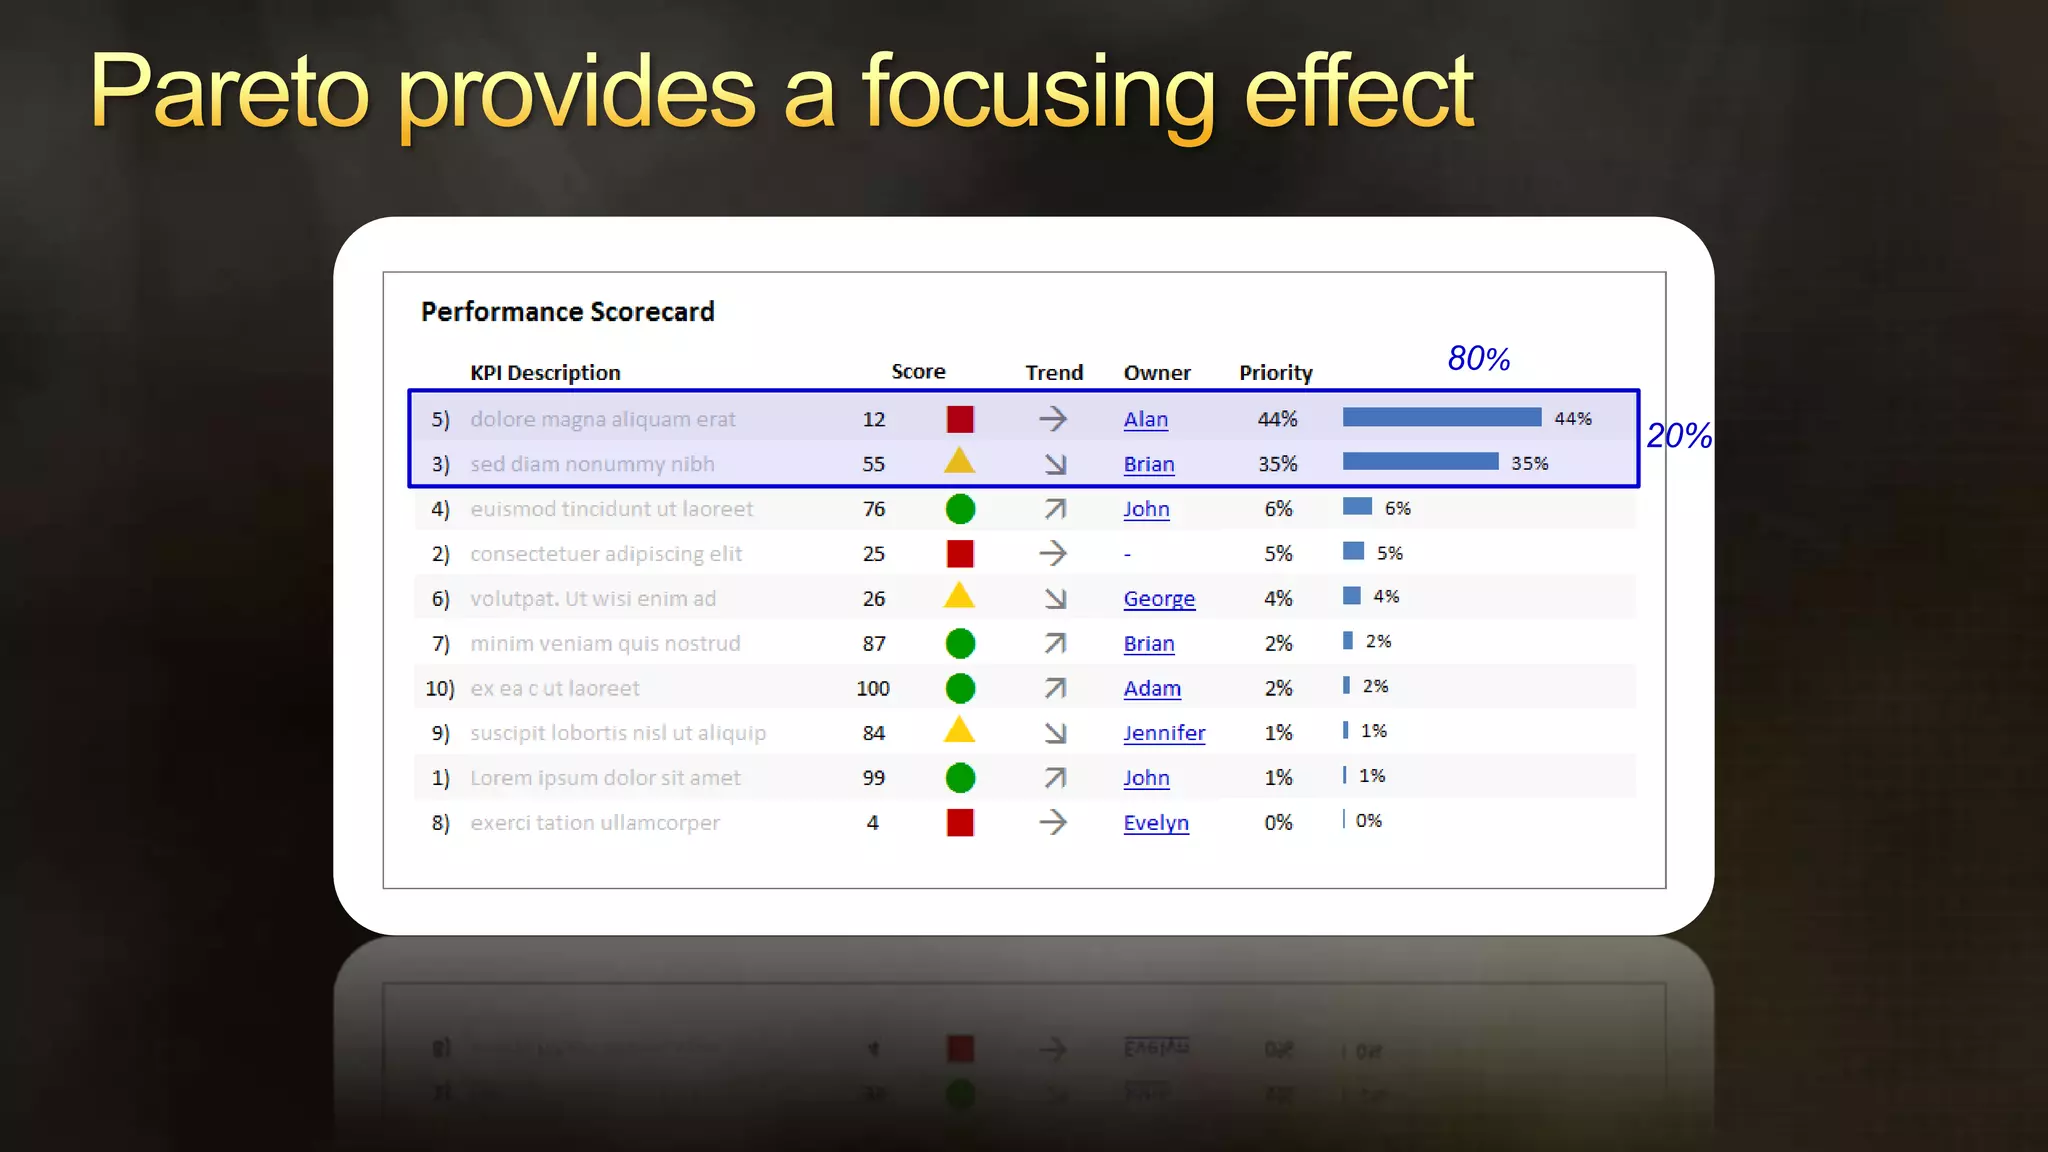
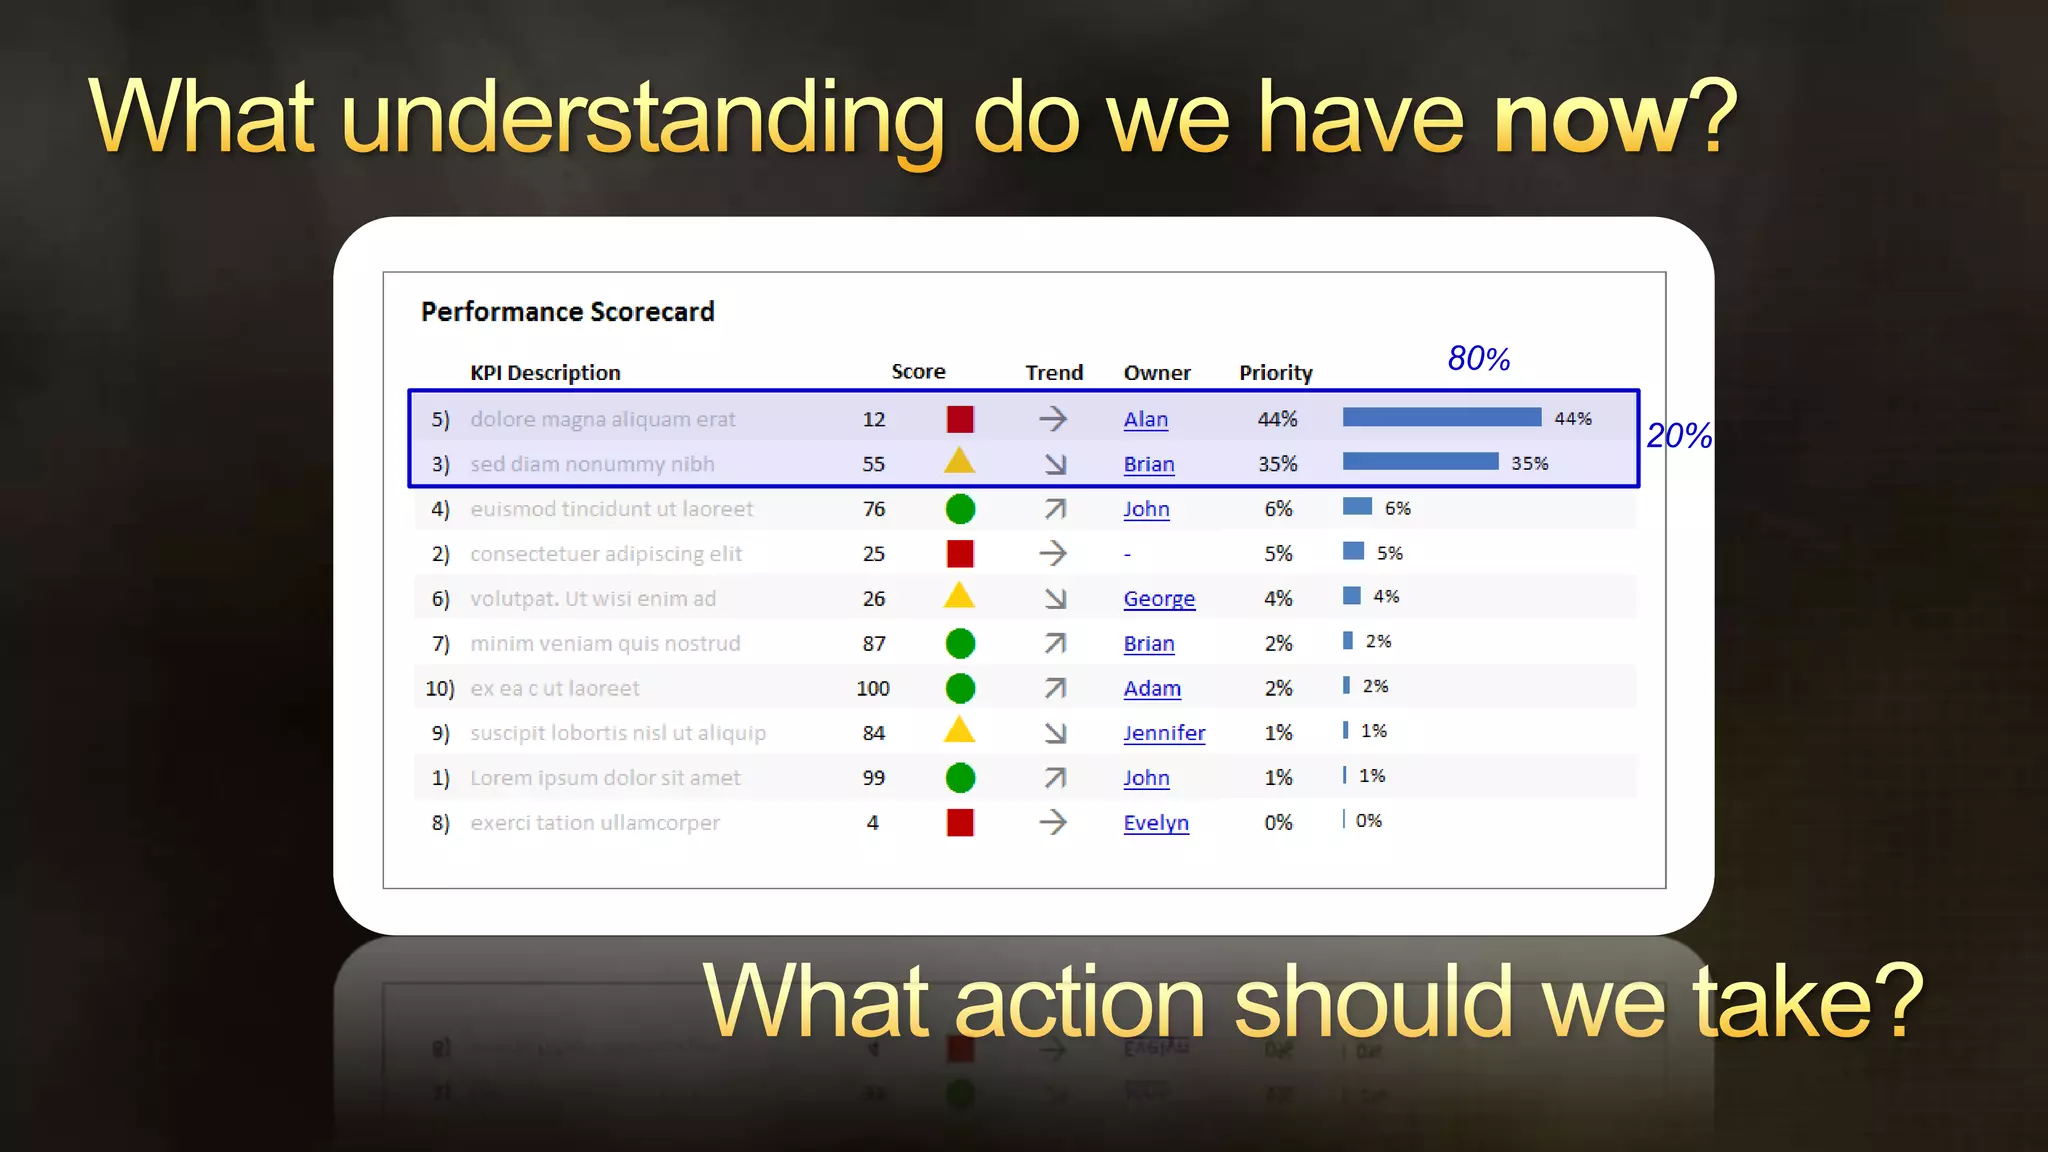
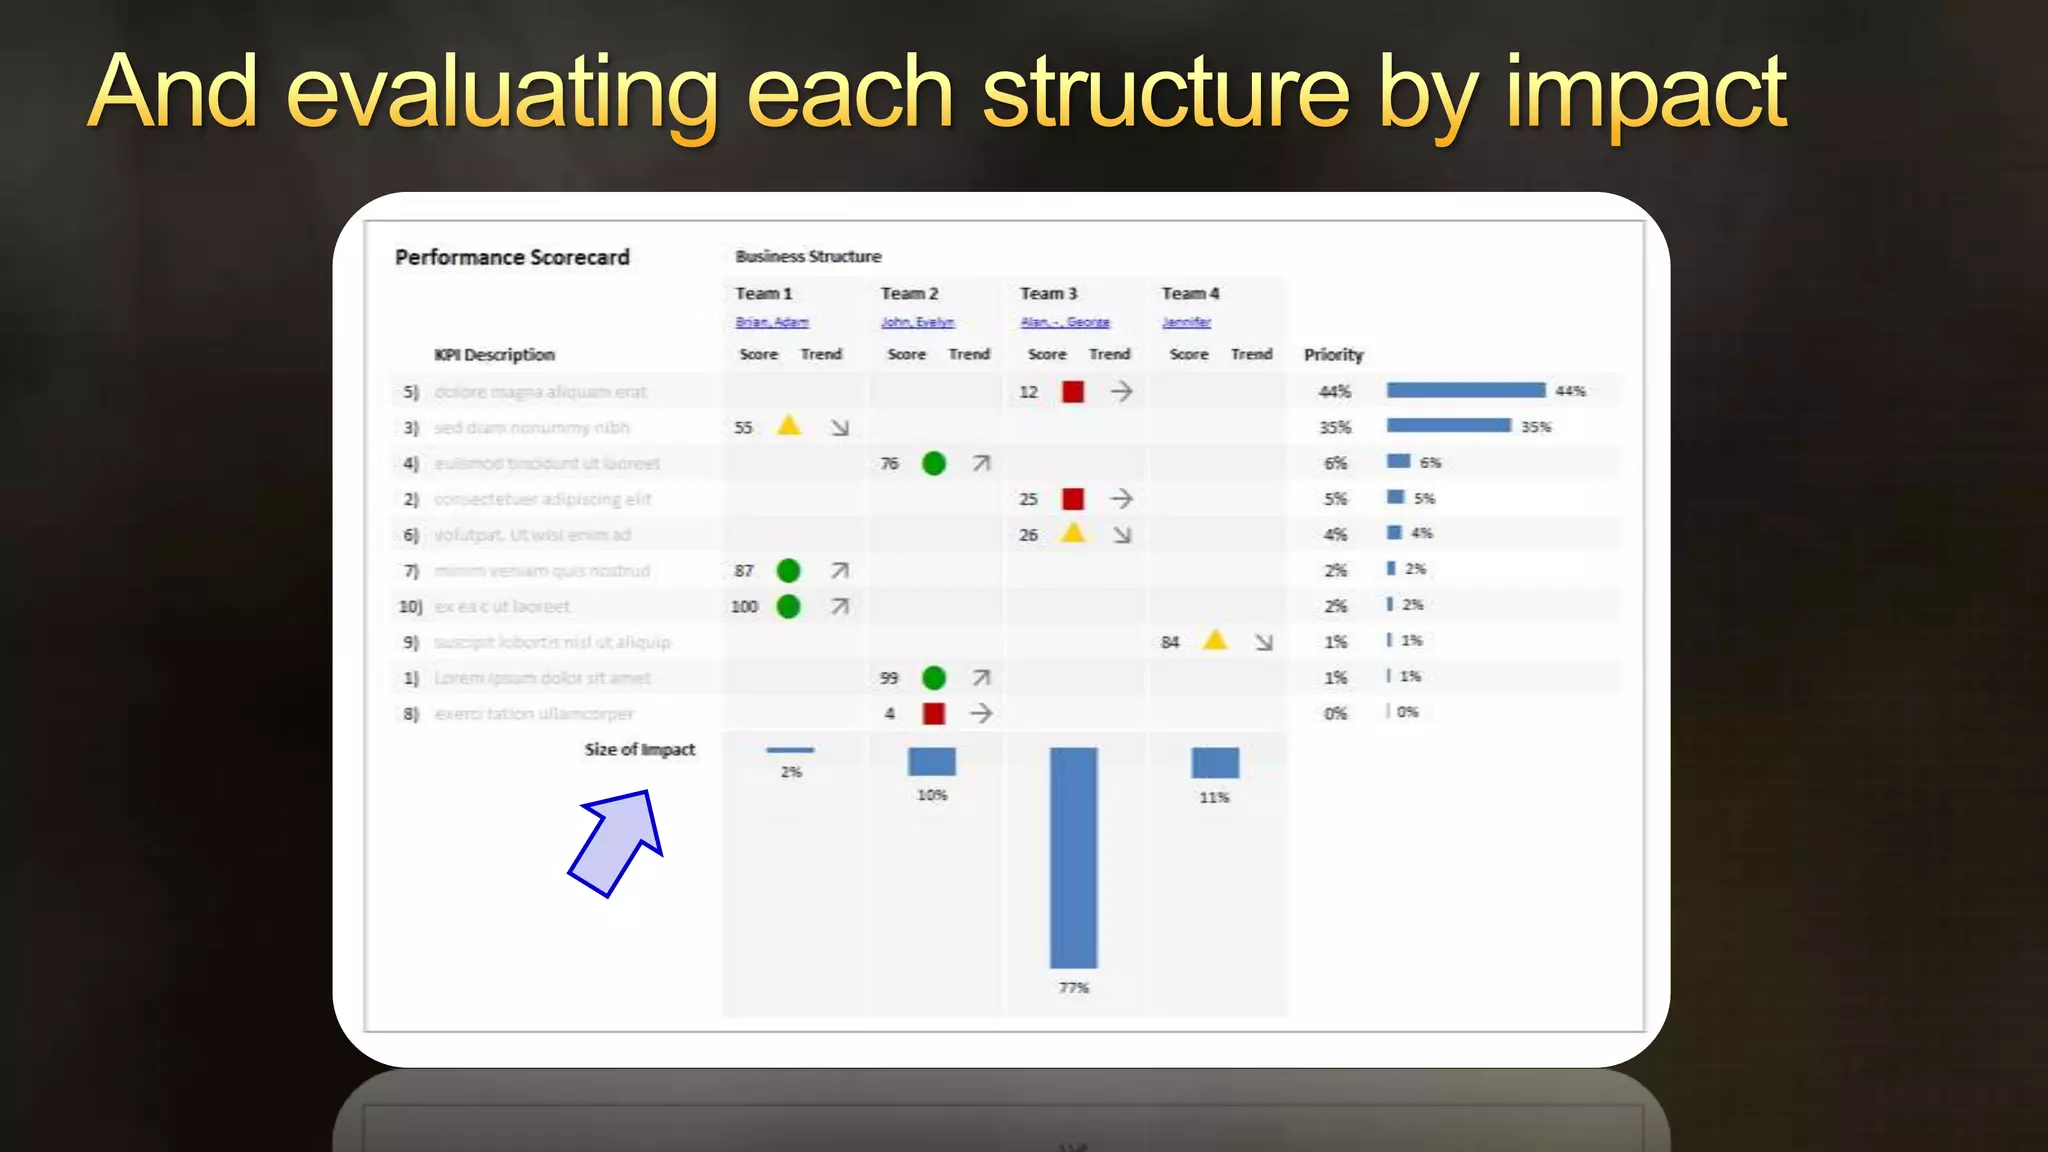
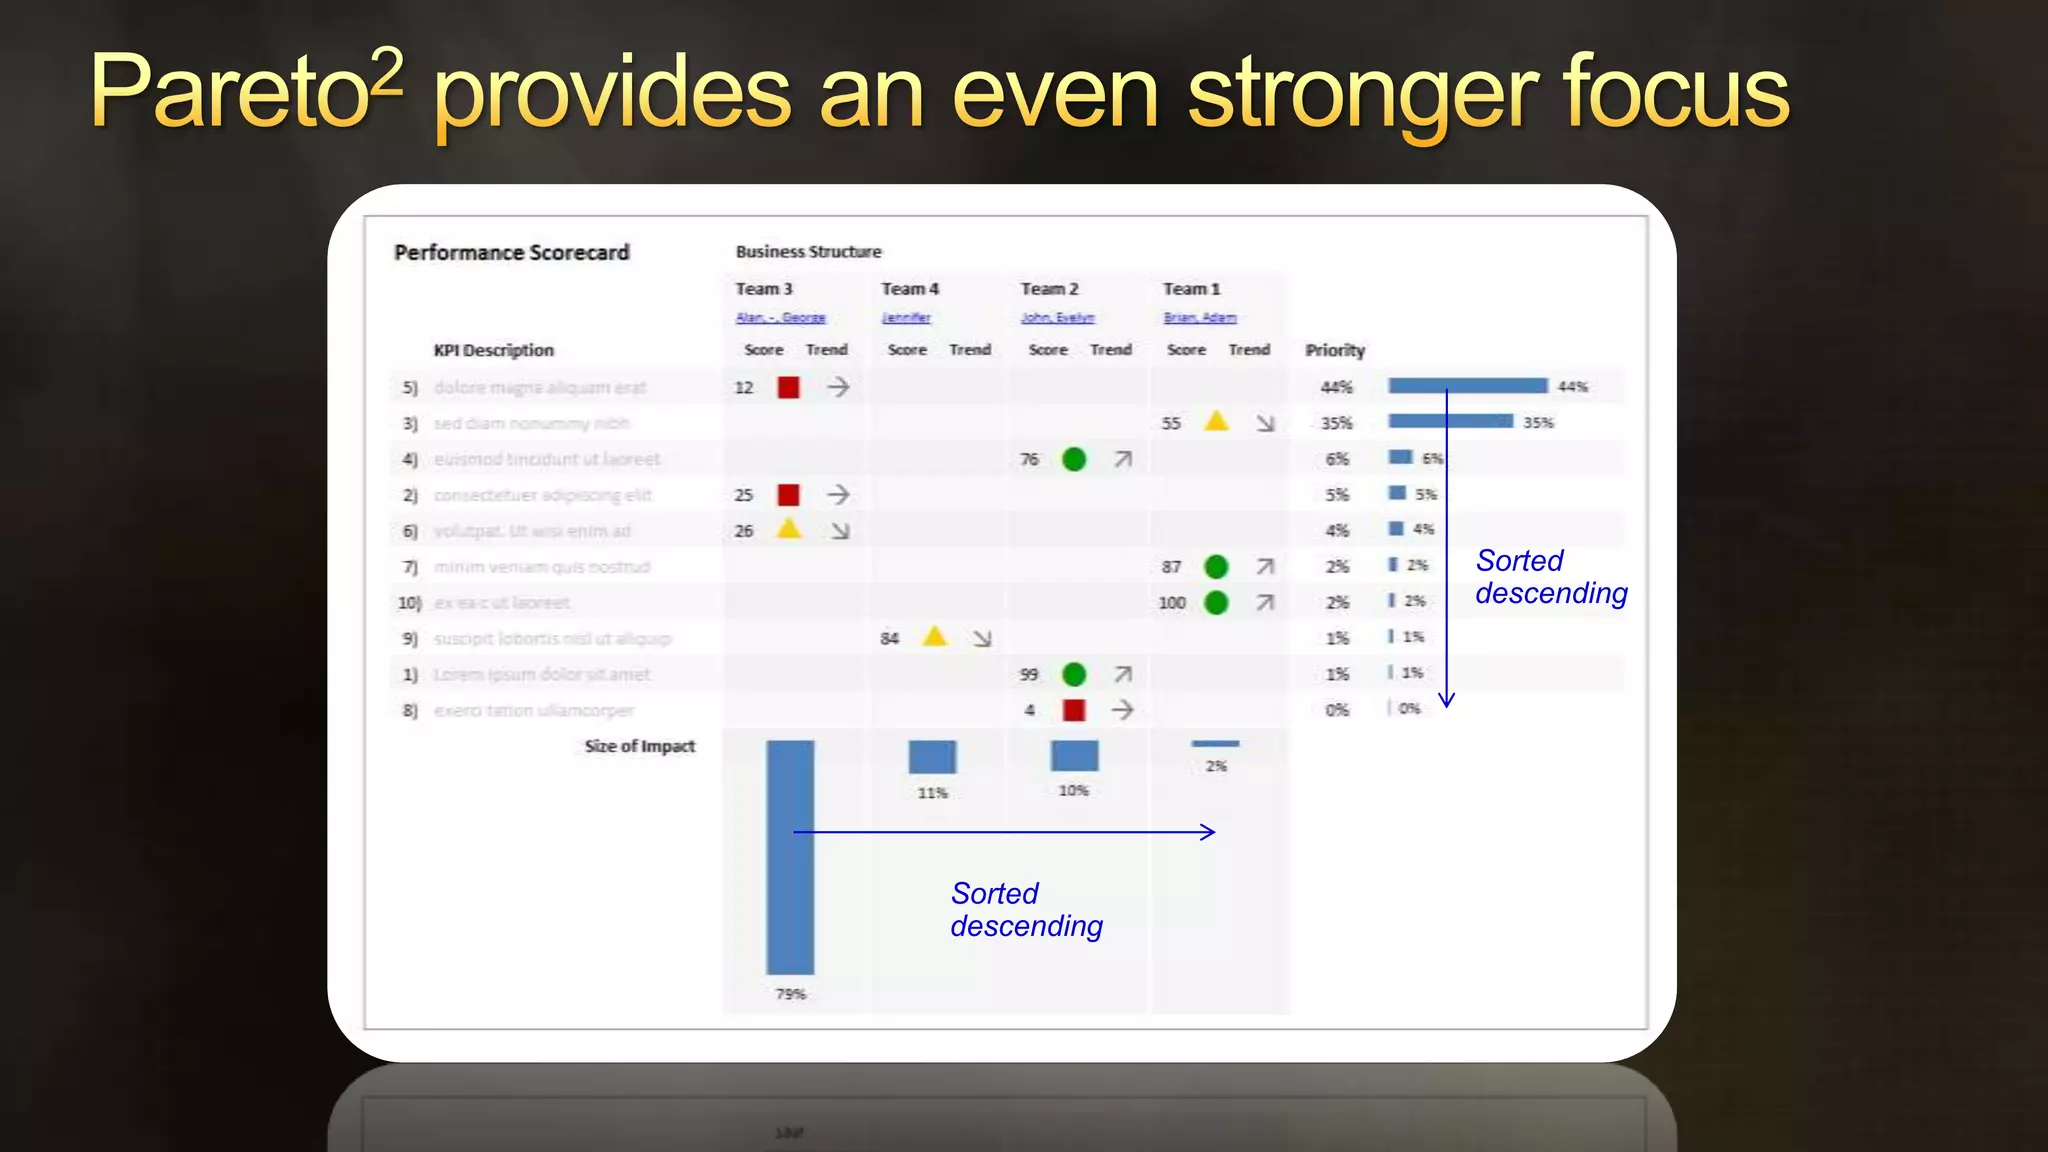
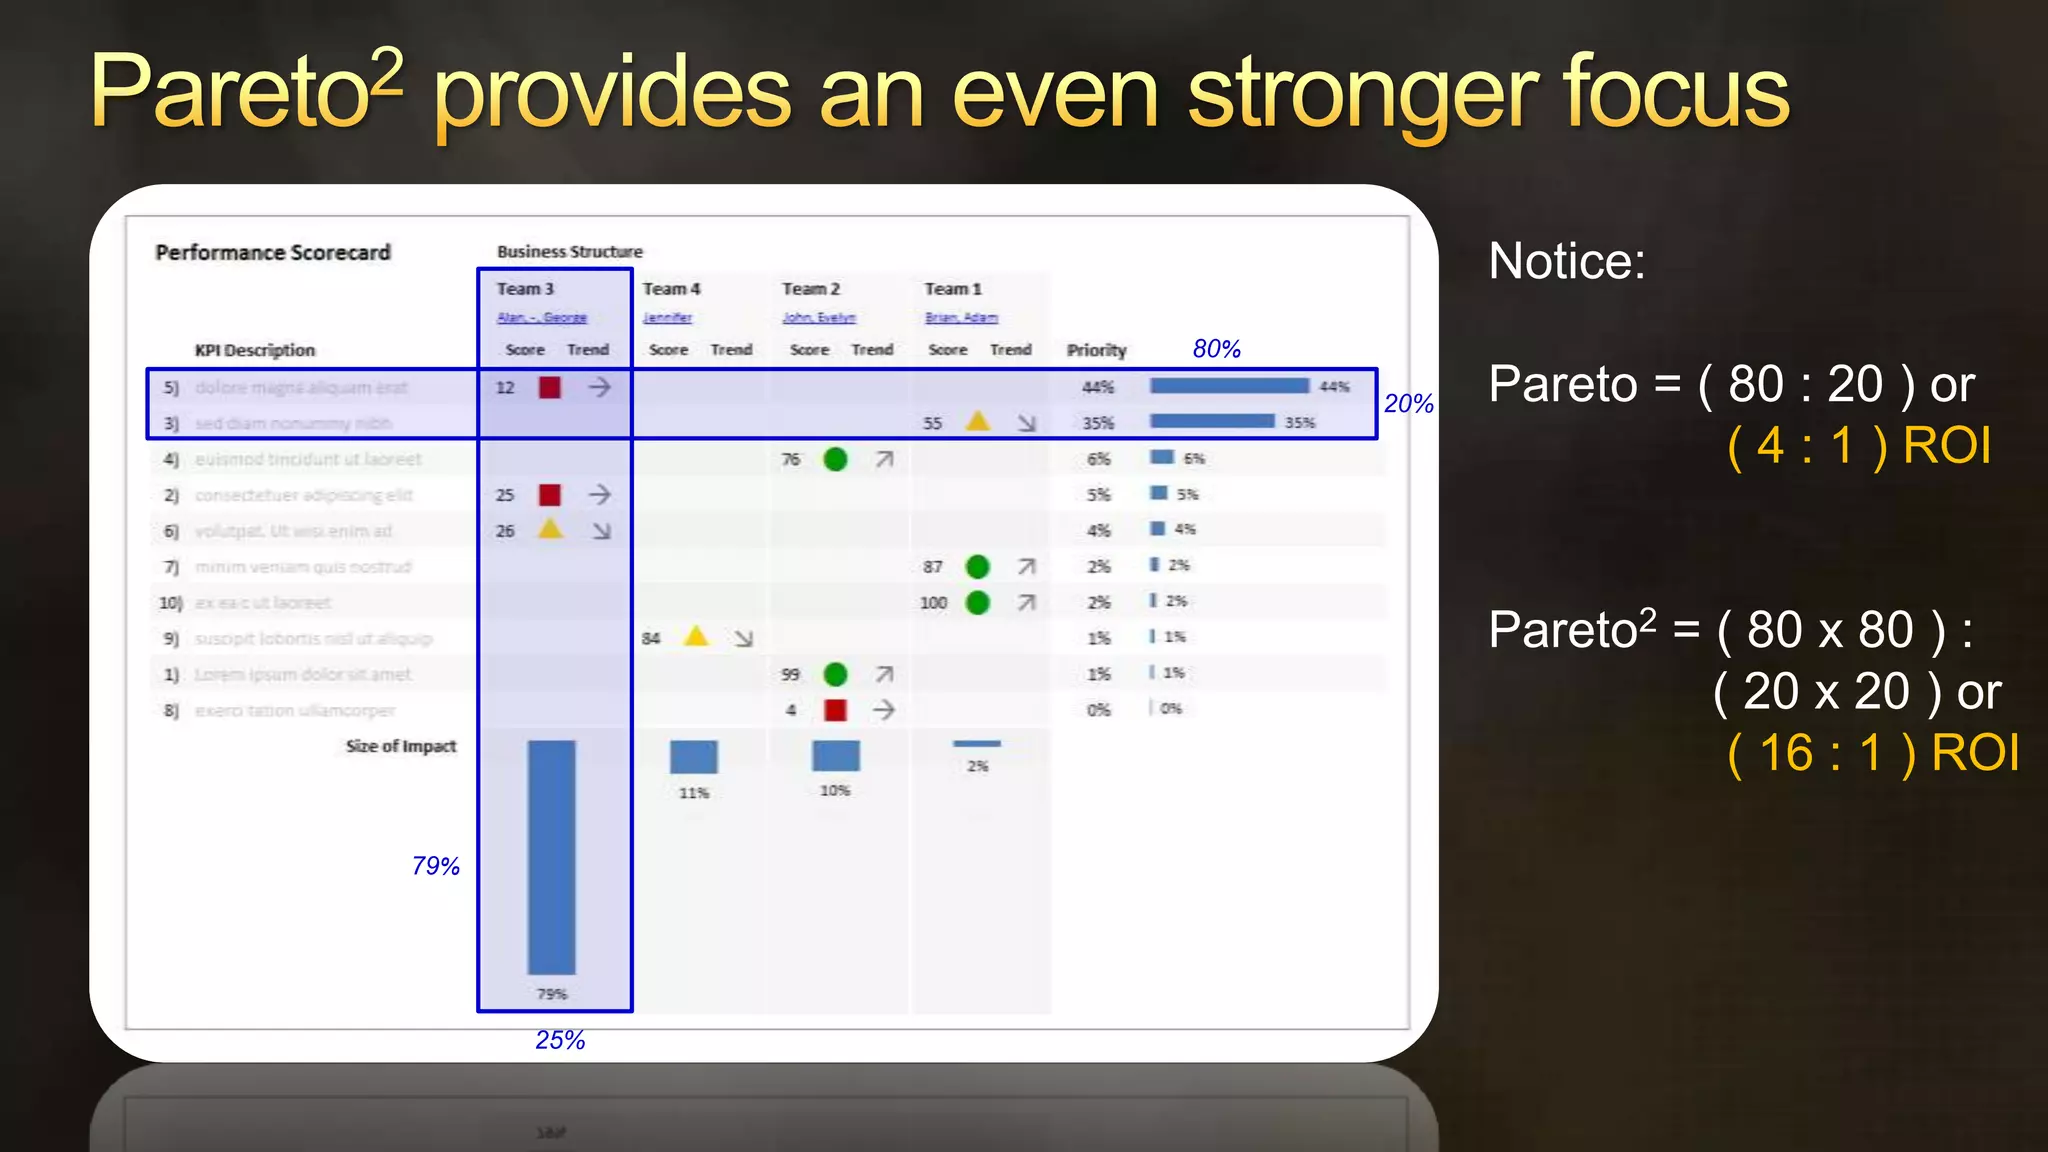
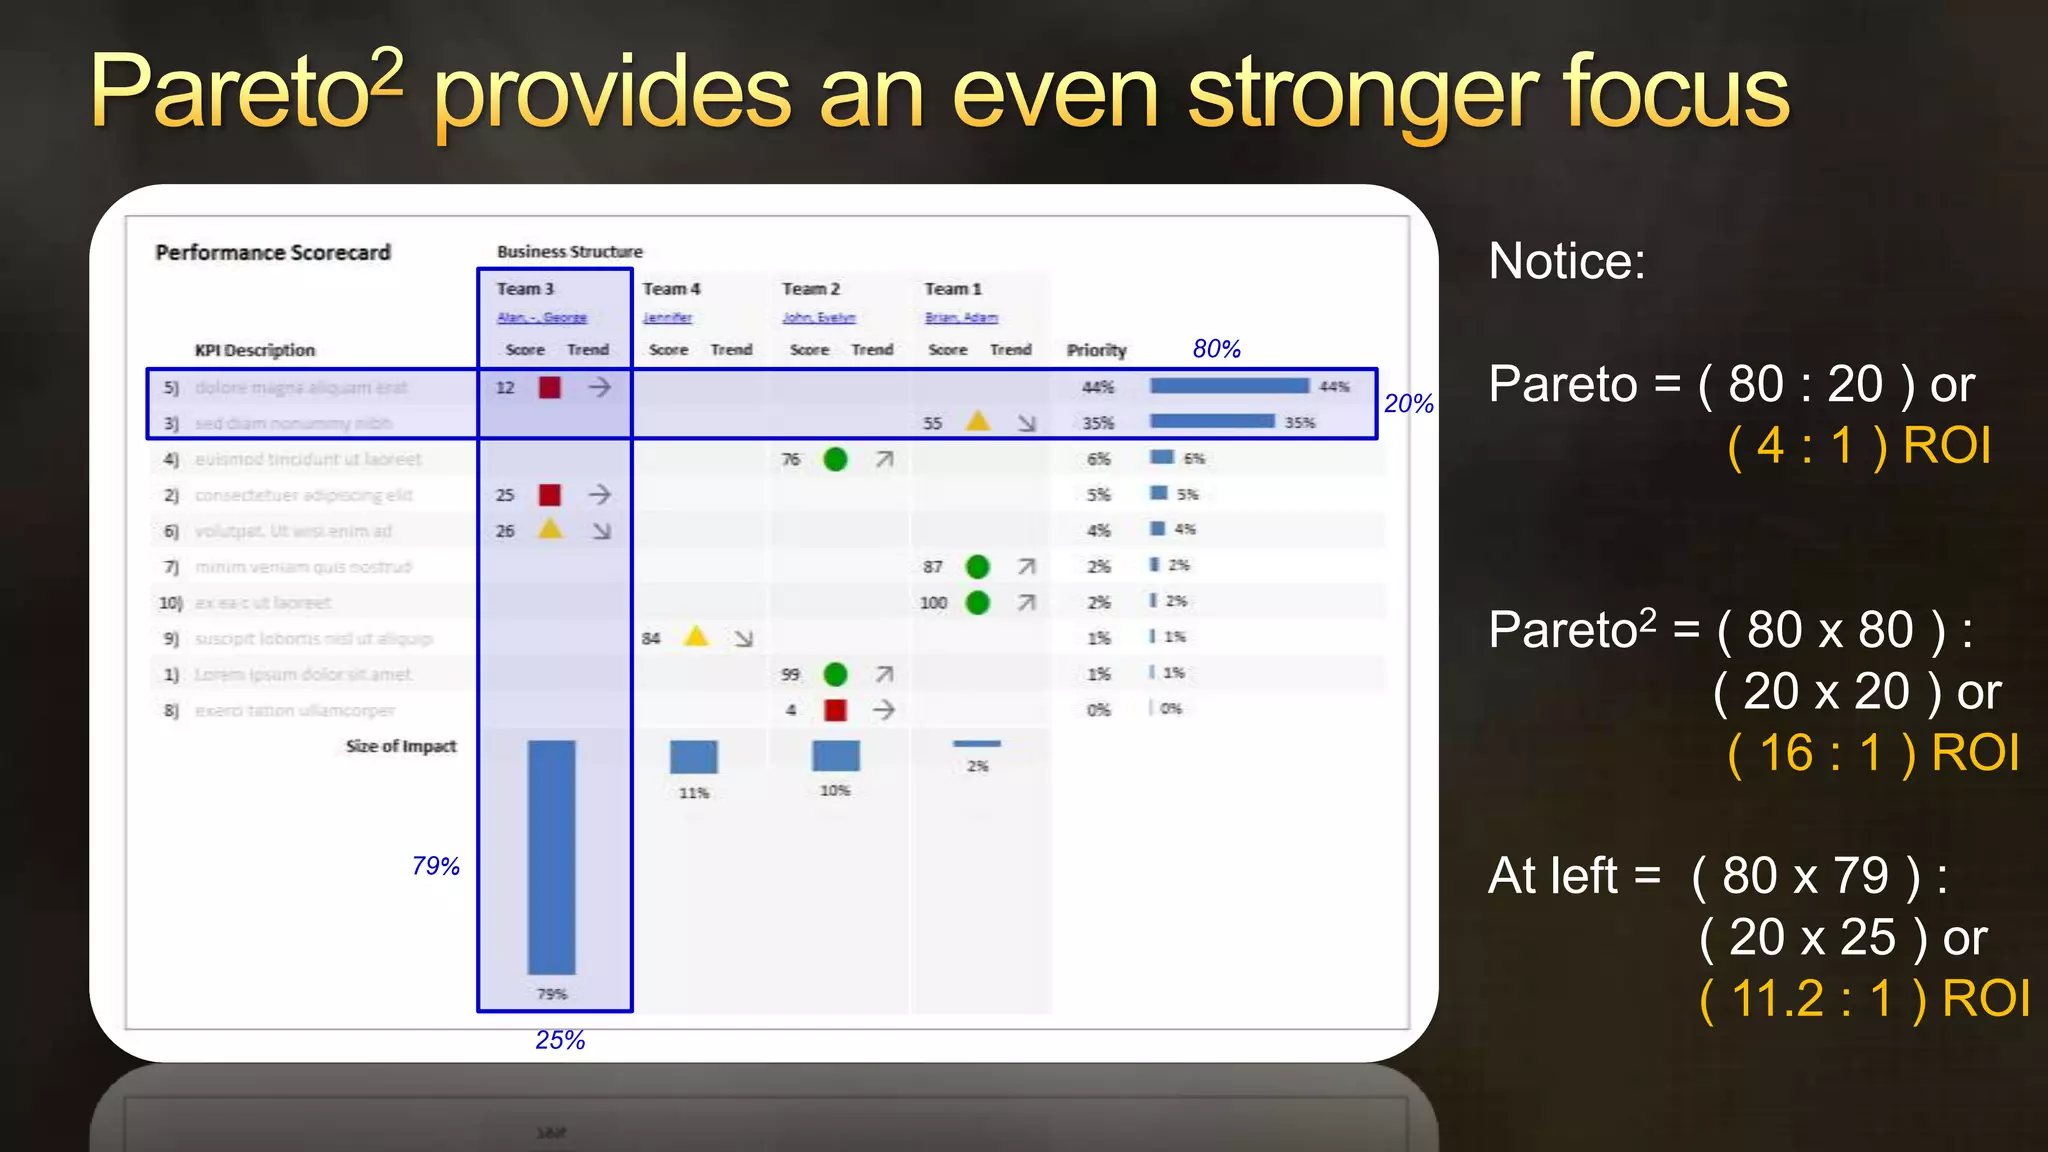
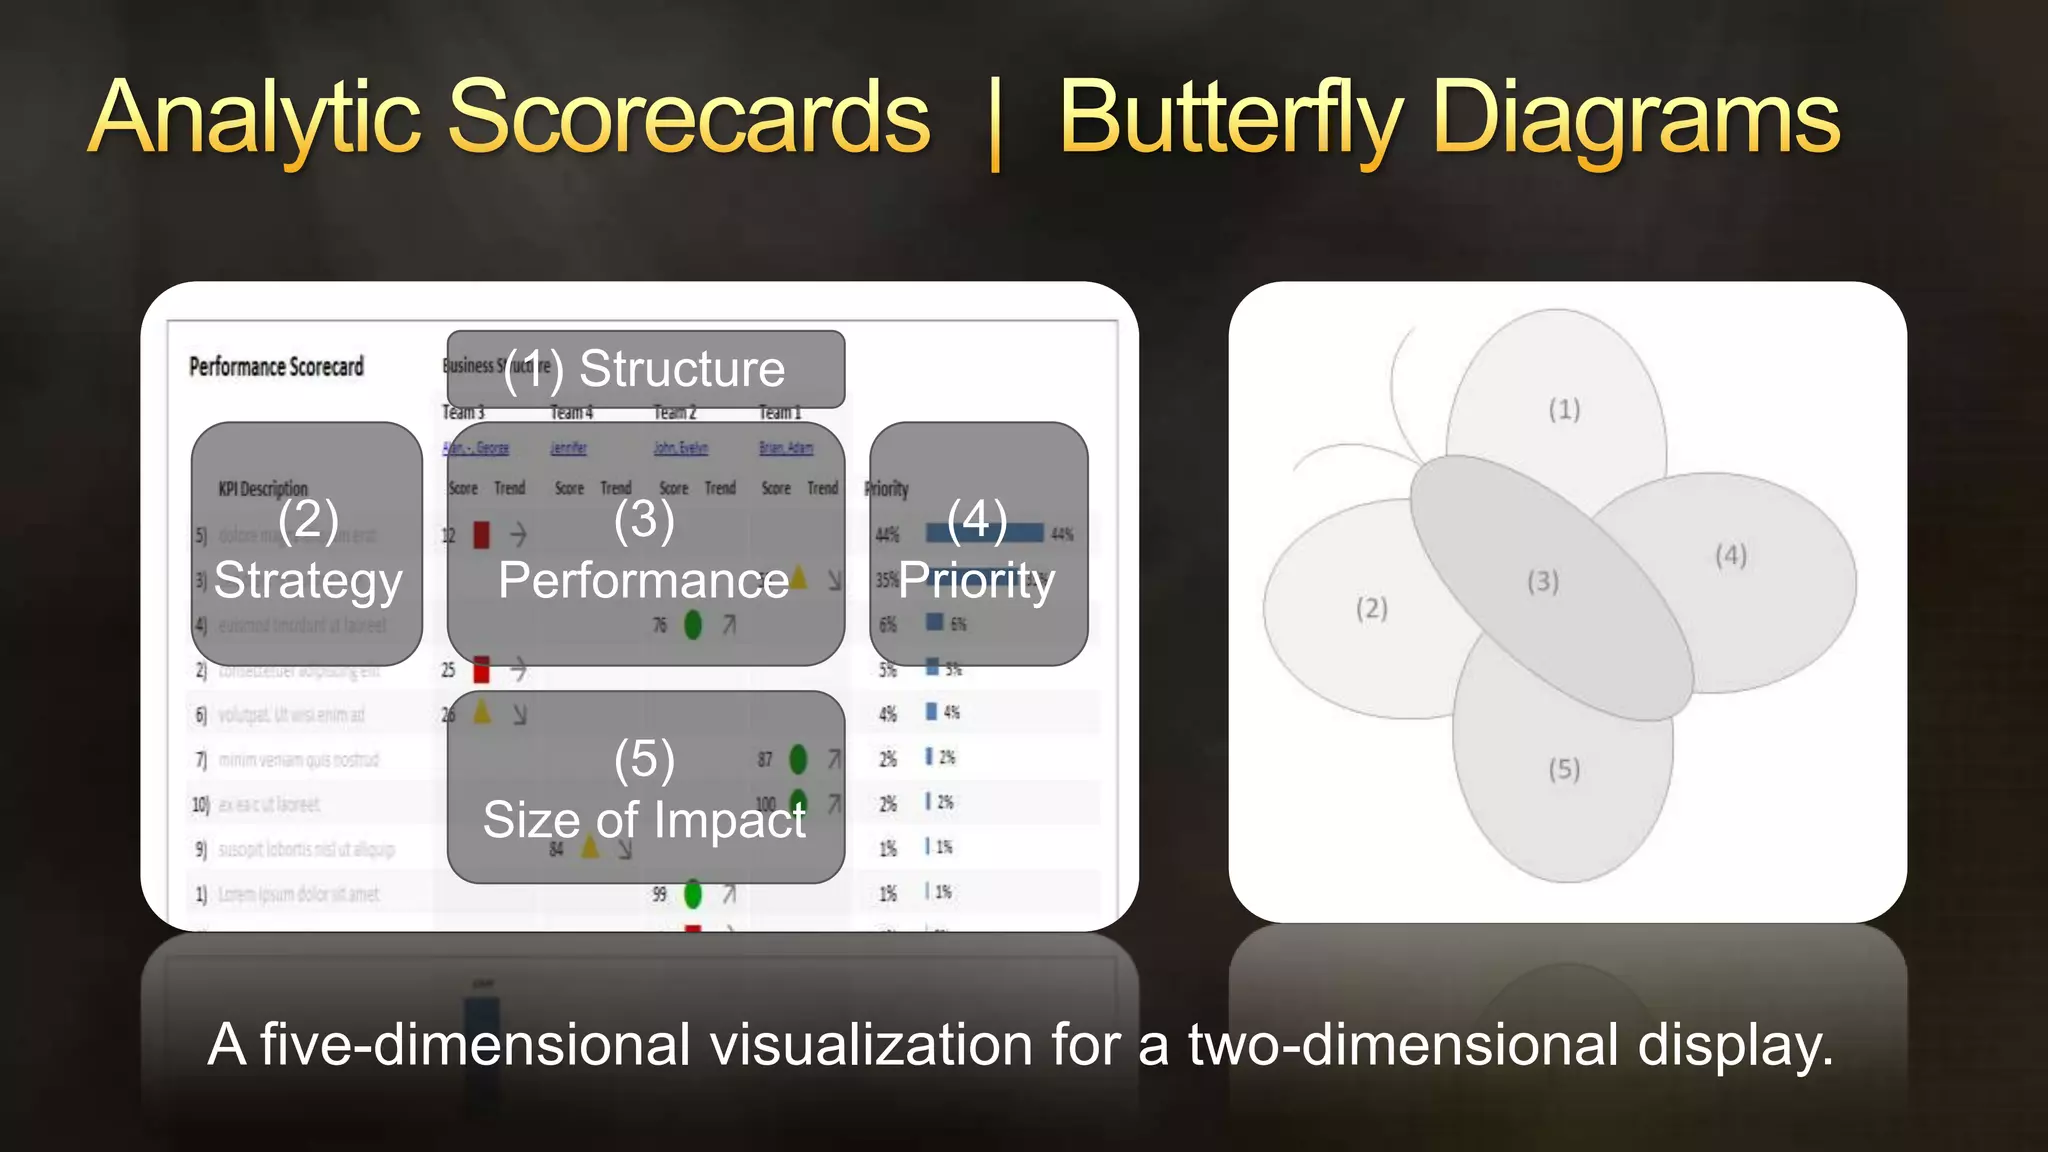
This presentation introduces analytic scorecards and butterfly diagrams, which visualize business performance data in multiple dimensions. Scorecards typically display important metrics needed to achieve objectives, but can be improved. Analytic scorecards apply concepts like the Pareto principle to provide deeper insights and focus attention on high-impact areas. Butterfly diagrams visualize data across five dimensions in a compact two-dimensional view, helping users develop skills to frame scorecards effectively and drive better business decisions.