Downloaded 36 times
![Analysis of Economic Data Using Bigdata
Presented By
SHIVUMANJESH P
[4JC13MCA51]
VI SEM MCA
SJCE
Internal Guide
C J HARSHITHA
Assistant Professor
Dept. Of MCA
SJCE
External Guide
Imran basha
Senior Consultant
Snipe IT Solutions
JSS MAHAVIDYAPEETHA
SRI JAYACHAMARAJENDRA COLLEGE OF ENGINEERING MYSURU-570006
AN AUTONOMOUS INSTITUTE AFFILIATED TO
VISVESVARAYA TECHNOLOGICAL UNIVERSITY, BELGAVI.
Presentation on](https://image.slidesharecdn.com/economicdata-160714122131/75/Analysis-of-economic-data-using-big-data-1-2048.jpg)
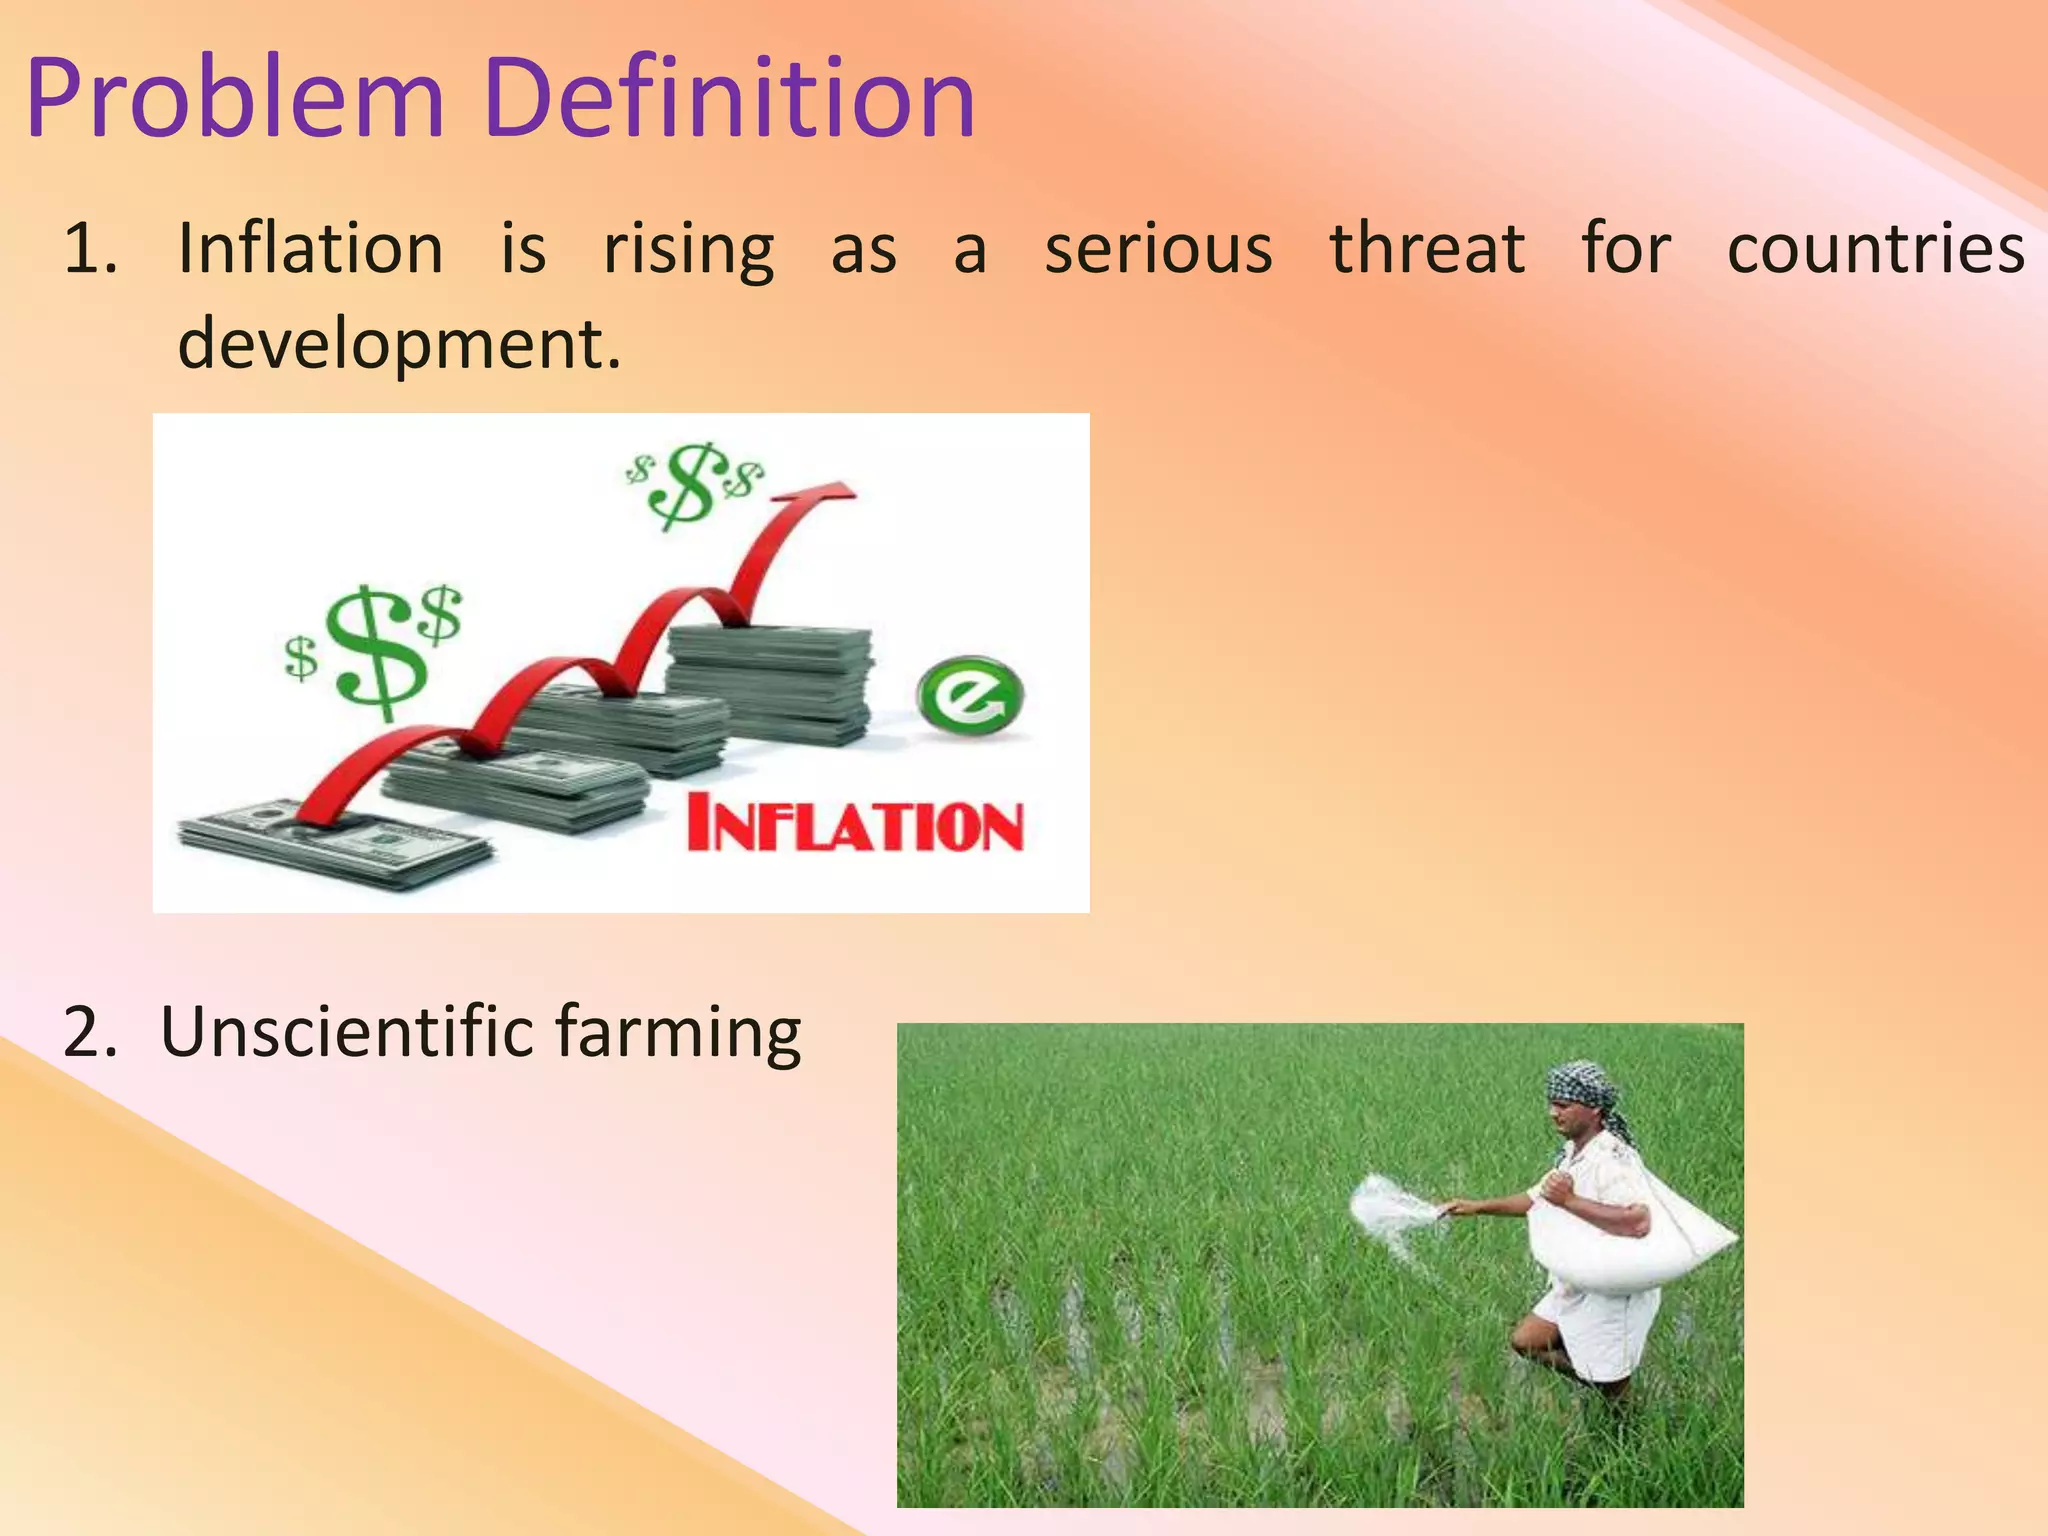
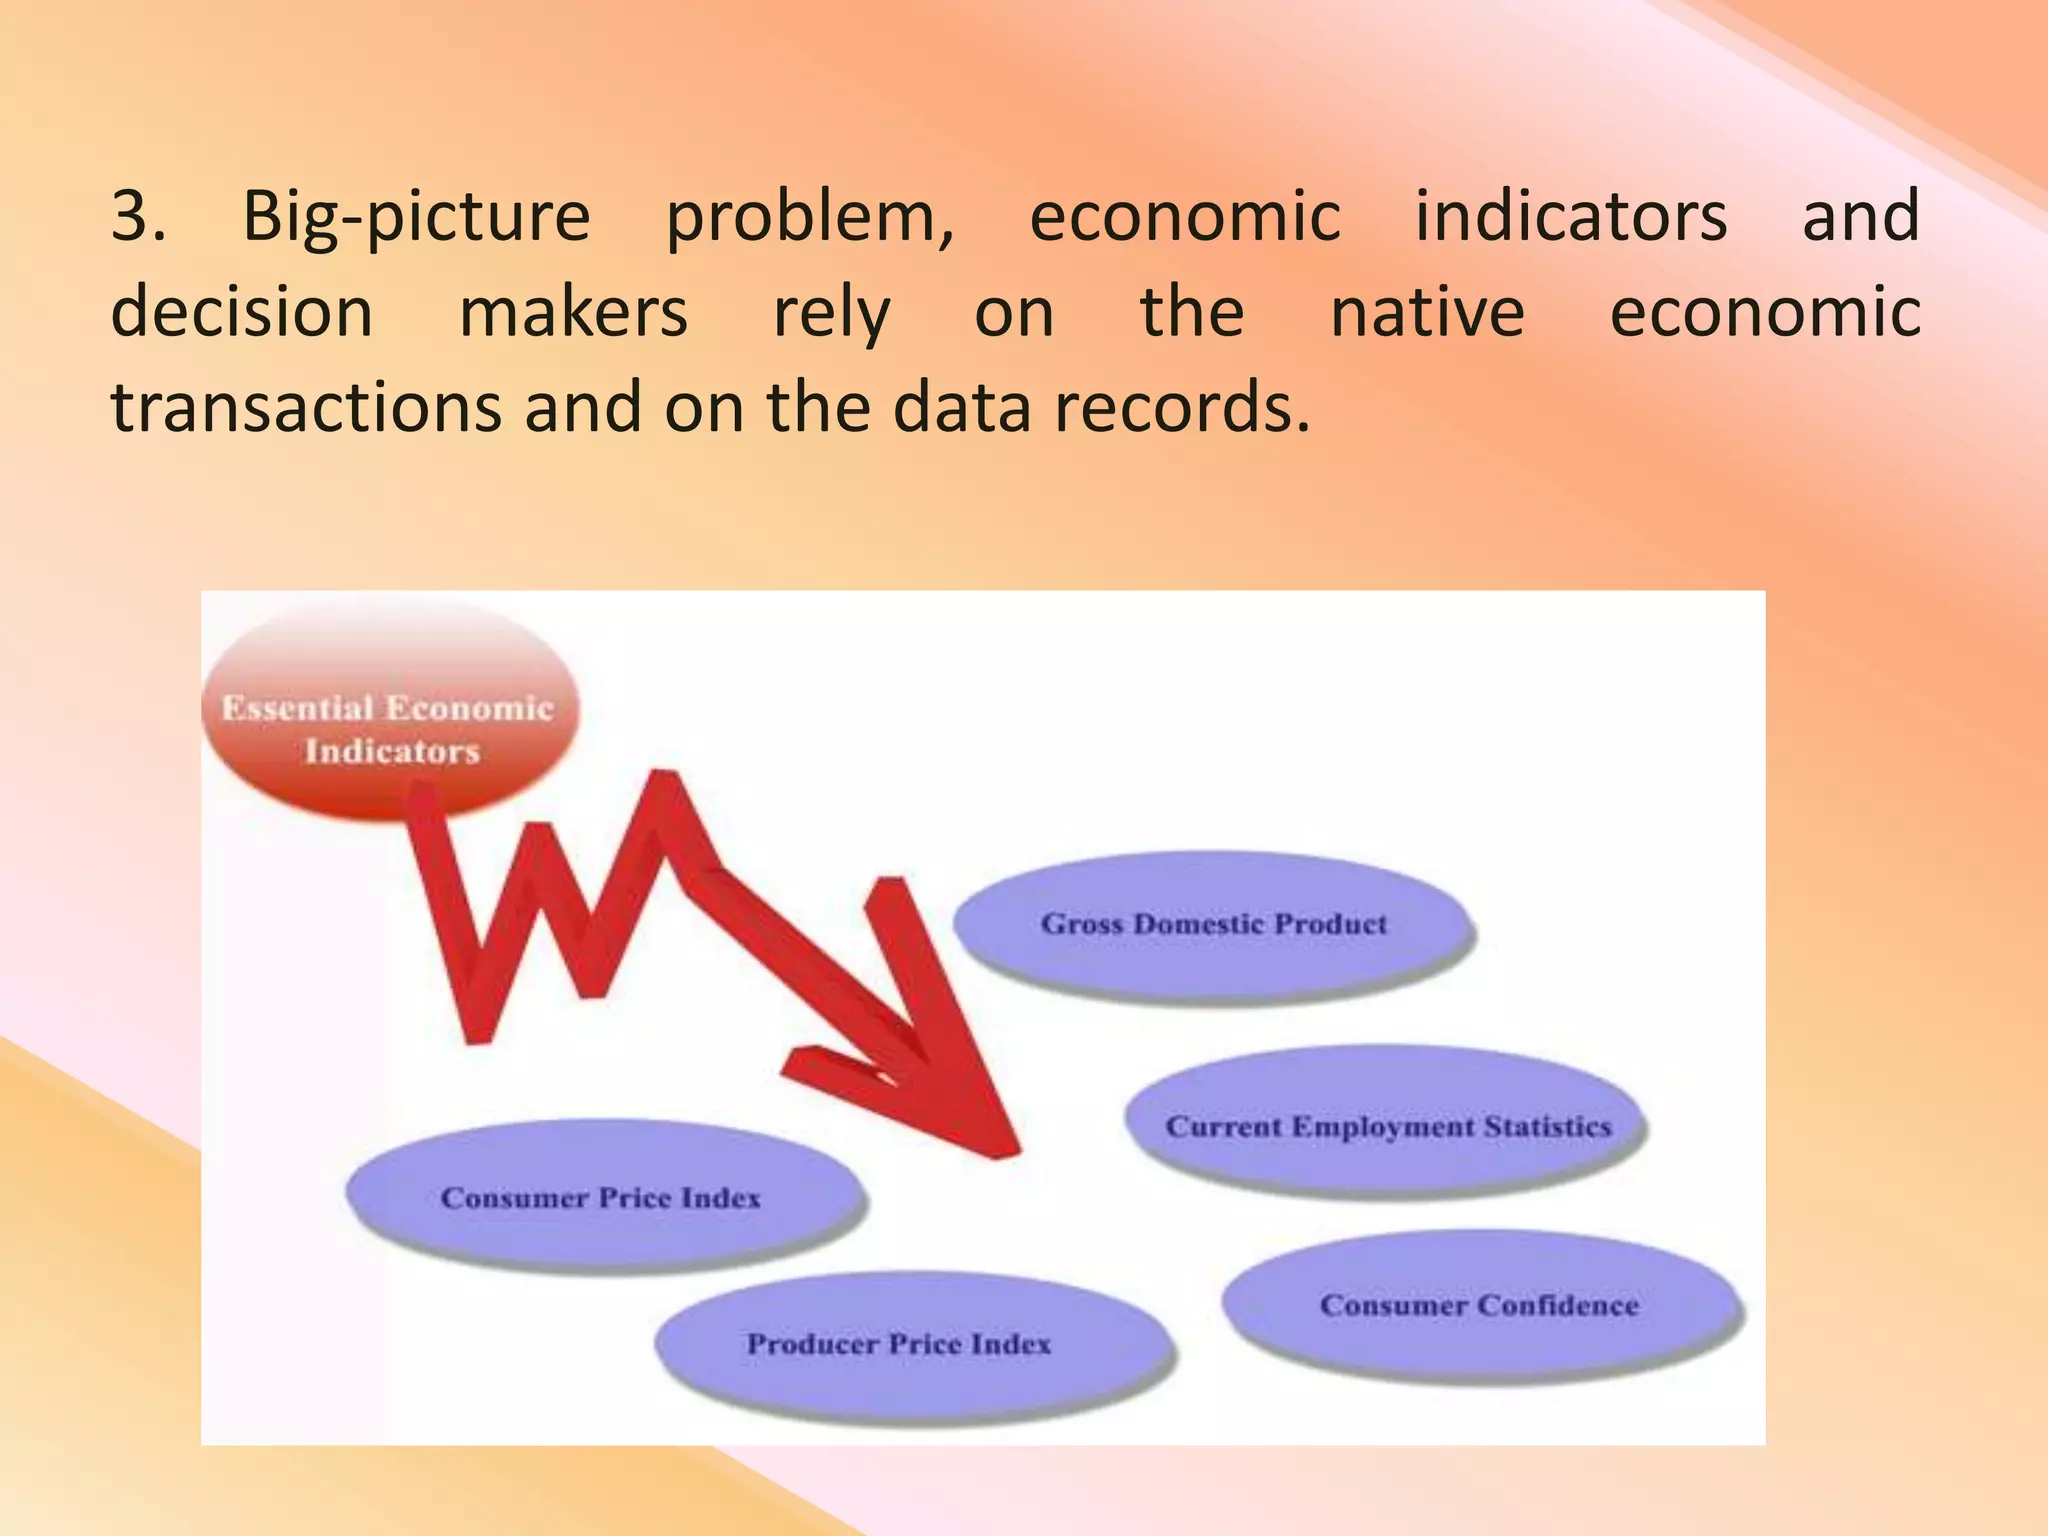
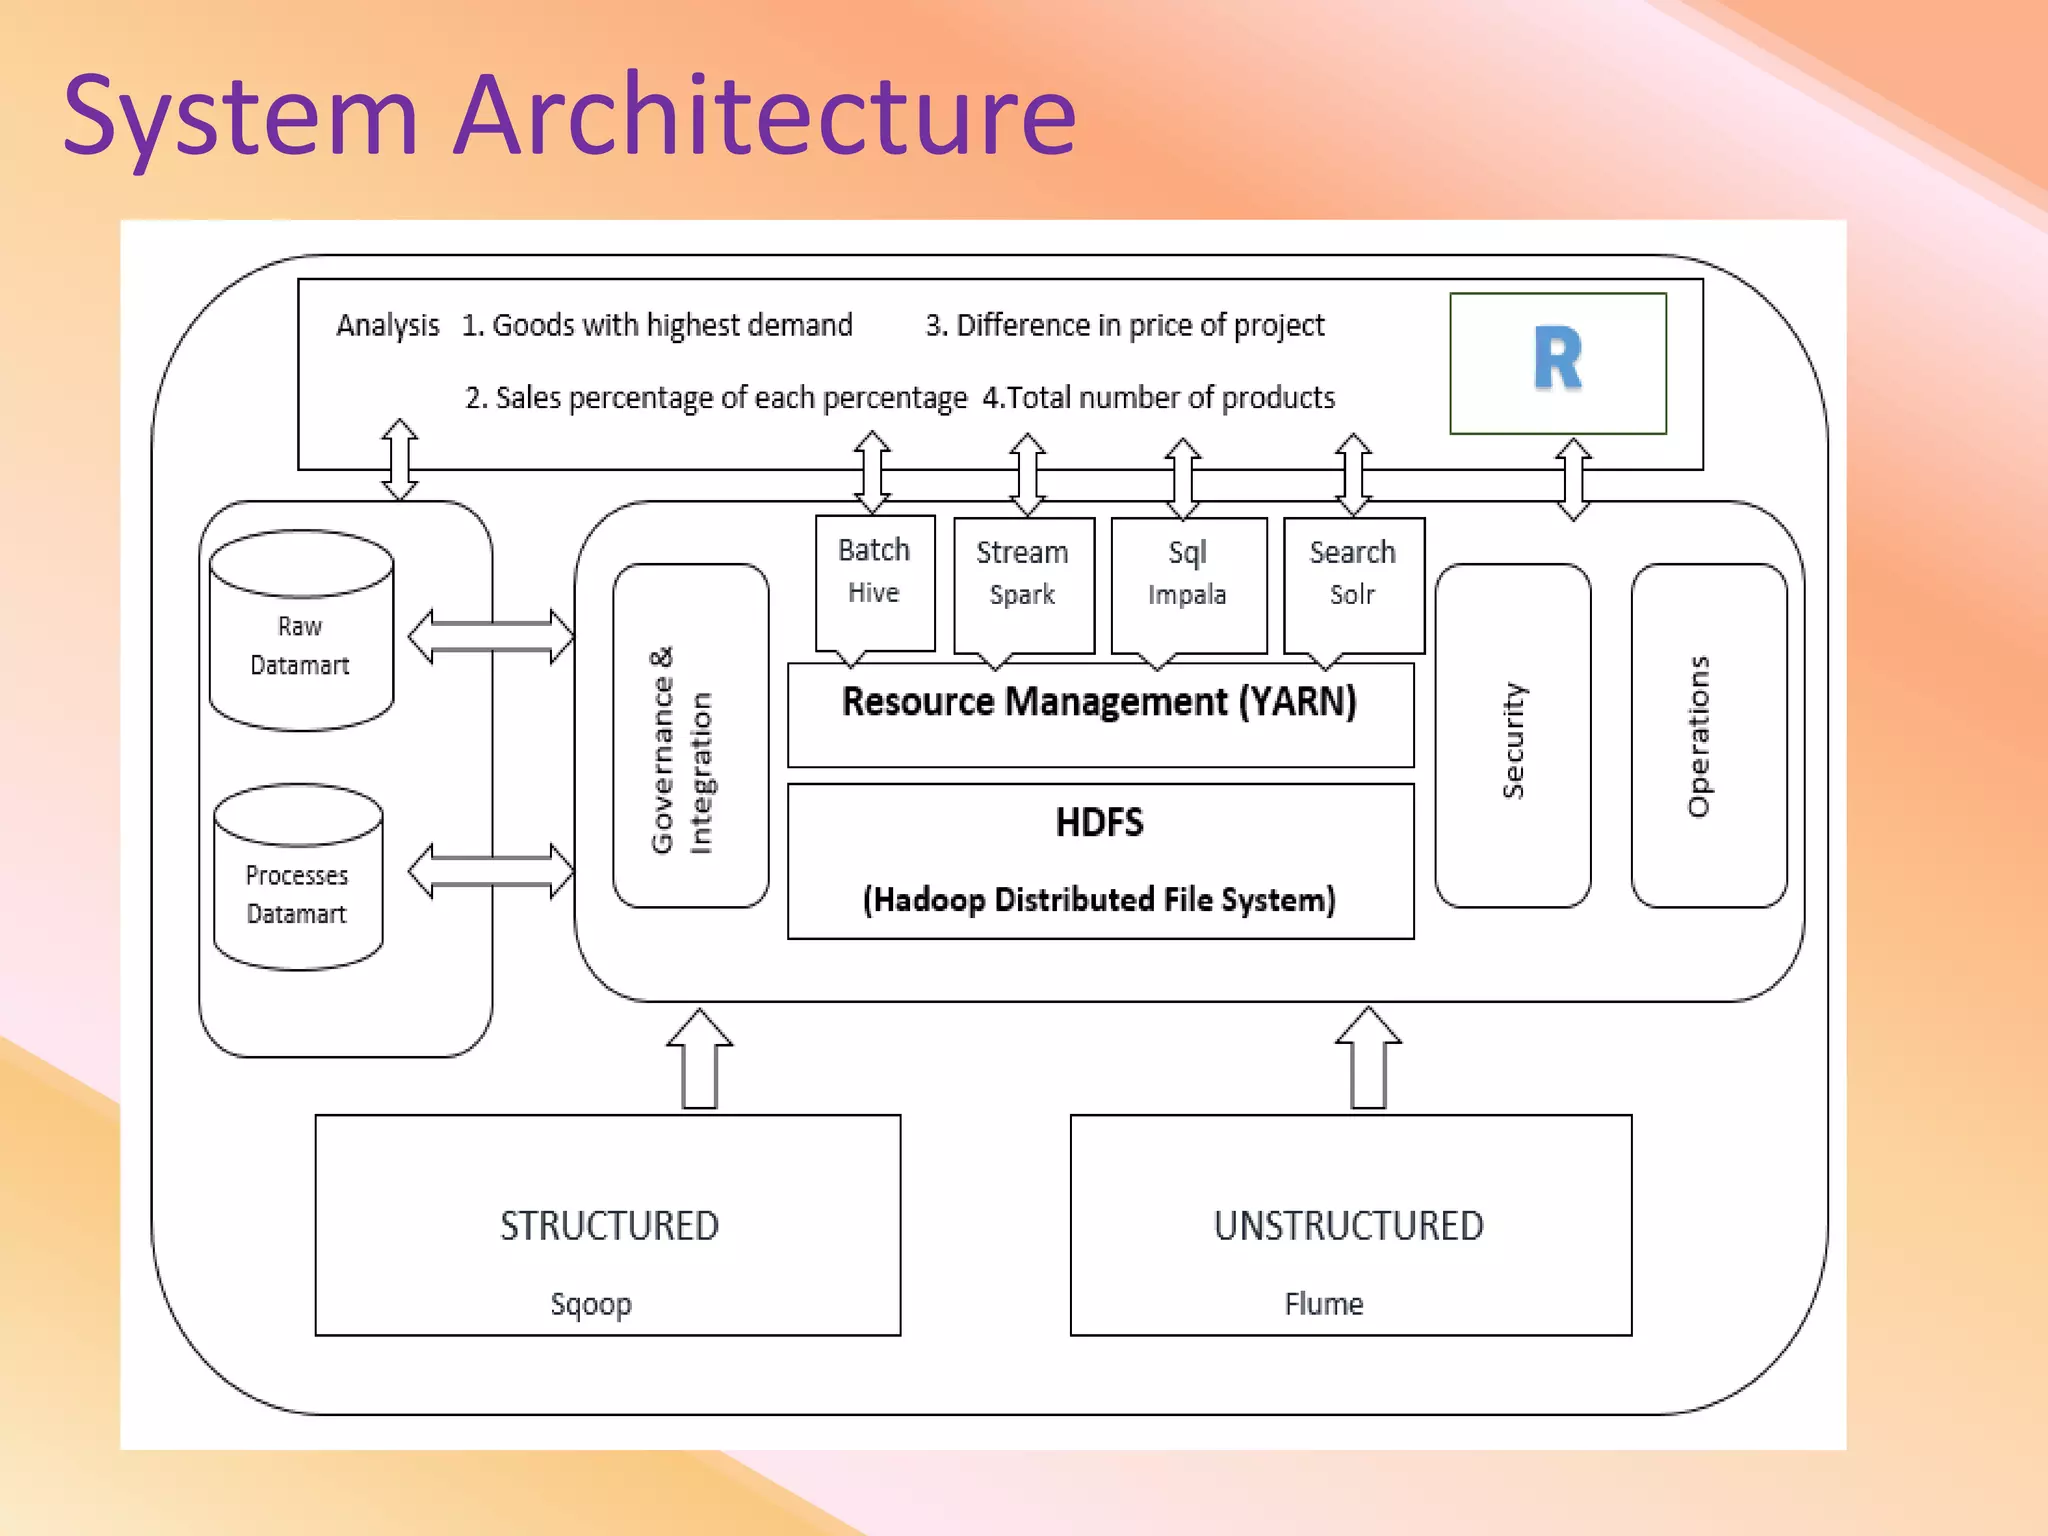
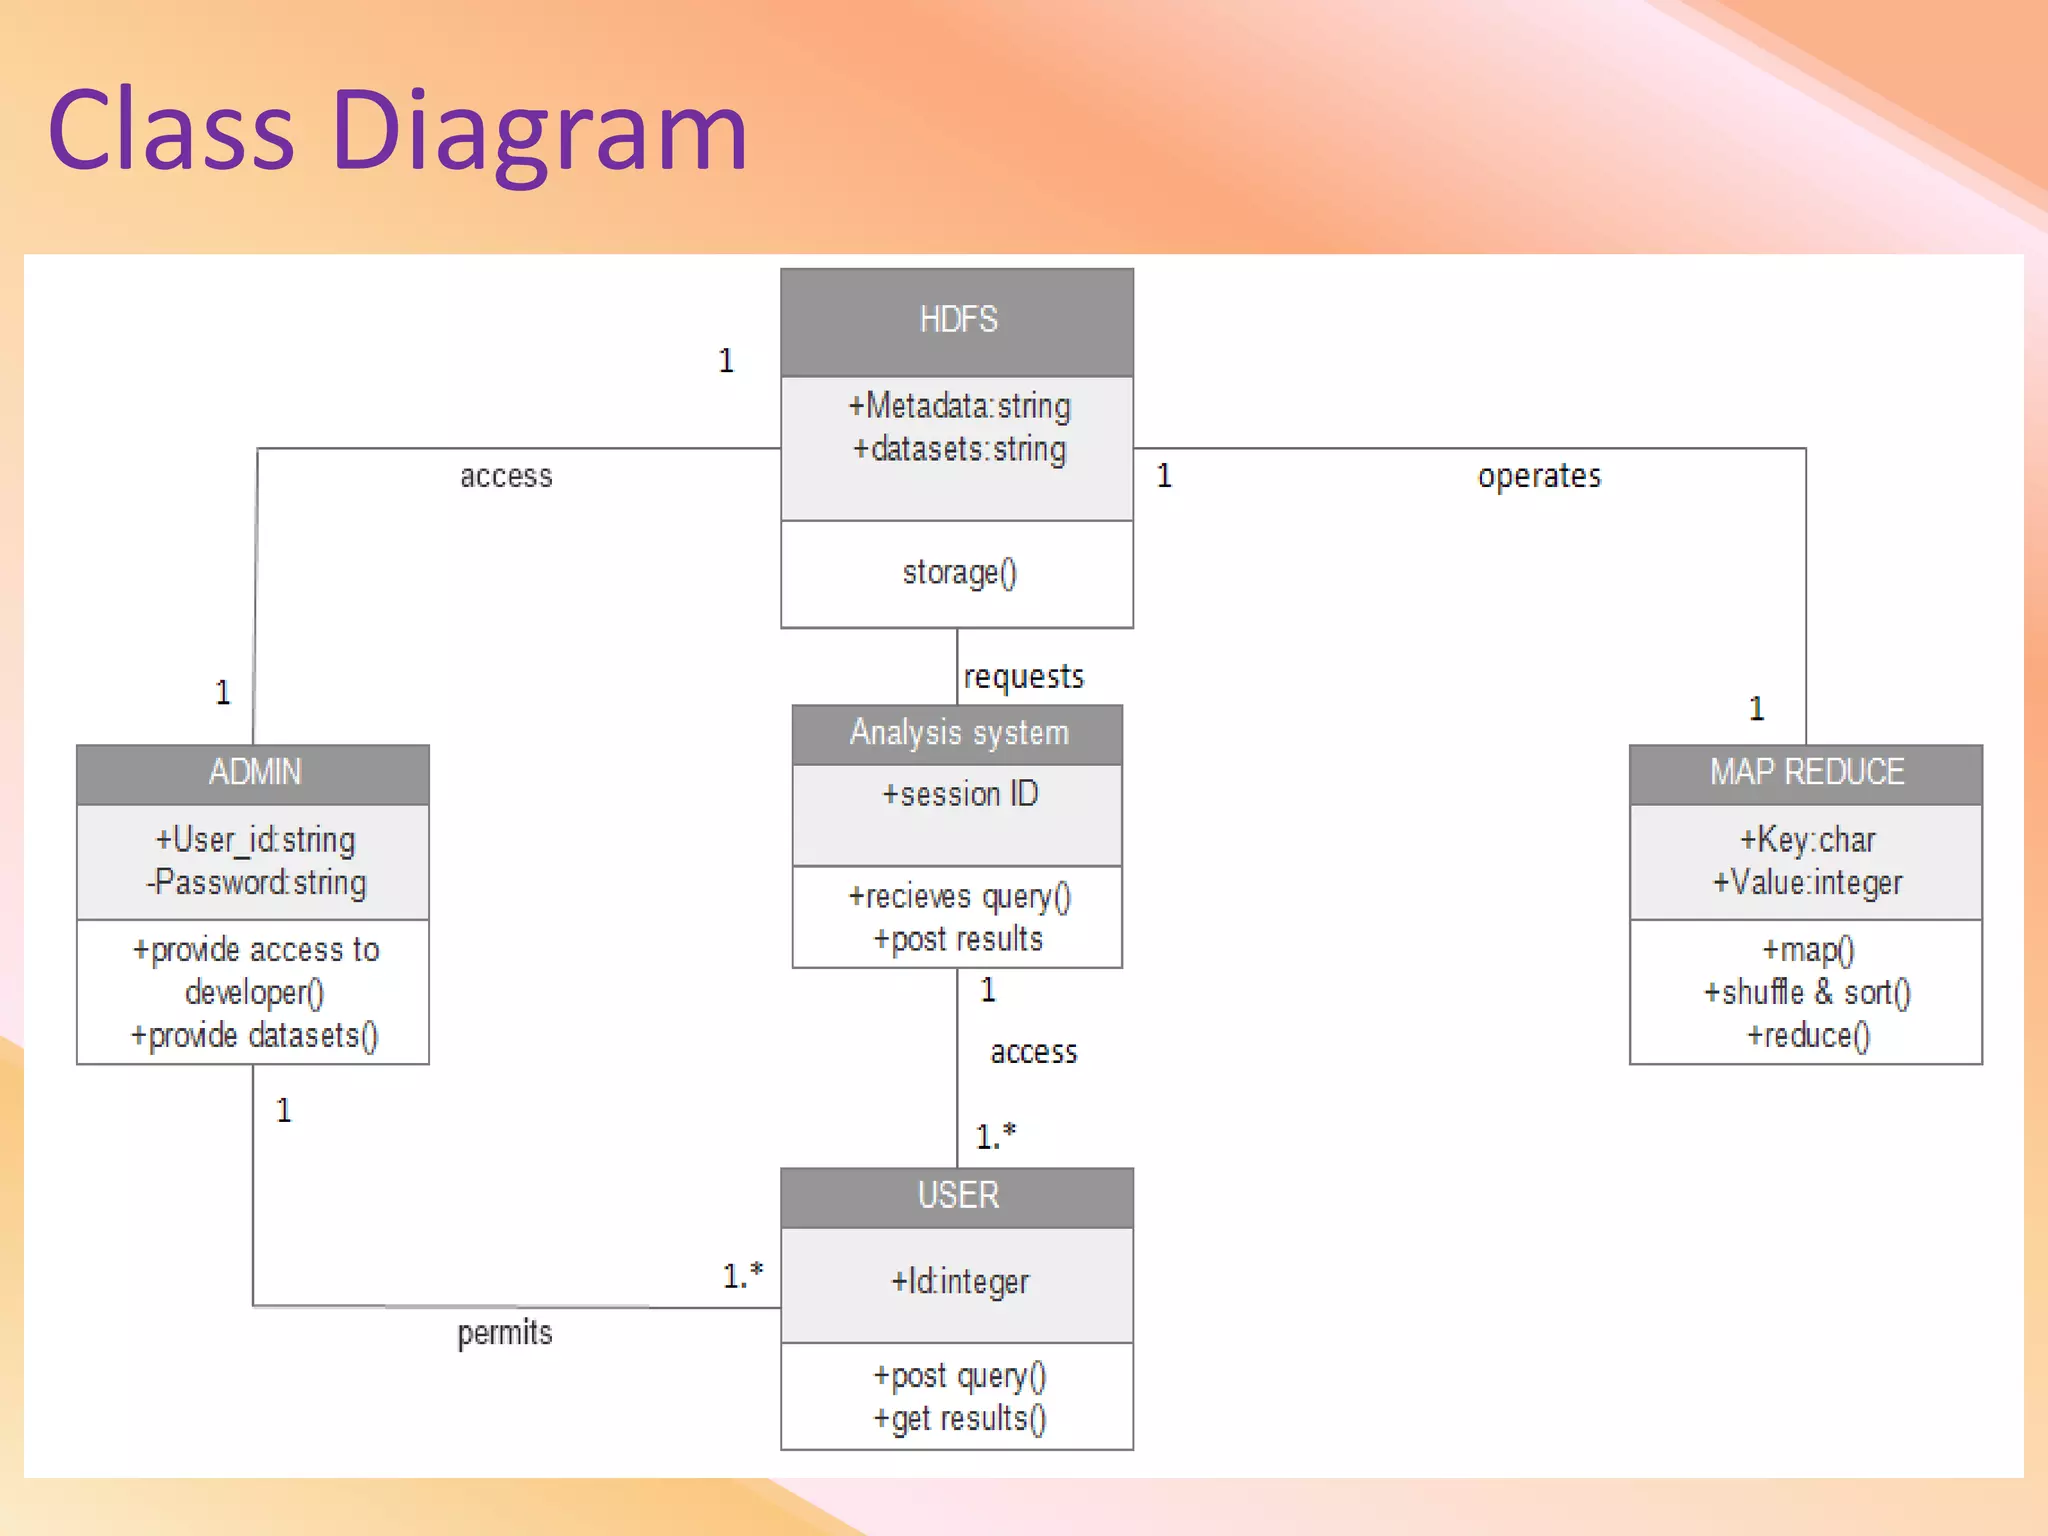
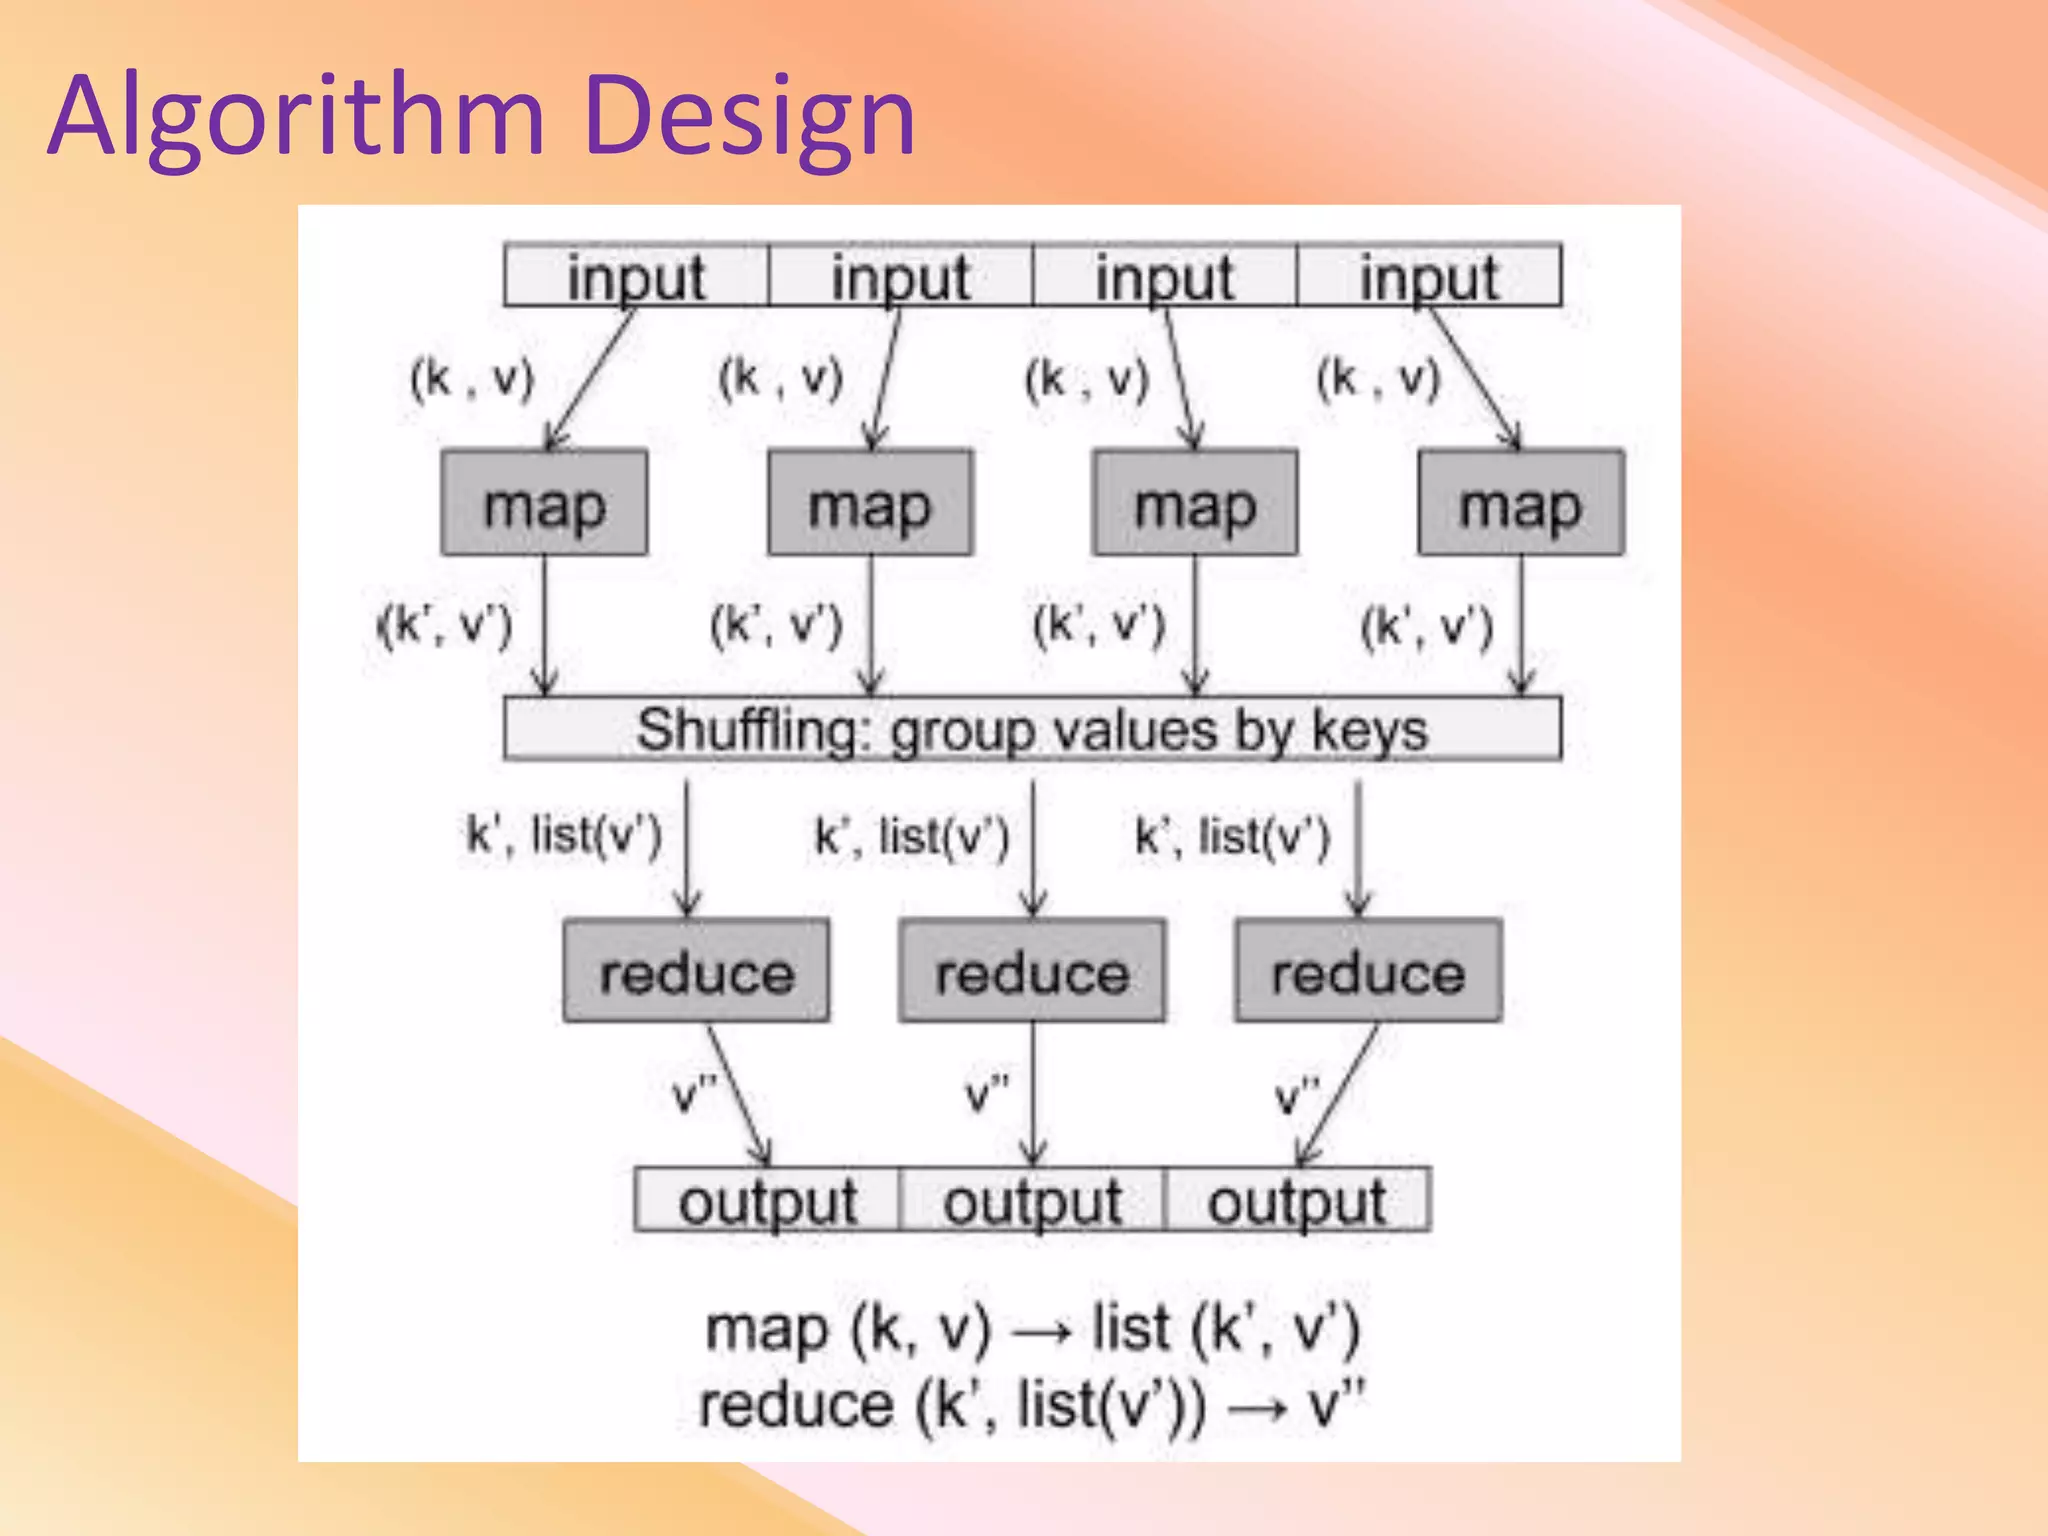
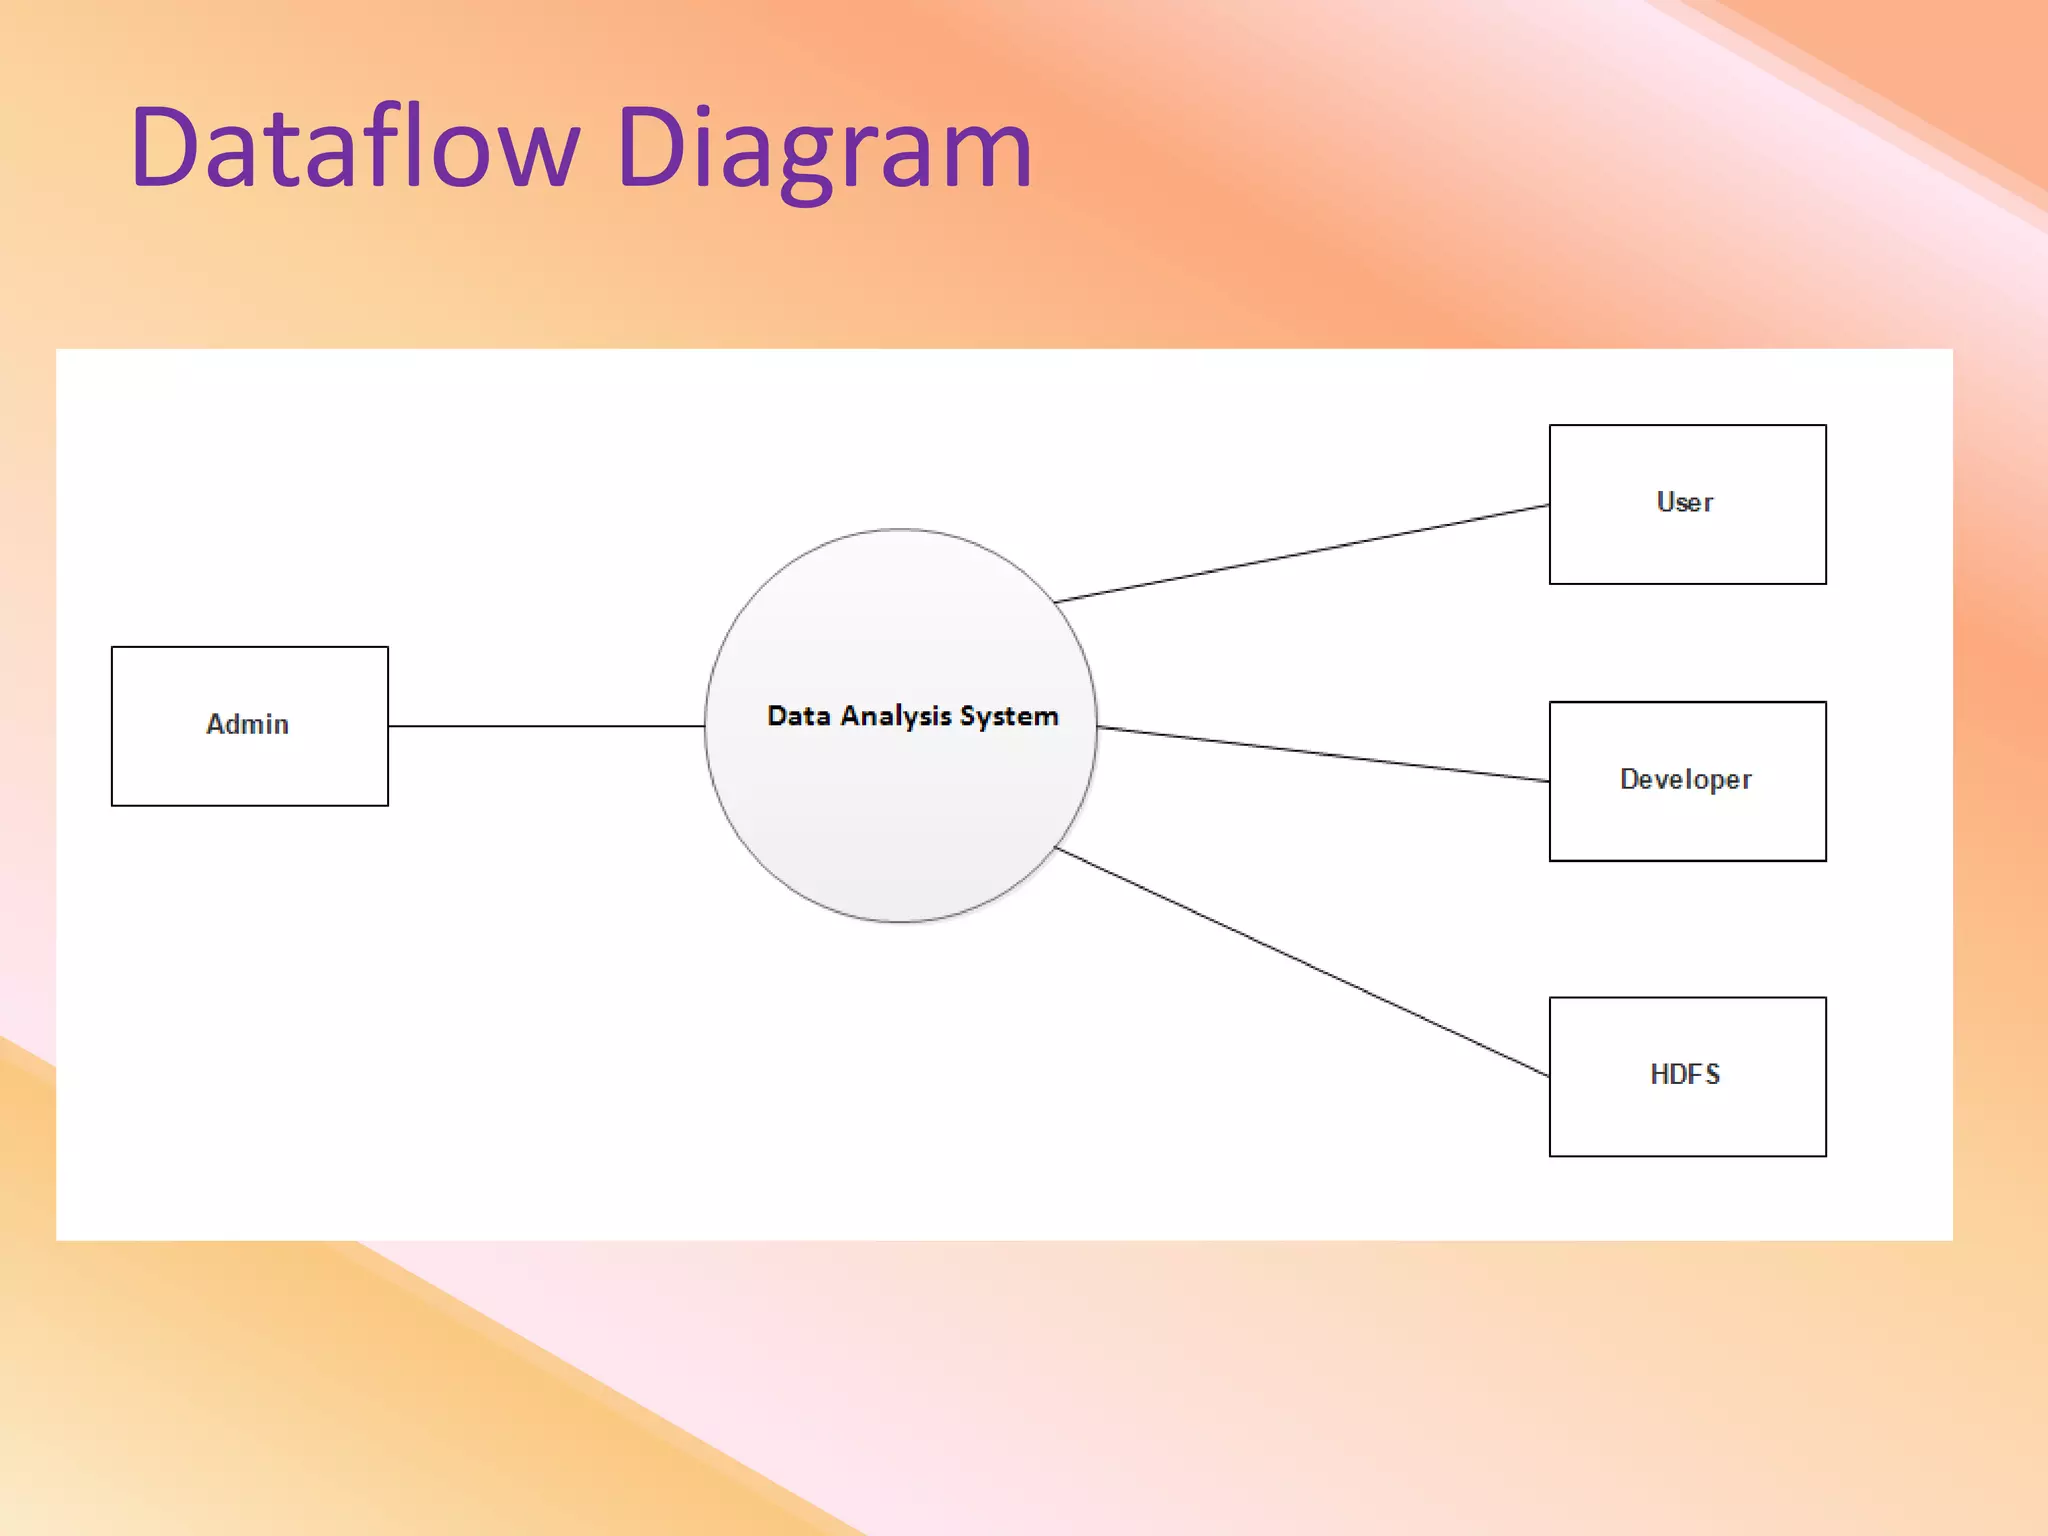
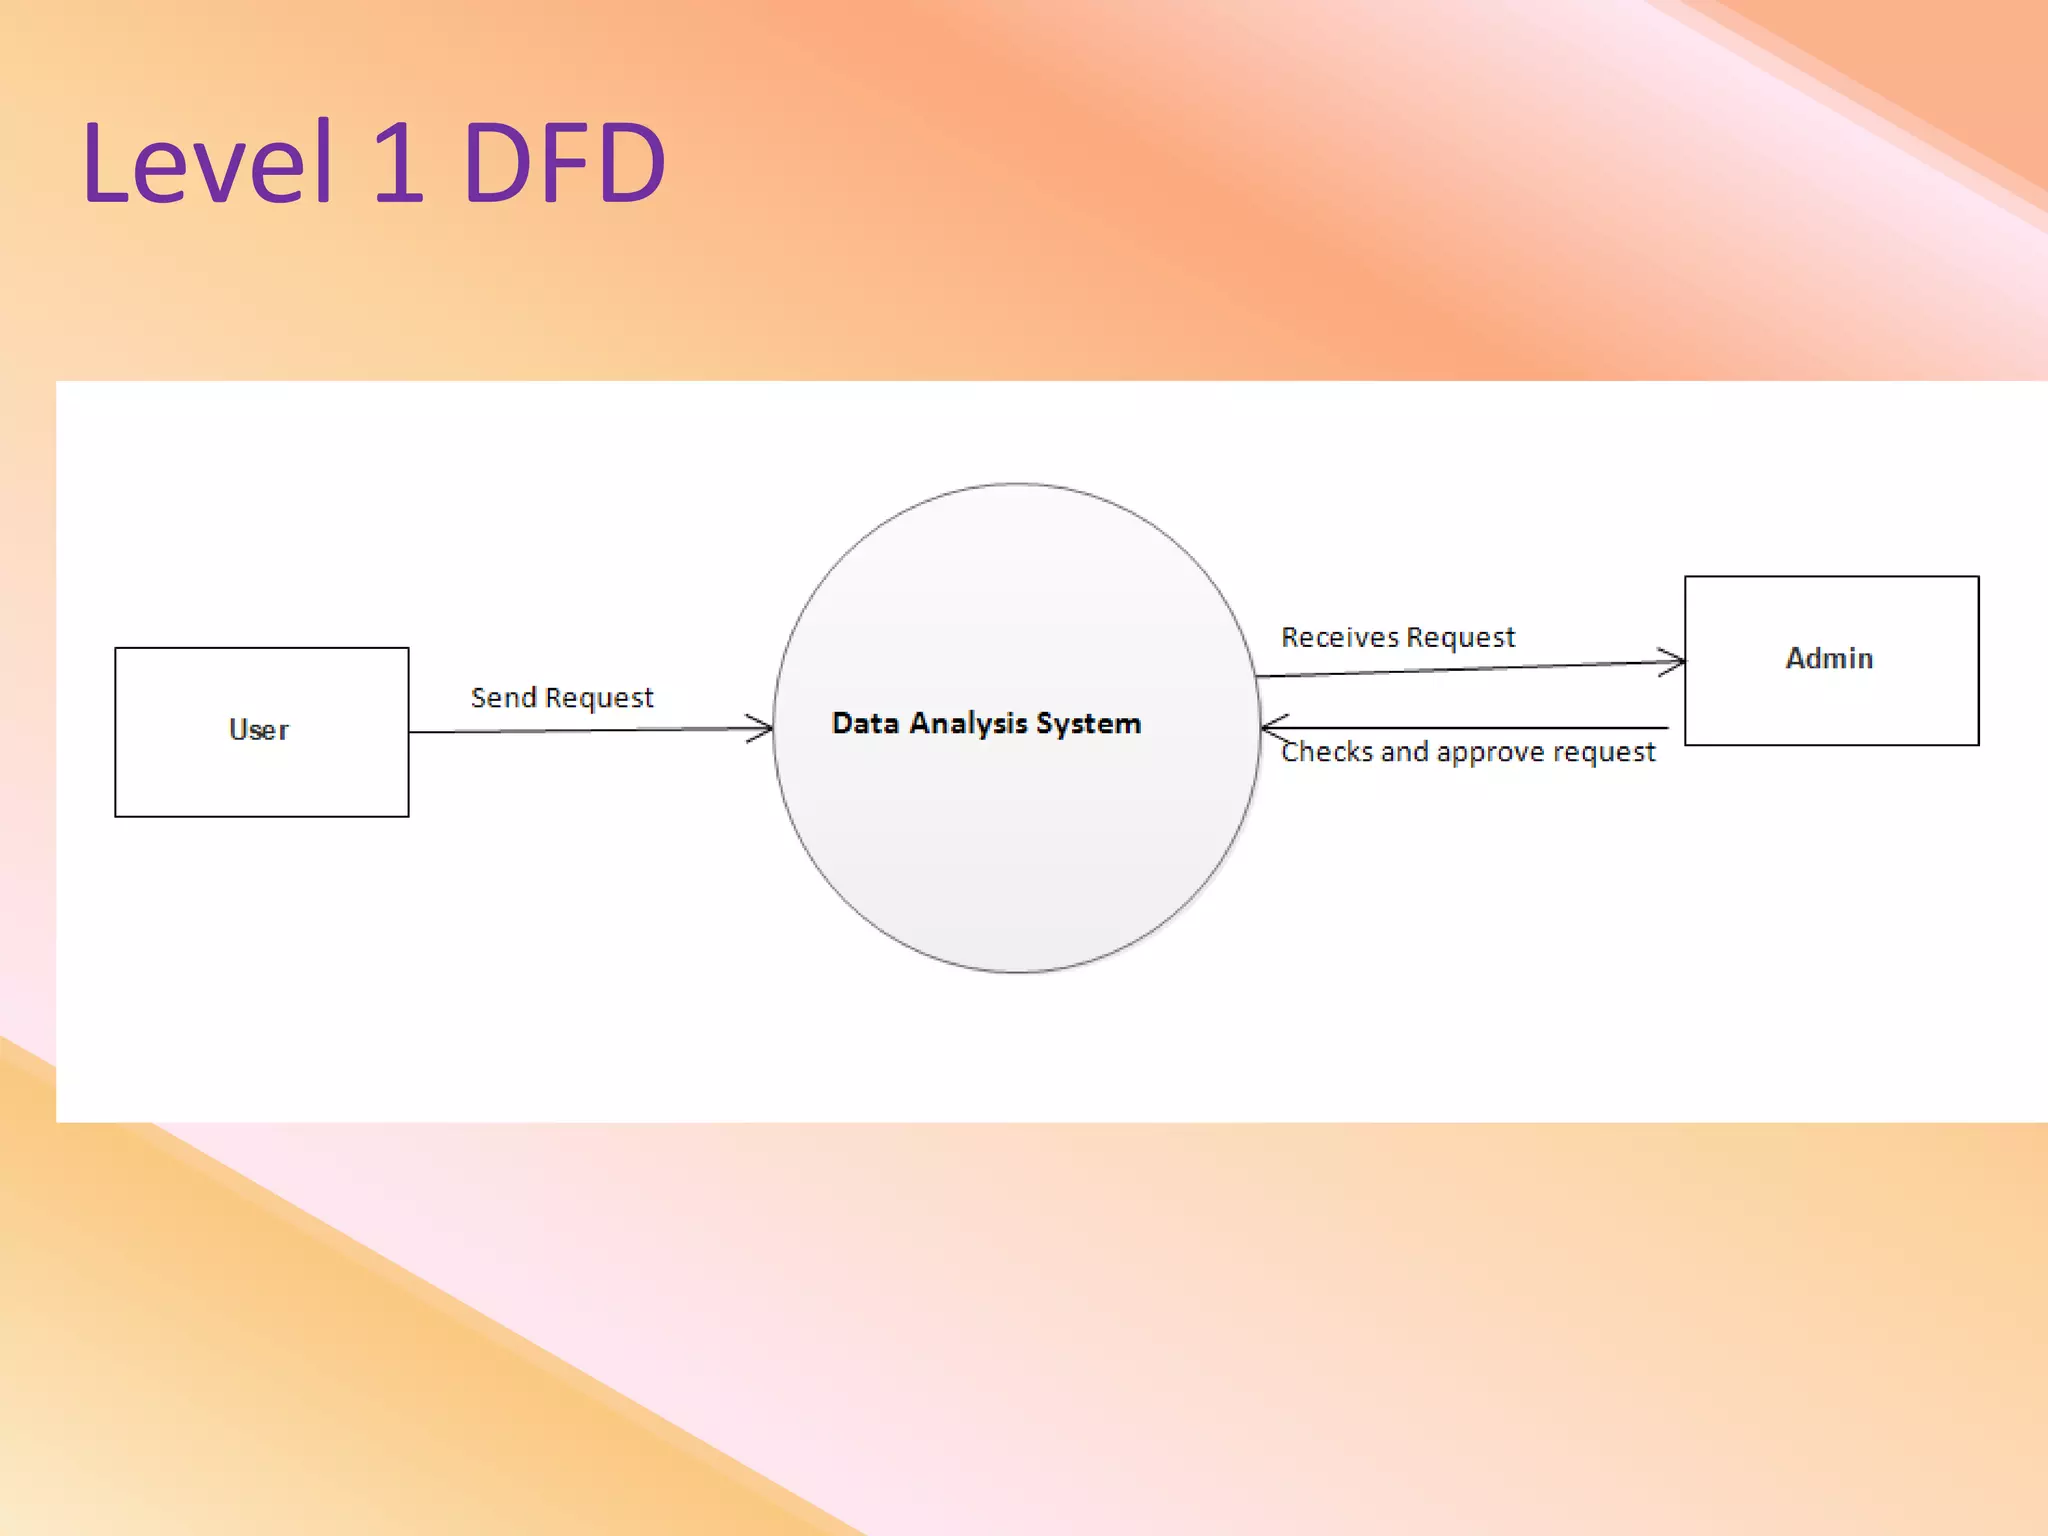
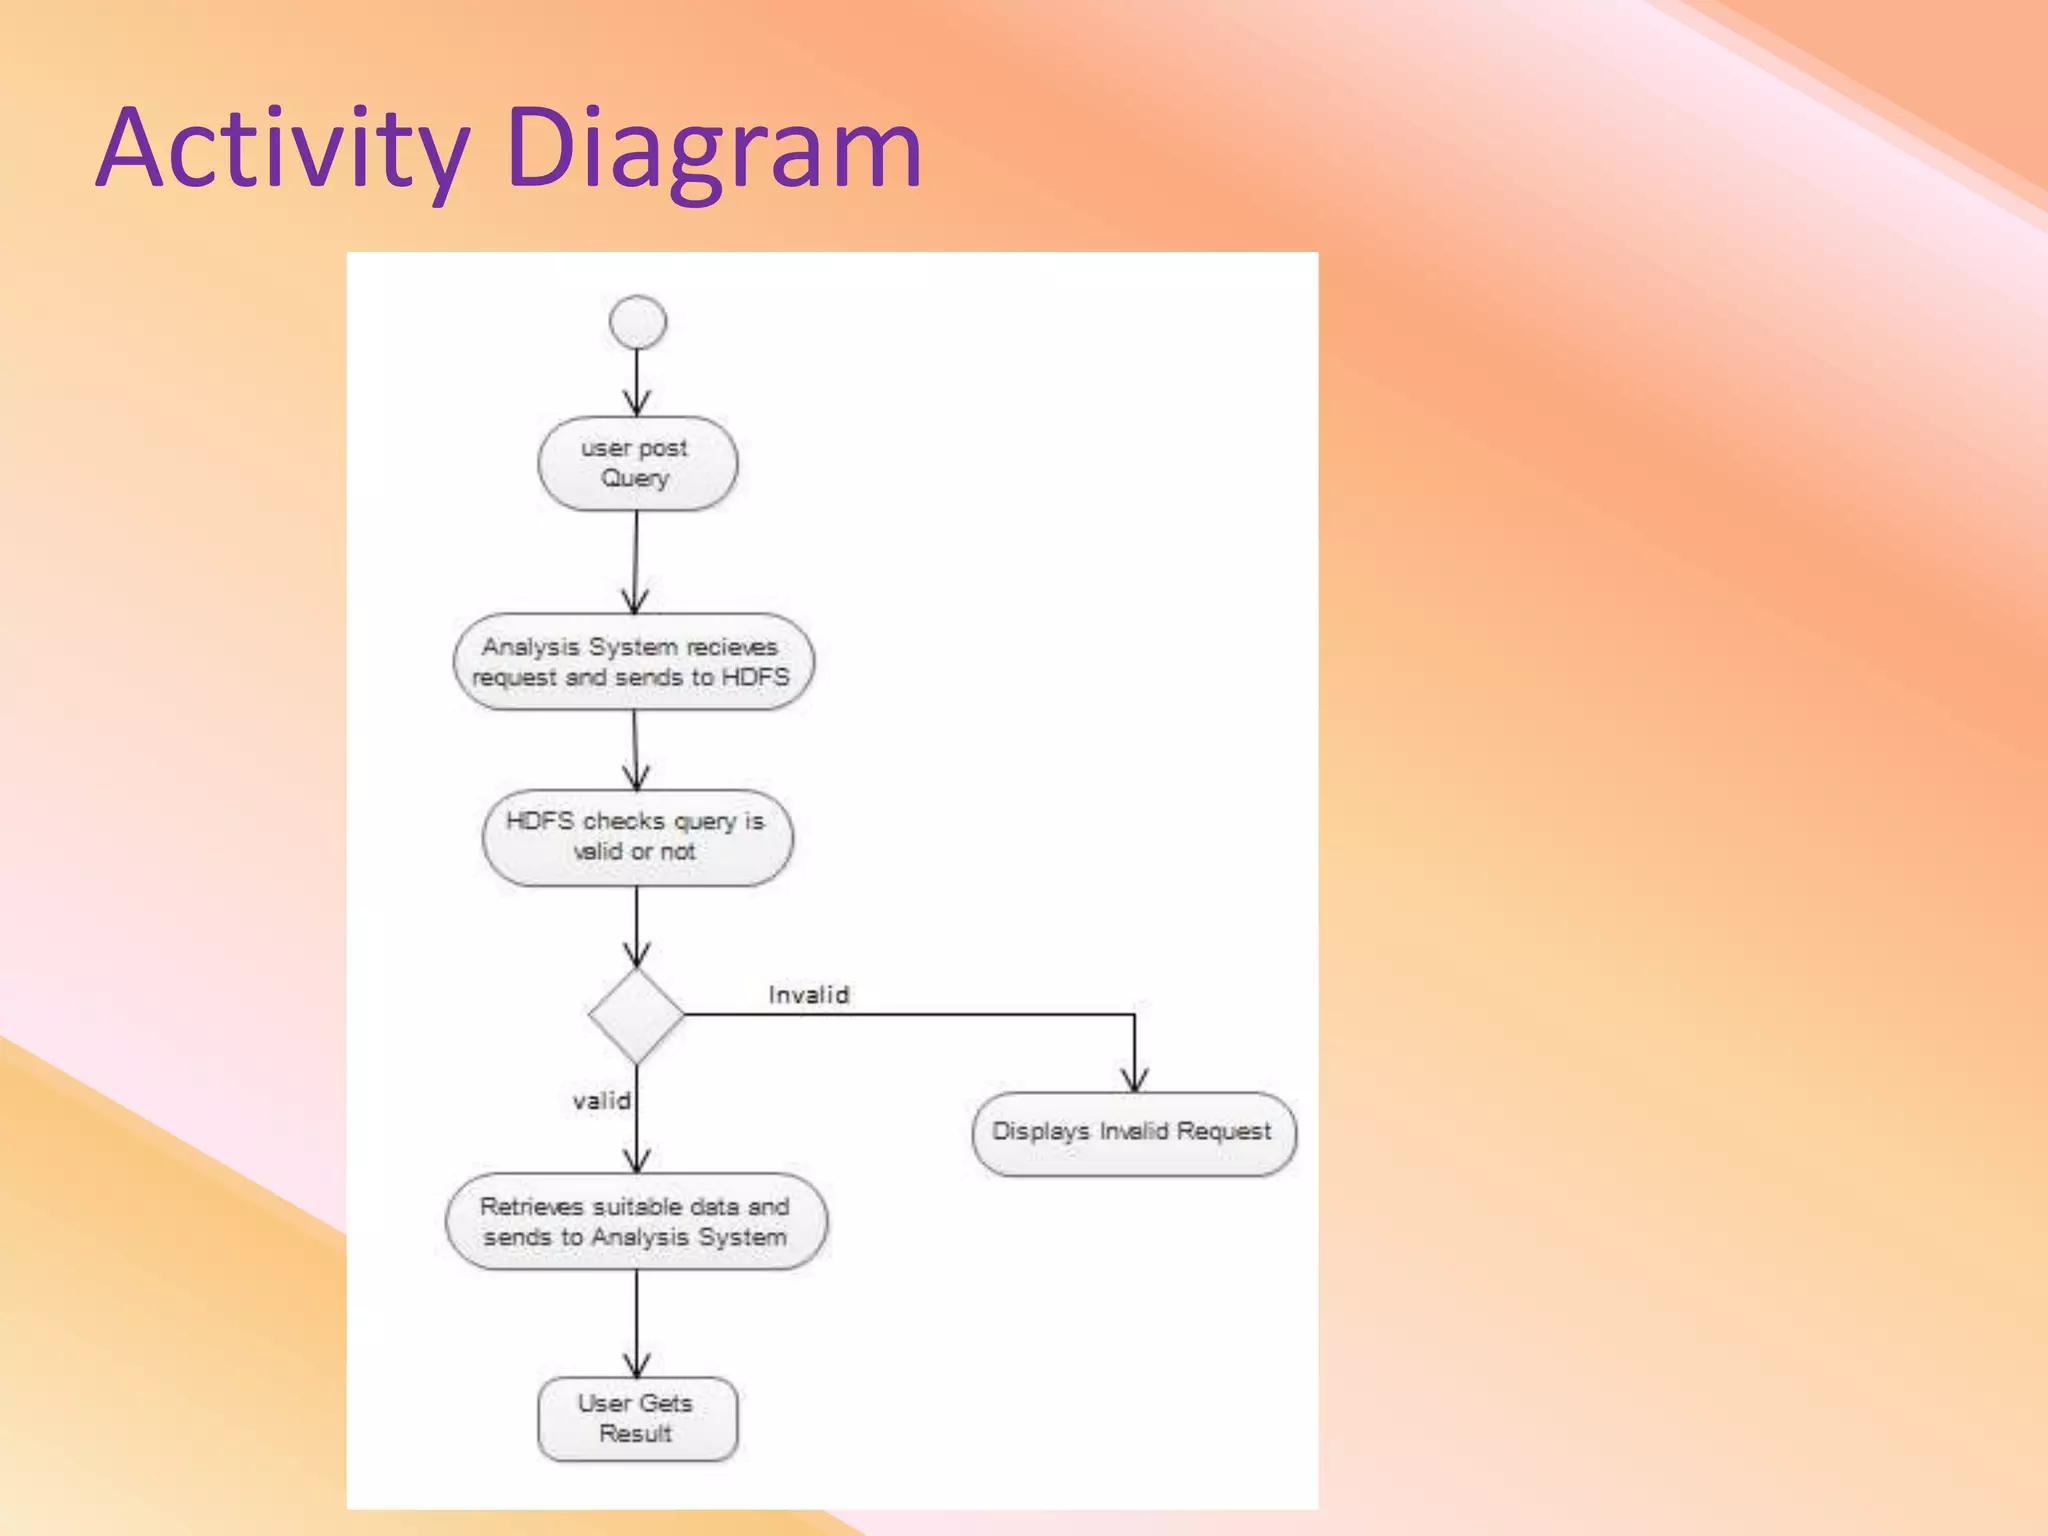
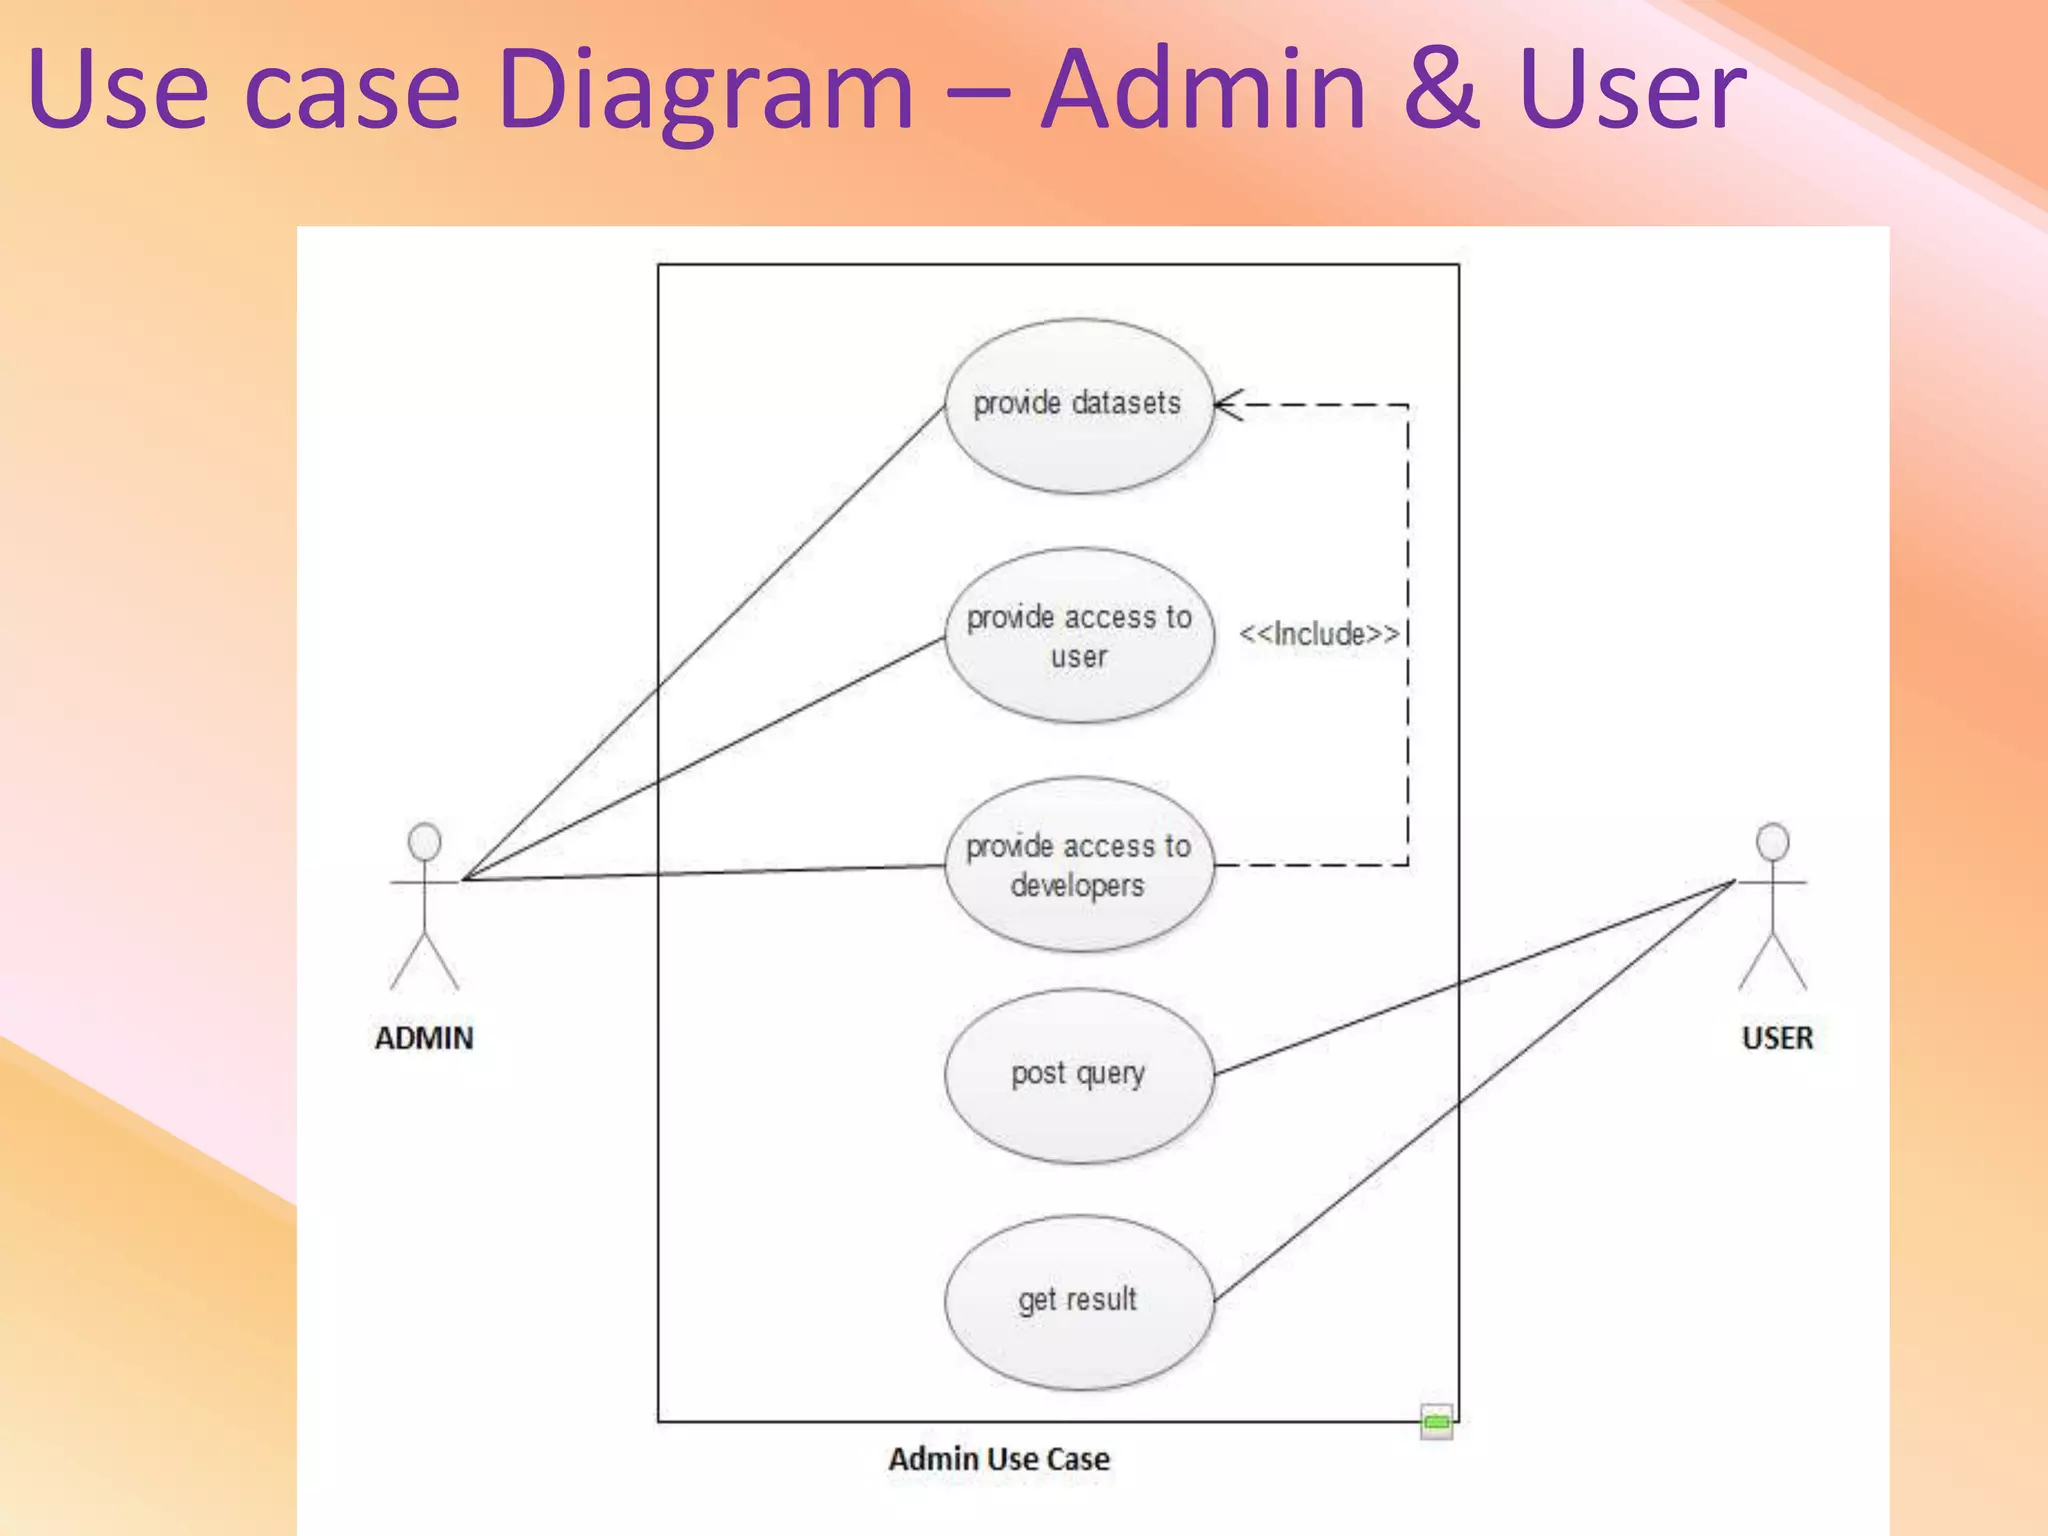
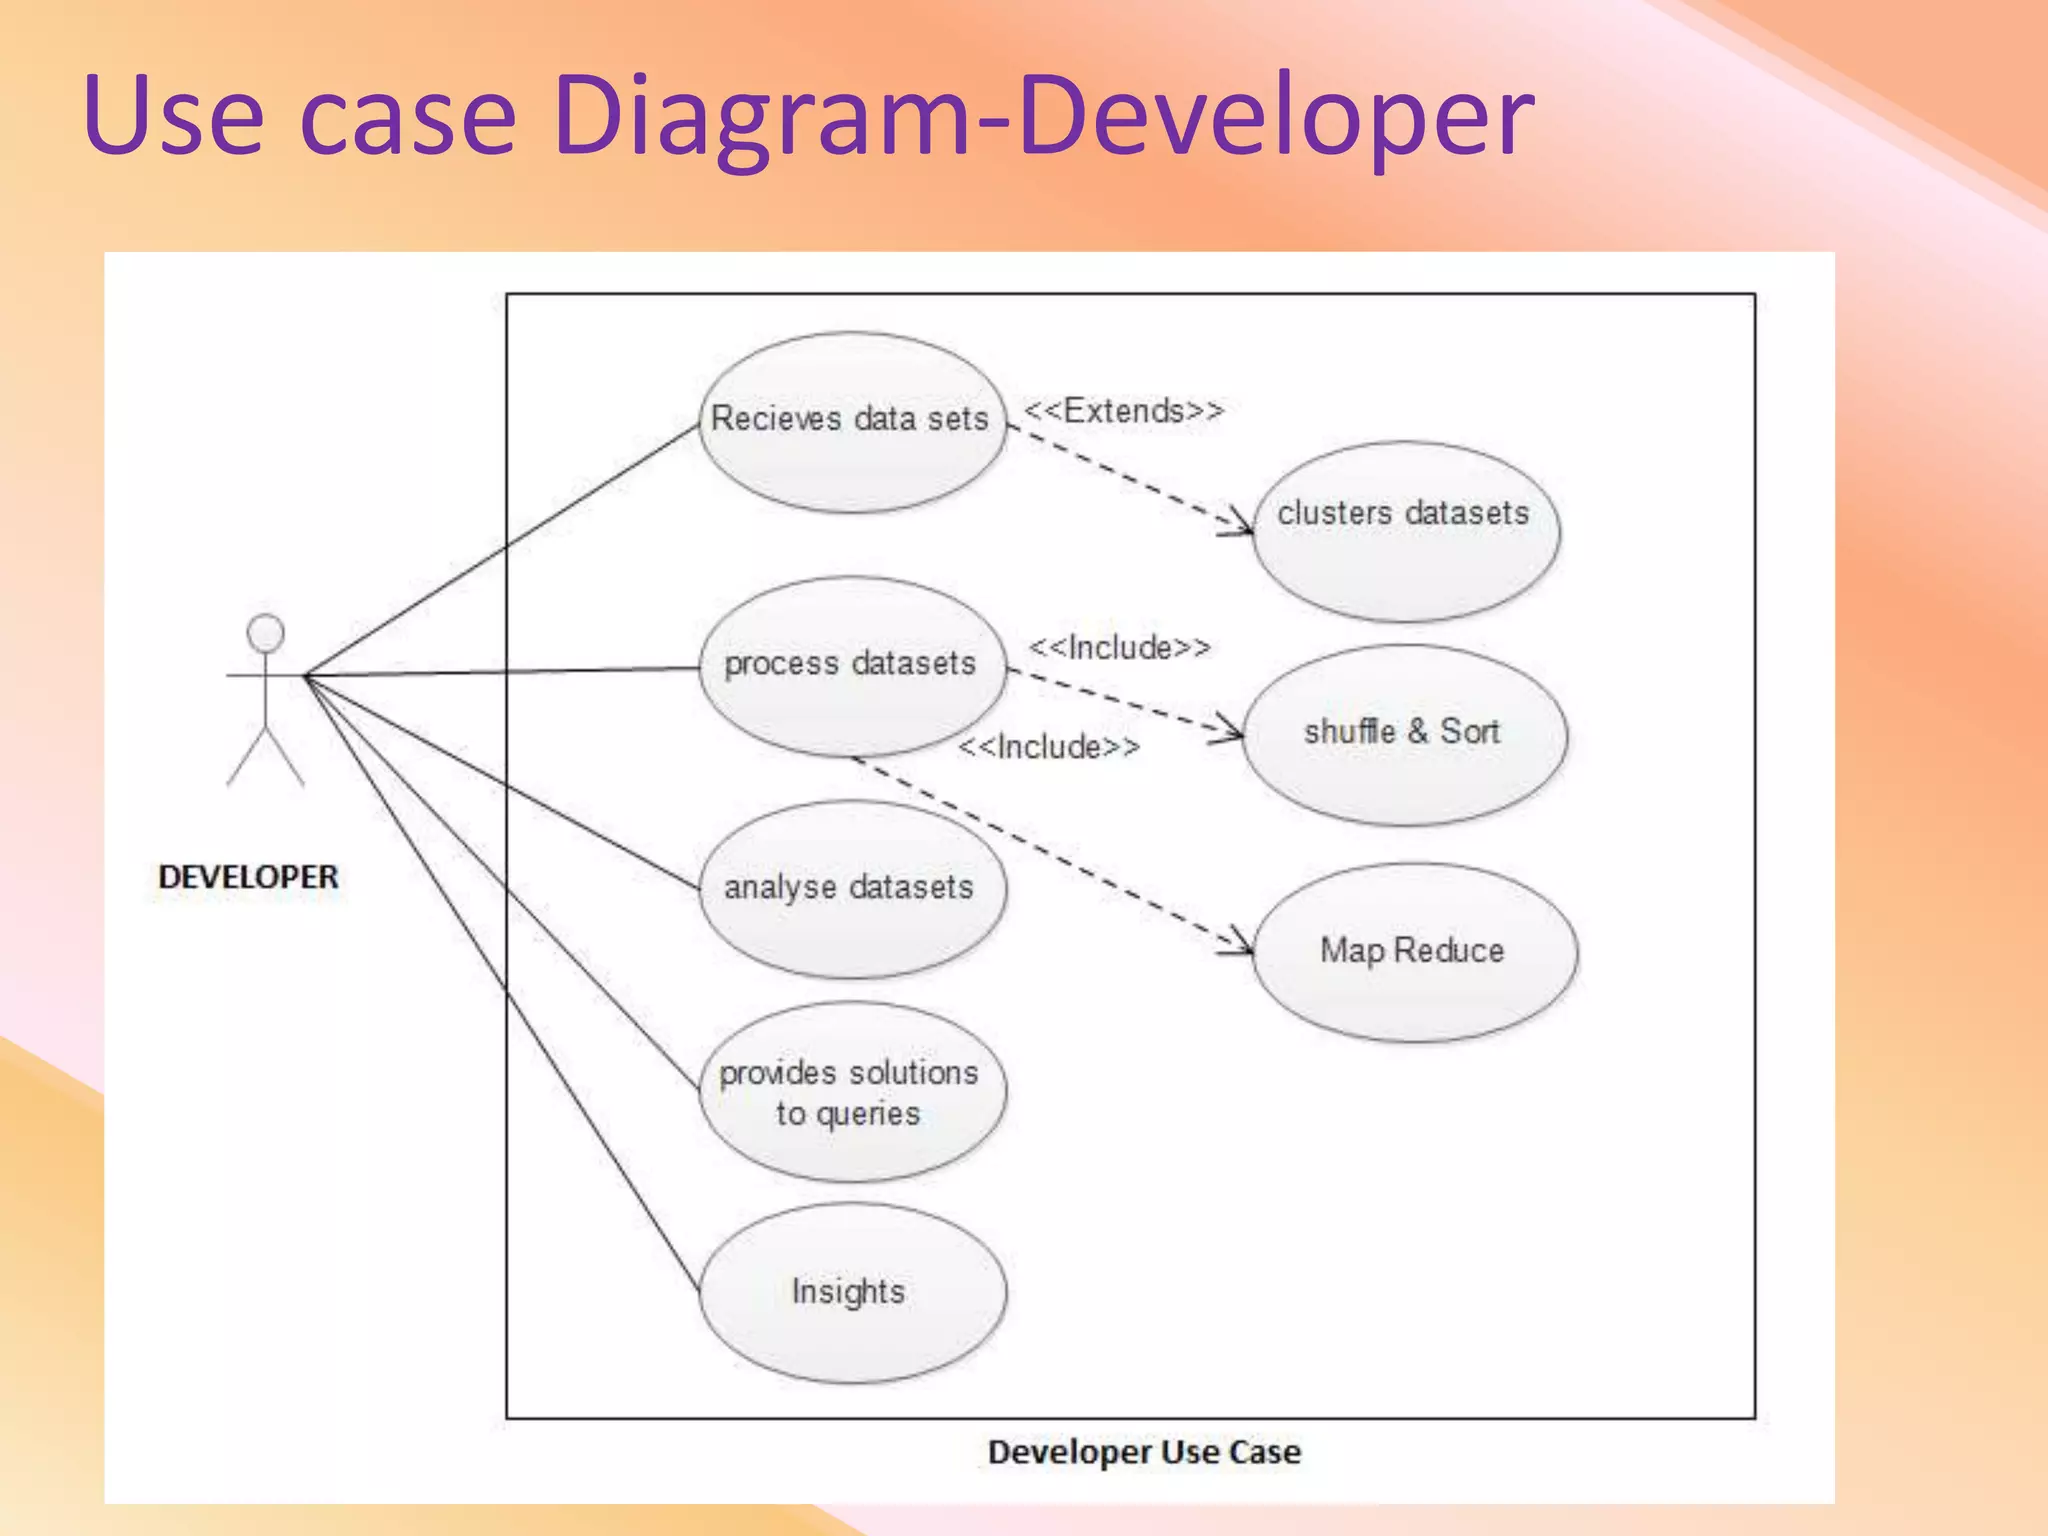
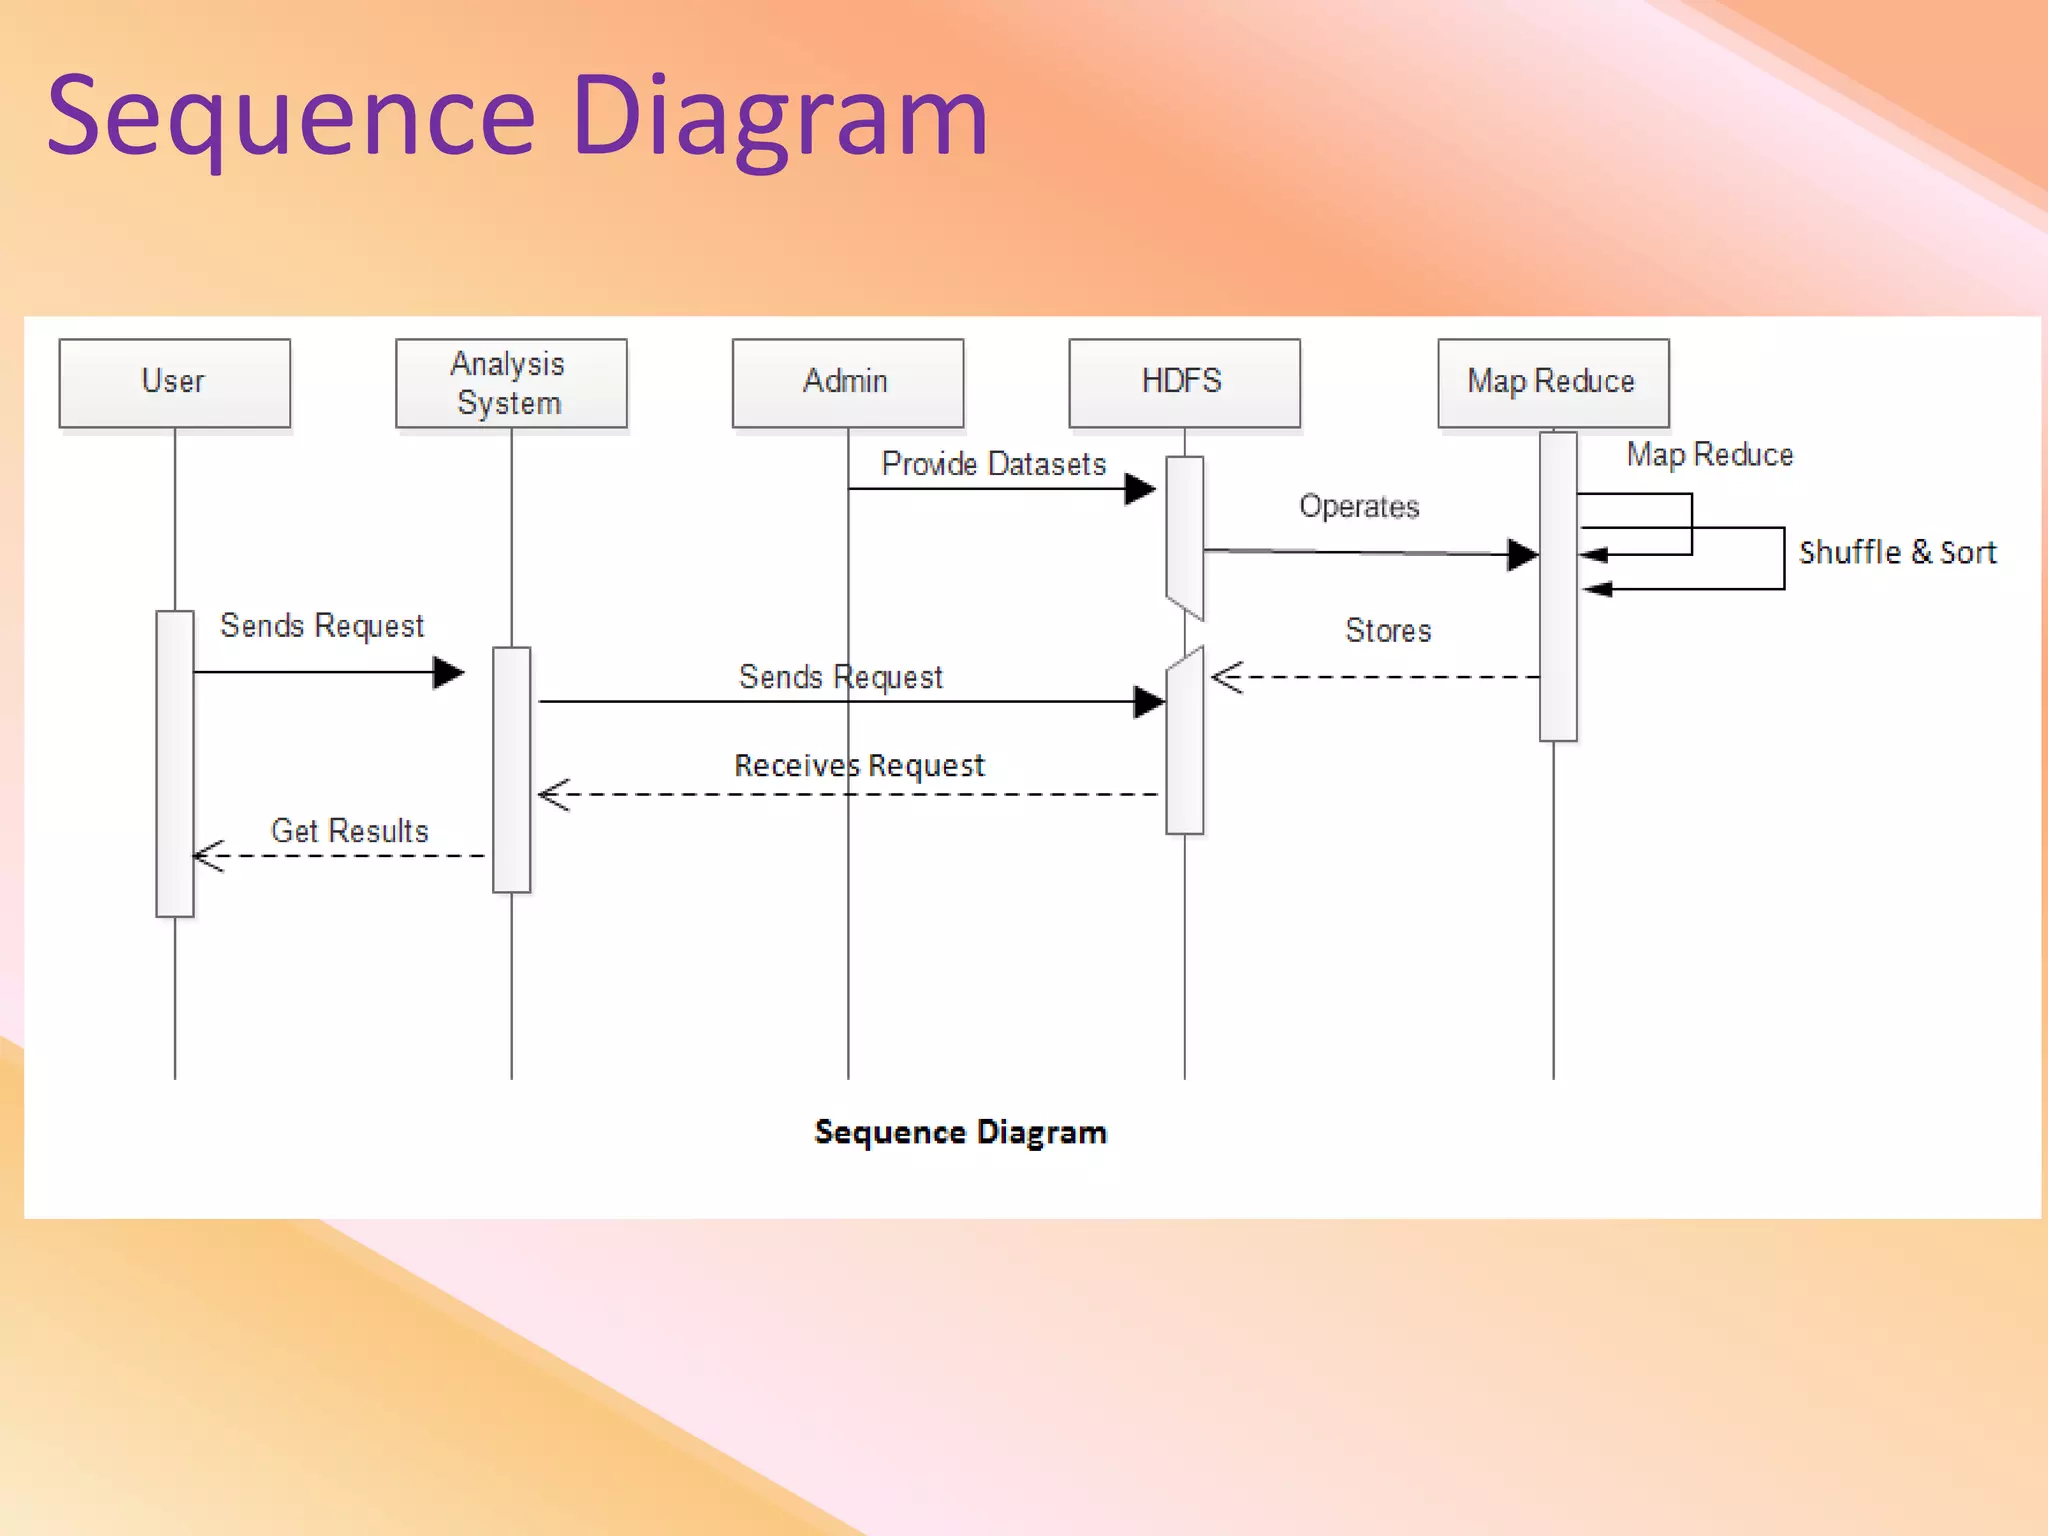
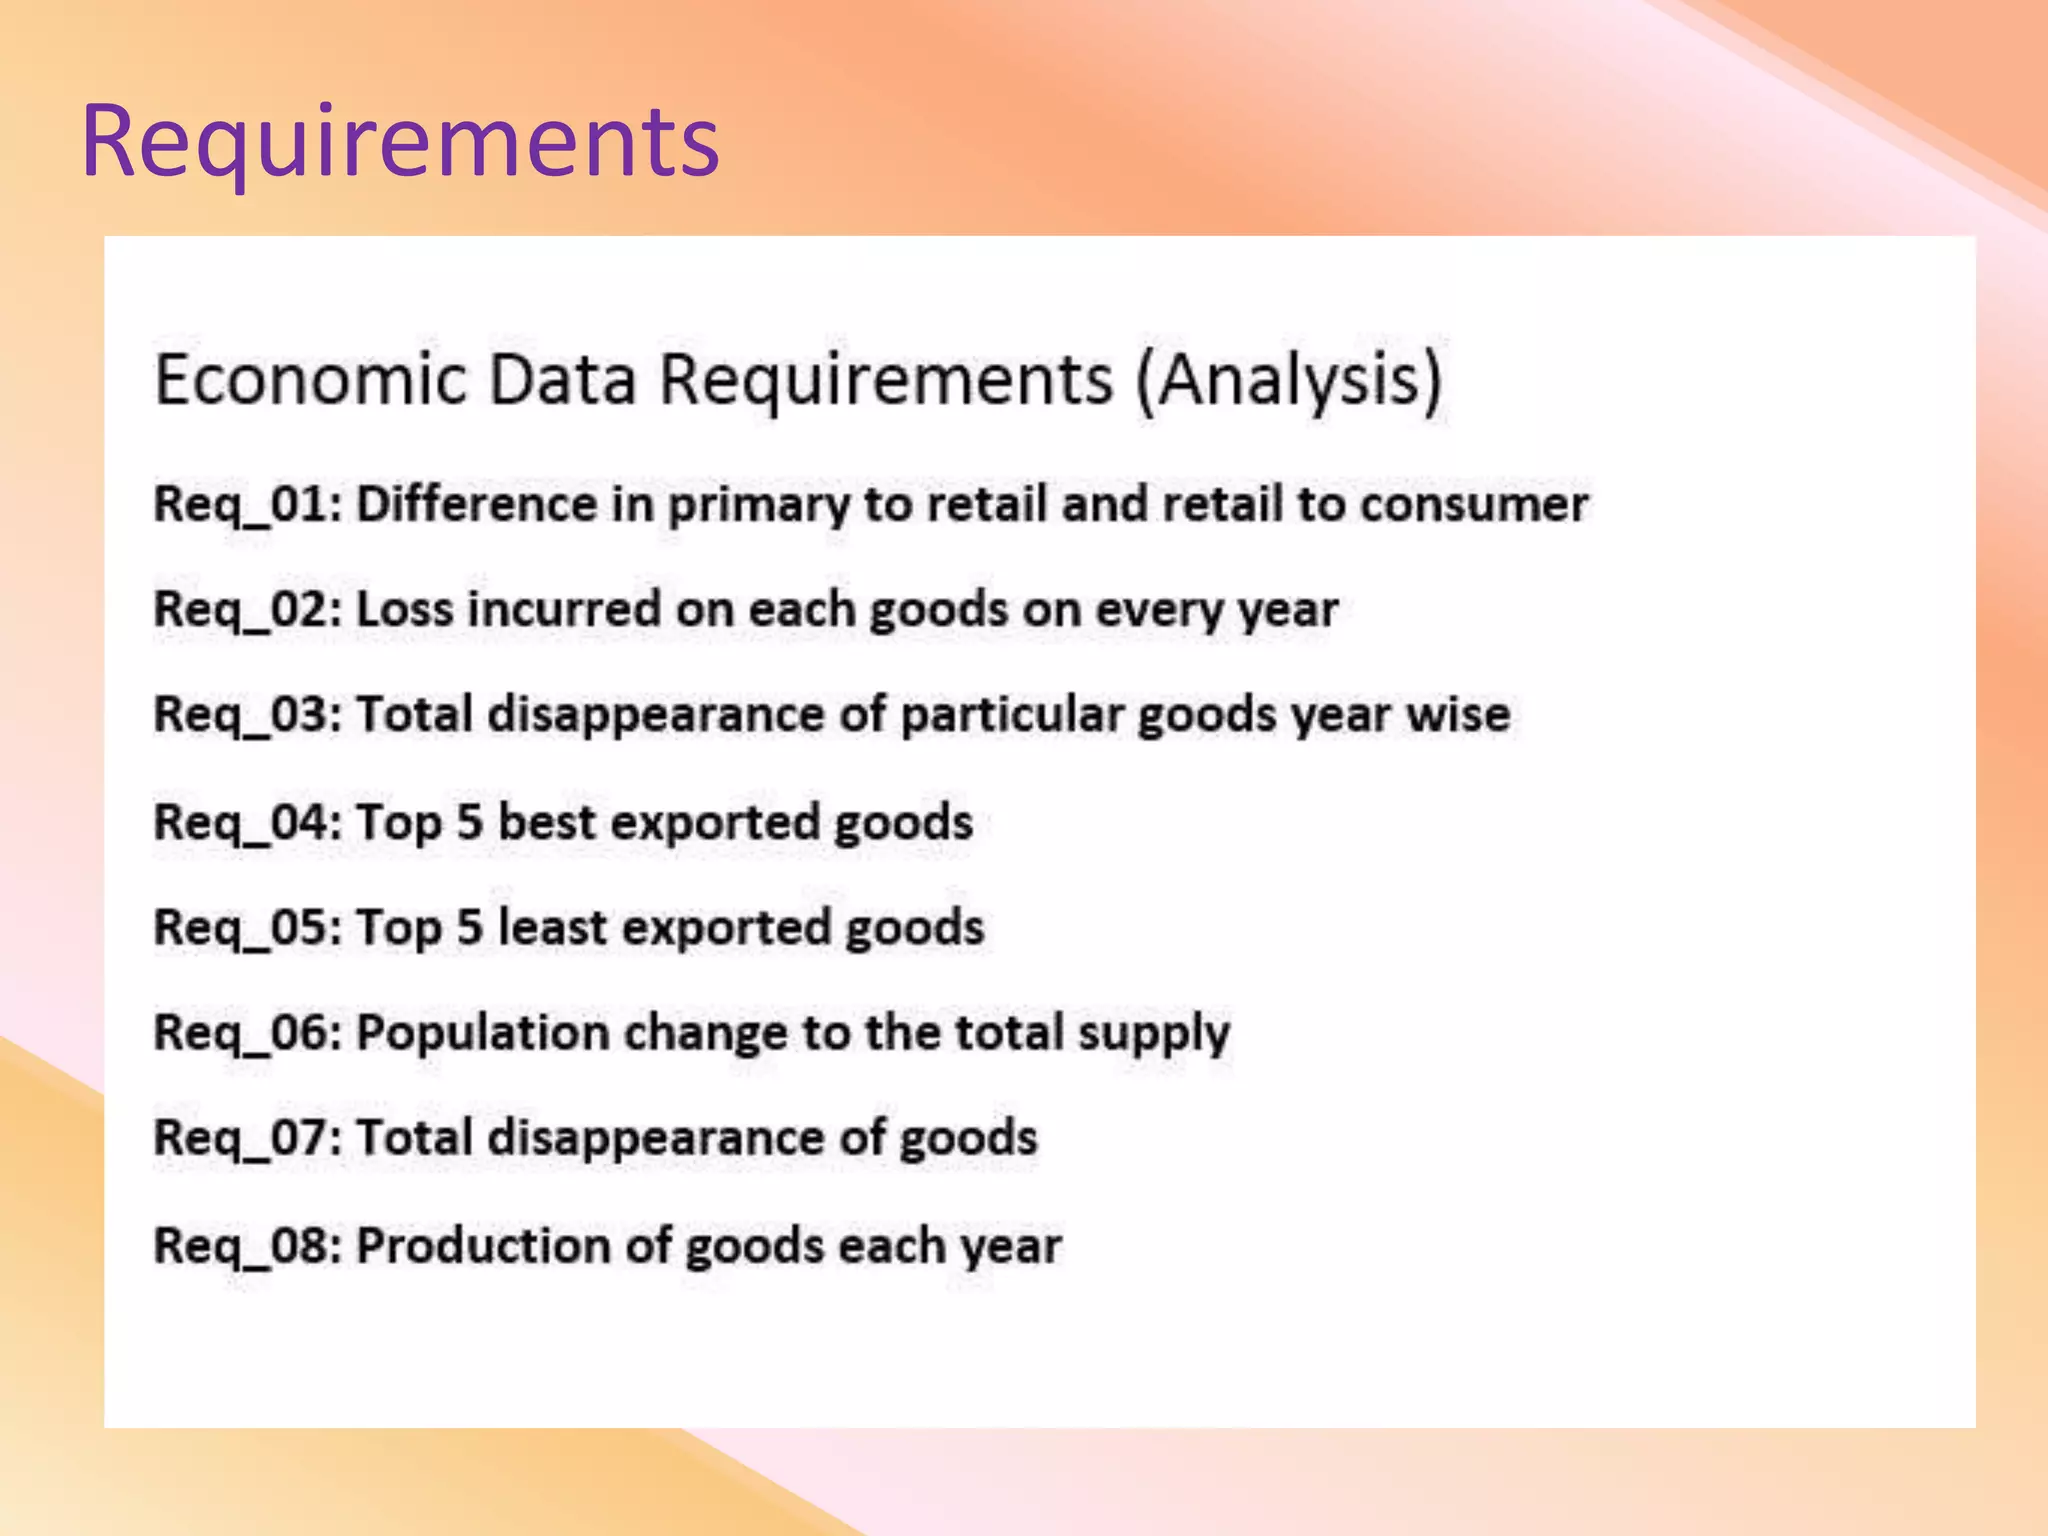
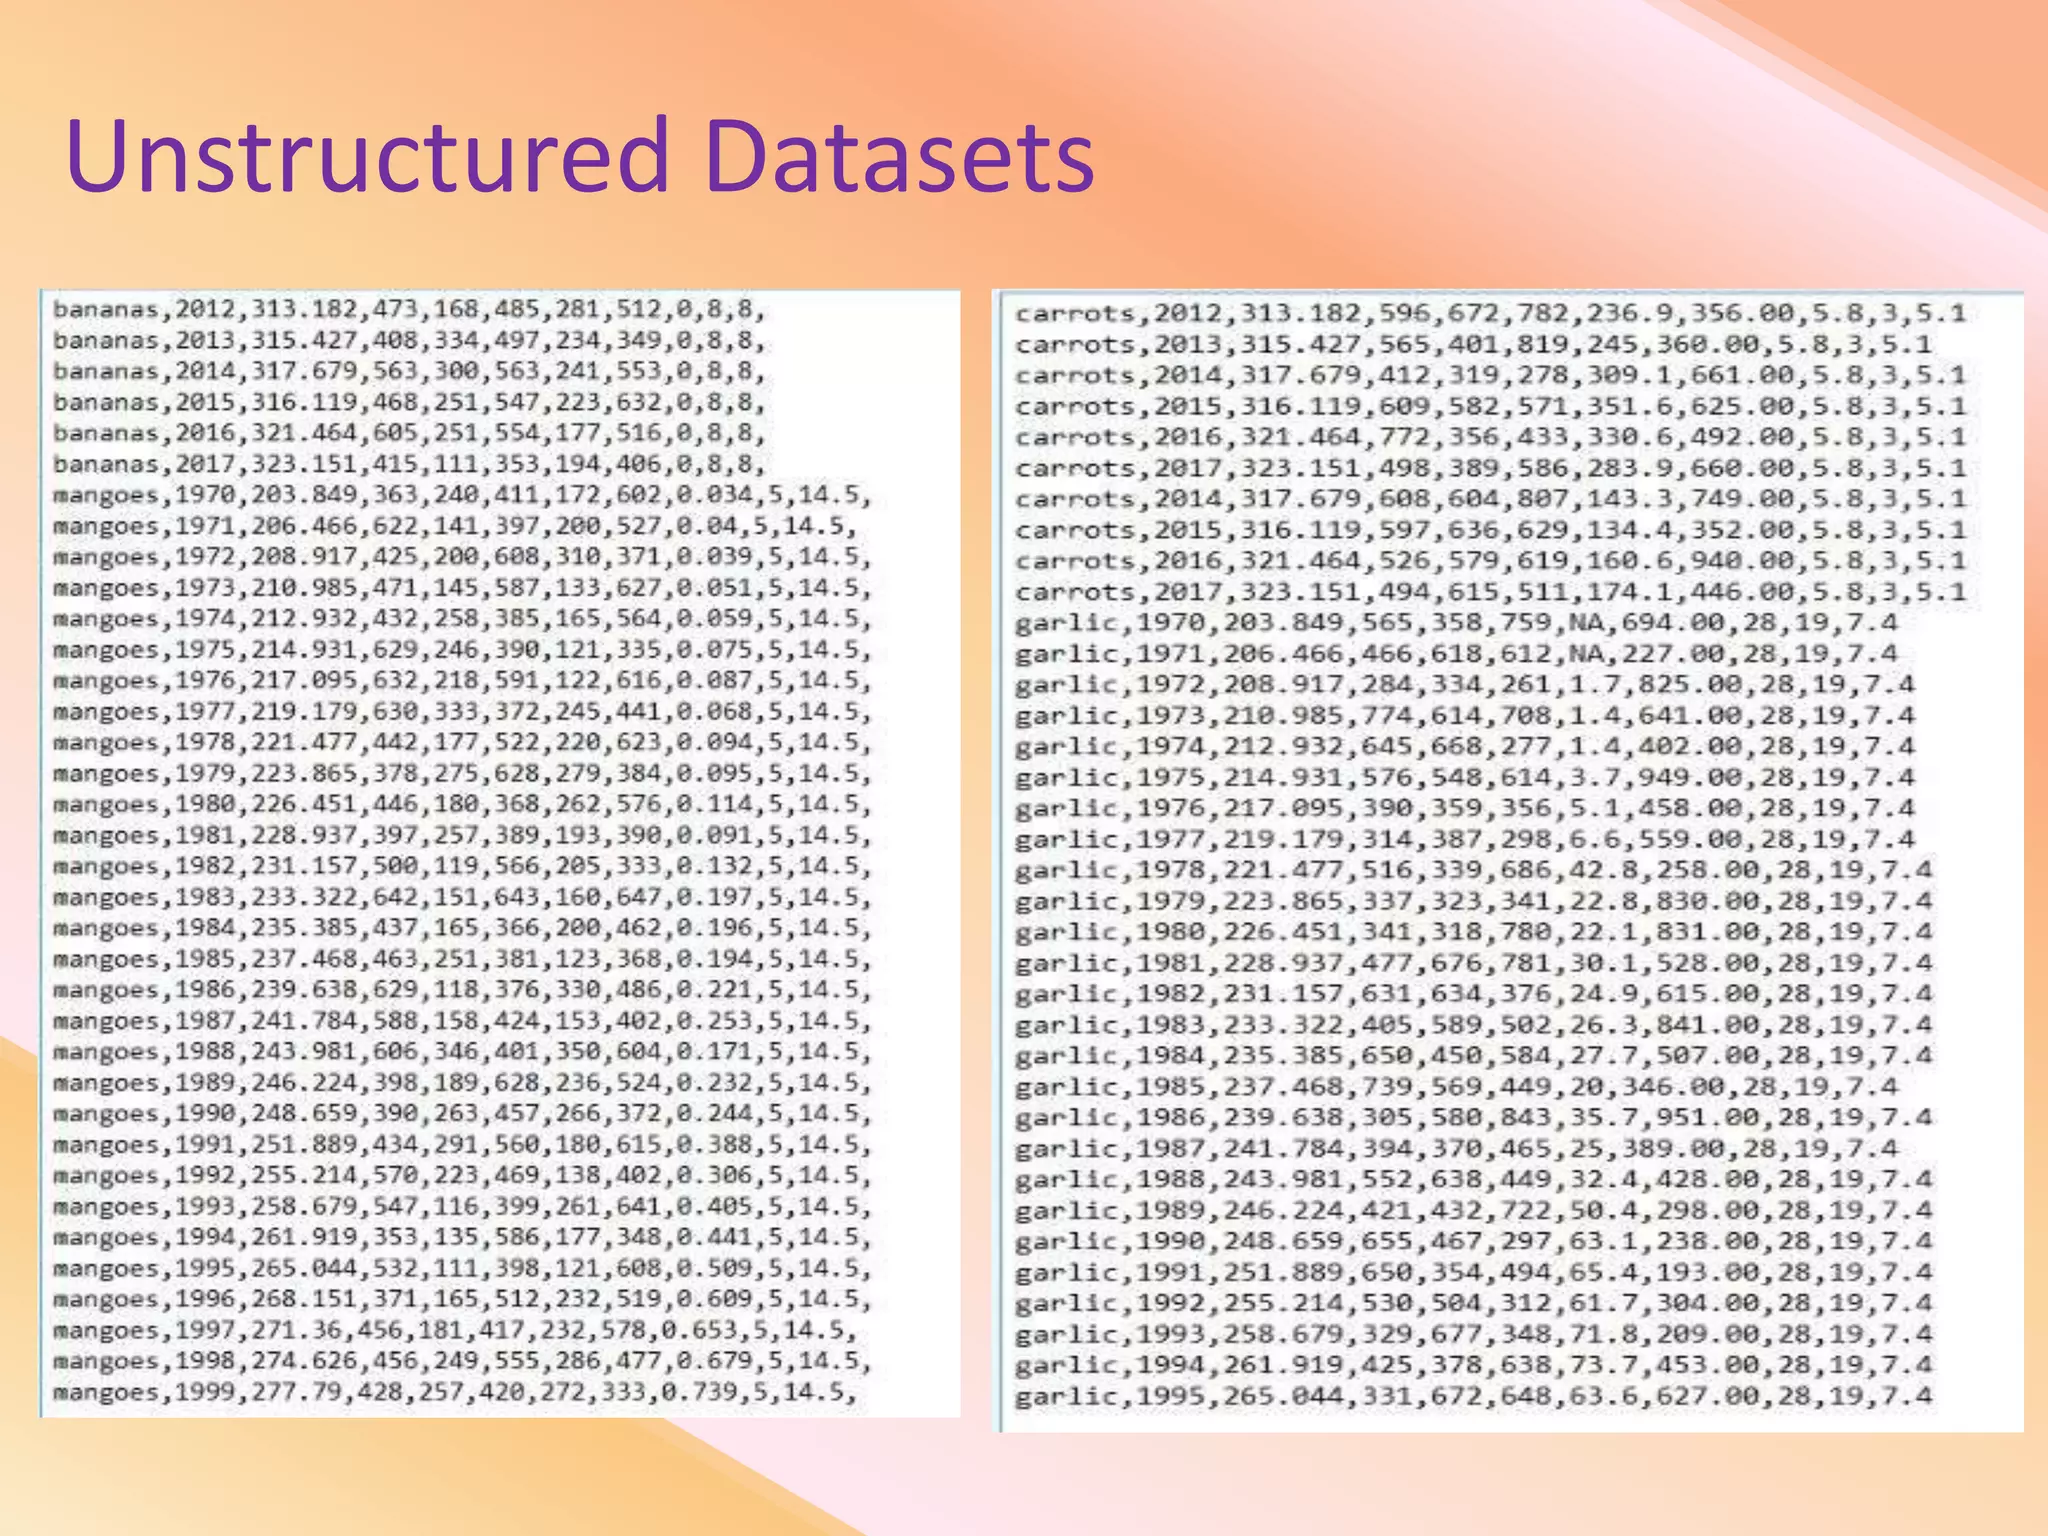
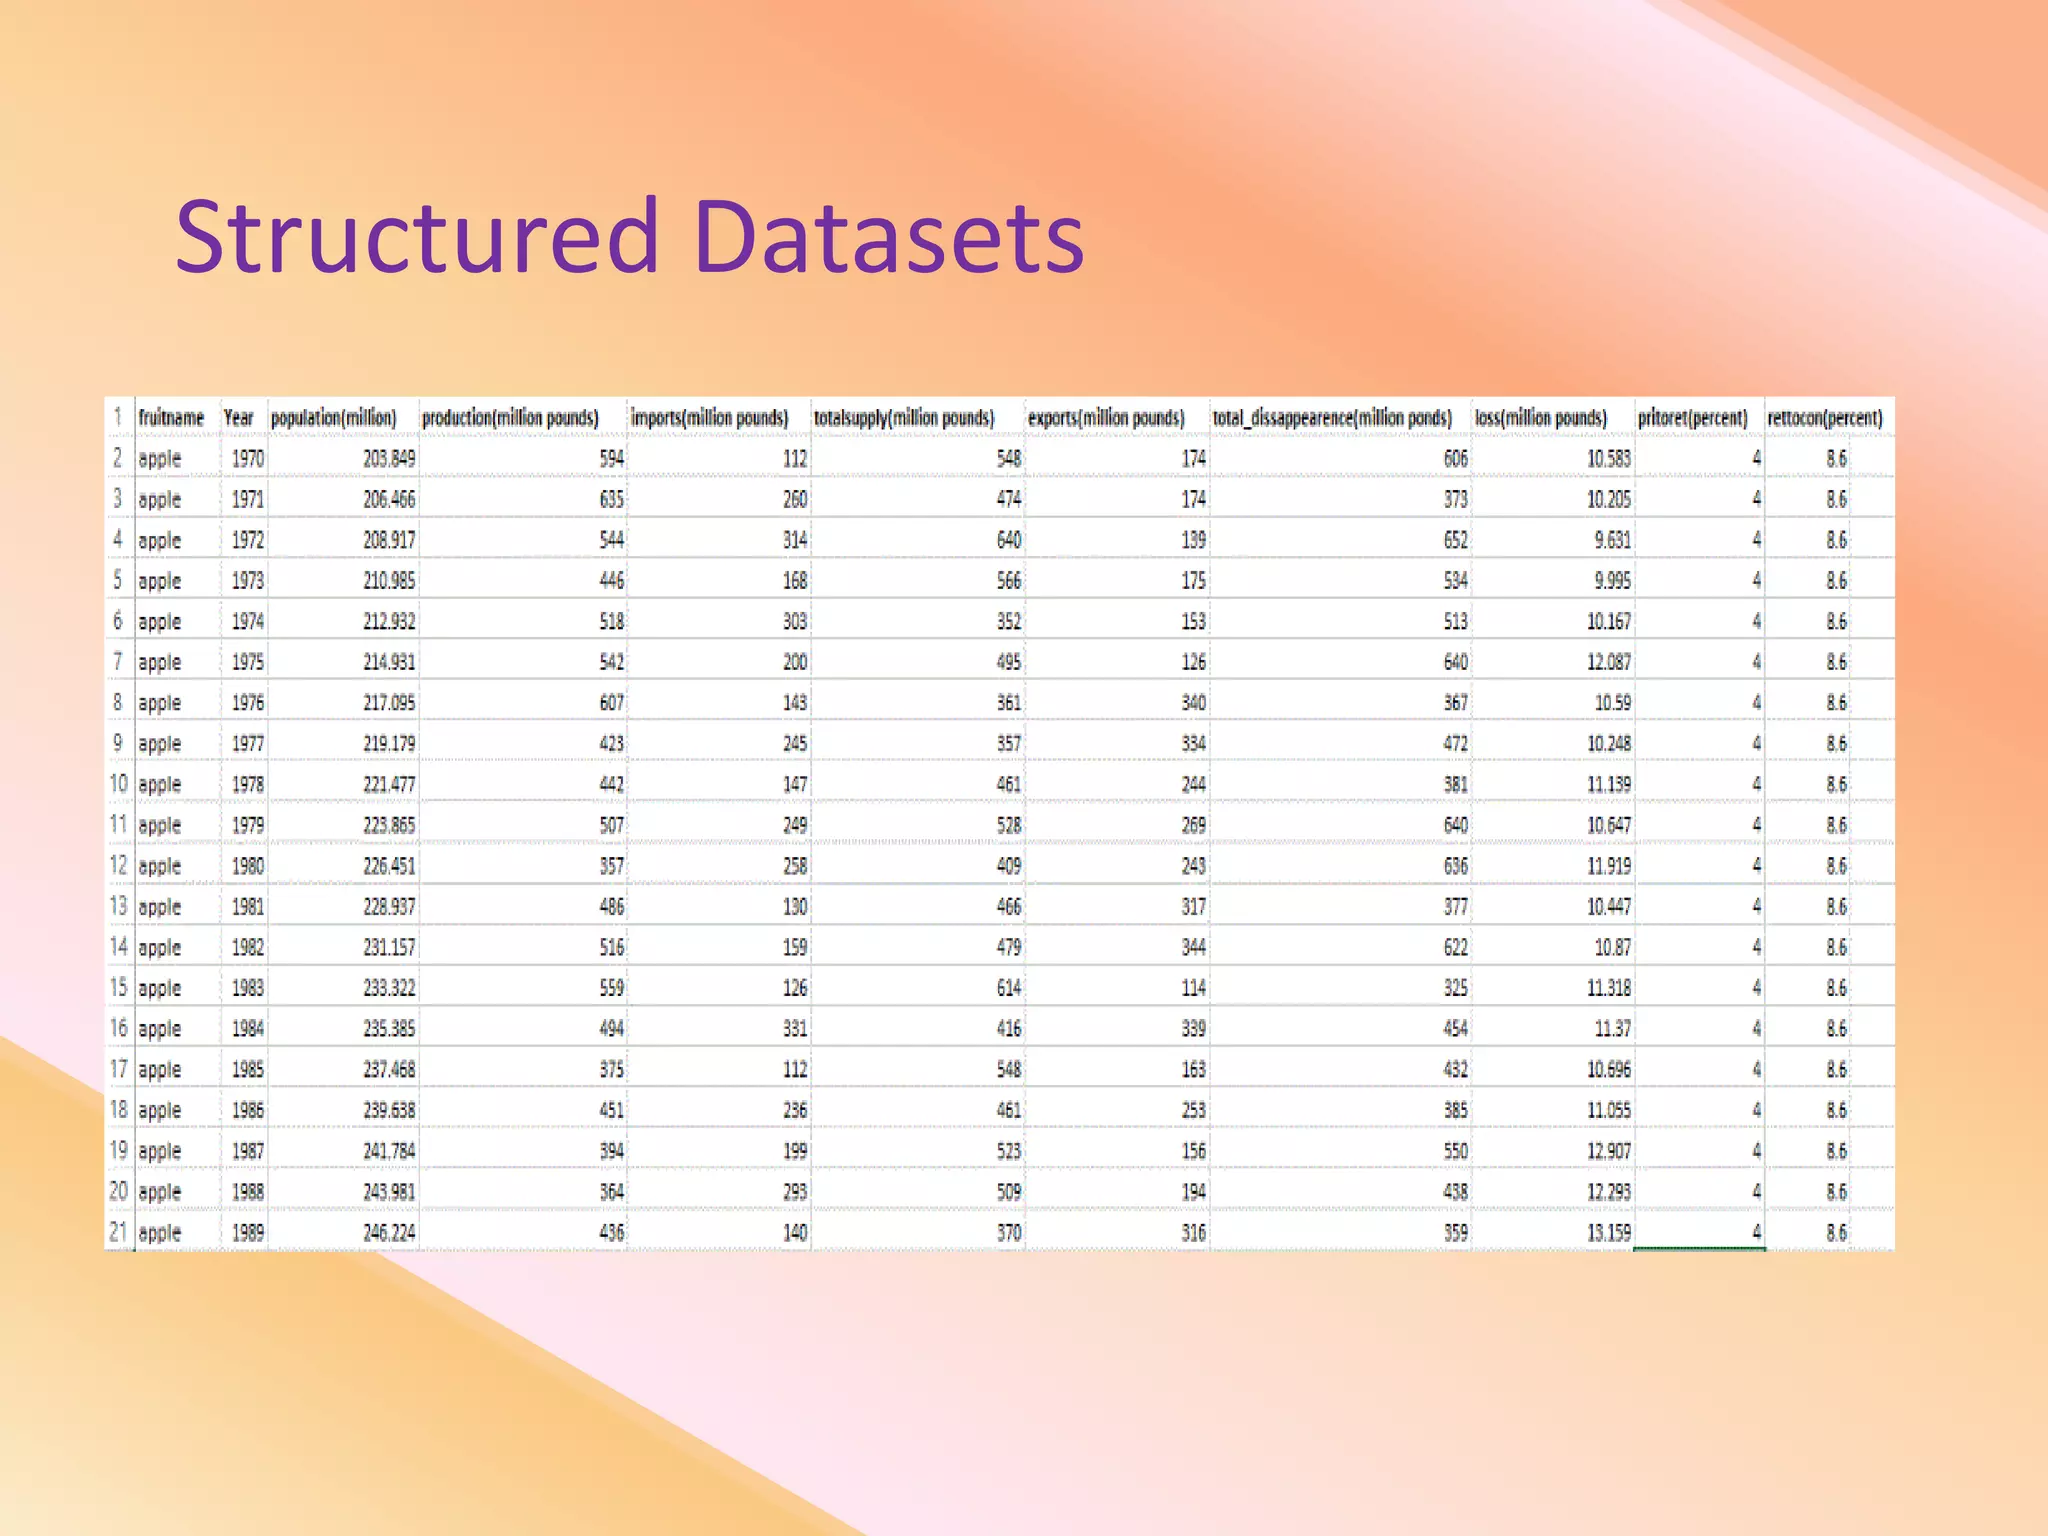
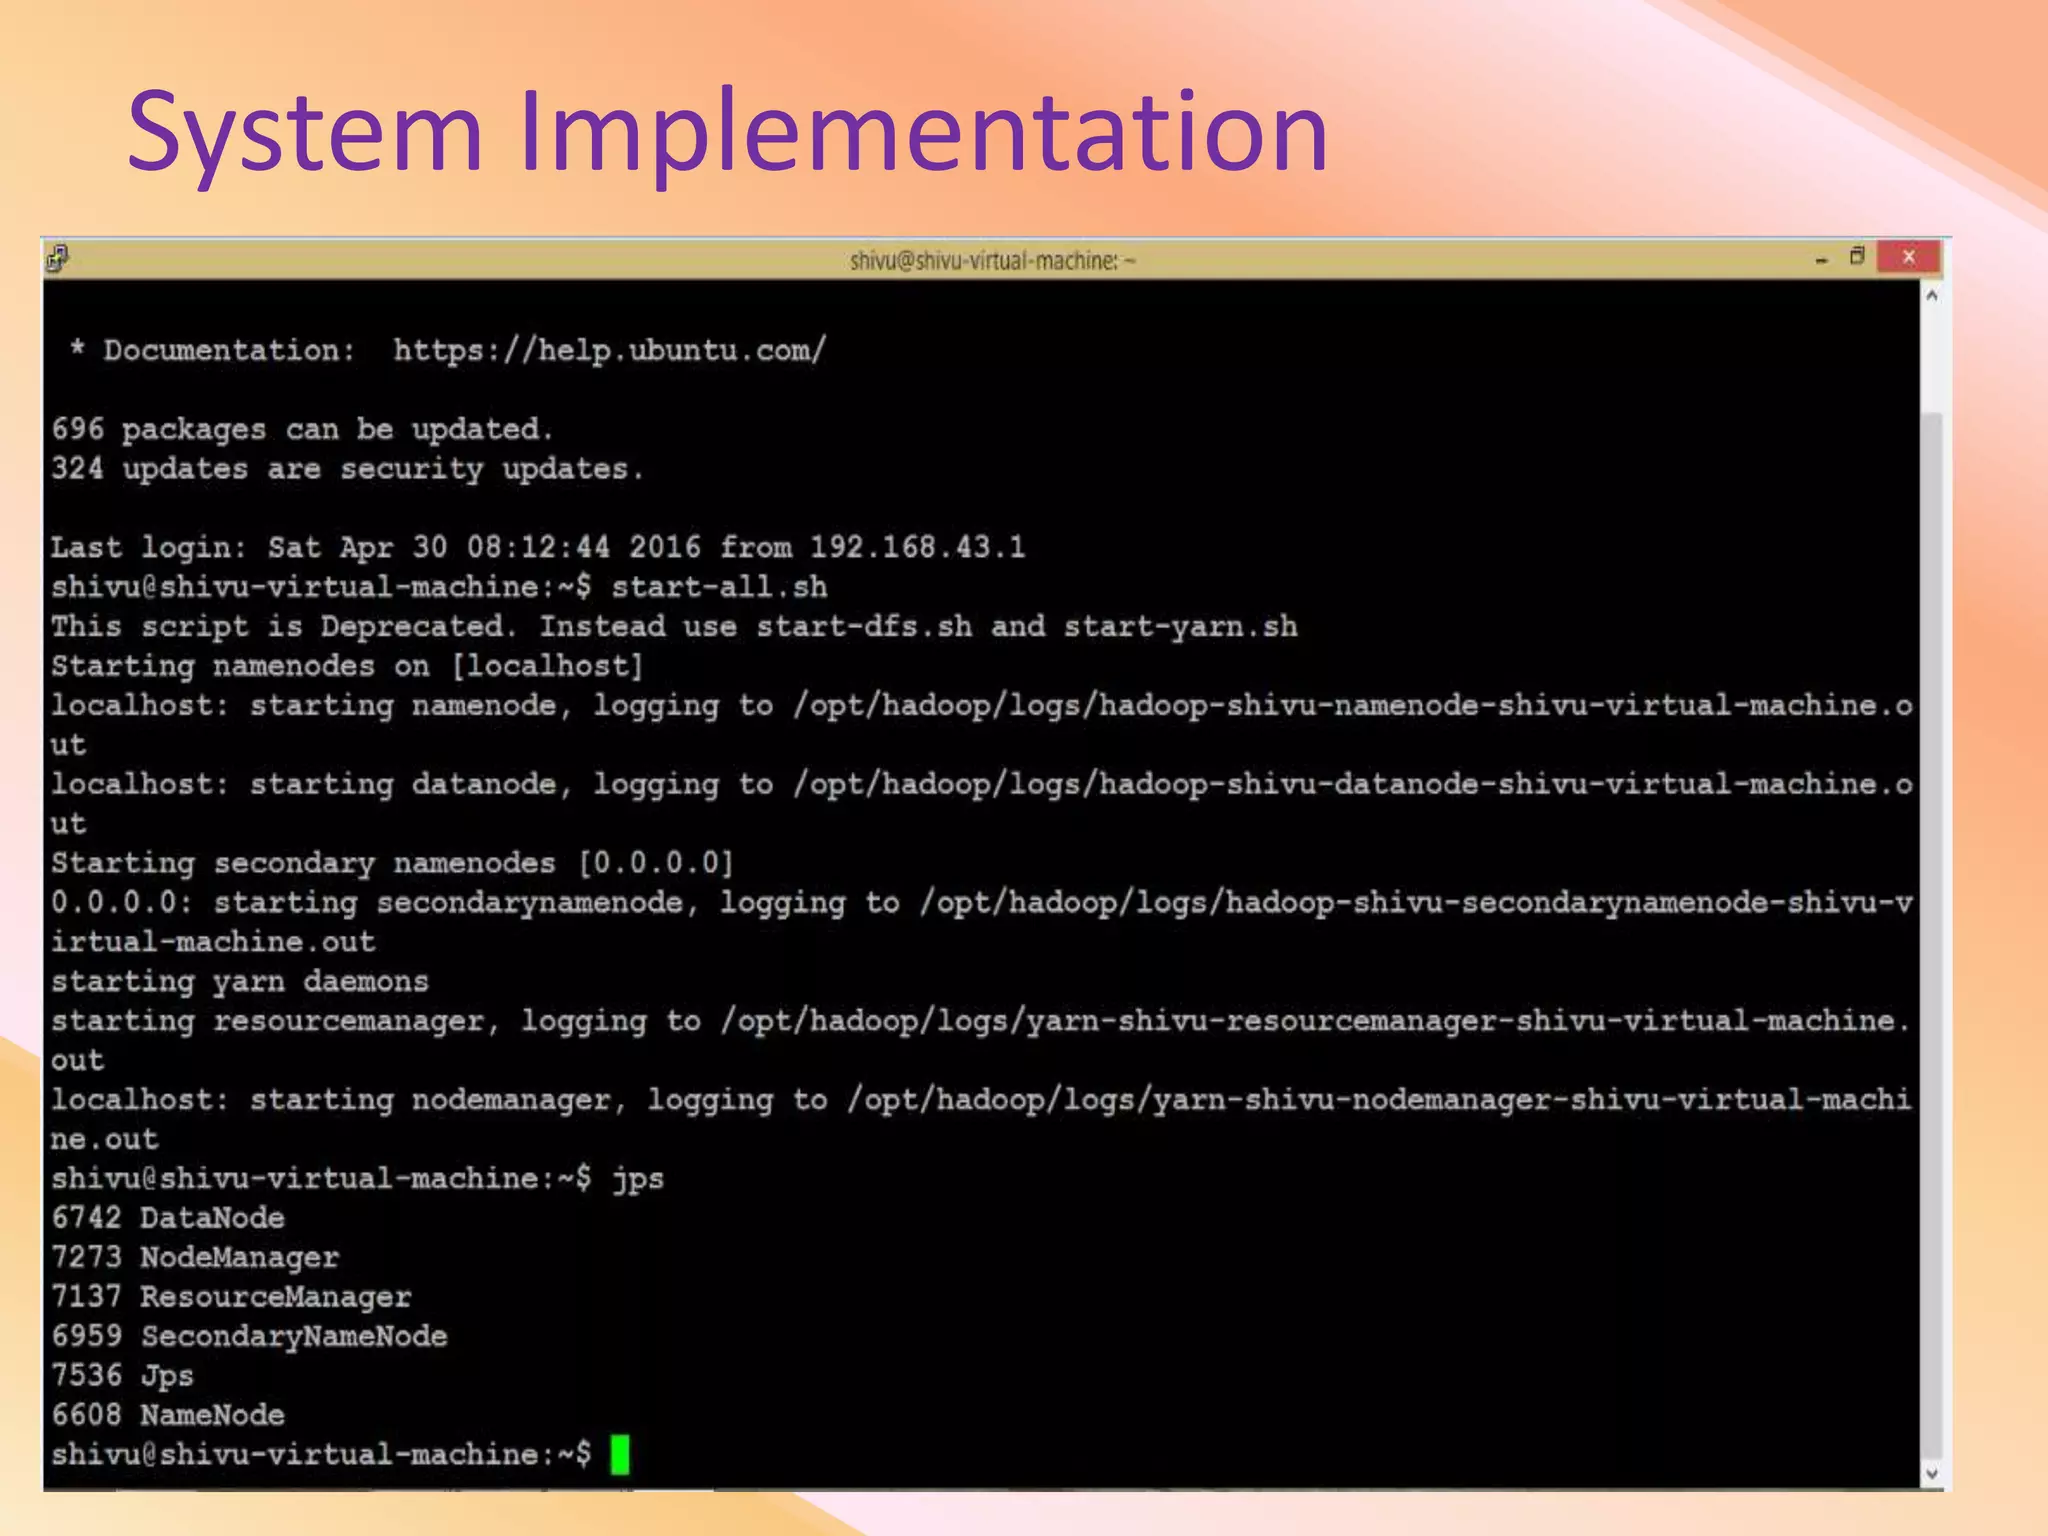
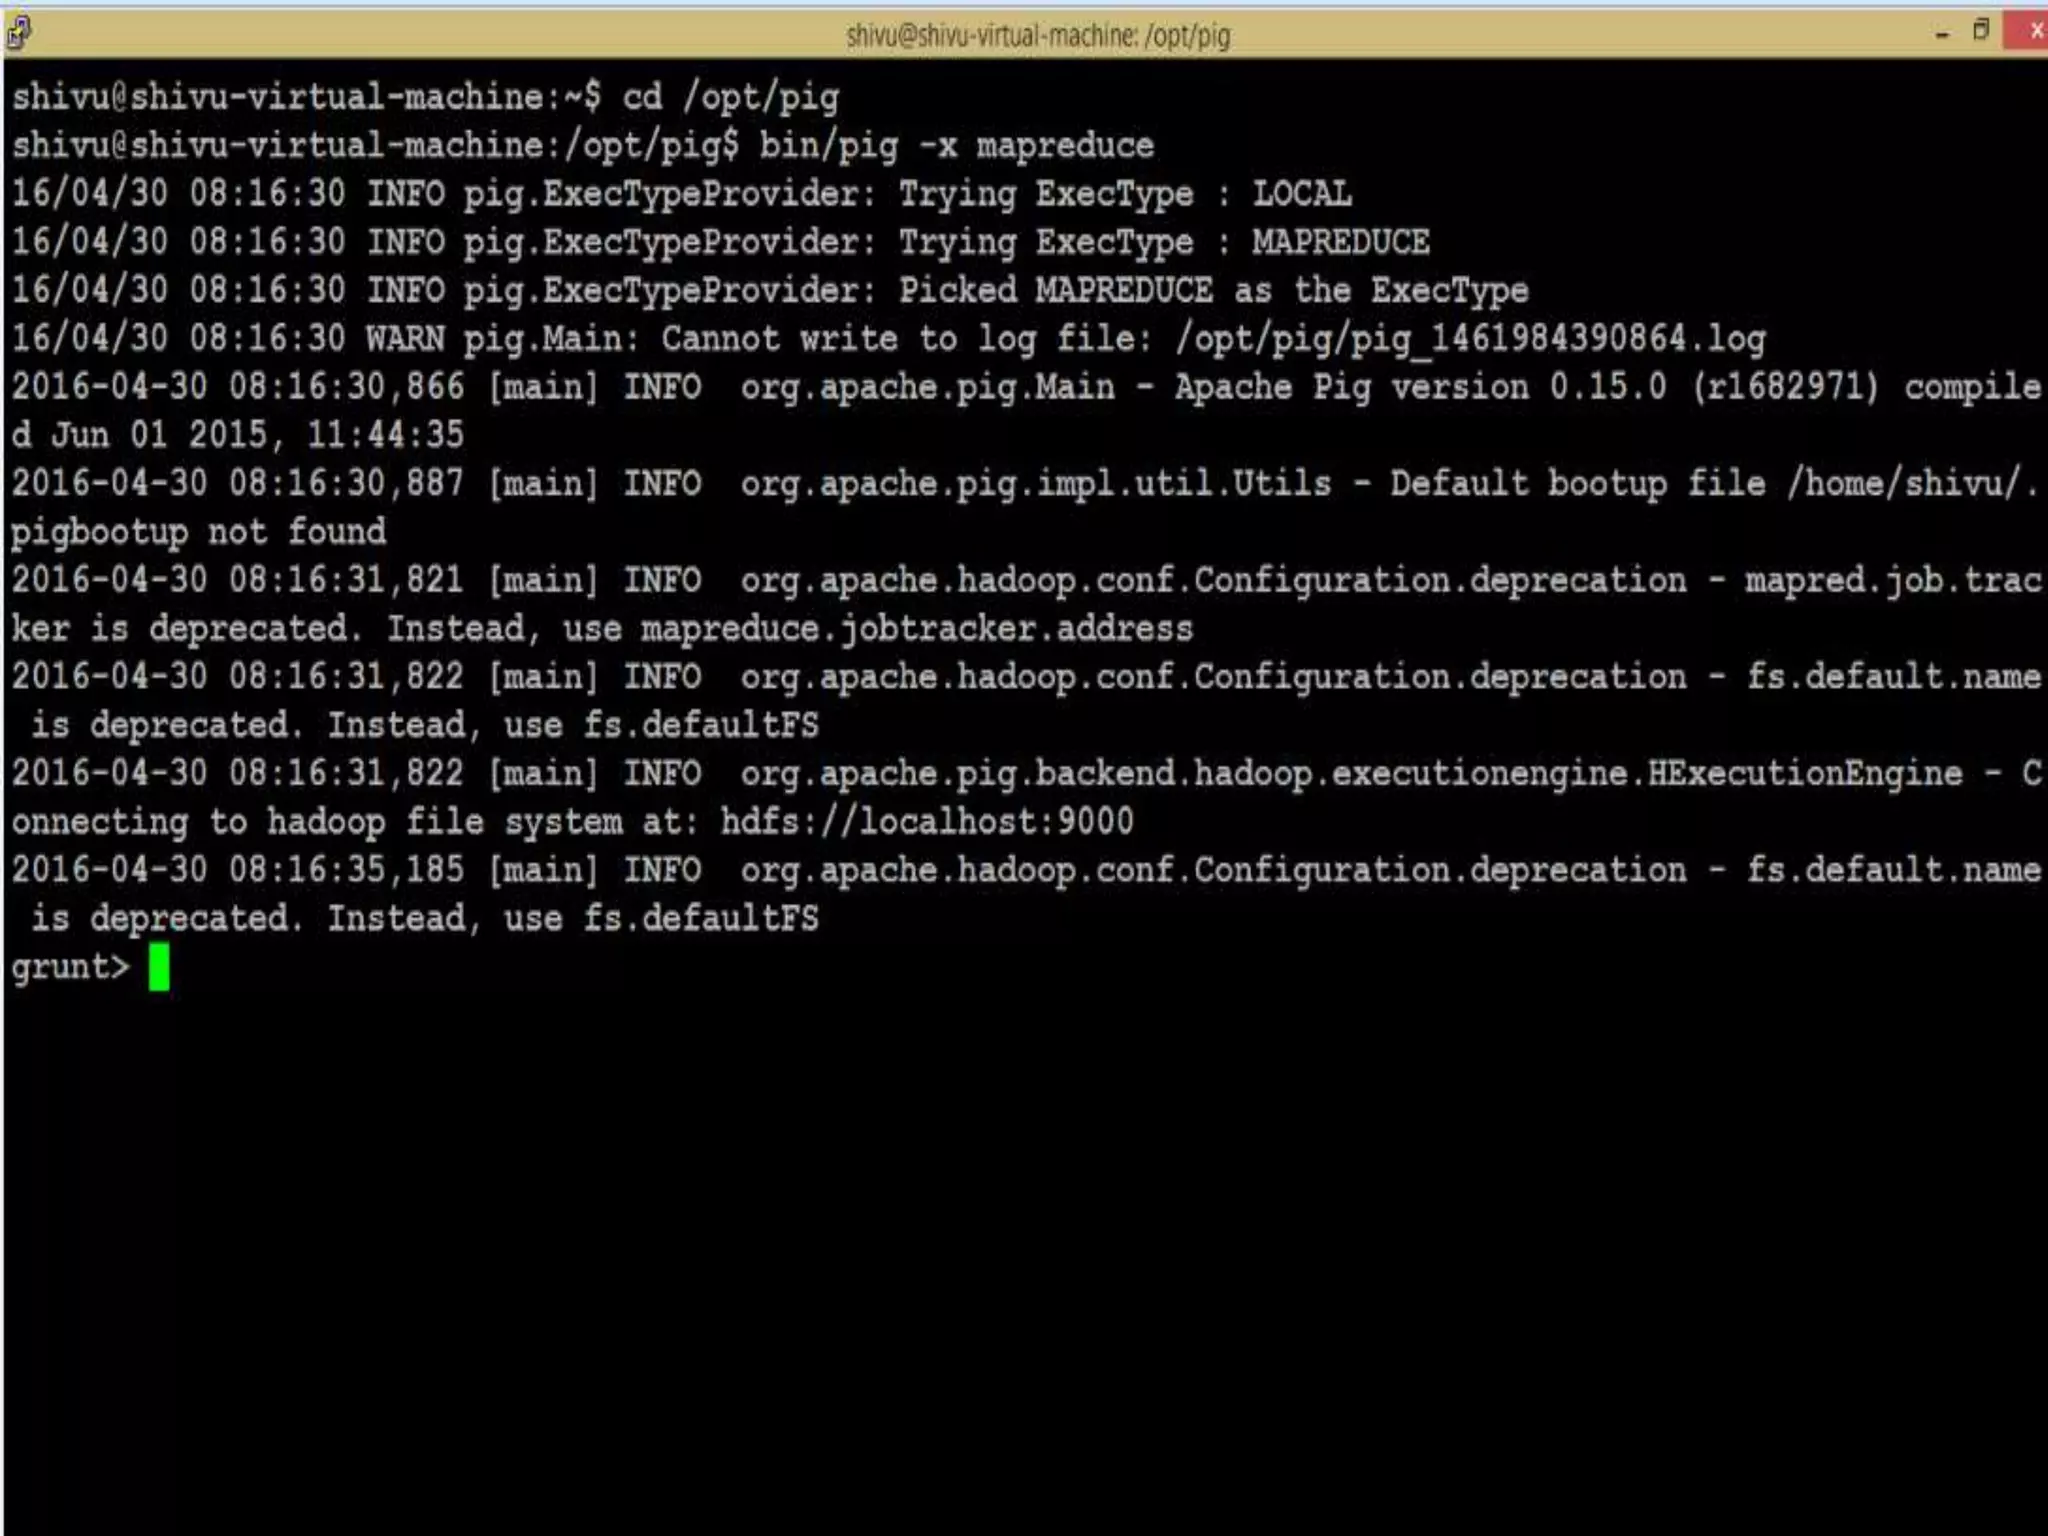
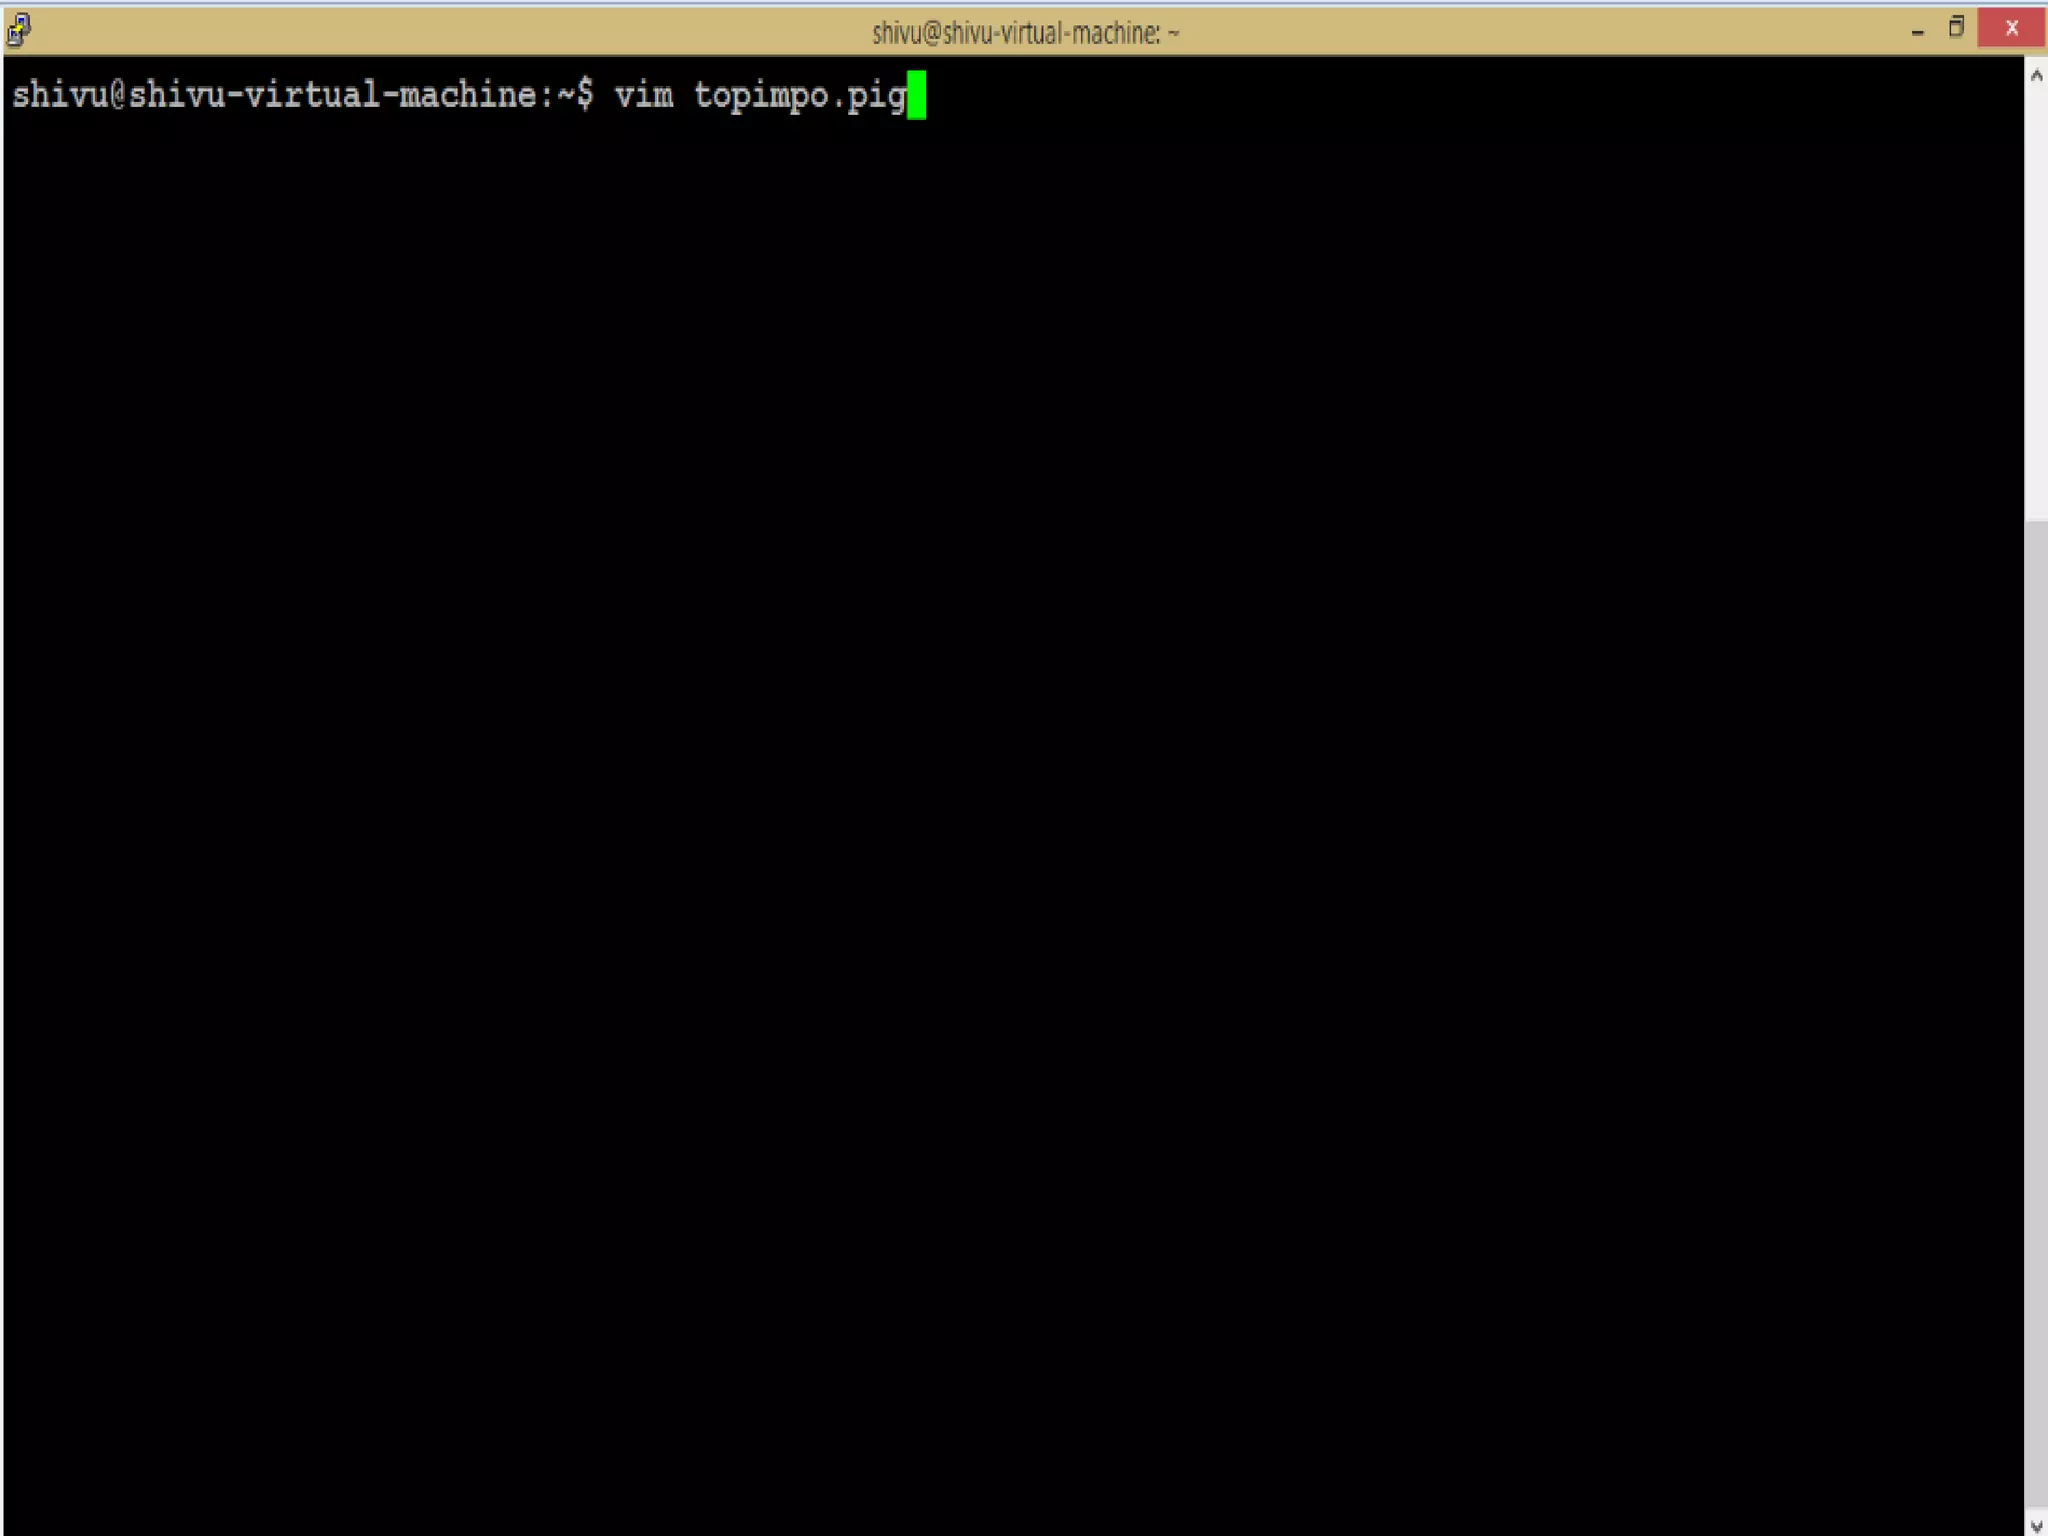
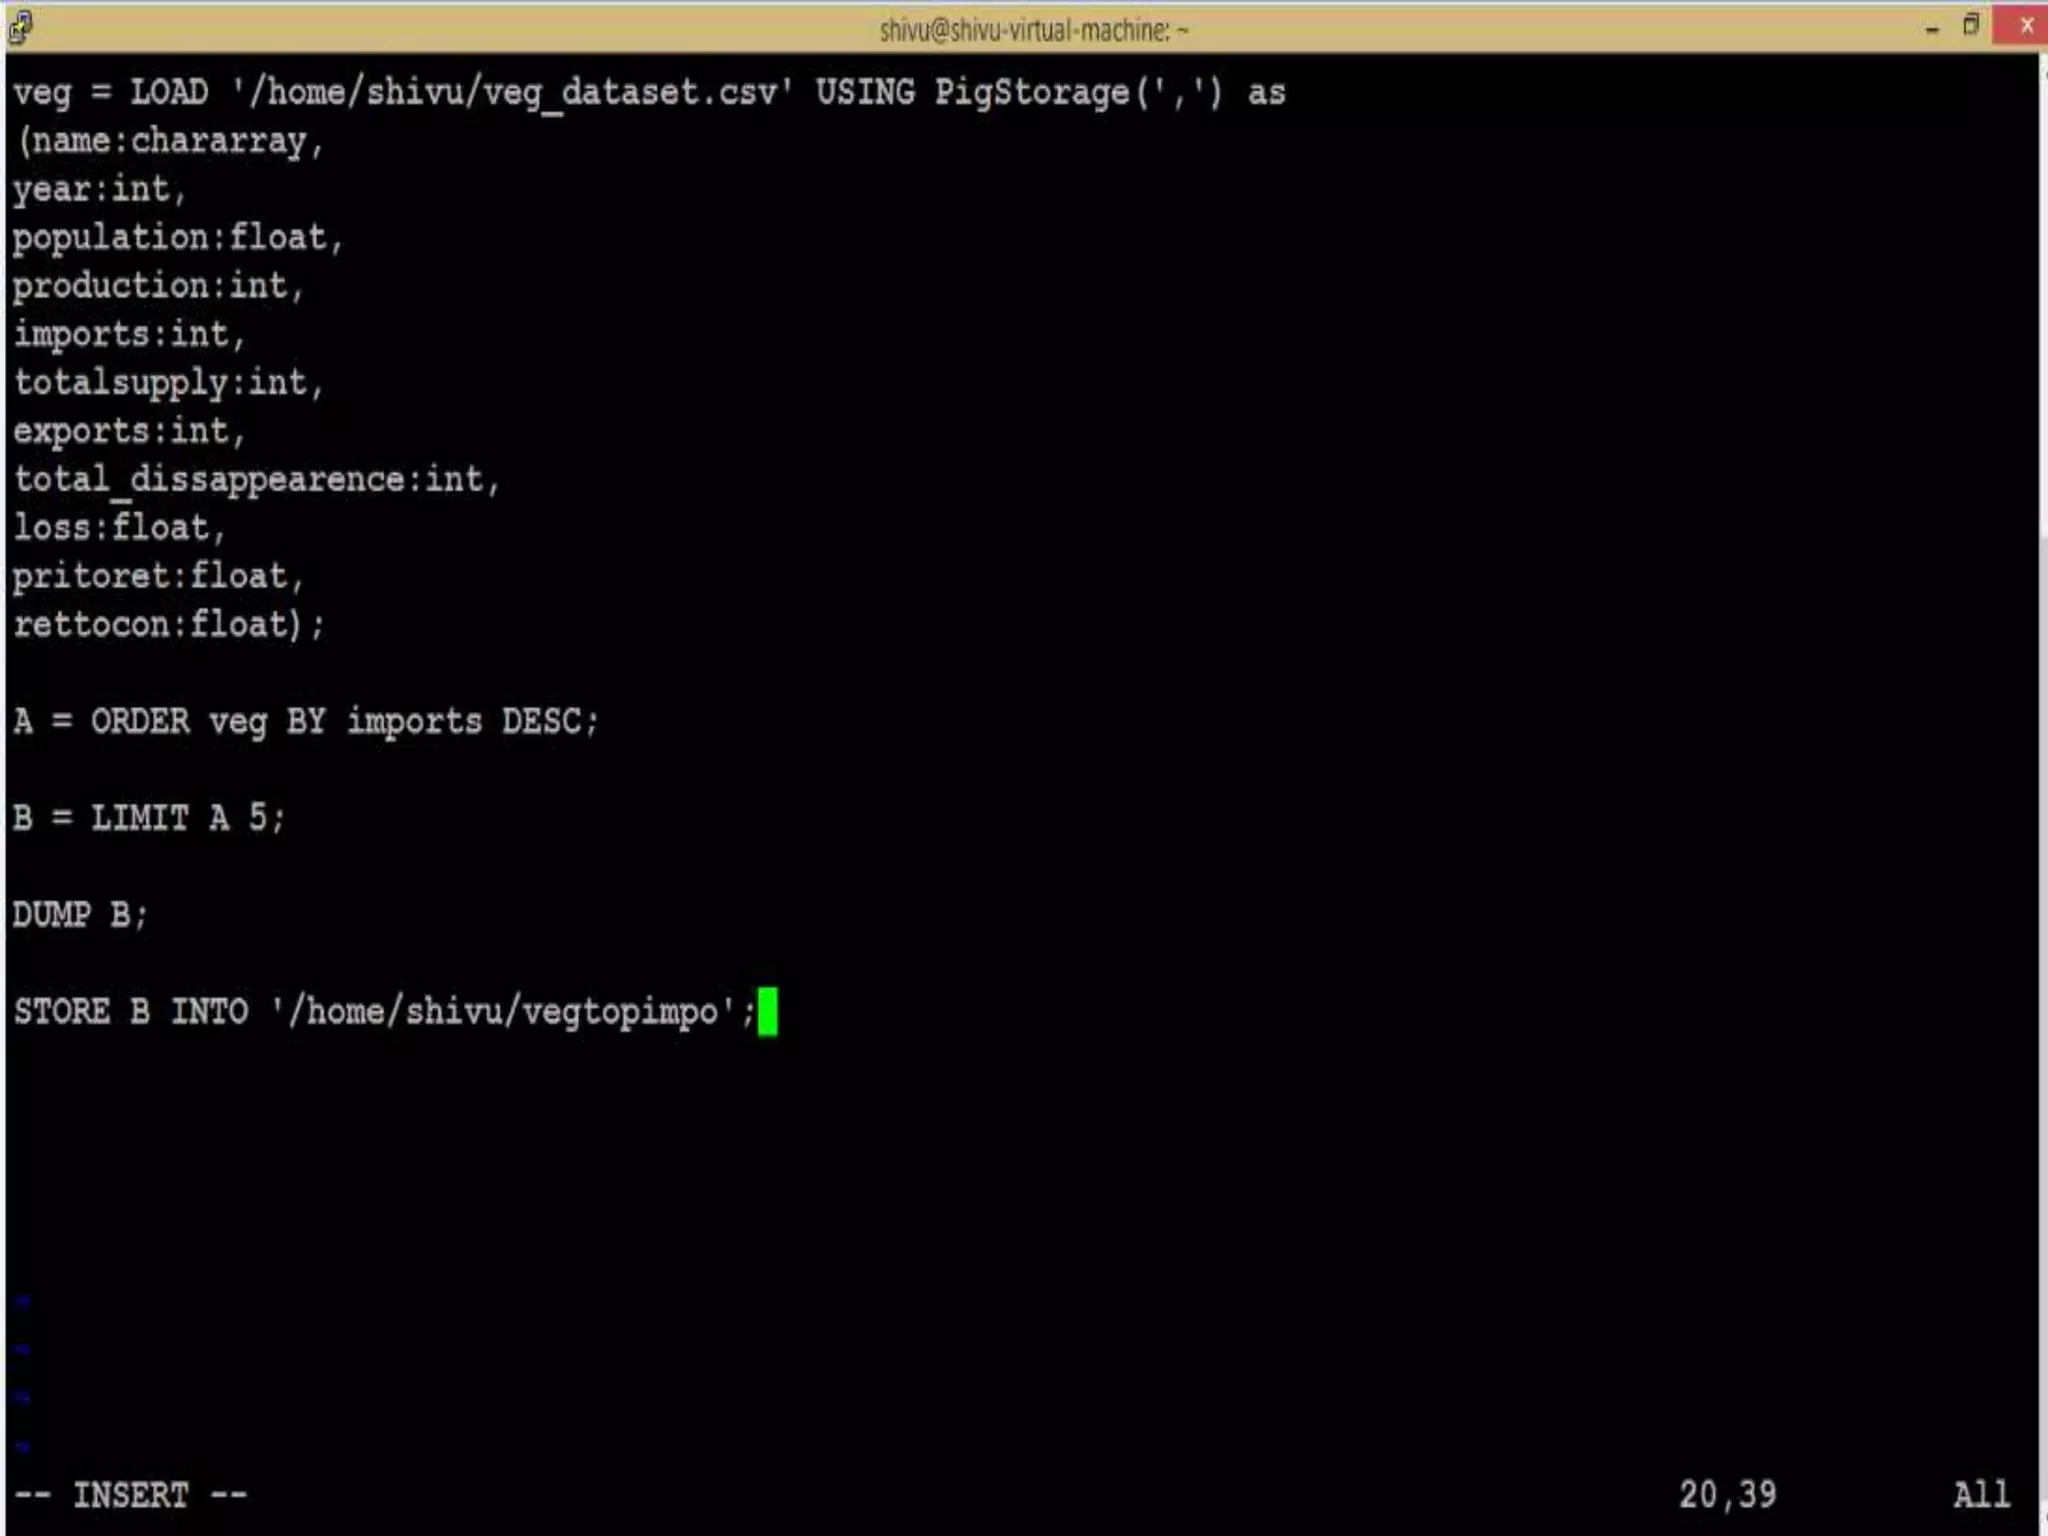
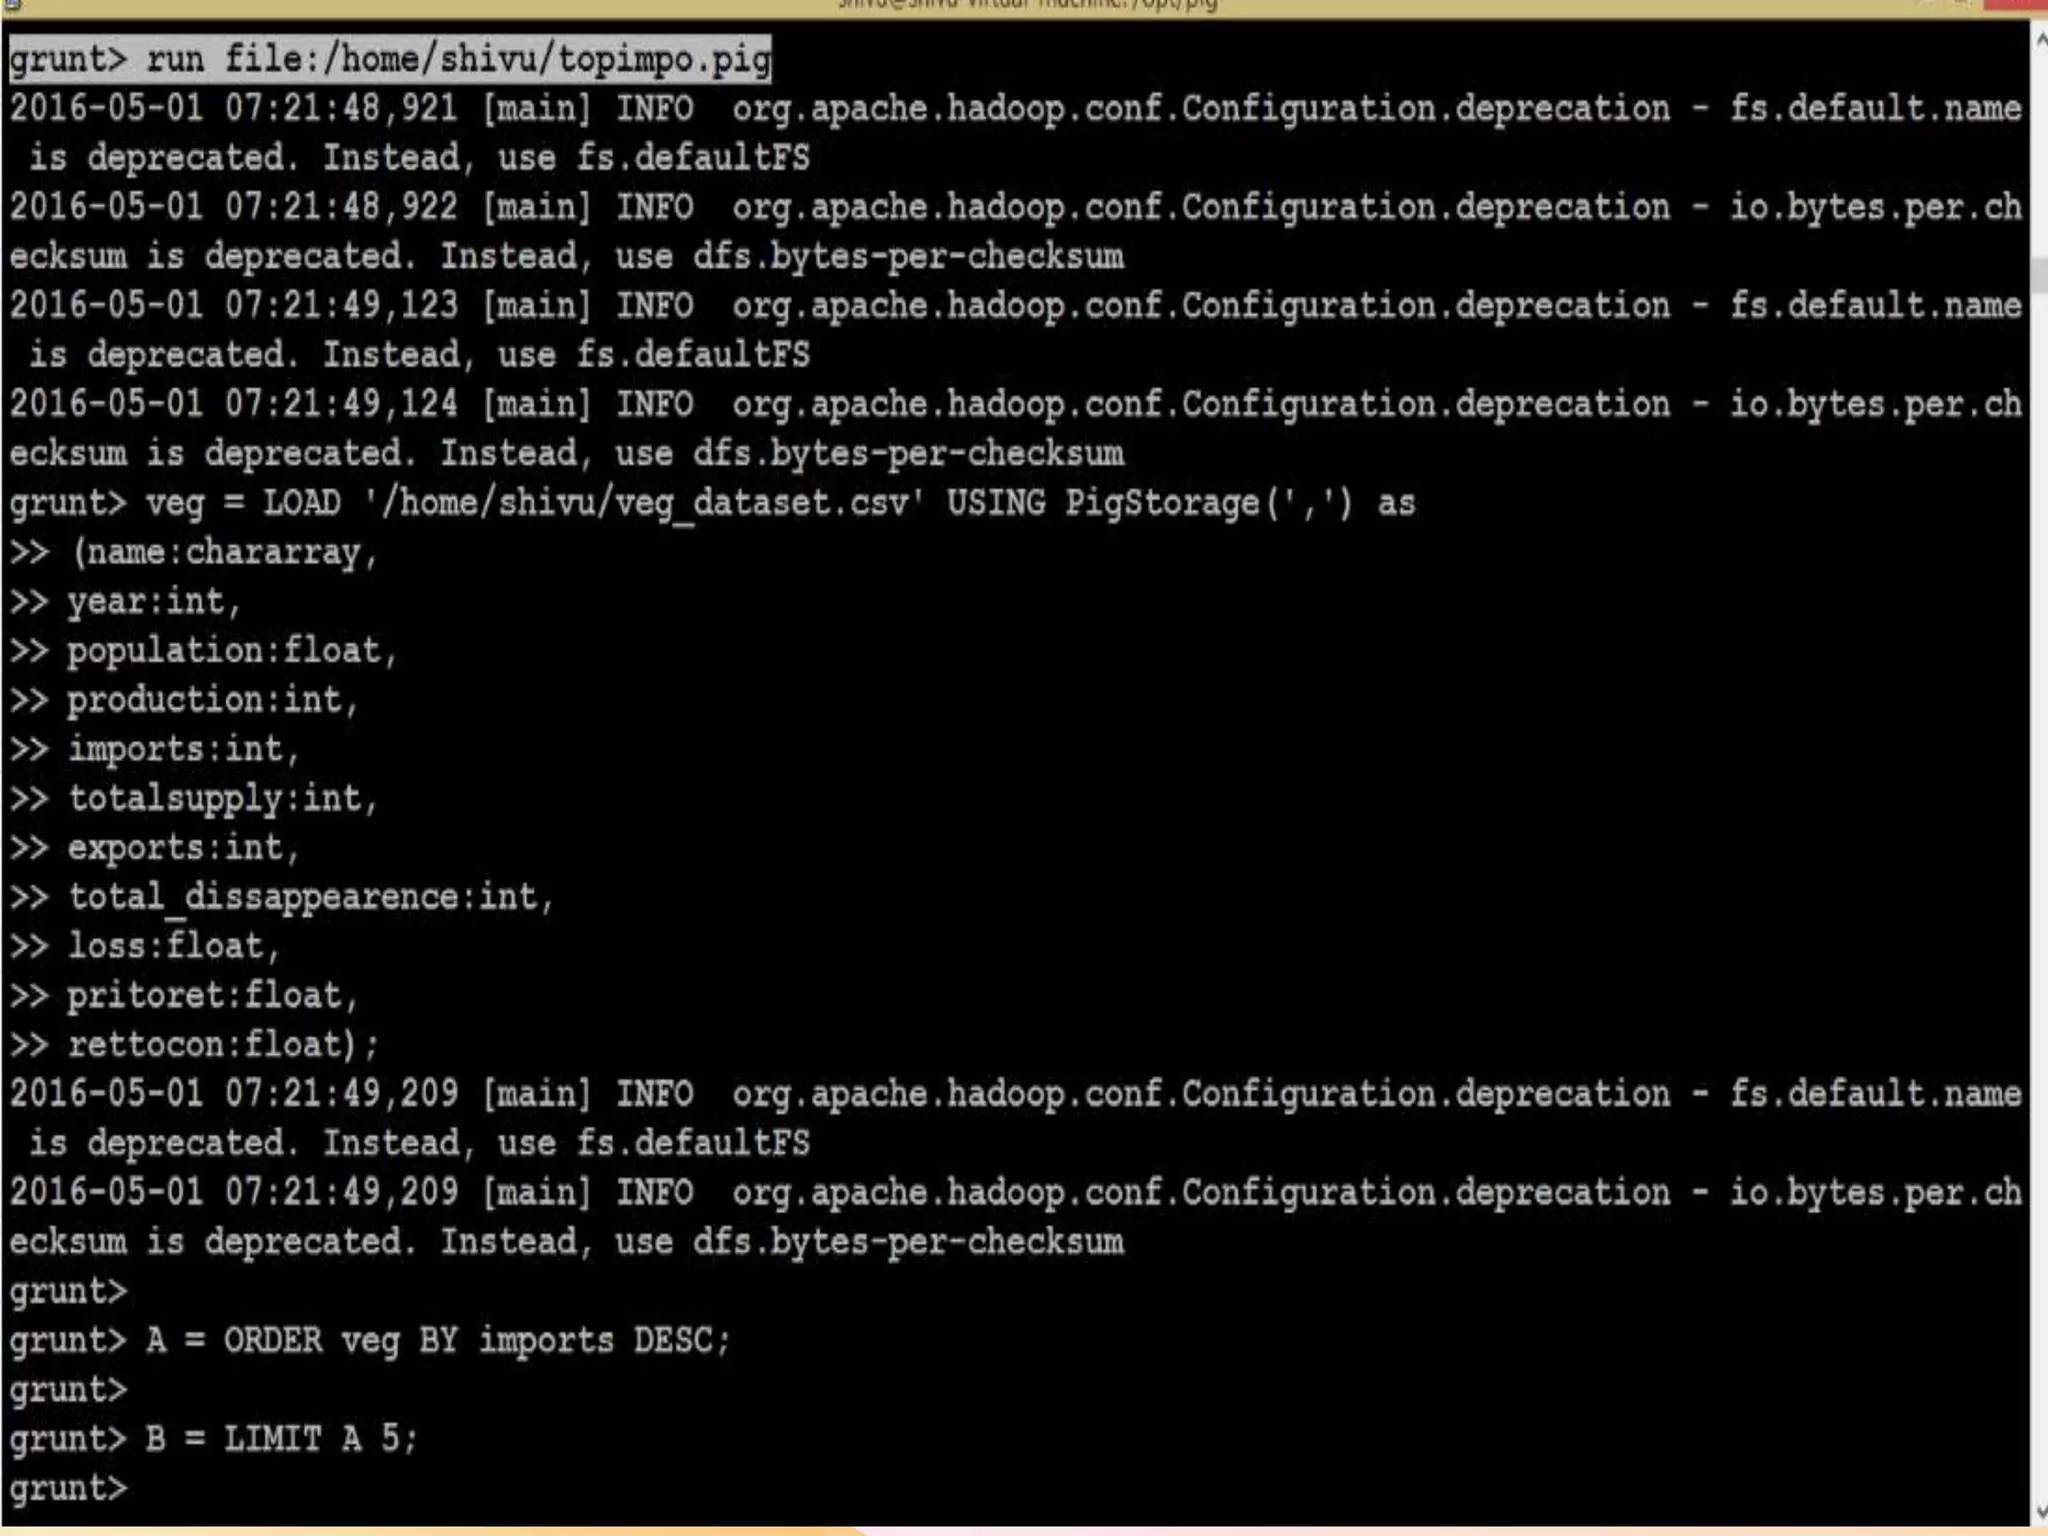
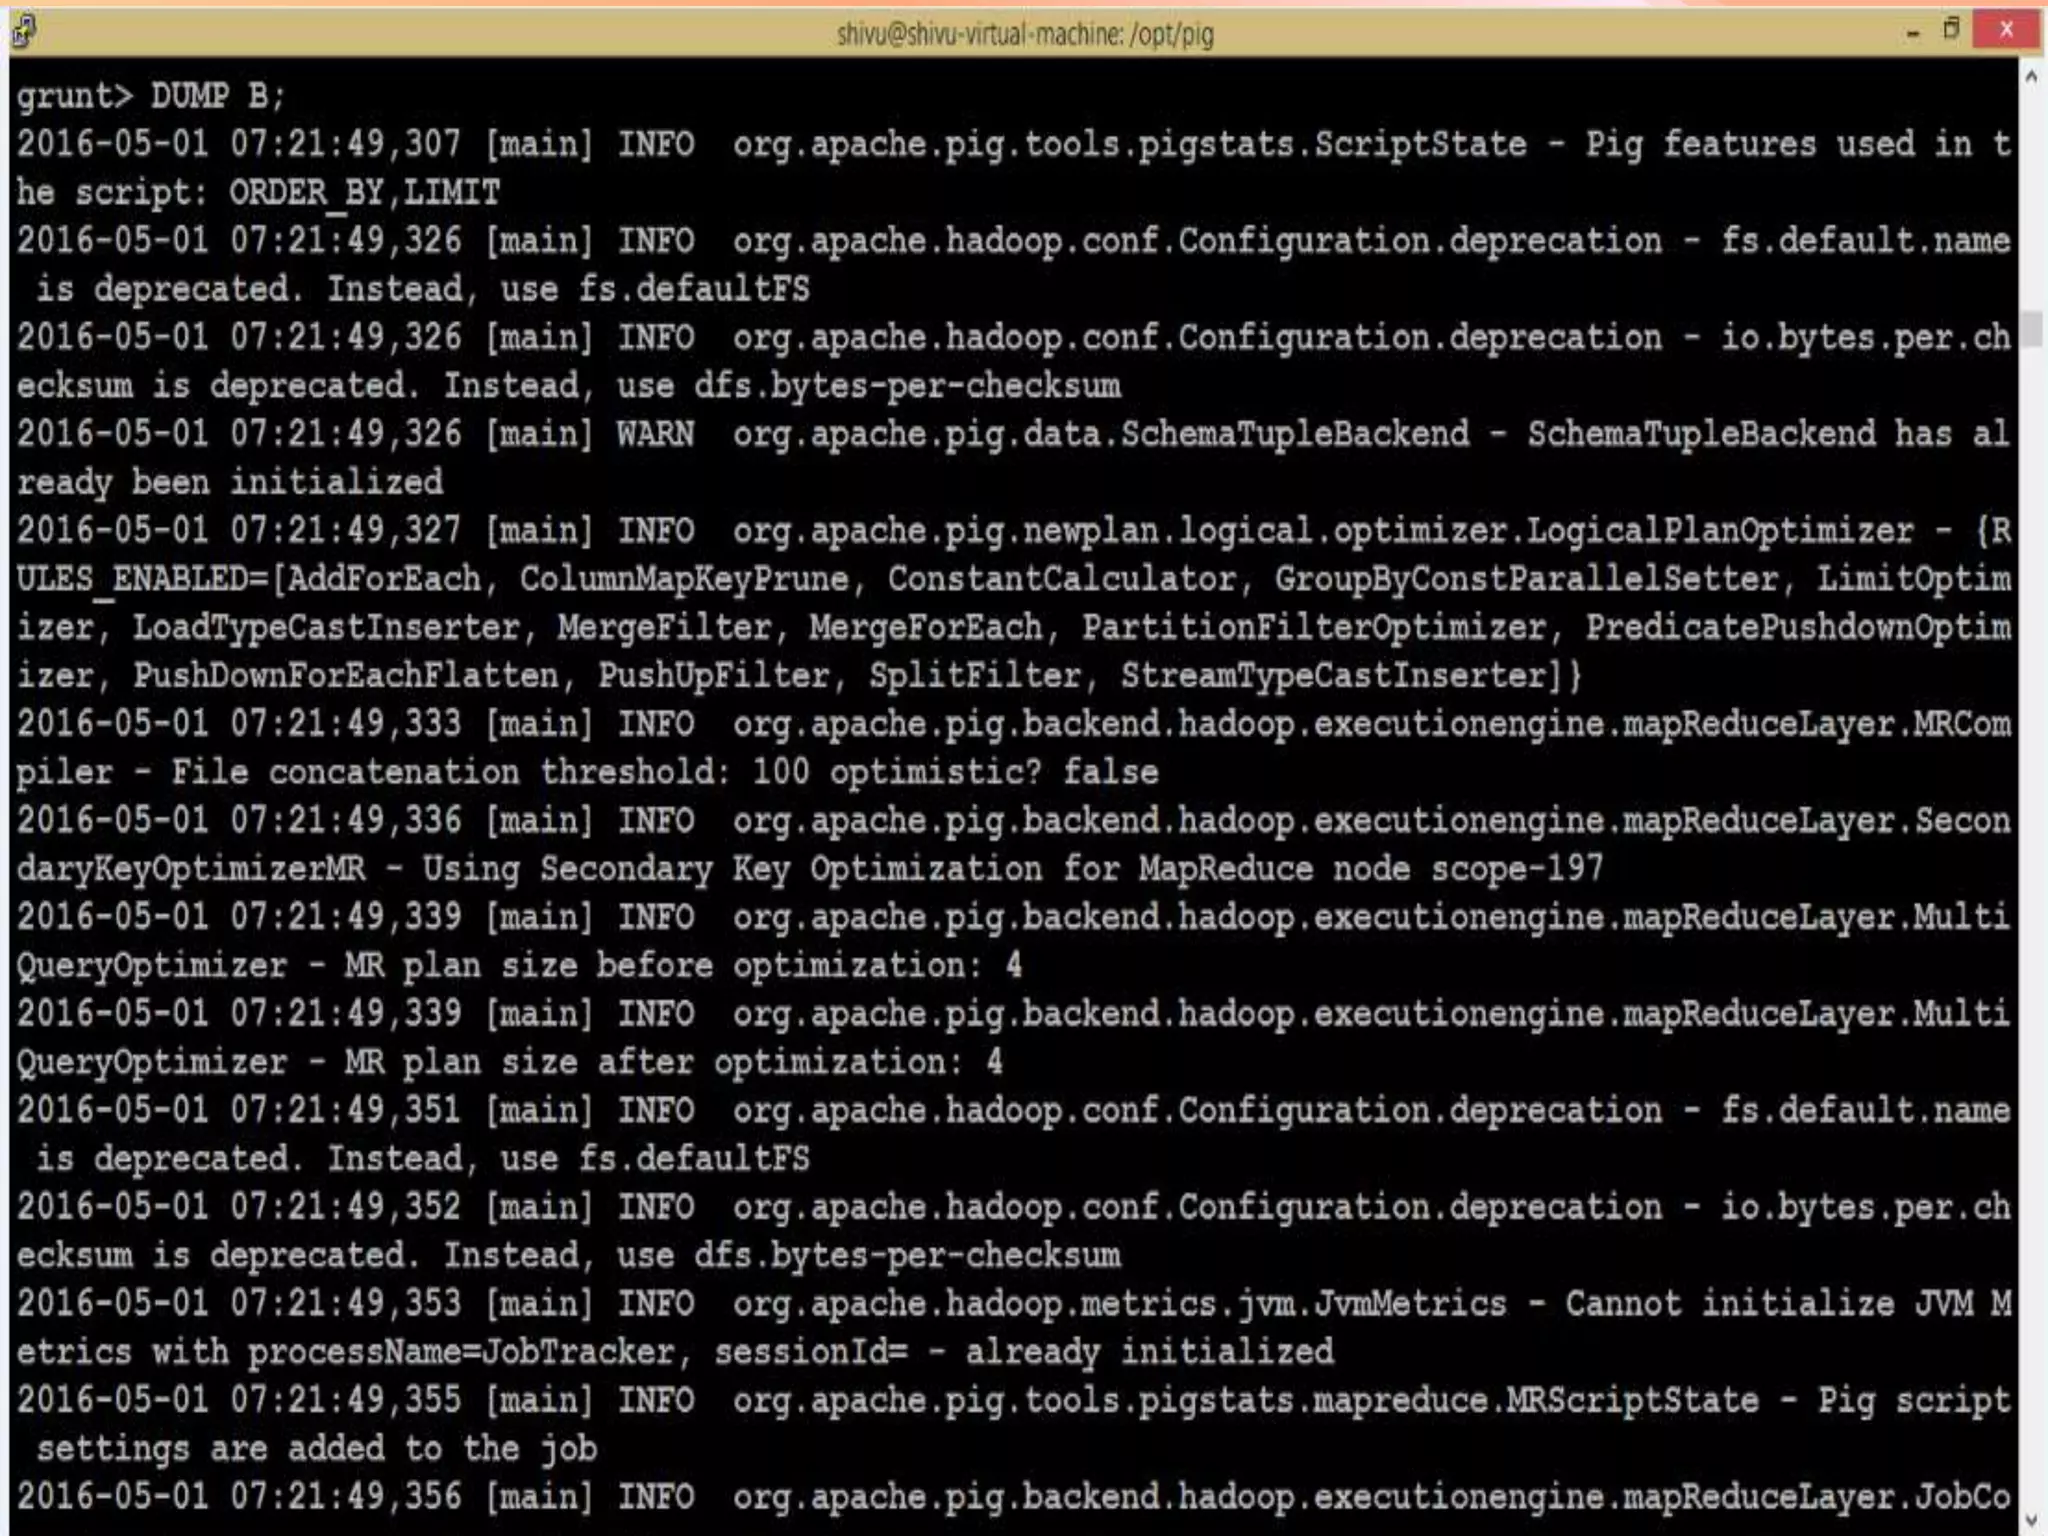
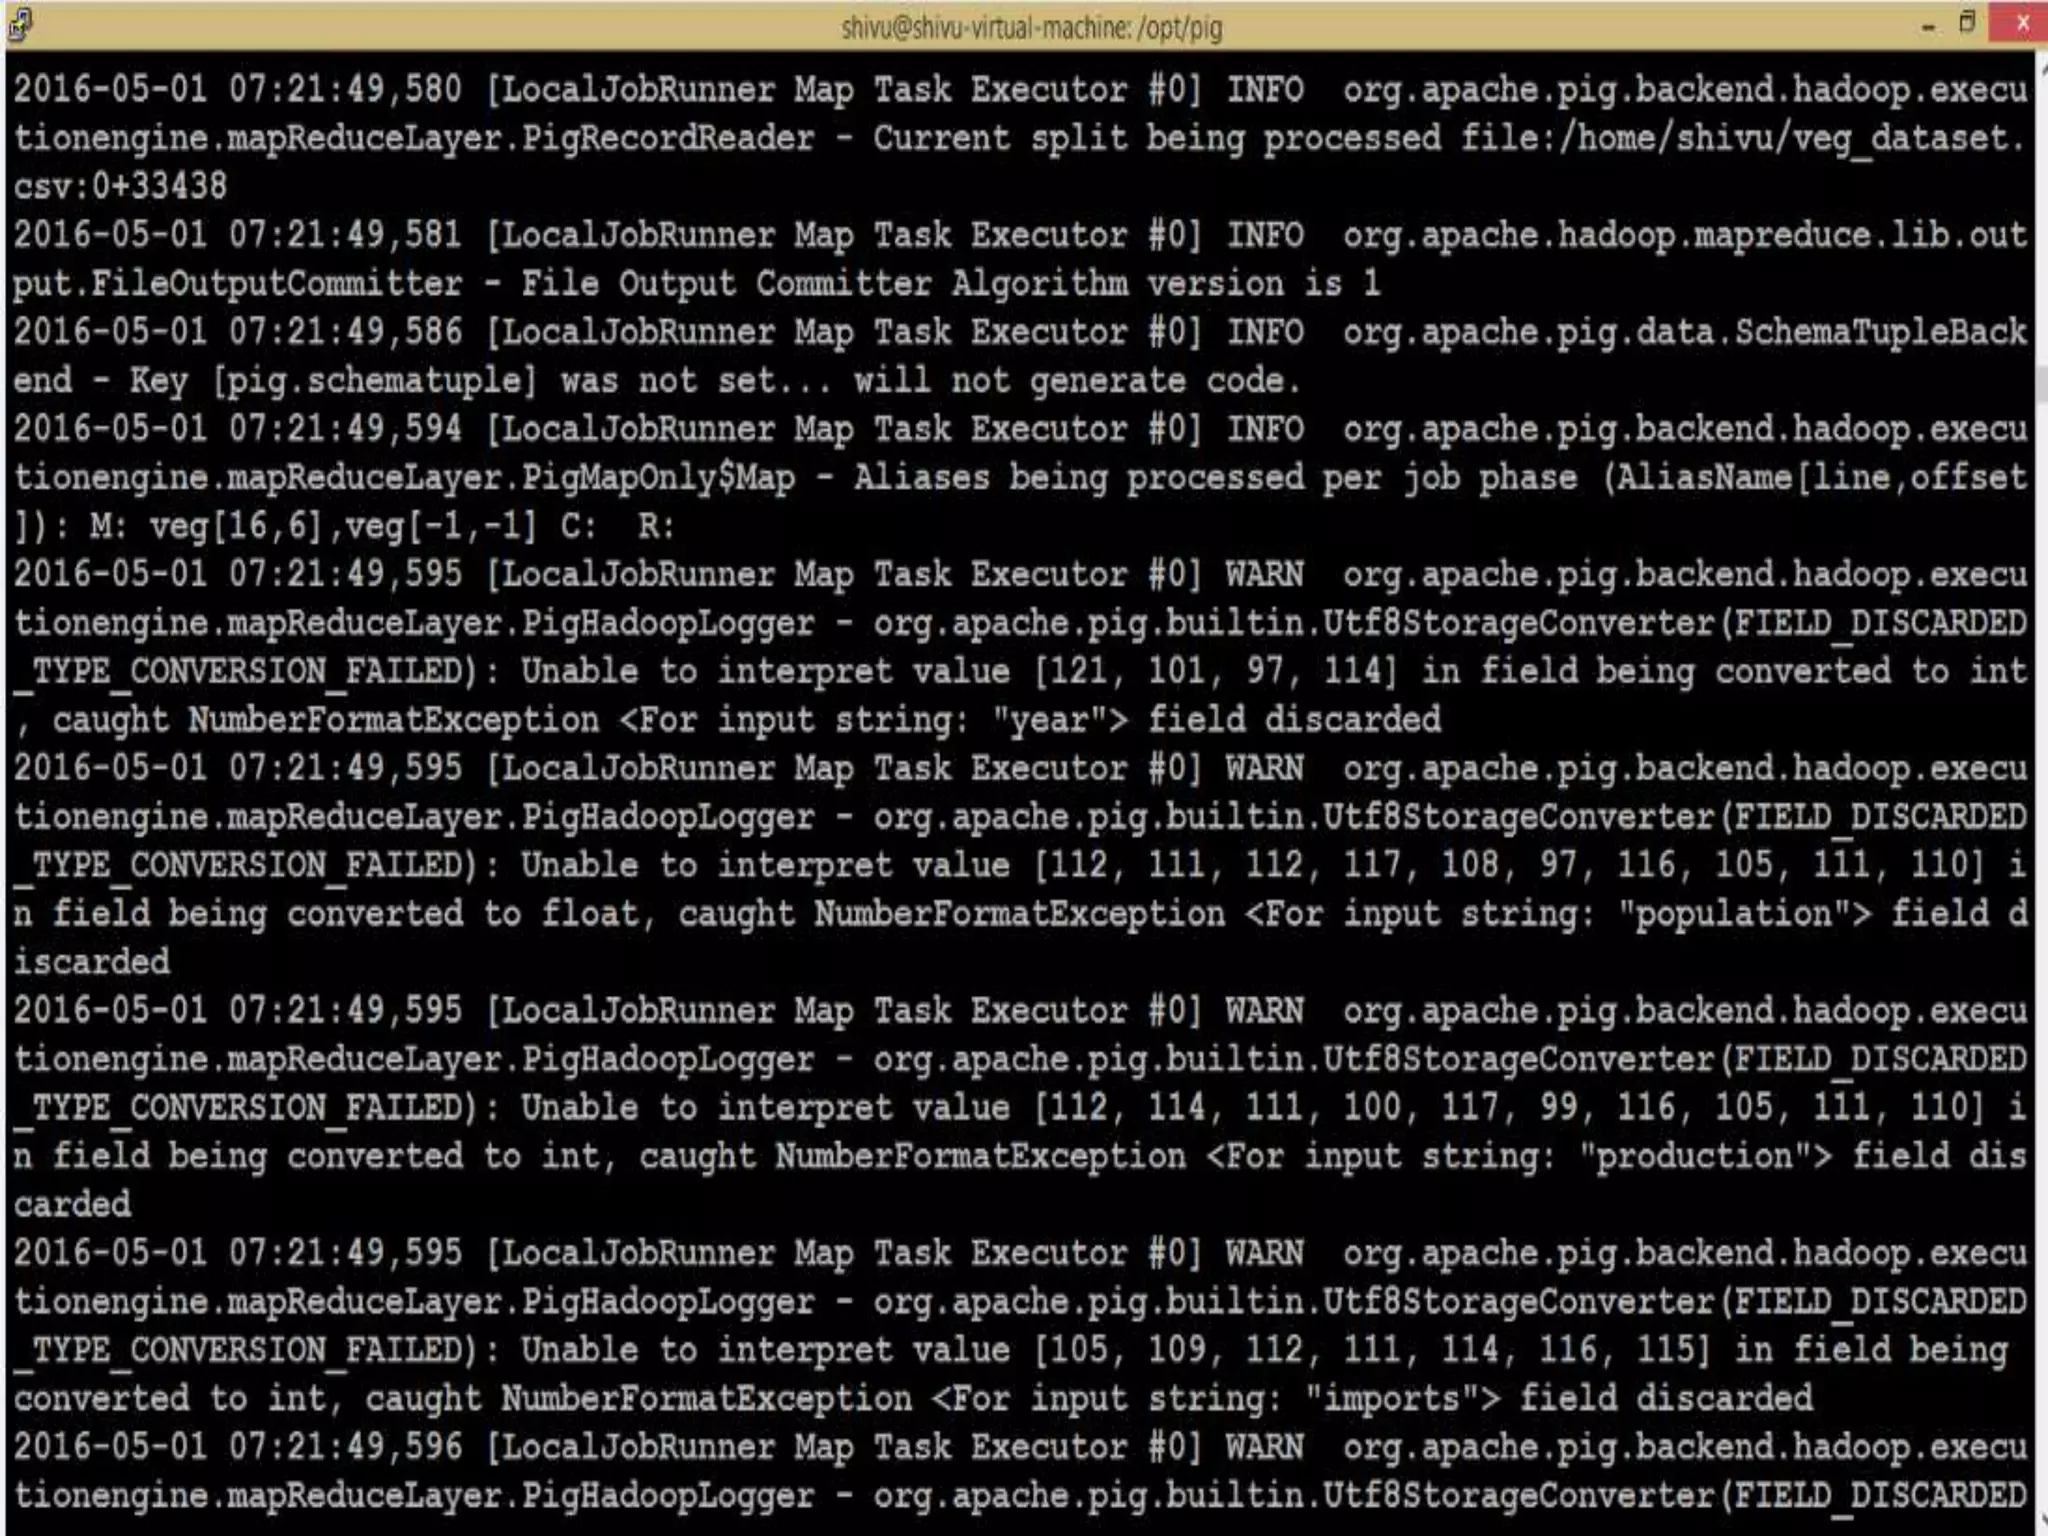
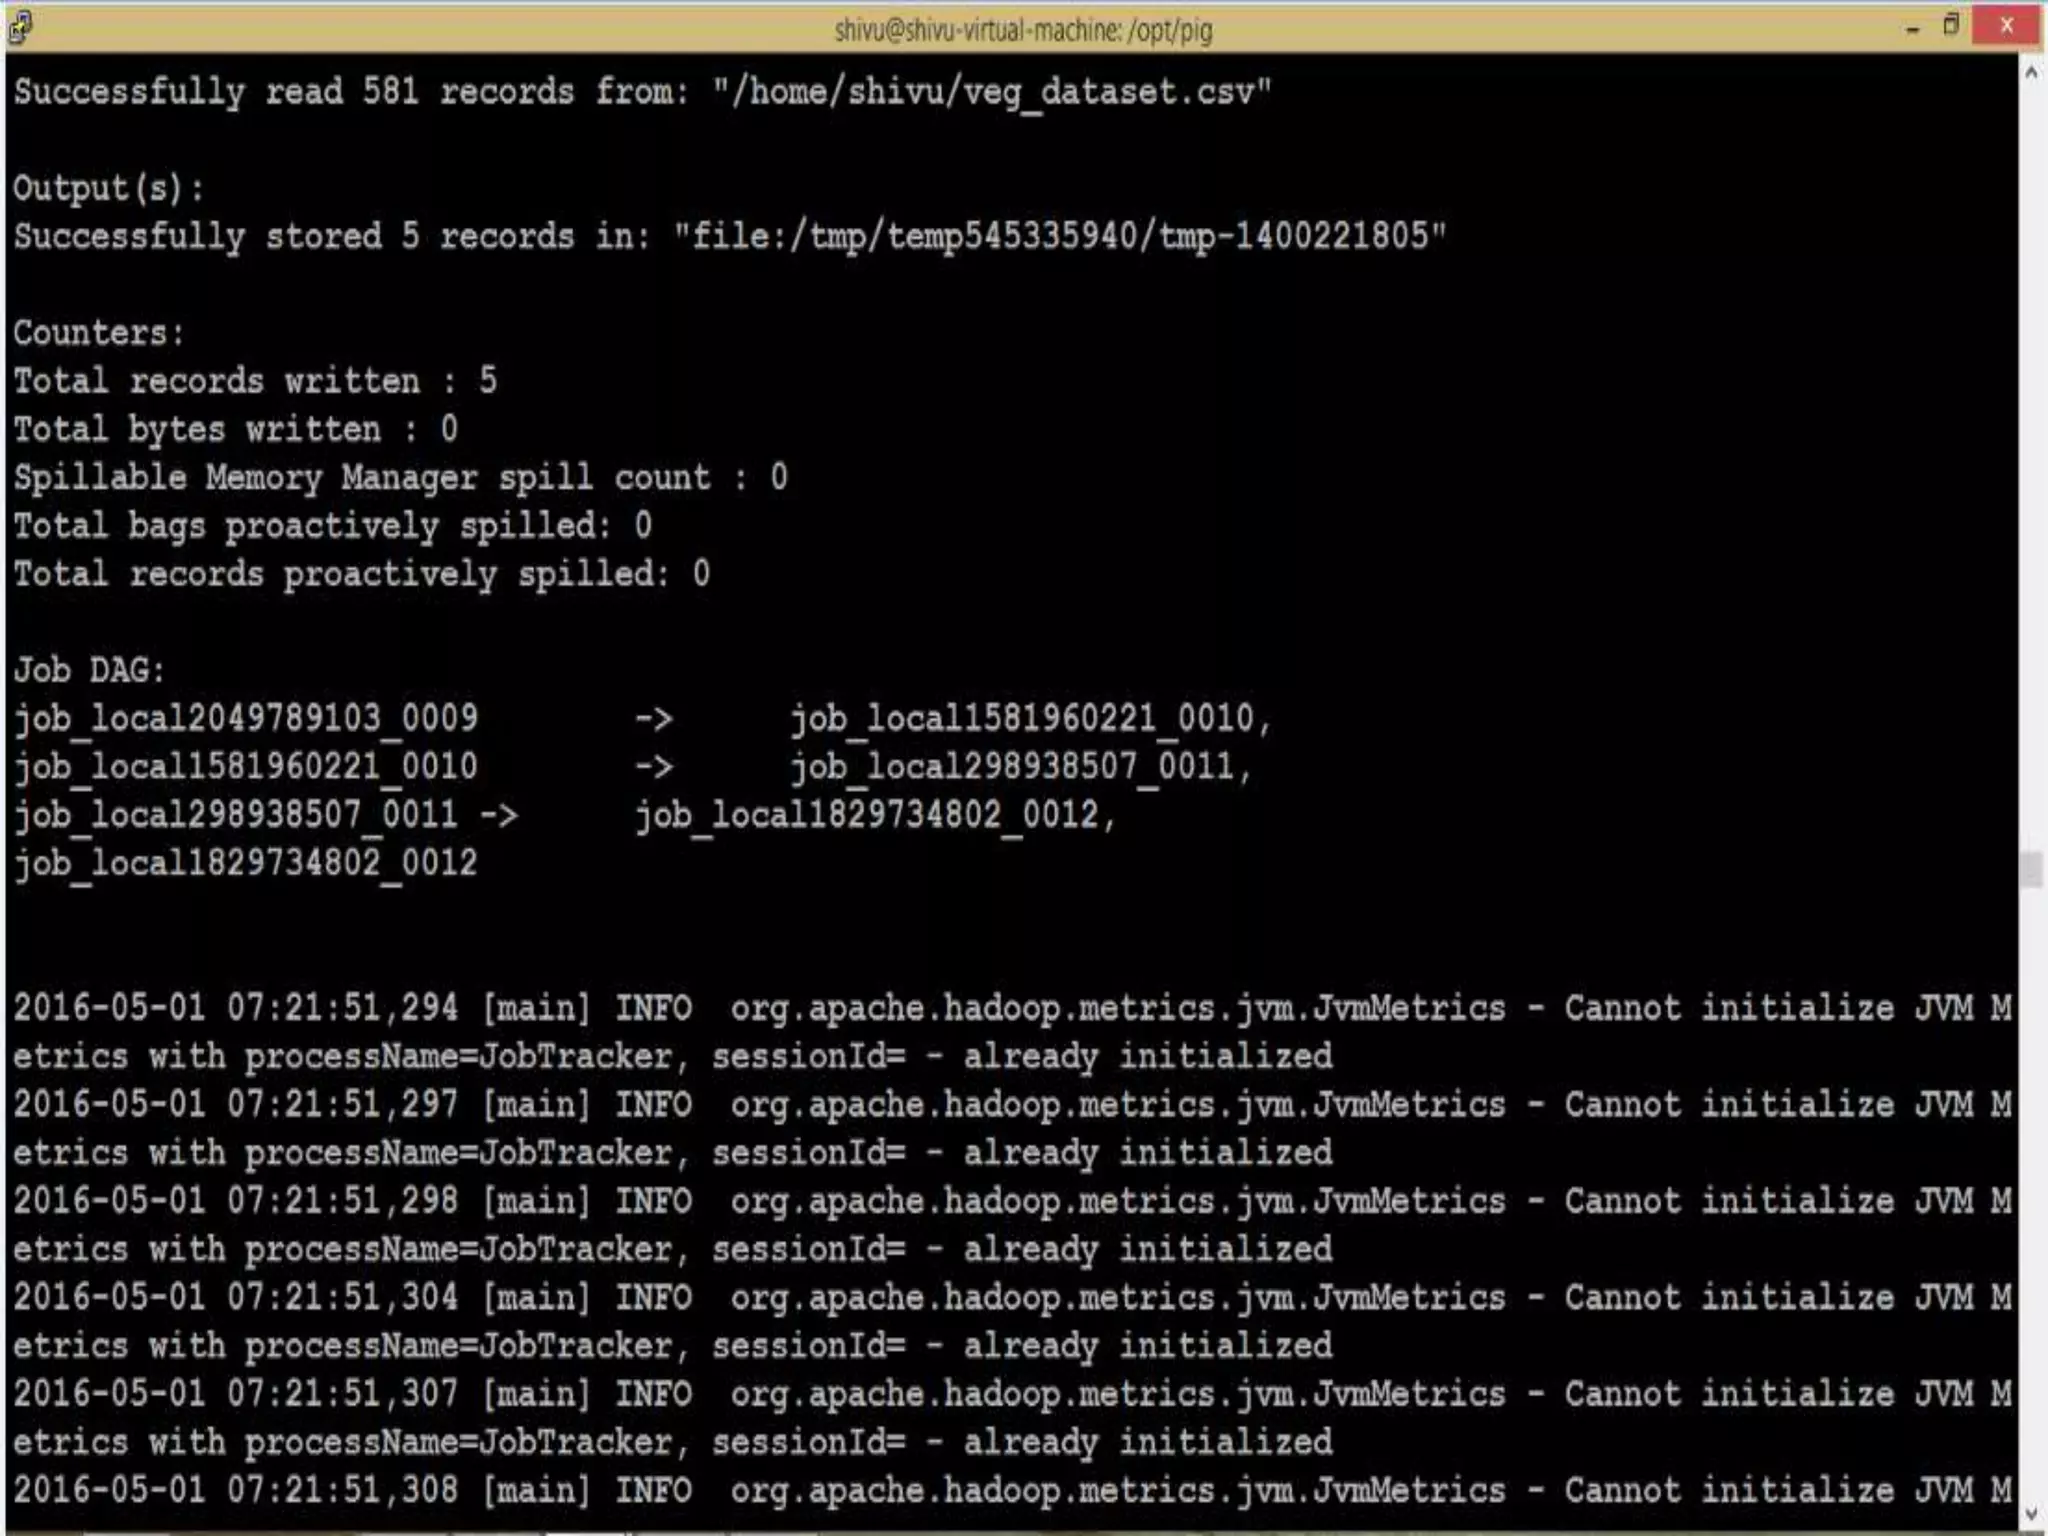
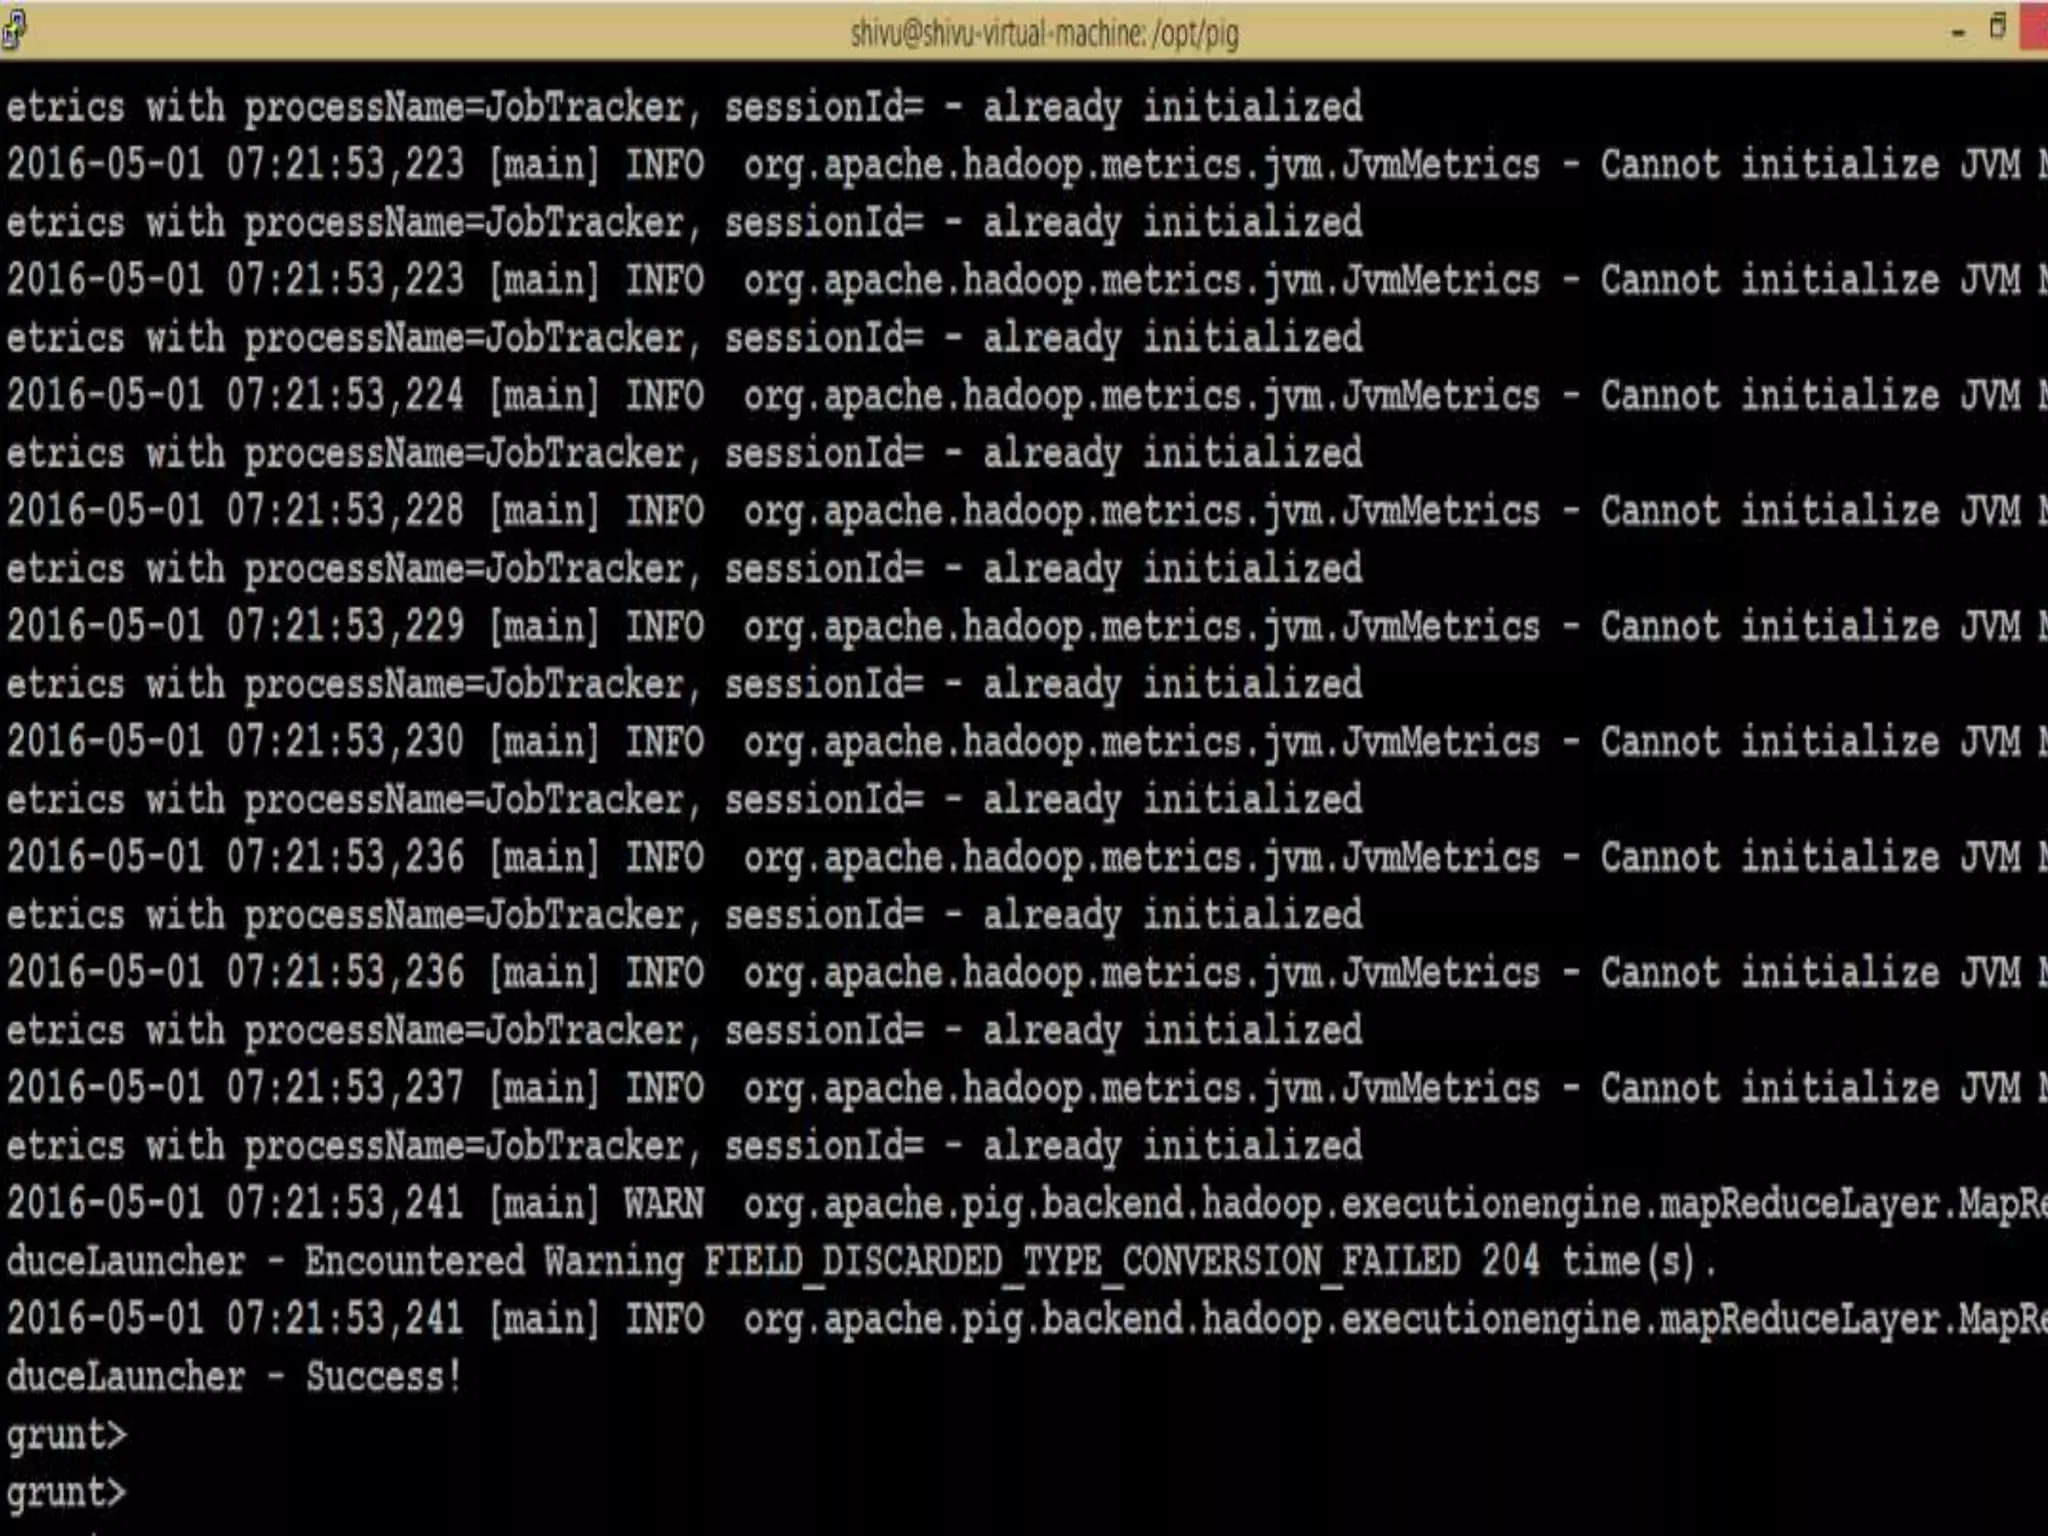

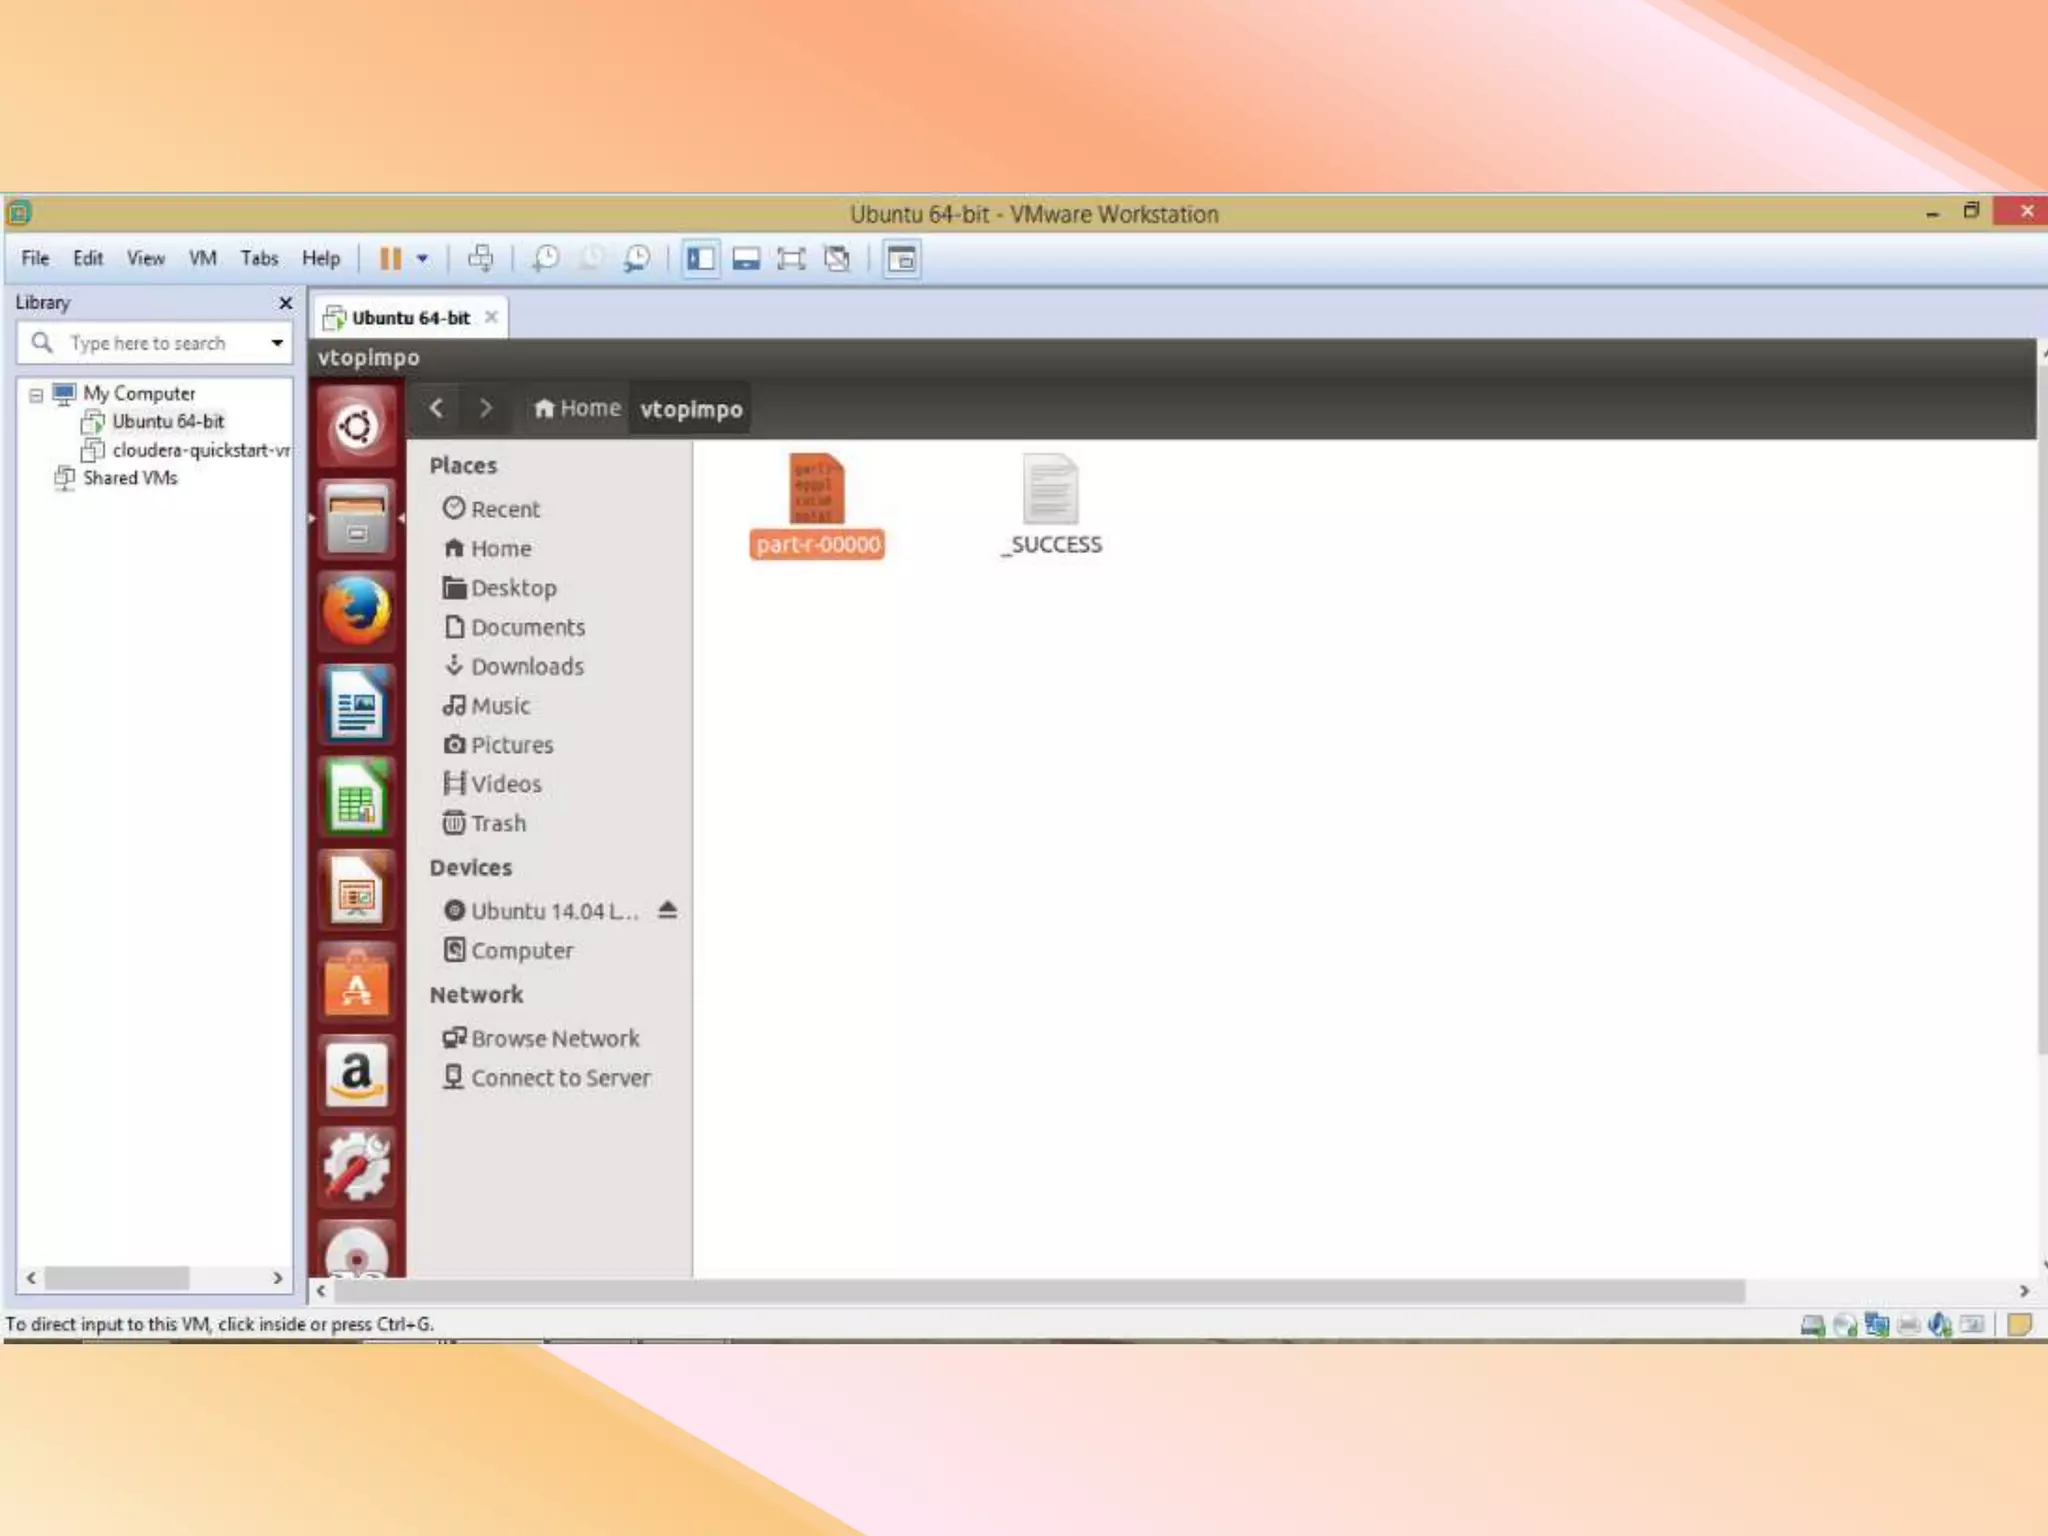
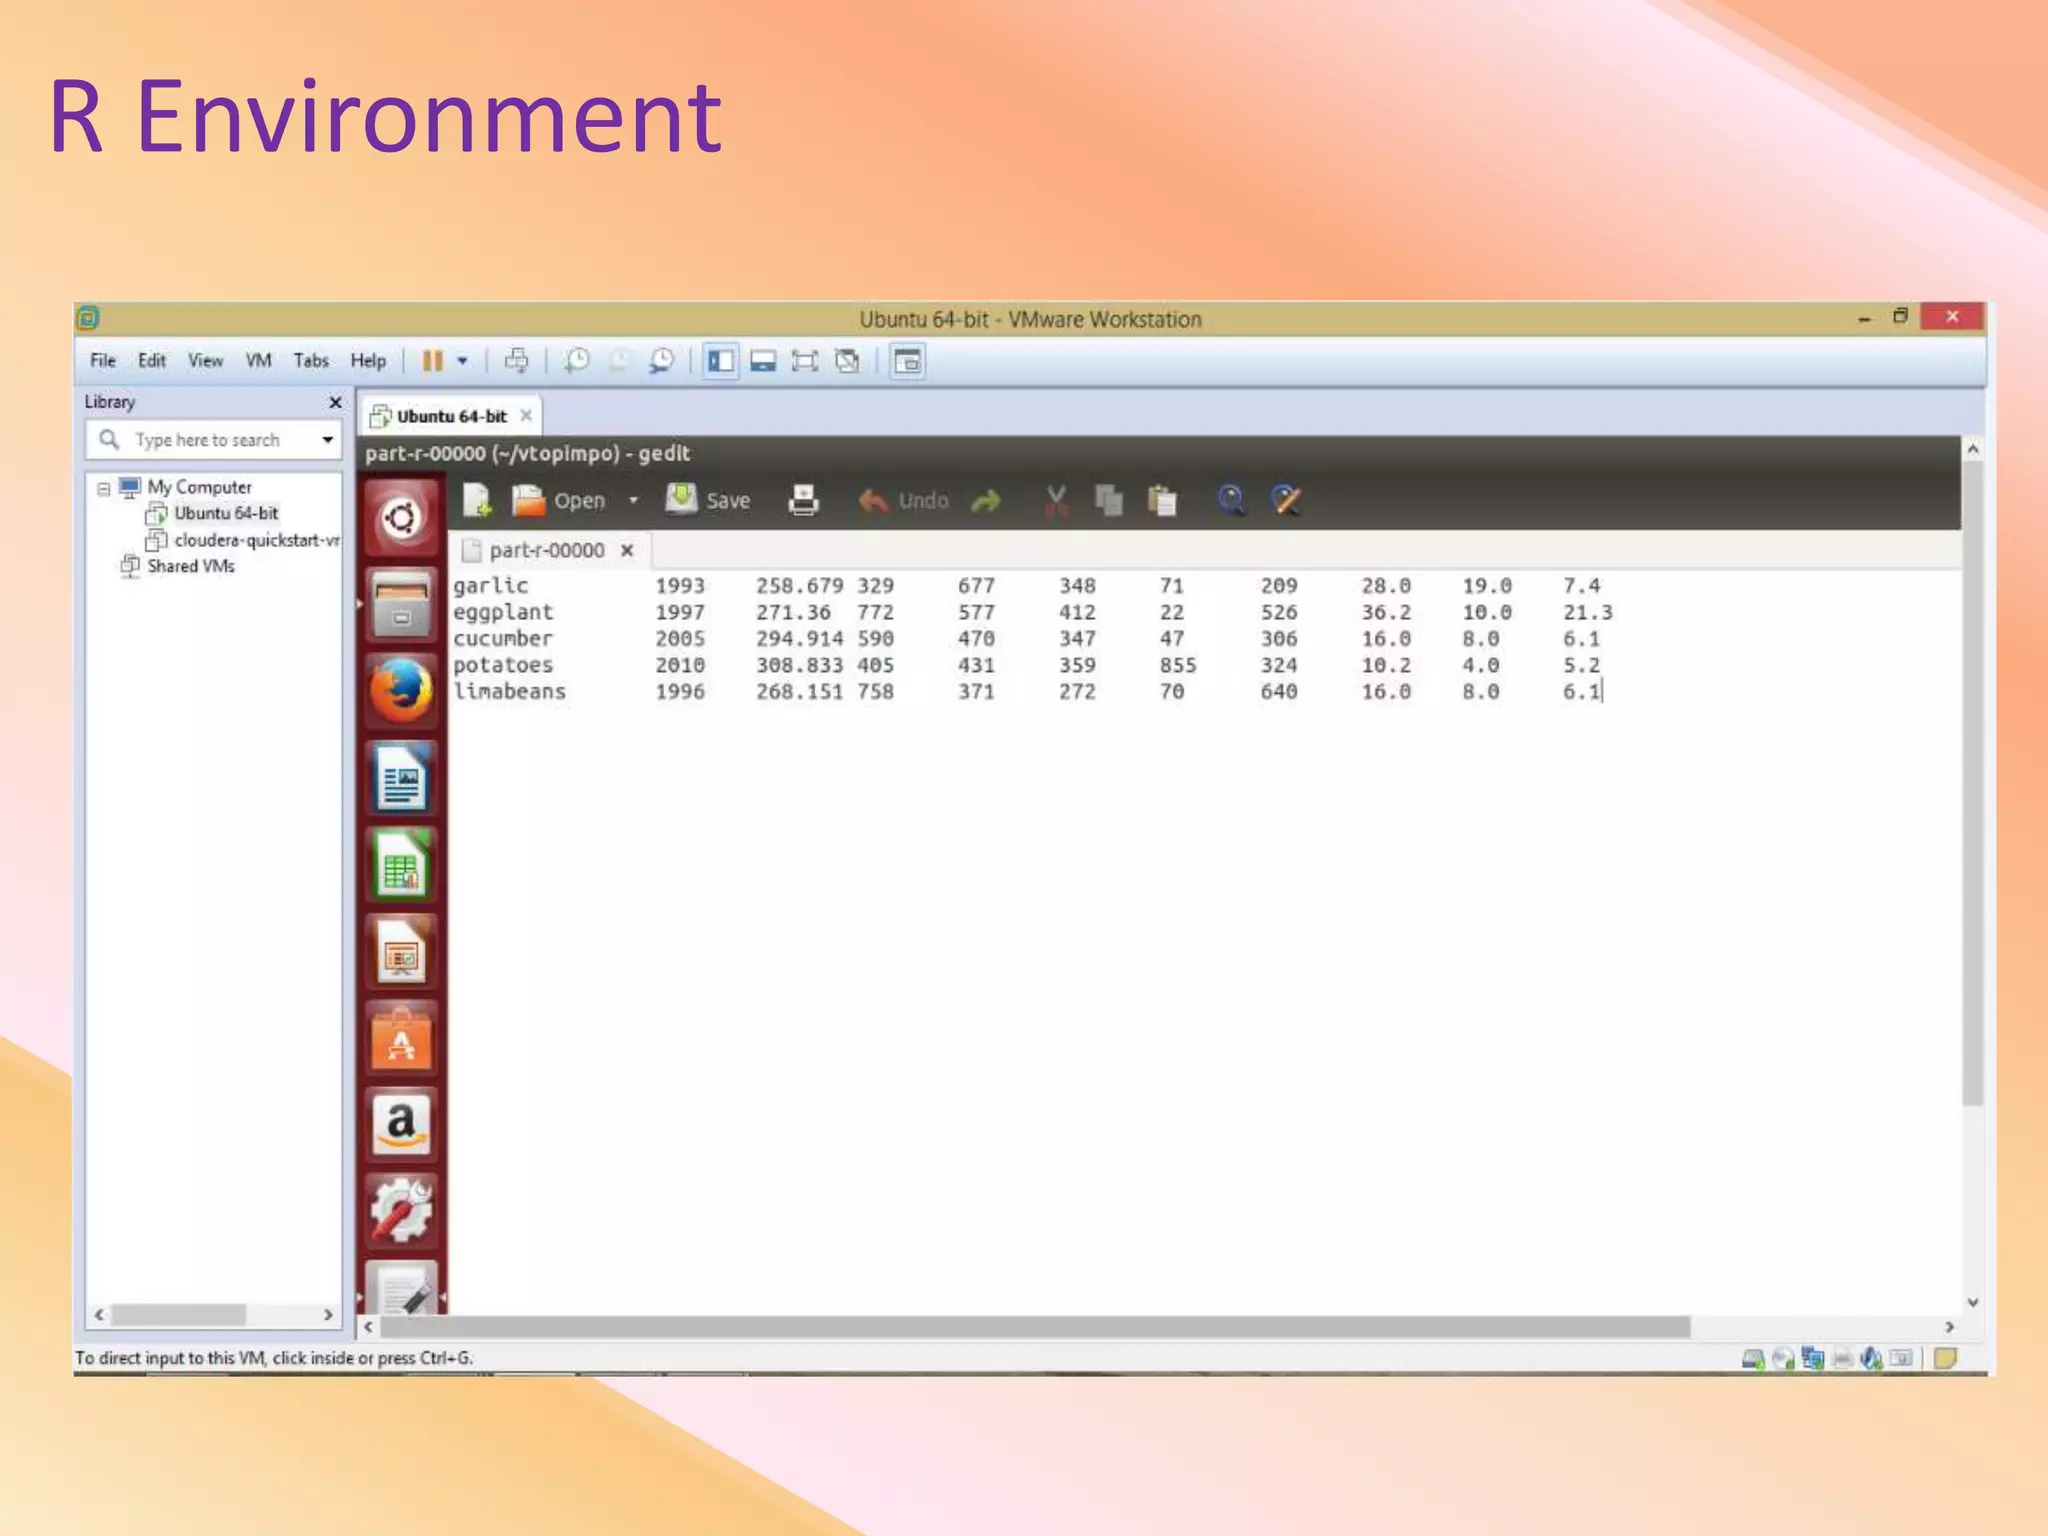
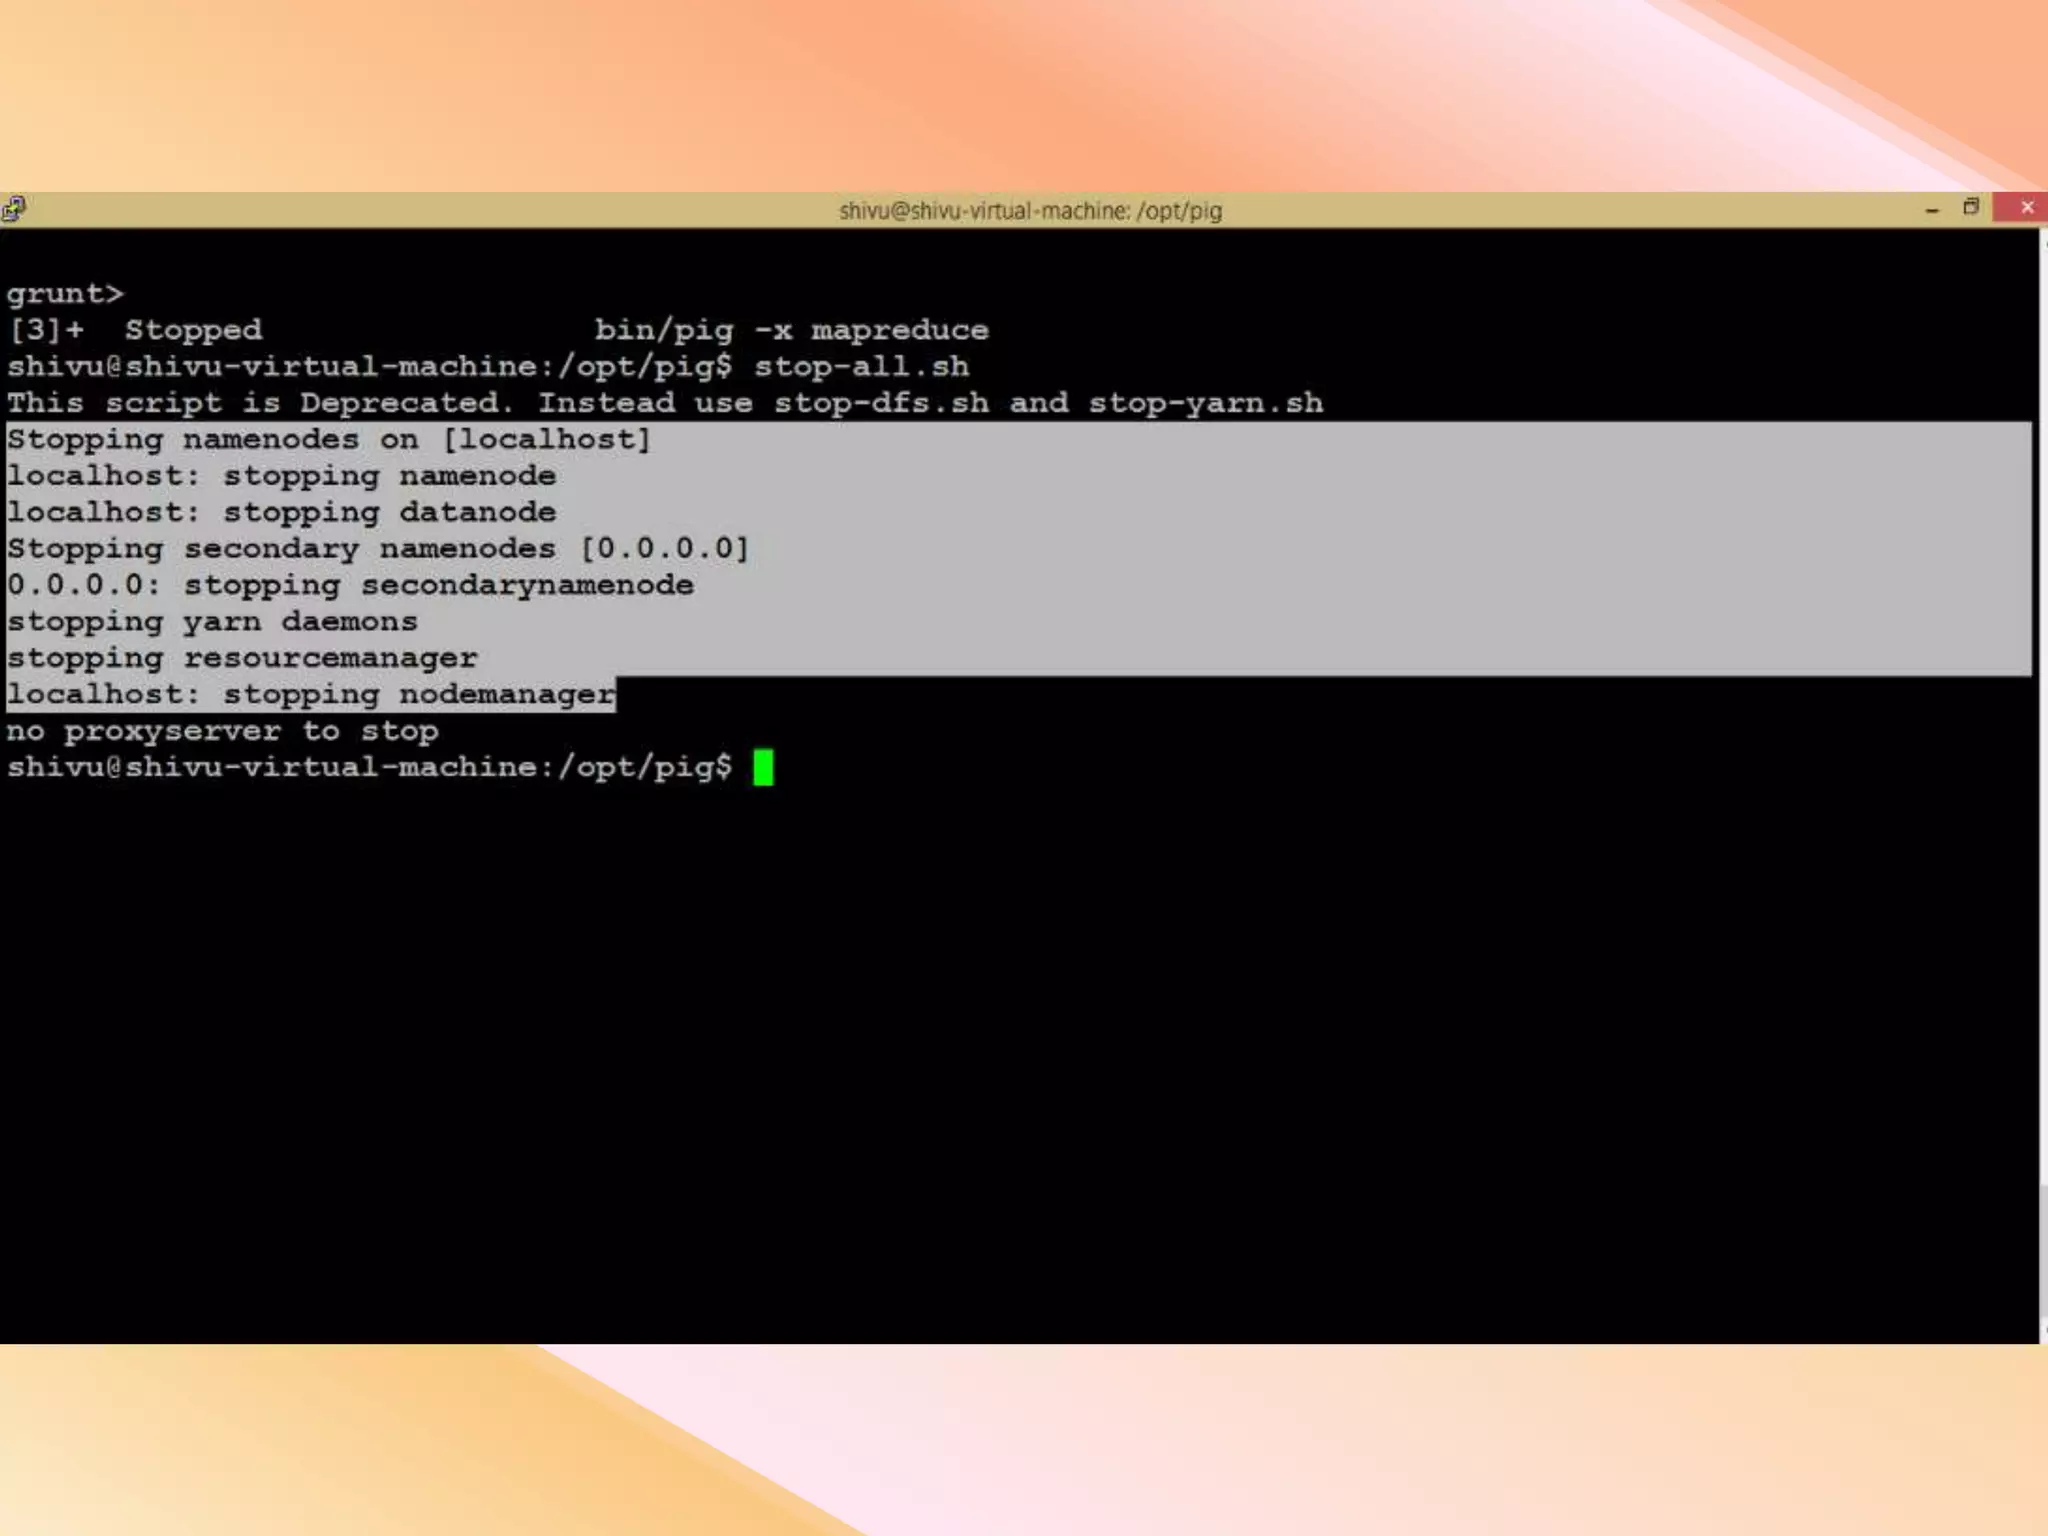
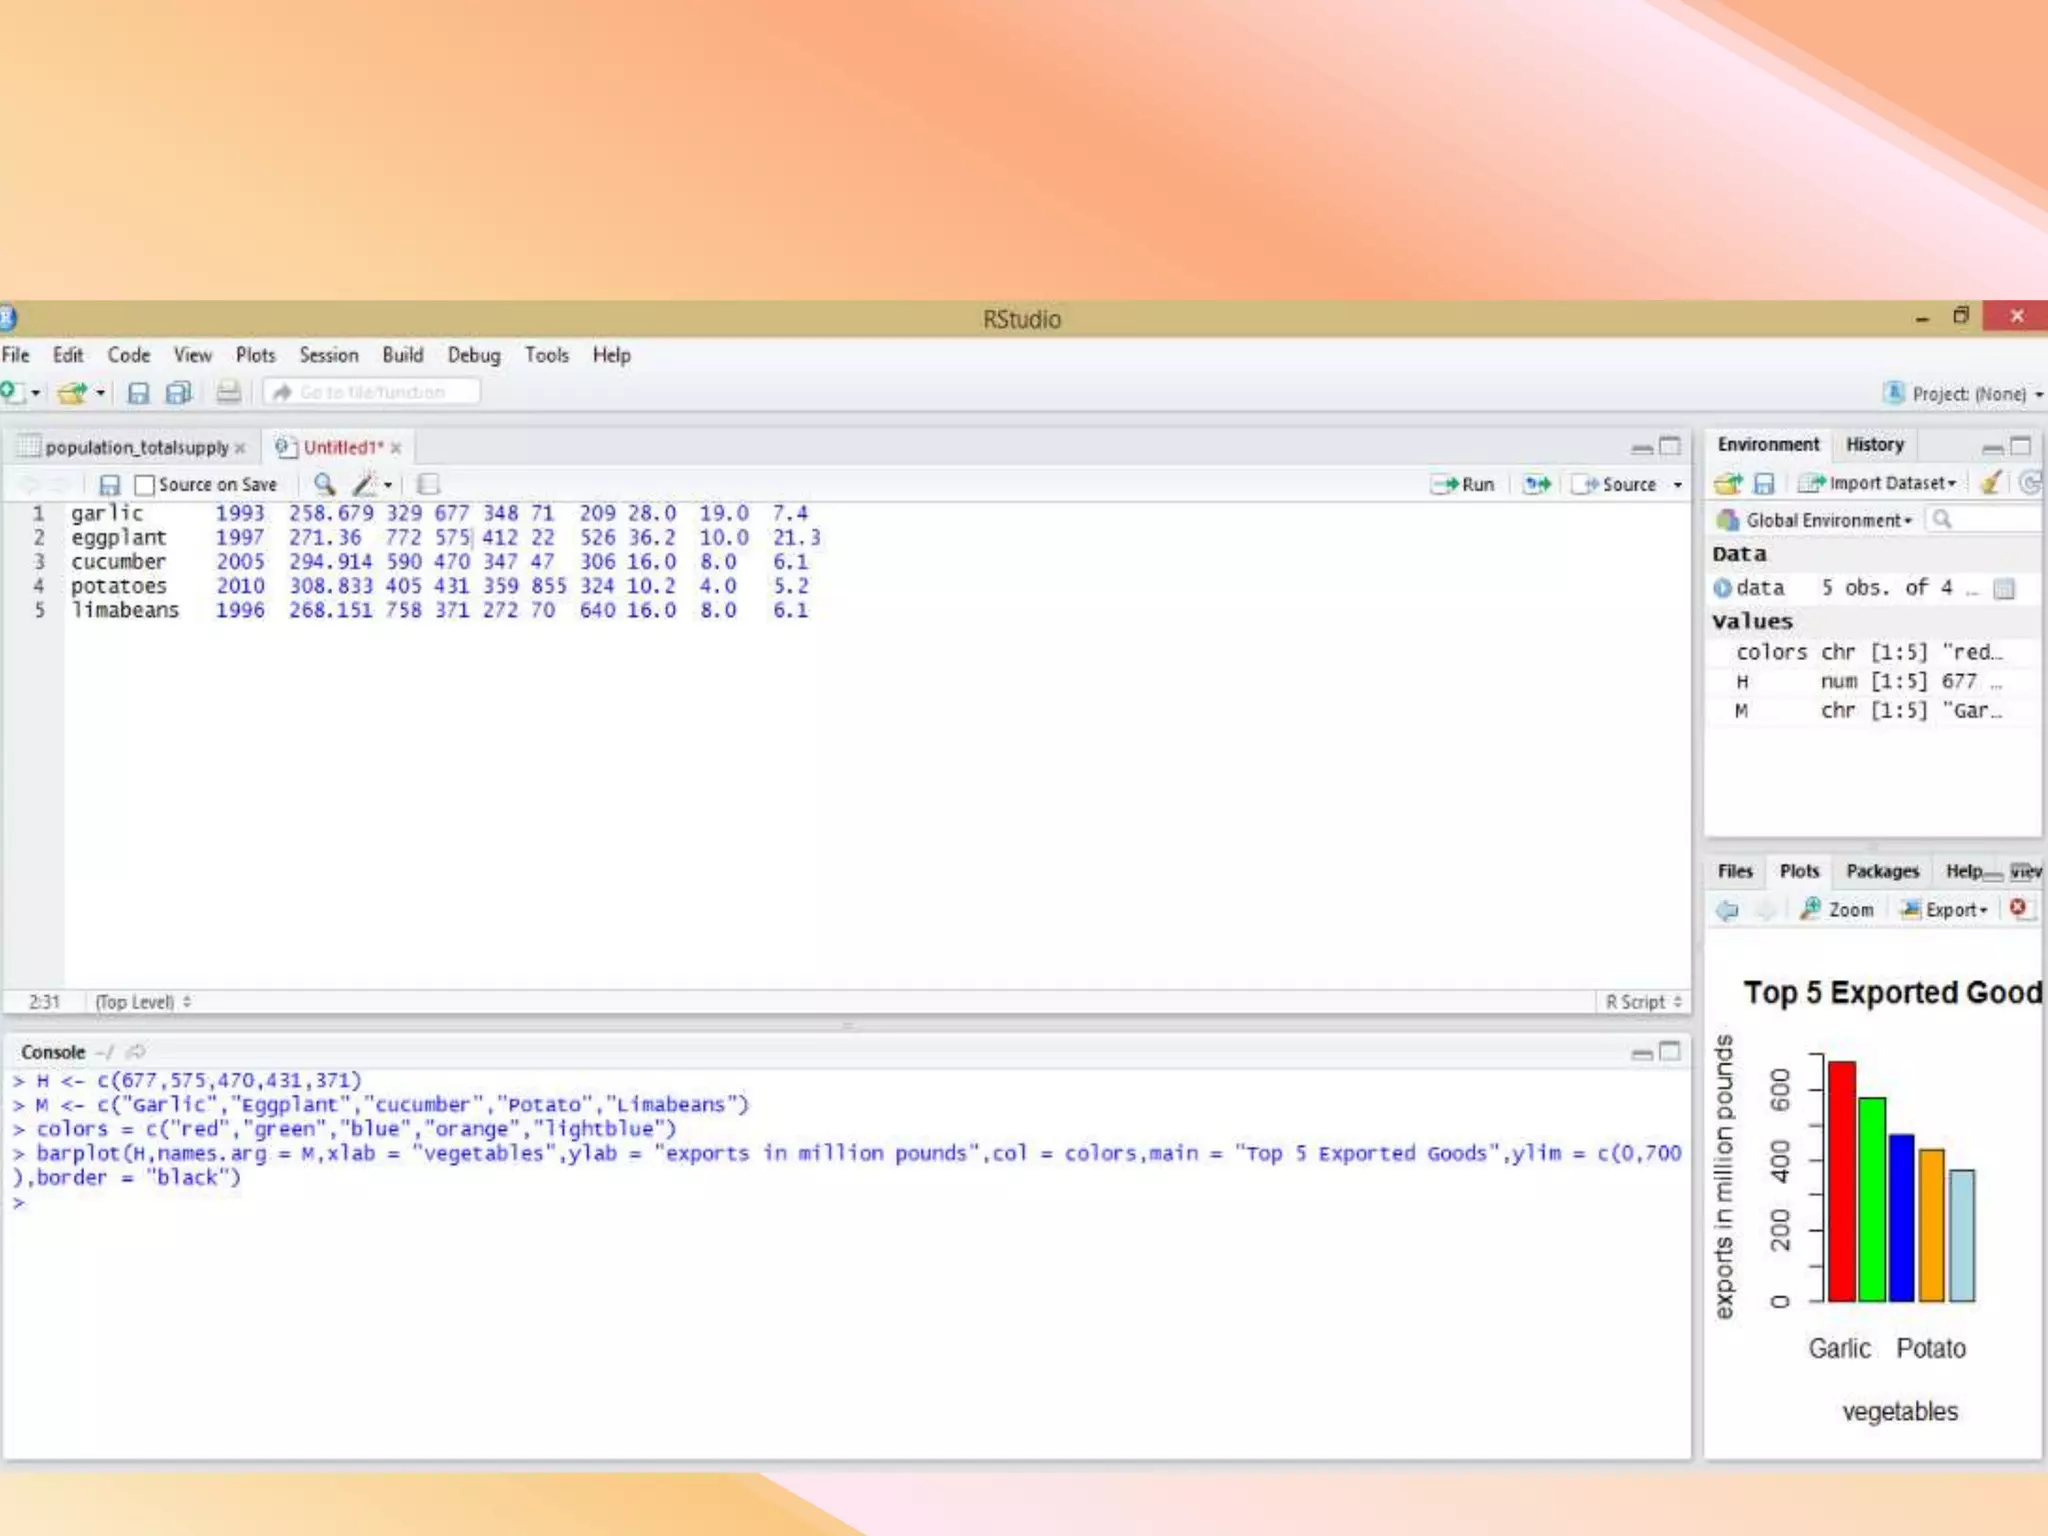
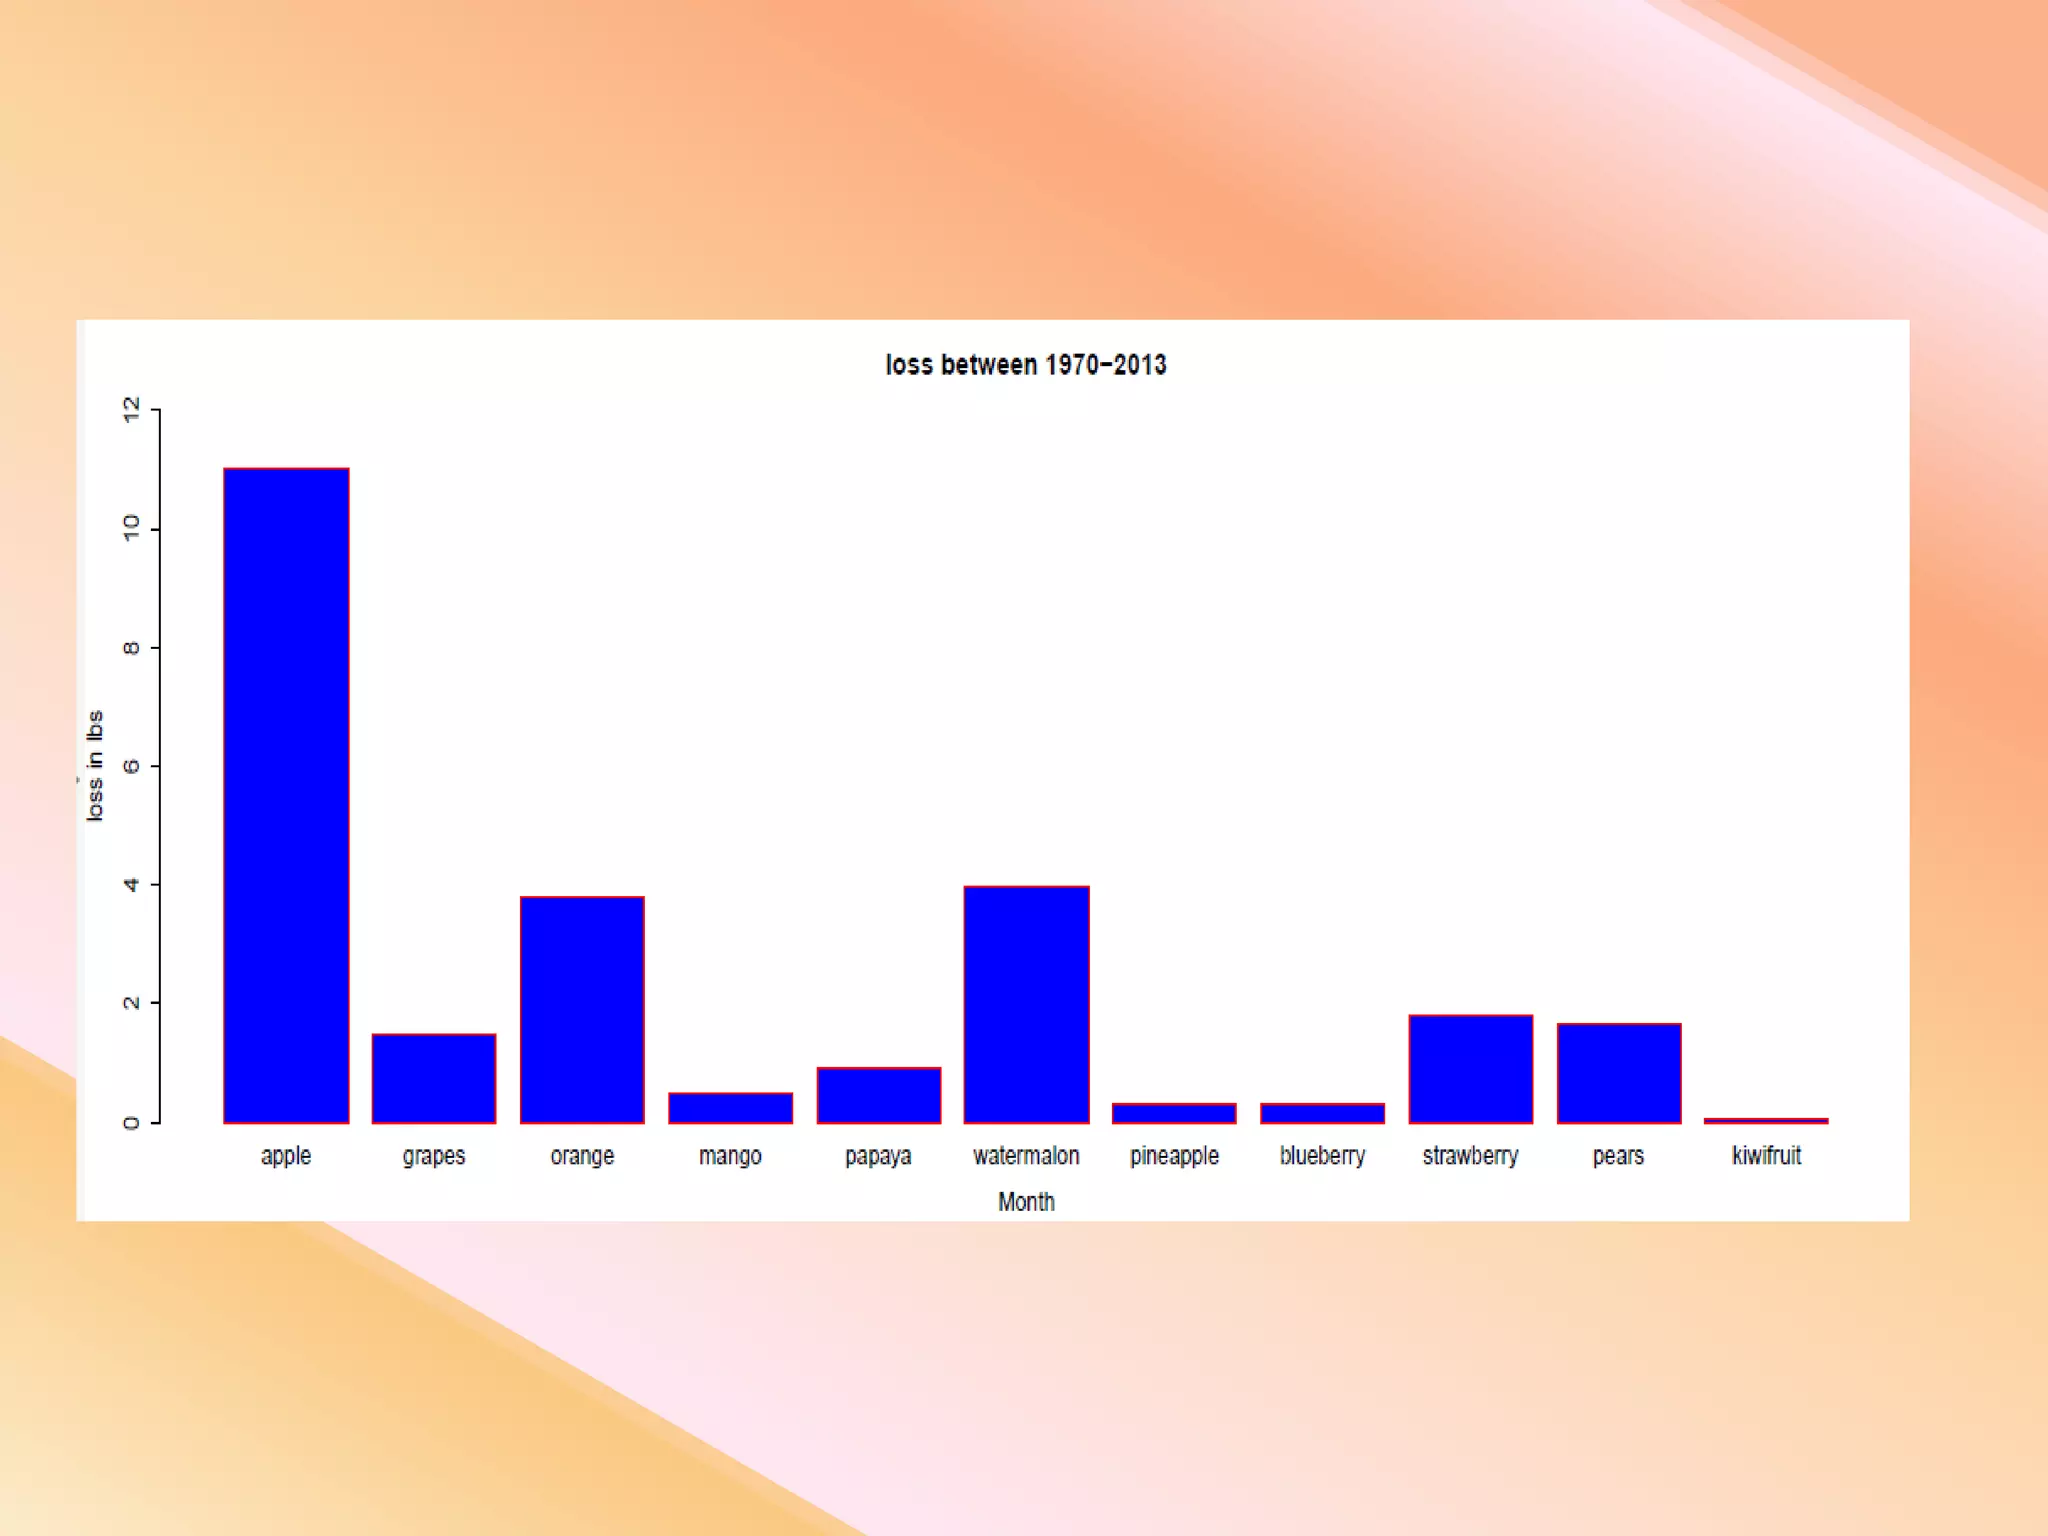
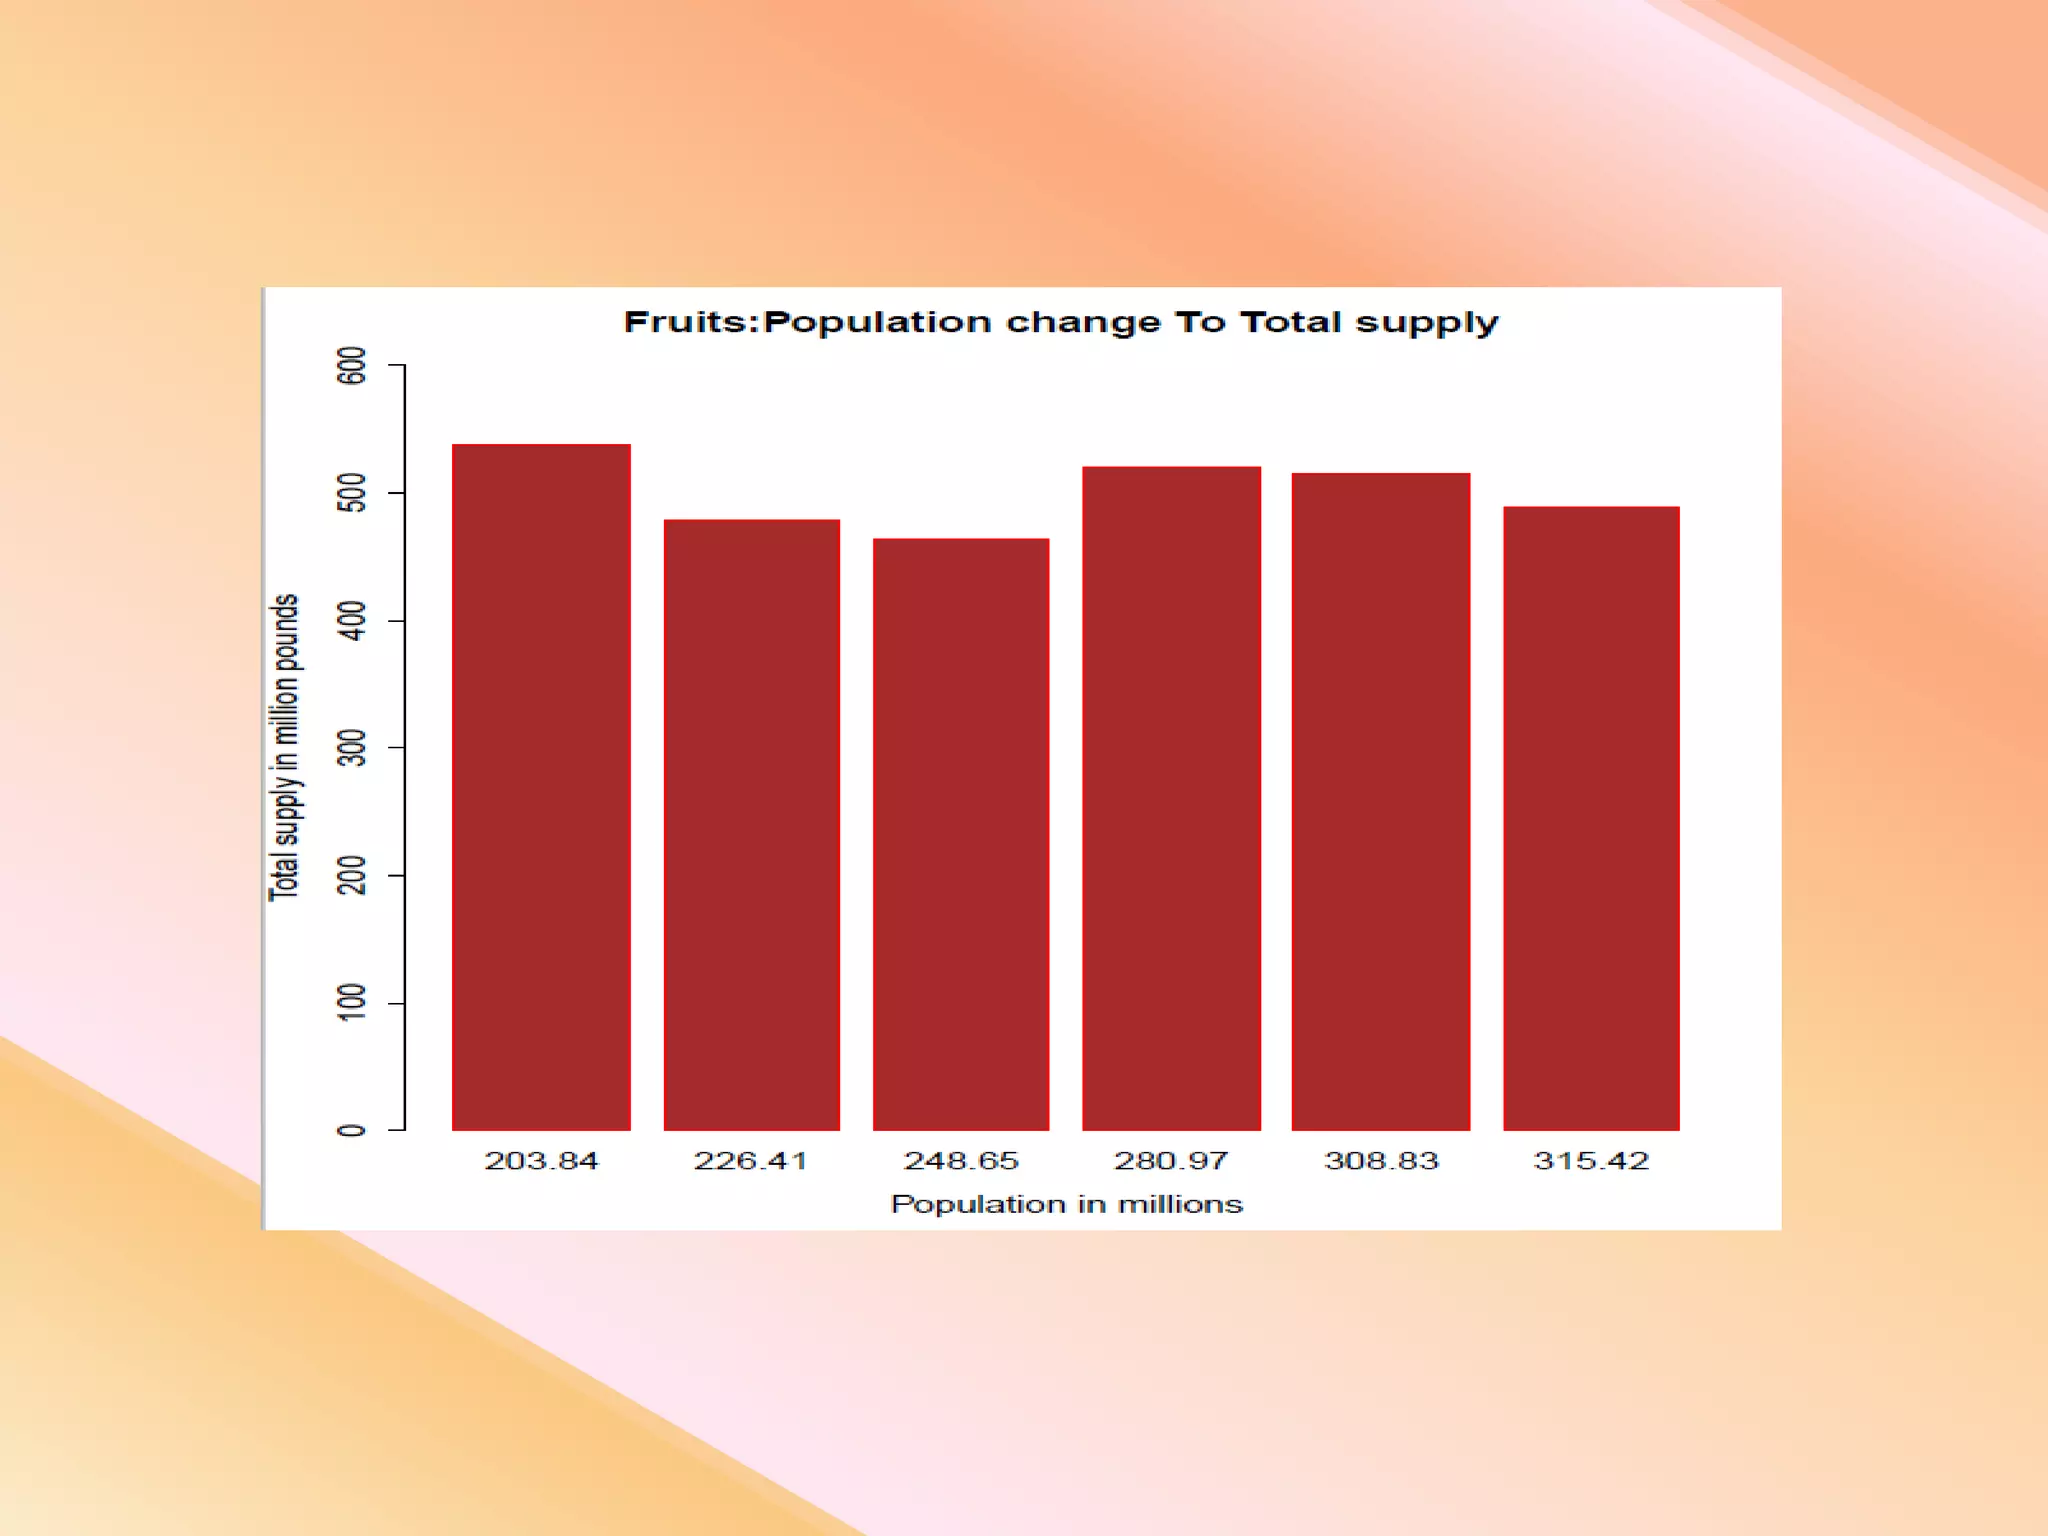
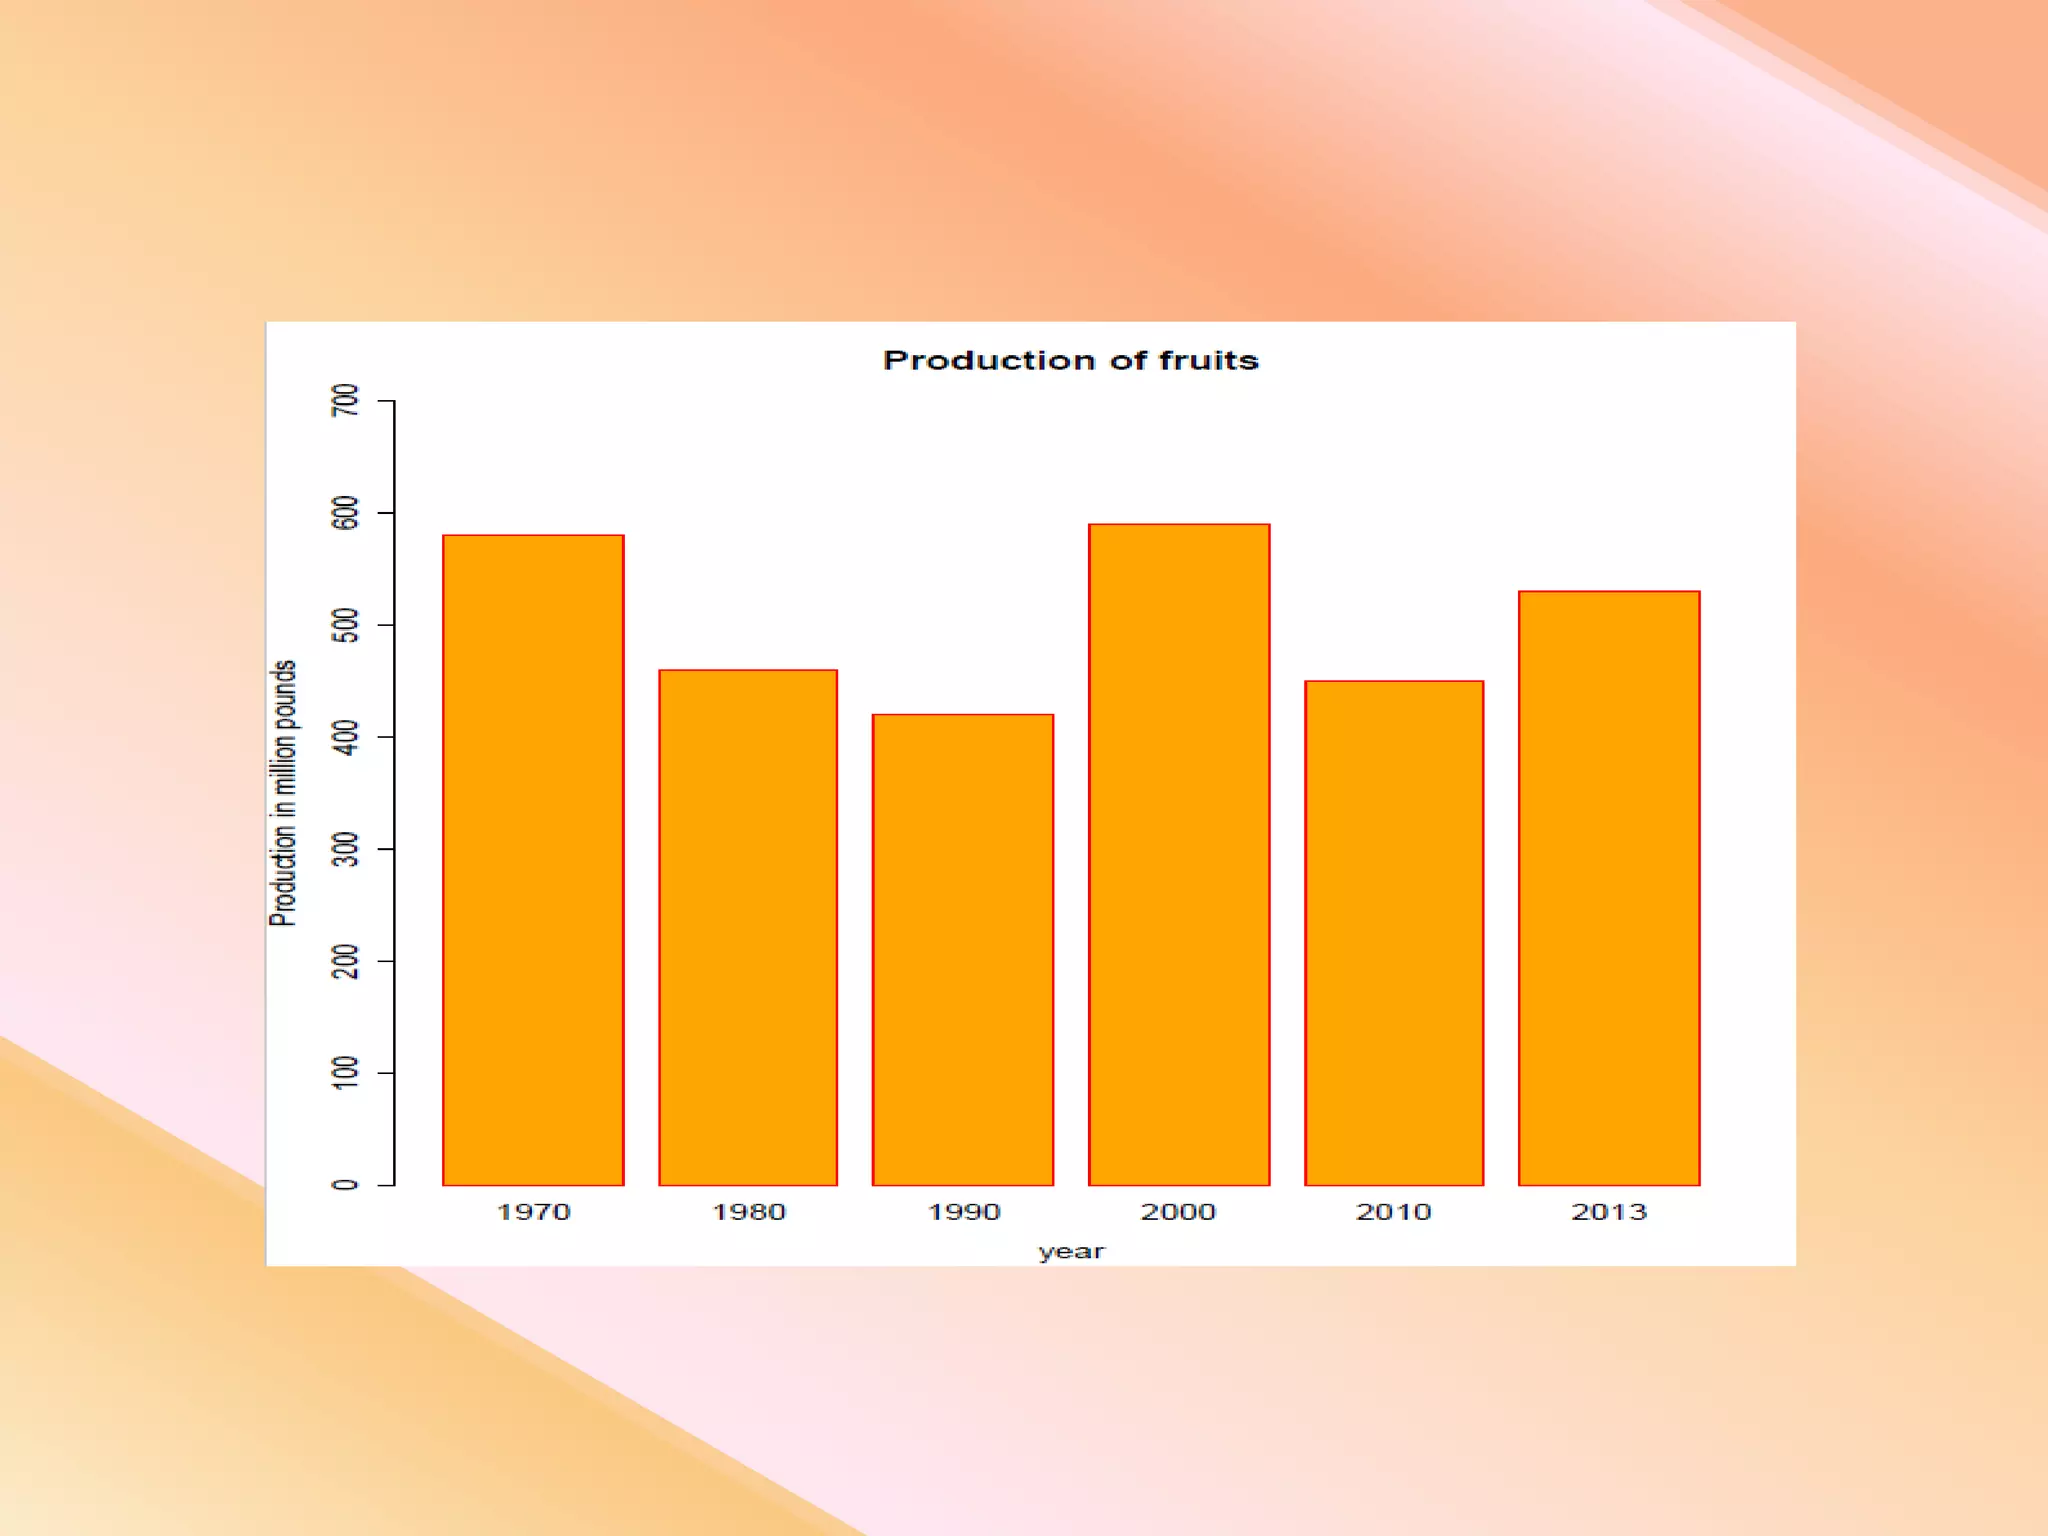

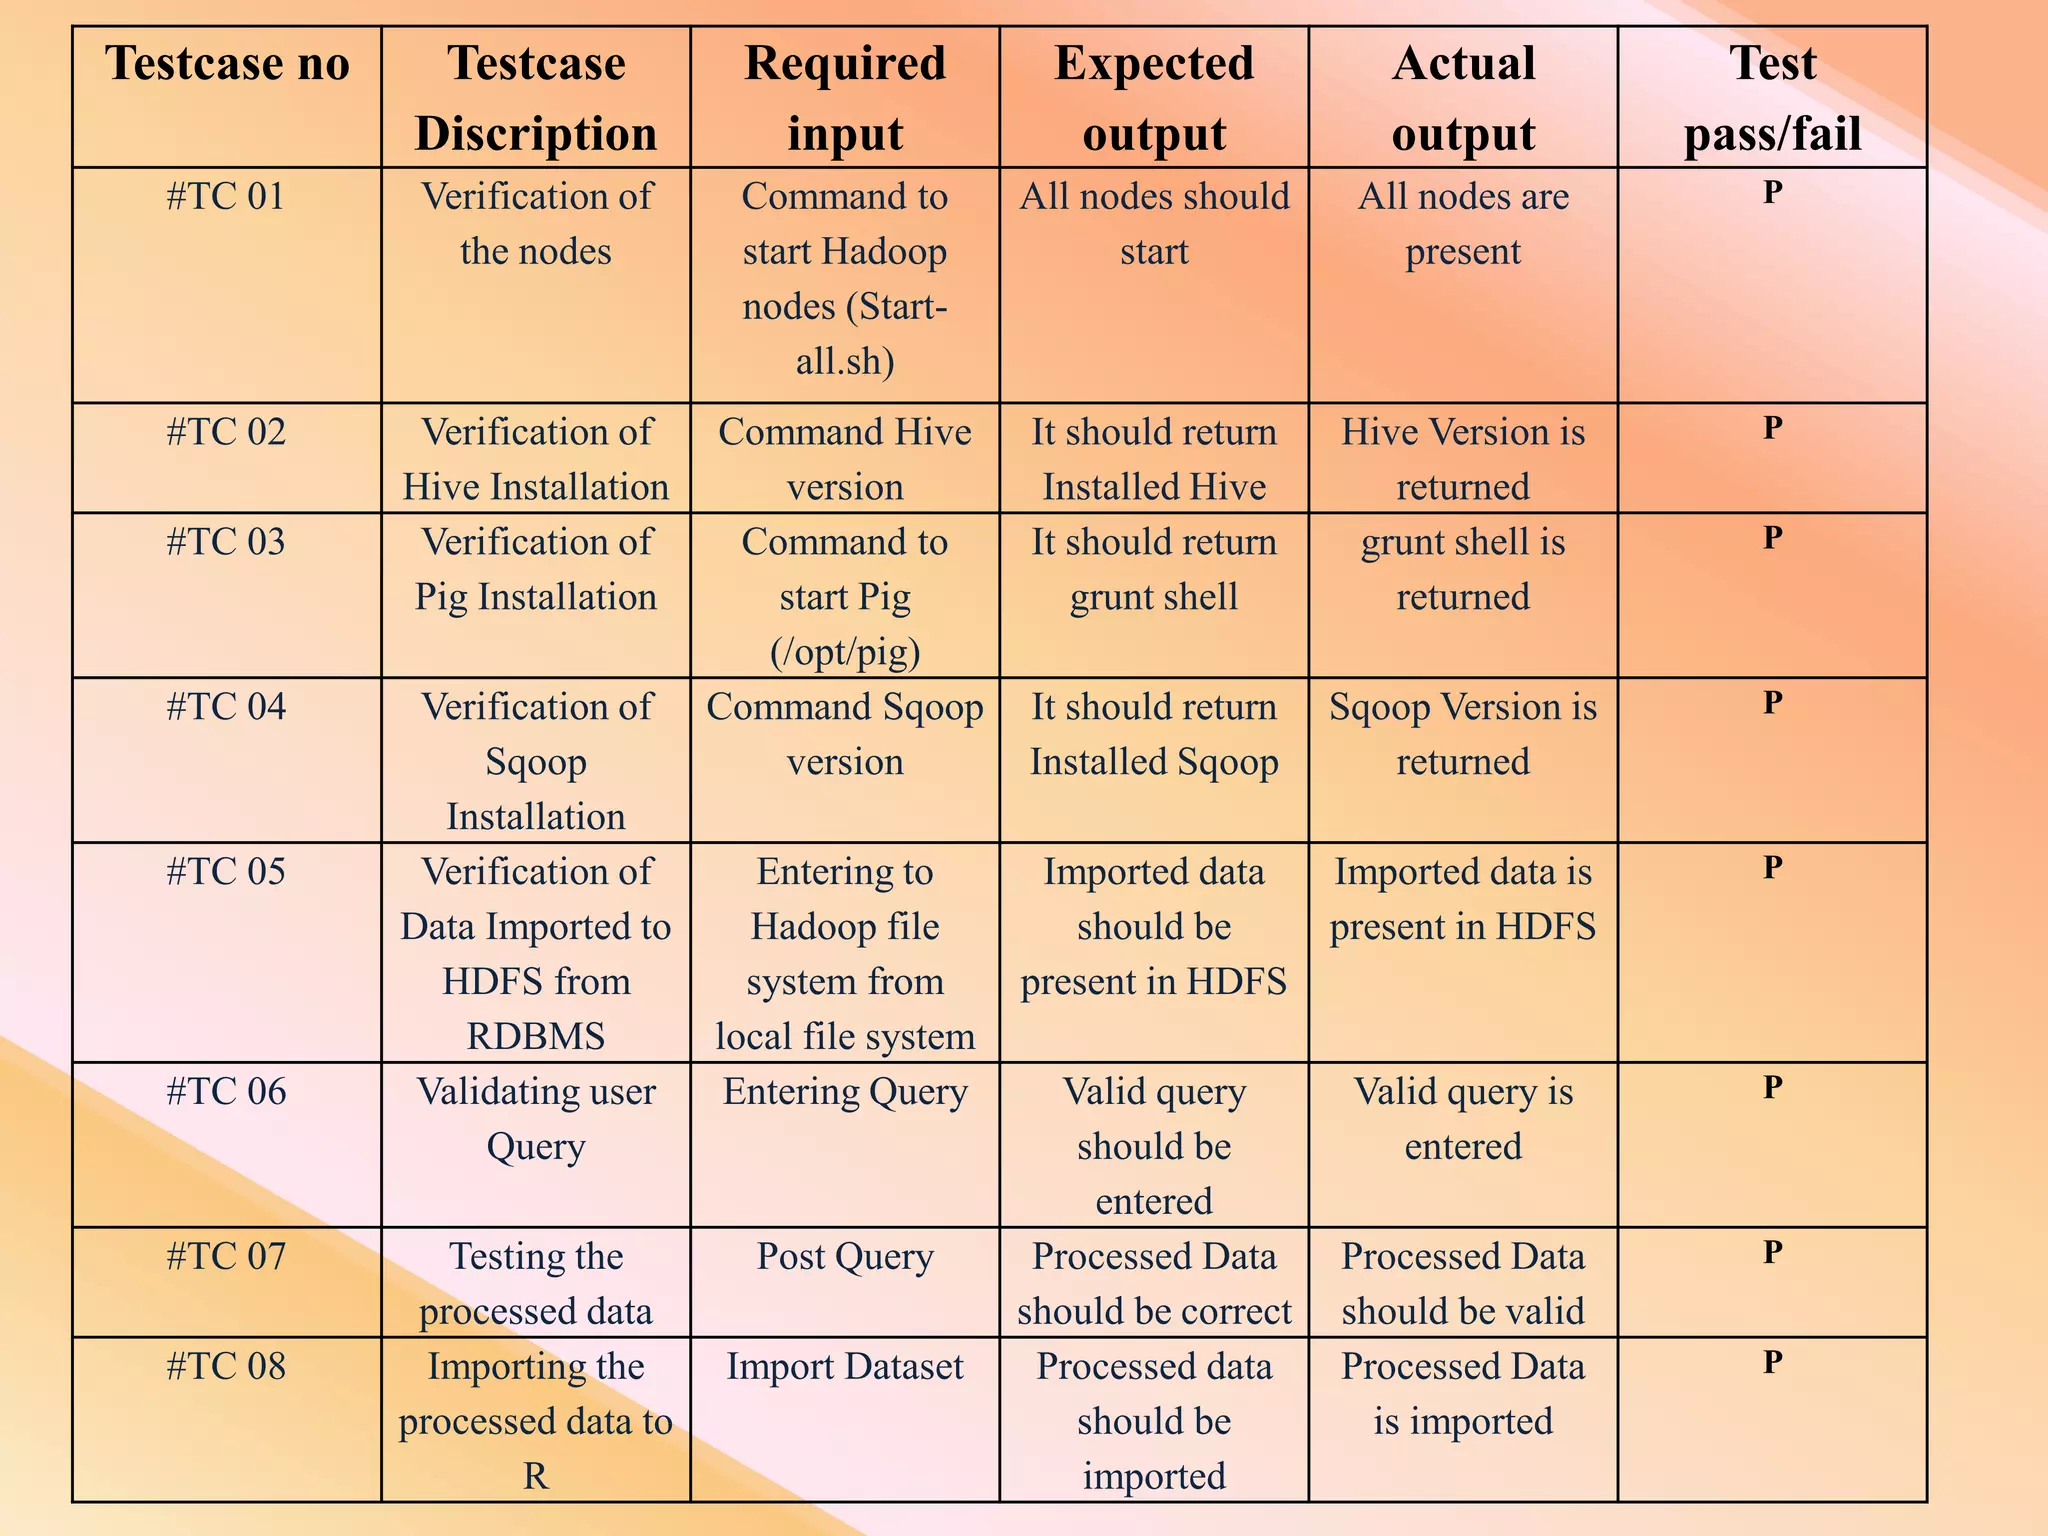
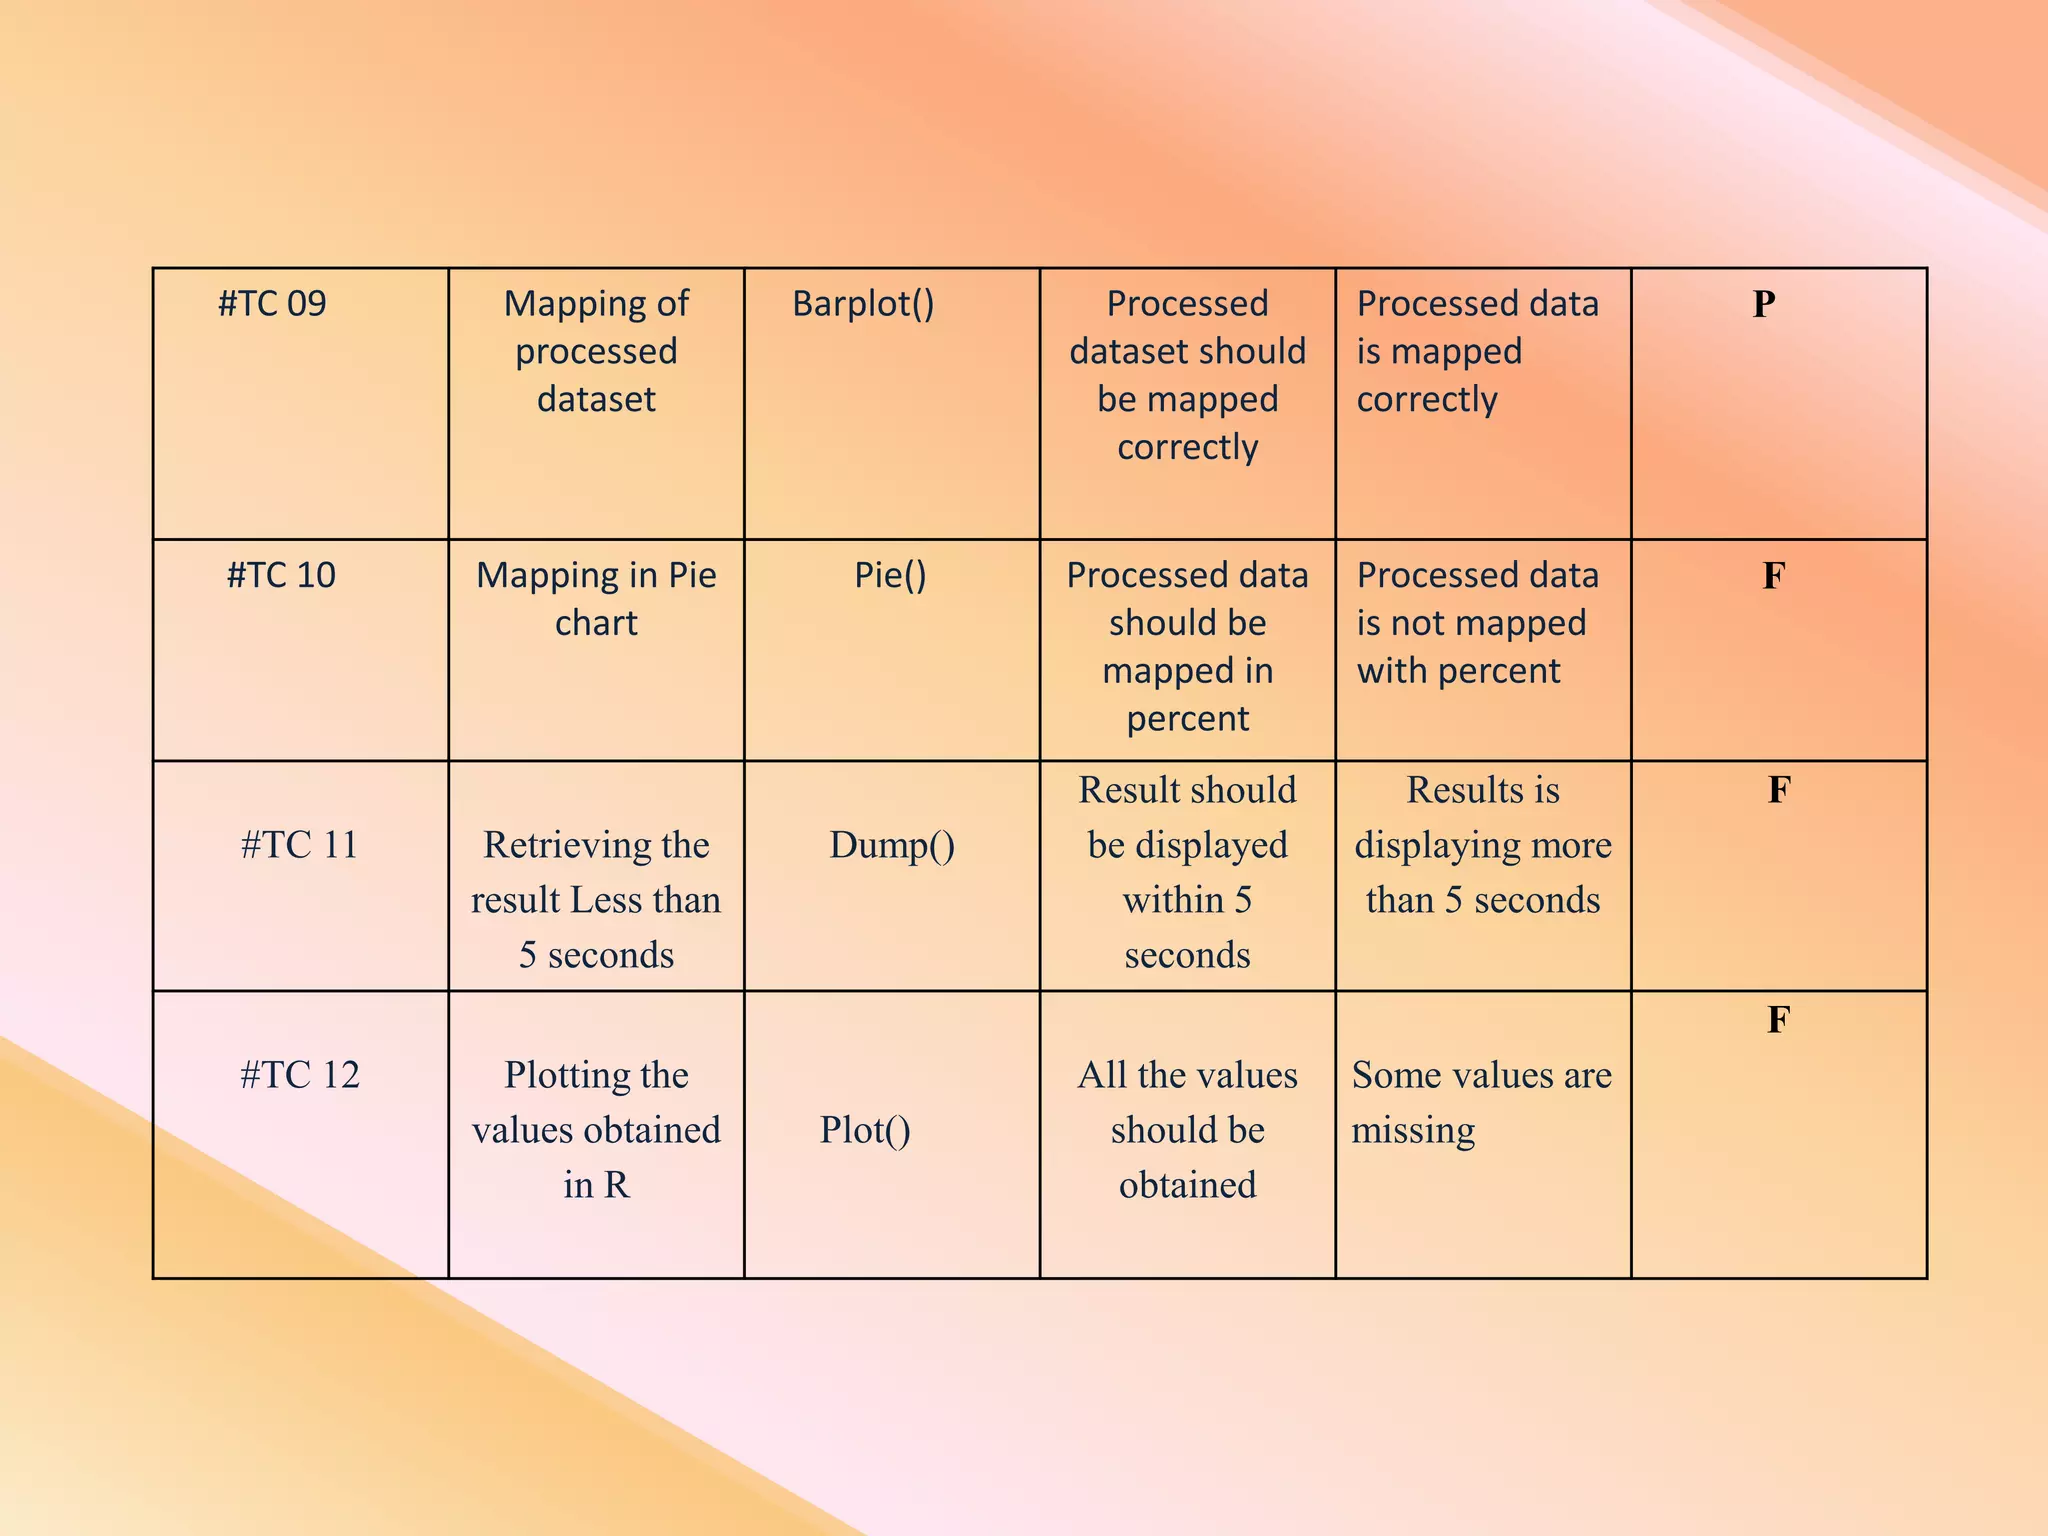
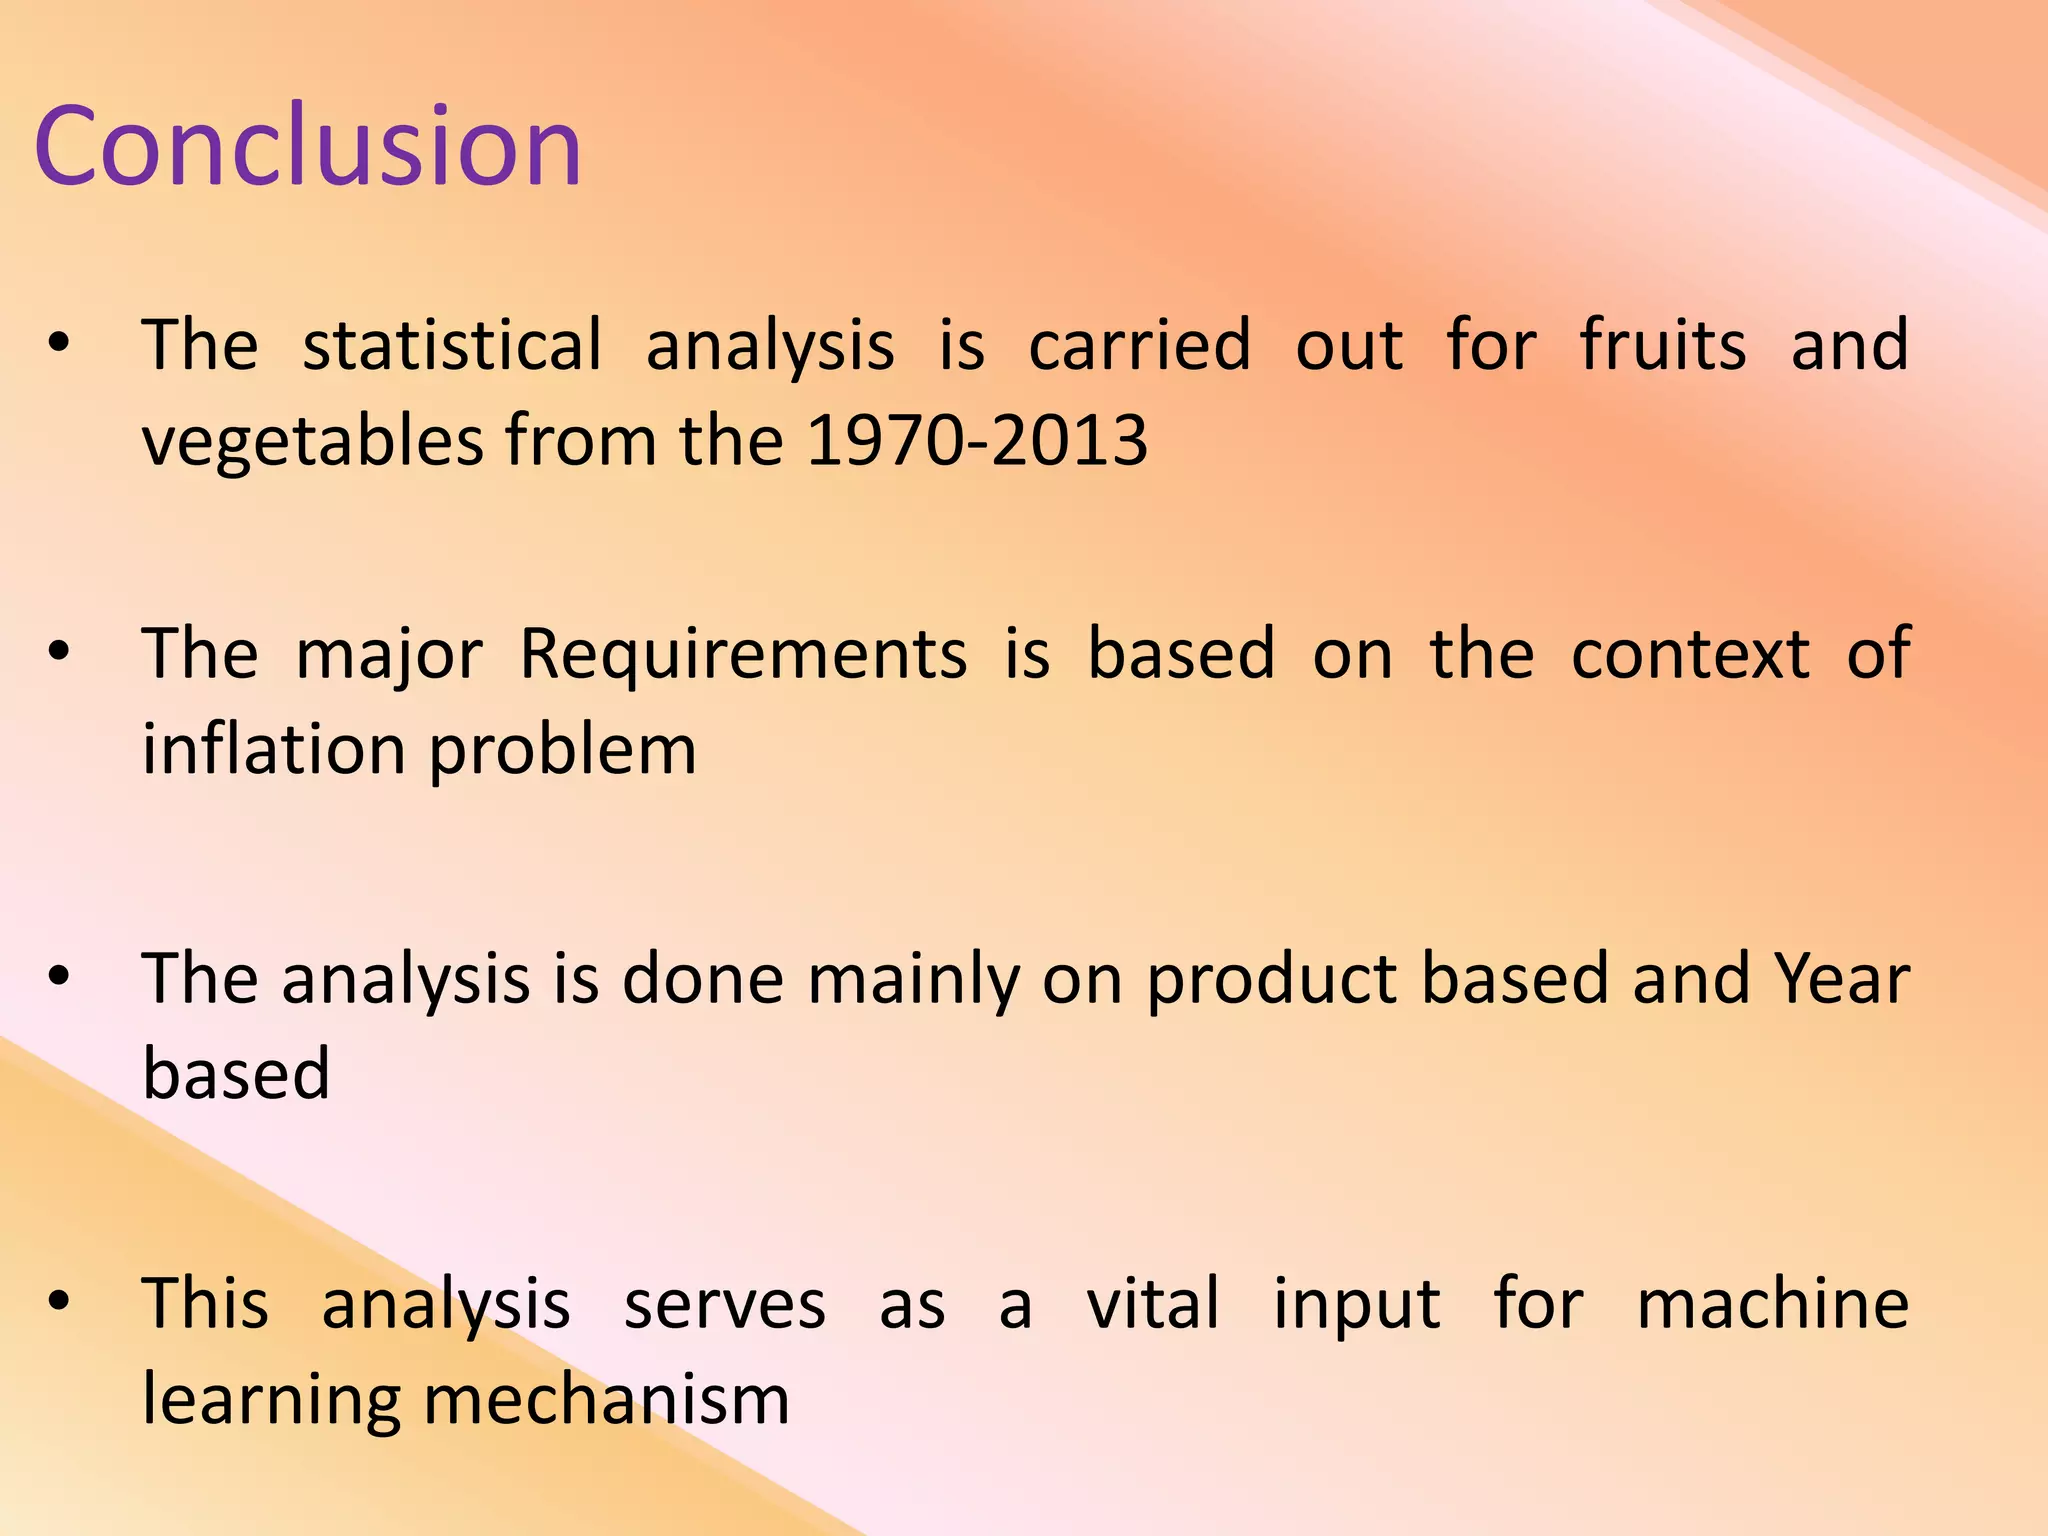
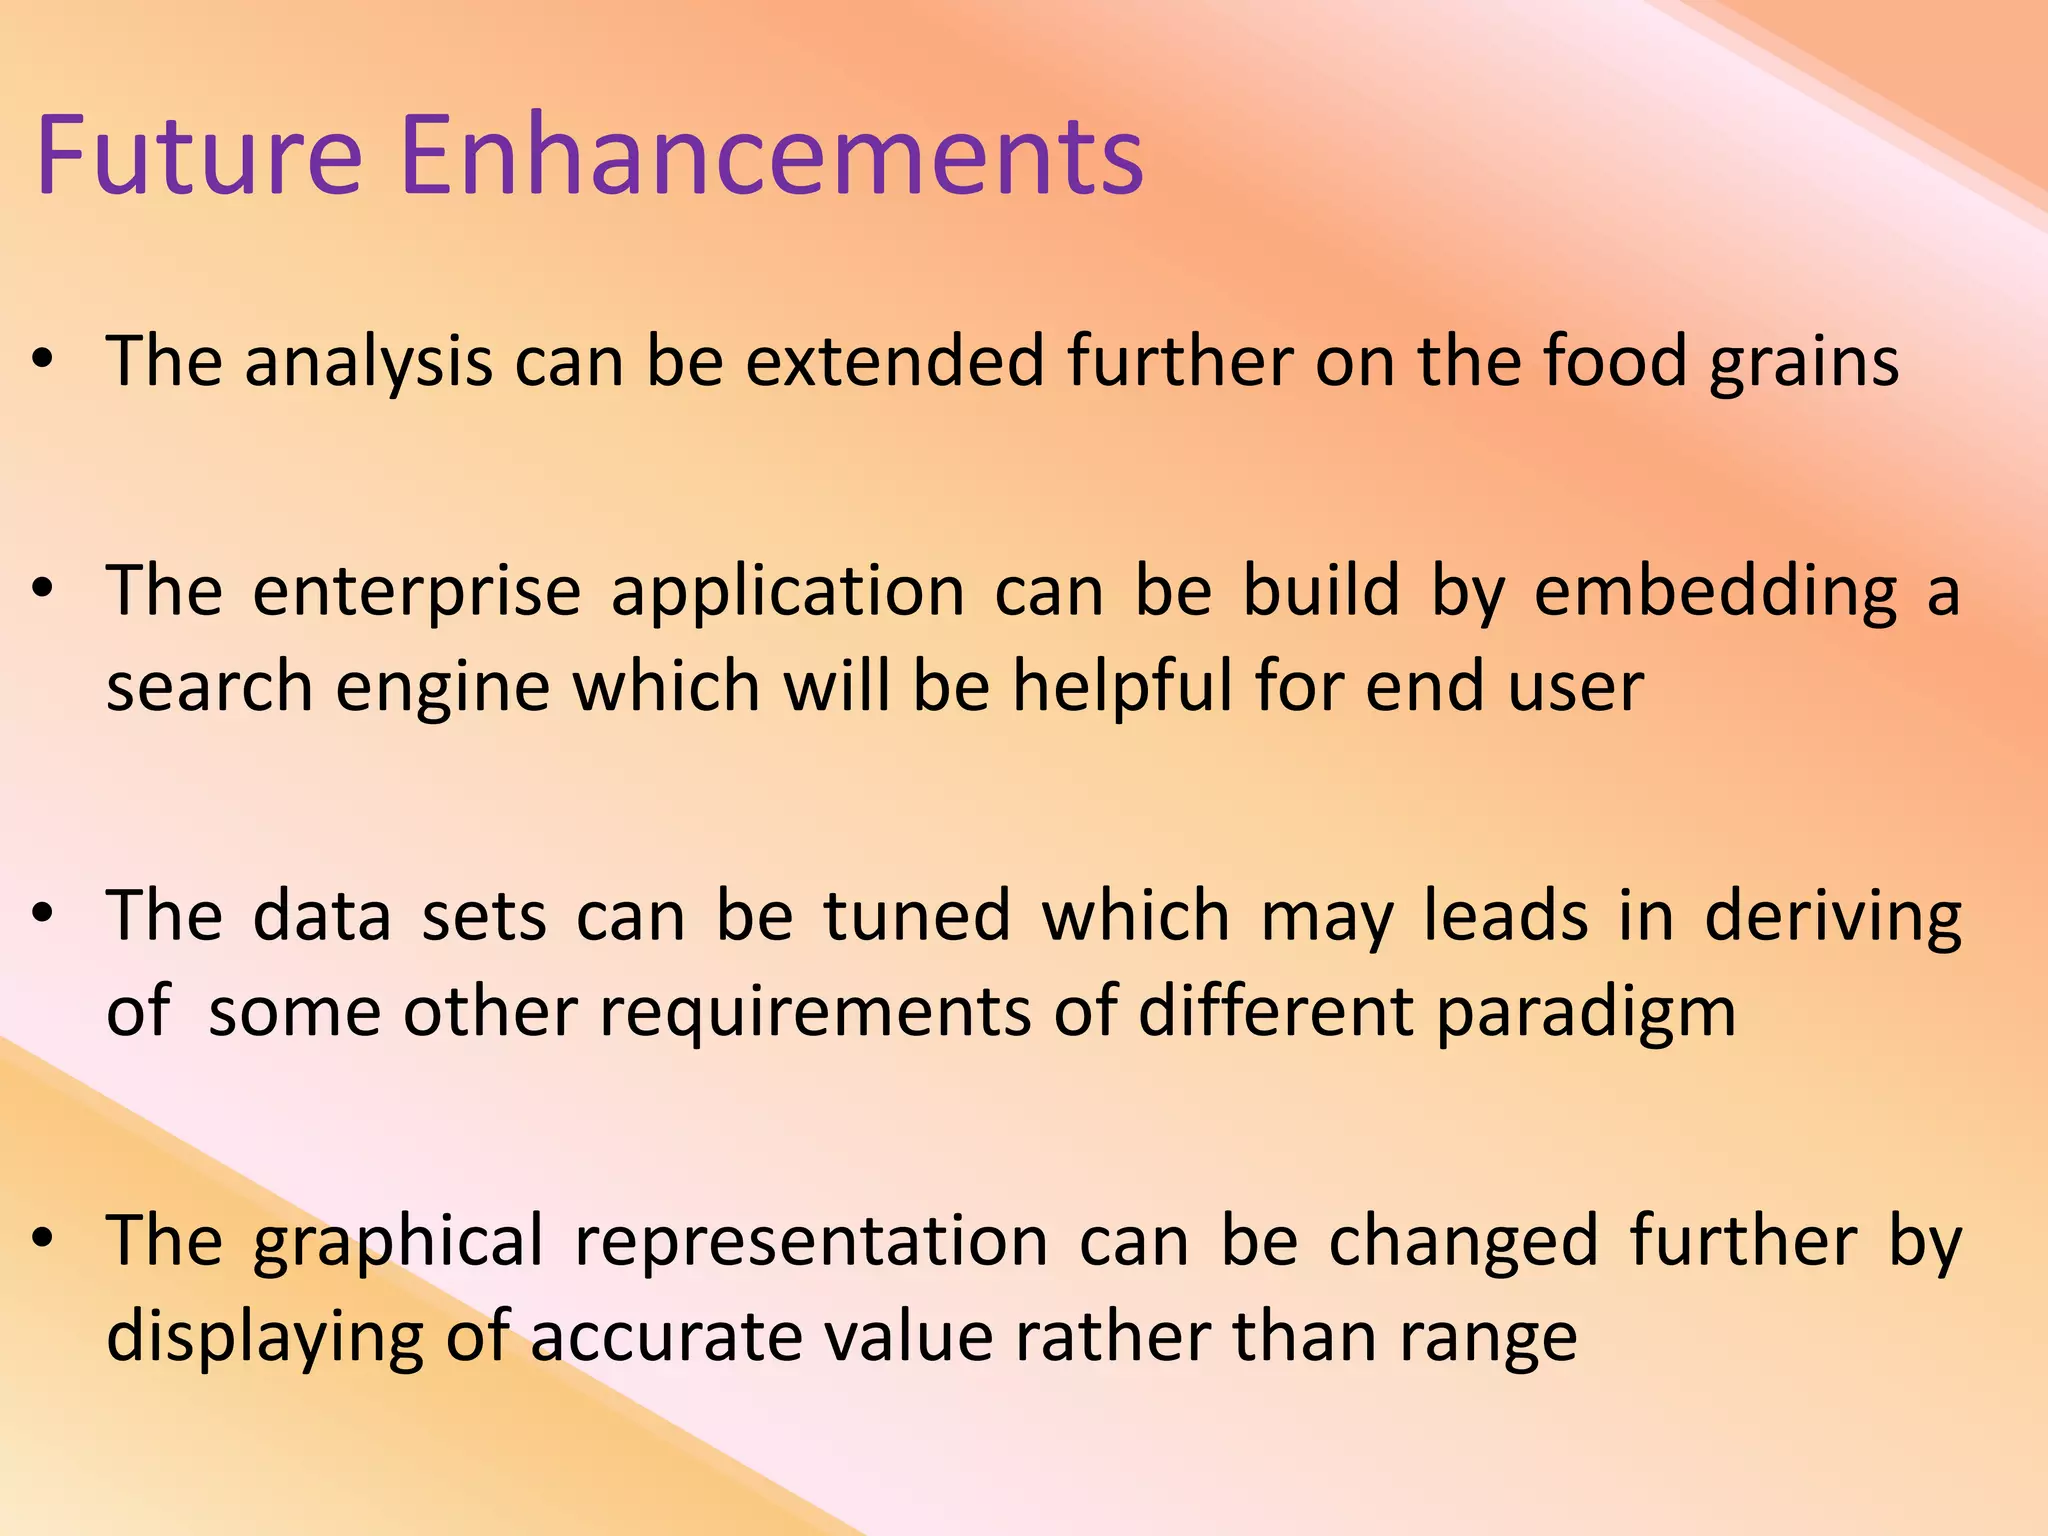


This document presents an analysis of economic data using big data techniques. The objectives are to examine food price data over time to understand inflation trends and ensure adequate supply. Hadoop is used to store and process the large economic datasets using MapReduce. The data is imported from databases into HDFS and analyzed using Hive, Pig, and R. Test cases validate the data processing and visualization in graphs/charts. While most tests pass, some fail due to missing values or slow results. The analysis can be expanded to additional crops and an enterprise search application built for users.