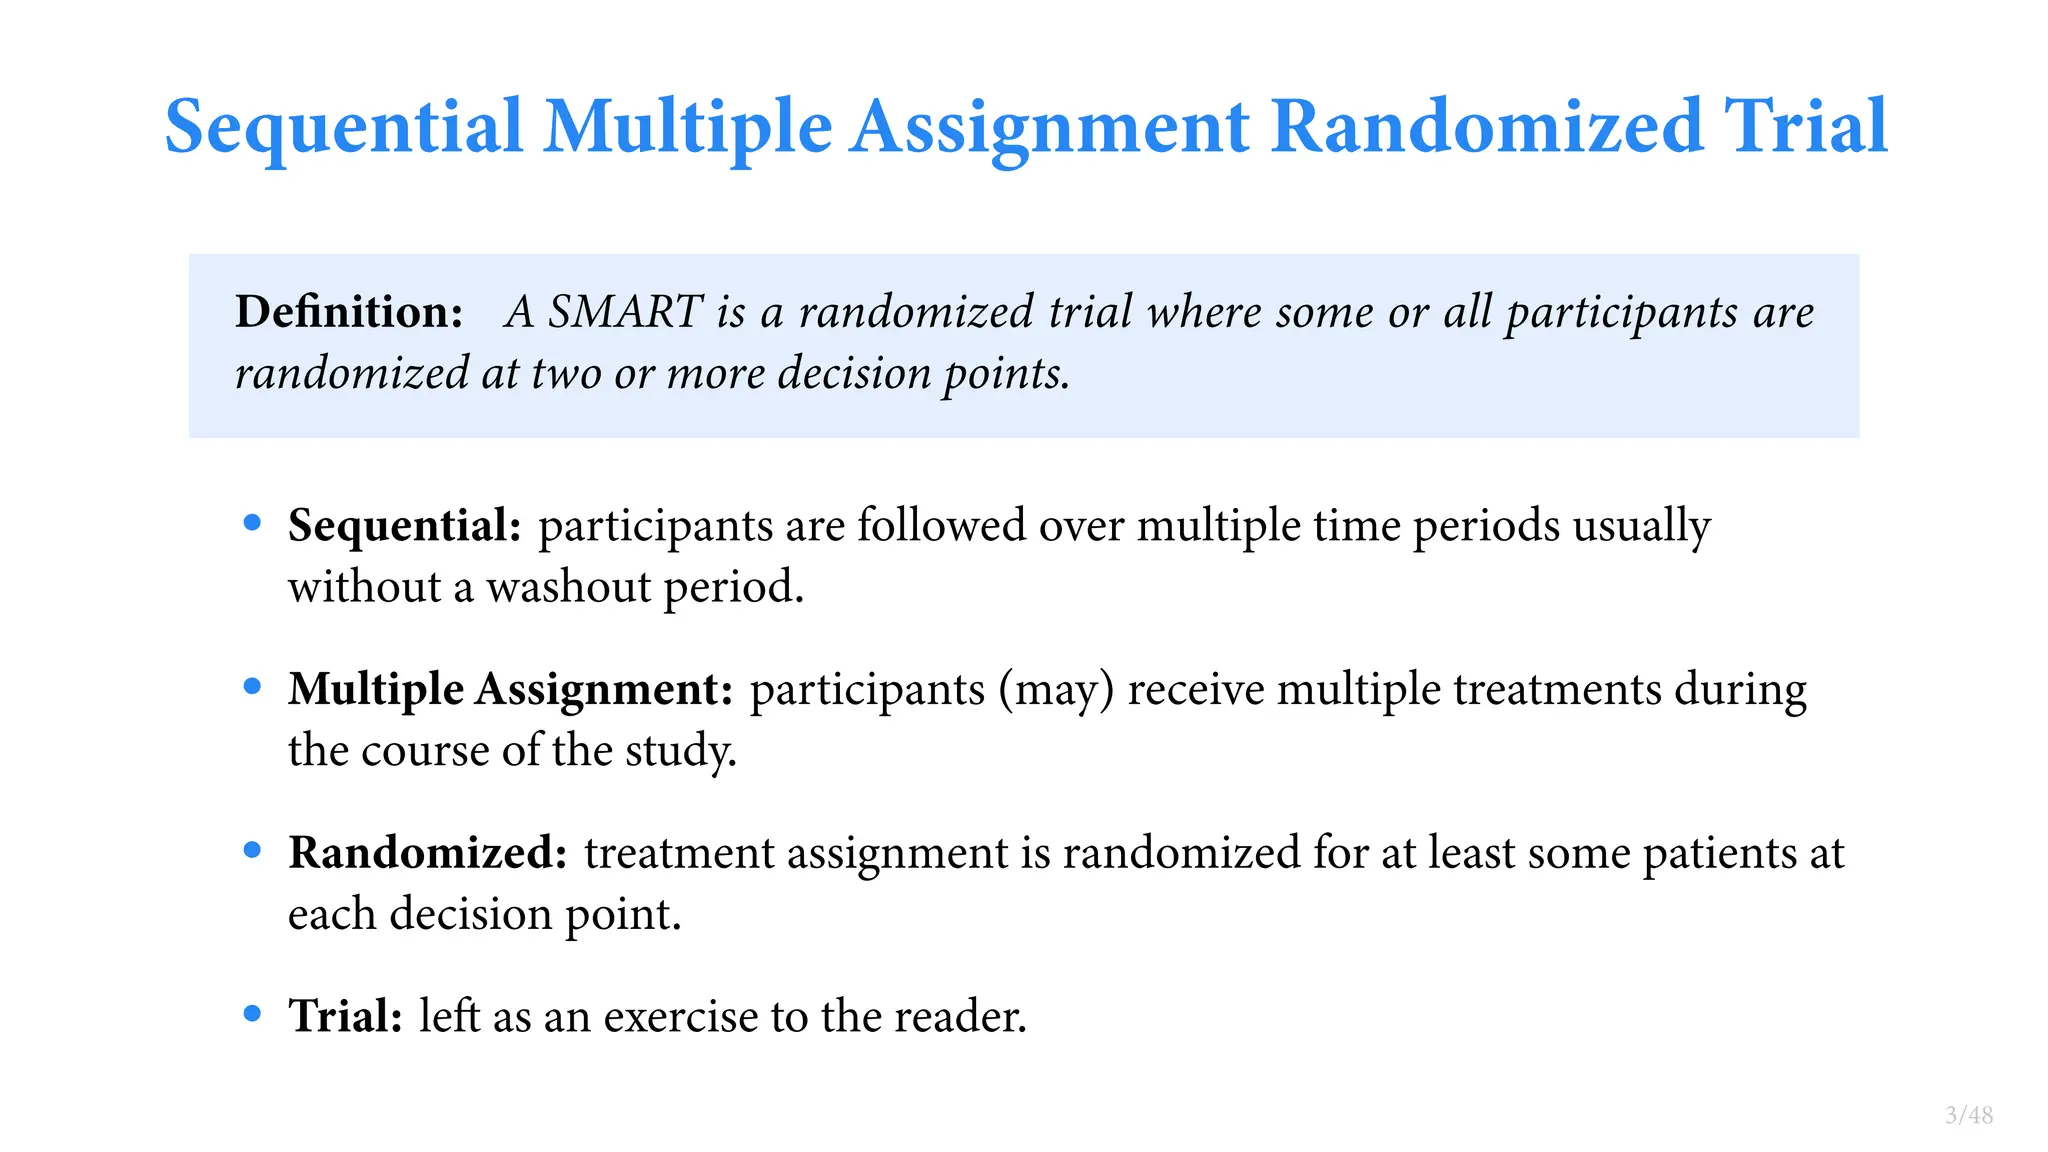
Sequential Multiple Assignment Randomized Trials (SMARTs) are clinical trials where participants are randomized to different treatment options at multiple time points. SMARTs aim to mimic real-world clinical decision making by identifying important decision points over the course of treatment and randomizing according to realistic options at each point. This allows SMARTs to provide evidence for optimal treatment policies that account for patient characteristics and history. Precision medicine uses statistical methods to formalize individualized treatment based on a patient's profile, with the goal of providing the right treatment to the right patient at the right time. SMARTs are well-suited to develop and evaluate precision medicine treatment strategies.


![Notation
Let [𝐾] denote the set {1, … , 𝐾} for a positive integer 𝐾. For individual 𝑛 ∈ [𝑁] at
stage 𝑠 ∈ [𝑆] their data is given by:
17/48](https://image.slidesharecdn.com/2023-11-30-ct-presentation-240301165120-f0d0ddf7/75/An-Introduction-to-Sequential-Multiple-Assignment-Randomized-Trials-SMARTs-31-2048.jpg)
![Notation
Let [𝐾] denote the set {1, … , 𝐾} for a positive integer 𝐾. For individual 𝑛 ∈ [𝑁] at
stage 𝑠 ∈ [𝑆] their data is given by:
• 𝑋𝑠𝑛 ∈ 𝓧𝑠 ⊆ ℝ𝑑𝑠 denotes the covariates
• 𝐴𝑠𝑛 ∈ 𝓐𝑠 denotes the treatment arm
• 𝑌𝑠𝑛 ∈ ℝ denotes the response
17/48](https://image.slidesharecdn.com/2023-11-30-ct-presentation-240301165120-f0d0ddf7/75/An-Introduction-to-Sequential-Multiple-Assignment-Randomized-Trials-SMARTs-32-2048.jpg)
![Notation
Let [𝐾] denote the set {1, … , 𝐾} for a positive integer 𝐾. For individual 𝑛 ∈ [𝑁] at
stage 𝑠 ∈ [𝑆] their data is given by:
• 𝑋𝑠𝑛 ∈ 𝓧𝑠 ⊆ ℝ𝑑𝑠 denotes the covariates
• 𝐴𝑠𝑛 ∈ 𝓐𝑠 denotes the treatment arm
• 𝑌𝑠𝑛 ∈ ℝ denotes the response
We’ll consider a two-stage SMART for exposition. The generalization to finitely
many more stages is straightforward. The study data is comprised of iid replicates
17/48](https://image.slidesharecdn.com/2023-11-30-ct-presentation-240301165120-f0d0ddf7/75/An-Introduction-to-Sequential-Multiple-Assignment-Randomized-Trials-SMARTs-33-2048.jpg)
![Notation
Let [𝐾] denote the set {1, … , 𝐾} for a positive integer 𝐾. For individual 𝑛 ∈ [𝑁] at
stage 𝑠 ∈ [𝑆] their data is given by:
• 𝑋𝑠𝑛 ∈ 𝓧𝑠 ⊆ ℝ𝑑𝑠 denotes the covariates
• 𝐴𝑠𝑛 ∈ 𝓐𝑠 denotes the treatment arm
• 𝑌𝑠𝑛 ∈ ℝ denotes the response
We’ll consider a two-stage SMART for exposition. The generalization to finitely
many more stages is straightforward. The study data is comprised of iid replicates
{𝑋1𝑛, 𝐴1𝑛, 𝑌1𝑛, 𝑋2𝑛, 𝐴2𝑛, 𝑌2𝑛}𝑁
𝑛=1 (1)
17/48](https://image.slidesharecdn.com/2023-11-30-ct-presentation-240301165120-f0d0ddf7/75/An-Introduction-to-Sequential-Multiple-Assignment-Randomized-Trials-SMARTs-34-2048.jpg)
![Notation
Let [𝐾] denote the set {1, … , 𝐾} for a positive integer 𝐾. For individual 𝑛 ∈ [𝑁] at
stage 𝑠 ∈ [𝑆] their data is given by:
• 𝑋𝑠𝑛 ∈ 𝓧𝑠 ⊆ ℝ𝑑𝑠 denotes the covariates
• 𝐴𝑠𝑛 ∈ 𝓐𝑠 denotes the treatment arm
• 𝑌𝑠𝑛 ∈ ℝ denotes the response
We’ll consider a two-stage SMART for exposition. The generalization to finitely
many more stages is straightforward. The study data is comprised of iid replicates
{𝑋1𝑛, 𝐴1𝑛, 𝑌1𝑛, 𝑋2𝑛, 𝐴2𝑛, 𝑌2𝑛}𝑁
𝑛=1 (1)
Depending on author, context etc. 𝑌𝑠𝑛 may be included in 𝑋(𝑠+1)𝑛 for 𝑠 = 2, … , 𝑆 − 1.
Then there is only a single 𝑌 and it is the ultimate response (𝑌𝑆𝑛 in the other notation)
17/48](https://image.slidesharecdn.com/2023-11-30-ct-presentation-240301165120-f0d0ddf7/75/An-Introduction-to-Sequential-Multiple-Assignment-Randomized-Trials-SMARTs-35-2048.jpg)


![What does it mean for a policy to be optimal?
Define the value of a policy 𝜋 as
V(𝜋) = I
E𝑋[𝑌∗(𝑎 = 𝜋(𝑋))] (2)
An optimal policy 𝜋∗ is any policy that satisfies
V(𝜋∗) ≥ V(𝜋) for all 𝜋 ∈ Π (3)
19/48](https://image.slidesharecdn.com/2023-11-30-ct-presentation-240301165120-f0d0ddf7/75/An-Introduction-to-Sequential-Multiple-Assignment-Randomized-Trials-SMARTs-39-2048.jpg)
![Exercise: Write Out the Optimal Policy
Suppose we have three treatments 𝐴1, 𝐴2, 𝐴3 and a single binary tailoring variable
𝑋 ∈ {0, 1} where 𝑋 ∼ Bernoulli(.5).
I
E[𝑌] = .4𝐴1 + .3𝐴2 + .5𝐴2 + .3𝑋𝐴2
20/48](https://image.slidesharecdn.com/2023-11-30-ct-presentation-240301165120-f0d0ddf7/75/An-Introduction-to-Sequential-Multiple-Assignment-Randomized-Trials-SMARTs-40-2048.jpg)
![Exercise: Write Out the Optimal Policy
Suppose we have three treatments 𝐴1, 𝐴2, 𝐴3 and a single binary tailoring variable
𝑋 ∈ {0, 1} where 𝑋 ∼ Bernoulli(.5).
I
E[𝑌] = .4𝐴1 + .3𝐴2 + .5𝐴2 + .3𝑋𝐴2
Questions
What is the optimal policy 𝜋∗ that does not involve 𝑋? That is what is the policy 𝜋
that maximizes 𝐸[𝑌] if treatment must be assigned without using the value of 𝑥?
Does the optimal policy change if 𝑋 ∼ Bernoulli(.95)?
What is the optimal policy if we can use the observed 𝑥 to assign treatment? Does
the mean of 𝑋 matter in this case?
20/48](https://image.slidesharecdn.com/2023-11-30-ct-presentation-240301165120-f0d0ddf7/75/An-Introduction-to-Sequential-Multiple-Assignment-Randomized-Trials-SMARTs-41-2048.jpg)
![Exercise continued
Table: Expected Response by Covariate and Treatment Value
𝐴 𝑋 𝐸[𝑌]
1 0 0.4
1 1 0.4
2 0 0.3
2 1 0.6
3 0 0.5
3 1 0.5
I
E[𝜋(𝑋)] = I
E[𝜋(𝑋)|𝑋 = 0]𝑃(𝑋 = 0) + I
E[𝜋(𝑋)|𝑋 = 1]𝑃(𝑋 = 1)
21/48](https://image.slidesharecdn.com/2023-11-30-ct-presentation-240301165120-f0d0ddf7/75/An-Introduction-to-Sequential-Multiple-Assignment-Randomized-Trials-SMARTs-42-2048.jpg)


![Q-learning18
Assume that there are 𝑆 = 2 stages, 𝐾𝑠 treatments in each stage, and we are interested
in the ultimate outcome 𝑌 = 𝑌2.
1. Estimate I
E[𝑌|𝑋1, 𝐴1, 𝑋2, 𝐴2] ≐ ̂
𝑓2(𝑥1, 𝑎1, 𝑥2, 𝑎2) using your favorite regression
function 𝑓2.
18
Typically what statisticians call Q-learning is referred to as Q-learning with function approximation in the CS literature. What CS people call
Q-learning is fully nonparametric and statisticians will refer to it as tabular Q-learning.
35/48](https://image.slidesharecdn.com/2023-11-30-ct-presentation-240301165120-f0d0ddf7/75/An-Introduction-to-Sequential-Multiple-Assignment-Randomized-Trials-SMARTs-69-2048.jpg)
![Q-learning18
Assume that there are 𝑆 = 2 stages, 𝐾𝑠 treatments in each stage, and we are interested
in the ultimate outcome 𝑌 = 𝑌2.
1. Estimate I
E[𝑌|𝑋1, 𝐴1, 𝑋2, 𝐴2] ≐ ̂
𝑓2(𝑥1, 𝑎1, 𝑥2, 𝑎2) using your favorite regression
function 𝑓2.
2. Determine the second-stage estimated optimal treatment rule
̂
𝜋2(𝑥) = argmax𝑘∈𝐾2
̂
𝑓2(𝐴2 = 𝑘, 𝑥2, 𝑎1)
18
Typically what statisticians call Q-learning is referred to as Q-learning with function approximation in the CS literature. What CS people call
Q-learning is fully nonparametric and statisticians will refer to it as tabular Q-learning.
35/48](https://image.slidesharecdn.com/2023-11-30-ct-presentation-240301165120-f0d0ddf7/75/An-Introduction-to-Sequential-Multiple-Assignment-Randomized-Trials-SMARTs-70-2048.jpg)
![Q-learning18
Assume that there are 𝑆 = 2 stages, 𝐾𝑠 treatments in each stage, and we are interested
in the ultimate outcome 𝑌 = 𝑌2.
1. Estimate I
E[𝑌|𝑋1, 𝐴1, 𝑋2, 𝐴2] ≐ ̂
𝑓2(𝑥1, 𝑎1, 𝑥2, 𝑎2) using your favorite regression
function 𝑓2.
2. Determine the second-stage estimated optimal treatment rule
̂
𝜋2(𝑥) = argmax𝑘∈𝐾2
̂
𝑓2(𝐴2 = 𝑘, 𝑥2, 𝑎1)
3. Calculate the expected response had everyone been given their estimated
optimal treatment ̃
𝐴2: ̃
𝑌 = ̂
𝑓2( ̃
𝐴2 = ̂
𝜋2(𝑥2, 𝑎1), 𝑥2, 𝑎1)
18
Typically what statisticians call Q-learning is referred to as Q-learning with function approximation in the CS literature. What CS people call
Q-learning is fully nonparametric and statisticians will refer to it as tabular Q-learning.
35/48](https://image.slidesharecdn.com/2023-11-30-ct-presentation-240301165120-f0d0ddf7/75/An-Introduction-to-Sequential-Multiple-Assignment-Randomized-Trials-SMARTs-71-2048.jpg)
![Q-learning18
Assume that there are 𝑆 = 2 stages, 𝐾𝑠 treatments in each stage, and we are interested
in the ultimate outcome 𝑌 = 𝑌2.
1. Estimate I
E[𝑌|𝑋1, 𝐴1, 𝑋2, 𝐴2] ≐ ̂
𝑓2(𝑥1, 𝑎1, 𝑥2, 𝑎2) using your favorite regression
function 𝑓2.
2. Determine the second-stage estimated optimal treatment rule
̂
𝜋2(𝑥) = argmax𝑘∈𝐾2
̂
𝑓2(𝐴2 = 𝑘, 𝑥2, 𝑎1)
3. Calculate the expected response had everyone been given their estimated
optimal treatment ̃
𝐴2: ̃
𝑌 = ̂
𝑓2( ̃
𝐴2 = ̂
𝜋2(𝑥2, 𝑎1), 𝑥2, 𝑎1)
4. Estimate I
E[ ̃
𝑌|𝑋1, 𝐴1] ≐ ̂
𝑓1(𝑥1, 𝑎1)
18
Typically what statisticians call Q-learning is referred to as Q-learning with function approximation in the CS literature. What CS people call
Q-learning is fully nonparametric and statisticians will refer to it as tabular Q-learning.
35/48](https://image.slidesharecdn.com/2023-11-30-ct-presentation-240301165120-f0d0ddf7/75/An-Introduction-to-Sequential-Multiple-Assignment-Randomized-Trials-SMARTs-72-2048.jpg)
![Q-learning18
Assume that there are 𝑆 = 2 stages, 𝐾𝑠 treatments in each stage, and we are interested
in the ultimate outcome 𝑌 = 𝑌2.
1. Estimate I
E[𝑌|𝑋1, 𝐴1, 𝑋2, 𝐴2] ≐ ̂
𝑓2(𝑥1, 𝑎1, 𝑥2, 𝑎2) using your favorite regression
function 𝑓2.
2. Determine the second-stage estimated optimal treatment rule
̂
𝜋2(𝑥) = argmax𝑘∈𝐾2
̂
𝑓2(𝐴2 = 𝑘, 𝑥2, 𝑎1)
3. Calculate the expected response had everyone been given their estimated
optimal treatment ̃
𝐴2: ̃
𝑌 = ̂
𝑓2( ̃
𝐴2 = ̂
𝜋2(𝑥2, 𝑎1), 𝑥2, 𝑎1)
4. Estimate I
E[ ̃
𝑌|𝑋1, 𝐴1] ≐ ̂
𝑓1(𝑥1, 𝑎1)
5. Determine the first-stage optimal treatment rule
̂
𝜋1(𝑥) = argmax𝑘∈𝐾1
̂
𝑓1(𝐴1 = 𝑘, 𝑥1)
18
Typically what statisticians call Q-learning is referred to as Q-learning with function approximation in the CS literature. What CS people call
Q-learning is fully nonparametric and statisticians will refer to it as tabular Q-learning.
35/48](https://image.slidesharecdn.com/2023-11-30-ct-presentation-240301165120-f0d0ddf7/75/An-Introduction-to-Sequential-Multiple-Assignment-Randomized-Trials-SMARTs-73-2048.jpg)
![Q-learning18
Assume that there are 𝑆 = 2 stages, 𝐾𝑠 treatments in each stage, and we are interested
in the ultimate outcome 𝑌 = 𝑌2.
1. Estimate I
E[𝑌|𝑋1, 𝐴1, 𝑋2, 𝐴2] ≐ ̂
𝑓2(𝑥1, 𝑎1, 𝑥2, 𝑎2) using your favorite regression
function 𝑓2.
2. Determine the second-stage estimated optimal treatment rule
̂
𝜋2(𝑥) = argmax𝑘∈𝐾2
̂
𝑓2(𝐴2 = 𝑘, 𝑥2, 𝑎1)
3. Calculate the expected response had everyone been given their estimated
optimal treatment ̃
𝐴2: ̃
𝑌 = ̂
𝑓2( ̃
𝐴2 = ̂
𝜋2(𝑥2, 𝑎1), 𝑥2, 𝑎1)
4. Estimate I
E[ ̃
𝑌|𝑋1, 𝐴1] ≐ ̂
𝑓1(𝑥1, 𝑎1)
5. Determine the first-stage optimal treatment rule
̂
𝜋1(𝑥) = argmax𝑘∈𝐾1
̂
𝑓1(𝐴1 = 𝑘, 𝑥1)
The estimated optimal policy is ̂
𝜋 = (̂
𝜋1, ̂
𝜋2)
18
Typically what statisticians call Q-learning is referred to as Q-learning with function approximation in the CS literature. What CS people call
Q-learning is fully nonparametric and statisticians will refer to it as tabular Q-learning.
35/48](https://image.slidesharecdn.com/2023-11-30-ct-presentation-240301165120-f0d0ddf7/75/An-Introduction-to-Sequential-Multiple-Assignment-Randomized-Trials-SMARTs-74-2048.jpg)


![Value Functions
1. Conditional Value of the estimated optimal policy
I
E𝑋[̂
𝜋𝑛(𝑋)|̂
𝜋𝑛] = P ̂
𝜋𝑛(𝑋)
2. (Expected) Value of an estimated optimal policy
I
E𝑋[̂
𝜋𝑛(𝑋)]
3. Value of the optimal policy
I
E𝑋[𝜋∗(𝑋)] = P 𝜋∗(𝑋)
38/48](https://image.slidesharecdn.com/2023-11-30-ct-presentation-240301165120-f0d0ddf7/75/An-Introduction-to-Sequential-Multiple-Assignment-Randomized-Trials-SMARTs-77-2048.jpg)
![Value Functions
1. Conditional Value of the estimated optimal policy
I
E𝑋[̂
𝜋𝑛(𝑋)|̂
𝜋𝑛] = P ̂
𝜋𝑛(𝑋)
2. (Expected) Value of an estimated optimal policy
I
E𝑋[̂
𝜋𝑛(𝑋)]
3. Value of the optimal policy
I
E𝑋[𝜋∗(𝑋)] = P 𝜋∗(𝑋)
Are estimators of these functions asymptotically equivalent?
38/48](https://image.slidesharecdn.com/2023-11-30-ct-presentation-240301165120-f0d0ddf7/75/An-Introduction-to-Sequential-Multiple-Assignment-Randomized-Trials-SMARTs-78-2048.jpg)
![Value Functions
1. Conditional Value of the estimated optimal policy
I
E𝑋[̂
𝜋𝑛(𝑋)|̂
𝜋𝑛] = P ̂
𝜋𝑛(𝑋)
2. (Expected) Value of an estimated optimal policy
I
E𝑋[̂
𝜋𝑛(𝑋)]
3. Value of the optimal policy
I
E𝑋[𝜋∗(𝑋)] = P 𝜋∗(𝑋)
Are estimators of these functions asymptotically equivalent?
Brainstorm a scenario for each of the value functions where that estimand would
make the most sense.
38/48](https://image.slidesharecdn.com/2023-11-30-ct-presentation-240301165120-f0d0ddf7/75/An-Introduction-to-Sequential-Multiple-Assignment-Randomized-Trials-SMARTs-79-2048.jpg)
![Estimating the Value Function
• Model-based — seldom used. Why? Think about what a SMART provides by
design.
• Inverse Probability Weighted Estimator
For a two-stage SMART, a fixed regime 𝜋, and histories 𝐻1 = 𝑋1,
𝐻2 = (𝑋1, 𝐴1, 𝑋2)
̂
Vn(𝜋) = ℙn [
𝑌 1 {𝐴1 = 𝜋1(𝐻1)} 1 {𝐴2 = 𝜋2(𝐻2)}
Pr(𝐴1|𝐻1) Pr(𝐴2|𝐻2)
]
• Augmented Inverse Probability Weighted Estimator
39/48](https://image.slidesharecdn.com/2023-11-30-ct-presentation-240301165120-f0d0ddf7/75/An-Introduction-to-Sequential-Multiple-Assignment-Randomized-Trials-SMARTs-80-2048.jpg)
![Toy Problem: Max of Gaussian Means
Suppose we have a random iid sample of size 𝑛 where
𝑋𝑖 ∼ MVN (𝜇 = (
2
−1
) , Σ = [
1 0
0 1
])
40/48](https://image.slidesharecdn.com/2023-11-30-ct-presentation-240301165120-f0d0ddf7/75/An-Introduction-to-Sequential-Multiple-Assignment-Randomized-Trials-SMARTs-81-2048.jpg)
![Toy Problem: Max of Gaussian Means
Suppose we have a random iid sample of size 𝑛 where
𝑋𝑖 ∼ MVN (𝜇 = (
2
−1
) , Σ = [
1 0
0 1
])
In the general case let 𝑝 denote the dimension of 𝜇 and assume that the covariance
matrix is the identity matrix. Suppose we are interested in 𝜃:
𝜃 = max
𝑗∈[𝑝]
𝜇𝑗 = ∧
𝑝
𝑗=1𝜇𝑗
Here 𝜃 = max{2, −1} = 2
40/48](https://image.slidesharecdn.com/2023-11-30-ct-presentation-240301165120-f0d0ddf7/75/An-Introduction-to-Sequential-Multiple-Assignment-Randomized-Trials-SMARTs-82-2048.jpg)
![Toy Problem: Max of Gaussian Means
Suppose we have a random iid sample of size 𝑛 where
𝑋𝑖 ∼ MVN (𝜇 = (
2
−1
) , Σ = [
1 0
0 1
])
In the general case let 𝑝 denote the dimension of 𝜇 and assume that the covariance
matrix is the identity matrix. Suppose we are interested in 𝜃:
𝜃 = max
𝑗∈[𝑝]
𝜇𝑗 = ∧
𝑝
𝑗=1𝜇𝑗
Here 𝜃 = max{2, −1} = 2
Let
̂
𝜃𝑛 = max
𝑗∈{1,2}
ℙn 𝑋𝑗
40/48](https://image.slidesharecdn.com/2023-11-30-ct-presentation-240301165120-f0d0ddf7/75/An-Introduction-to-Sequential-Multiple-Assignment-Randomized-Trials-SMARTs-83-2048.jpg)
![Toy Problem: Max of Gaussian Means
Suppose we have a random iid sample of size 𝑛 where
𝑋𝑖 ∼ MVN (𝜇 = (
2
−1
) , Σ = [
1 0
0 1
])
In the general case let 𝑝 denote the dimension of 𝜇 and assume that the covariance
matrix is the identity matrix. Suppose we are interested in 𝜃:
𝜃 = max
𝑗∈[𝑝]
𝜇𝑗 = ∧
𝑝
𝑗=1𝜇𝑗
Here 𝜃 = max{2, −1} = 2
Let
̂
𝜃𝑛 = max
𝑗∈{1,2}
ℙn 𝑋𝑗
What is the limiting distribution of √𝑛( ̂
𝜃 − 𝜃) for 𝜇 = (2, −1)T?
Hint: don’t overthink it
40/48](https://image.slidesharecdn.com/2023-11-30-ct-presentation-240301165120-f0d0ddf7/75/An-Introduction-to-Sequential-Multiple-Assignment-Randomized-Trials-SMARTs-84-2048.jpg)


![“Cheating” the Markov Assumption
When the number of stages 𝐽 is finite we can expand the state space to ensure the
Markov condition holds
𝑋+
𝑗 = (∪
𝑗
𝑖=1(𝑋𝑖, 𝐴𝑖, 𝑌𝑖)) ∪ 𝑋𝑗
Then the Markov condition
I
E[𝑌𝑗|𝑋+
1 , … , 𝑋+
𝑗 ] = I
E[𝑌𝑗|𝑋+
𝑗 ]
is trivially satisfied.
This trick is not available to us in the infinite horizon case, though we can continue
in the spirit of this approach by defining summary measurements.
10/10](https://image.slidesharecdn.com/2023-11-30-ct-presentation-240301165120-f0d0ddf7/75/An-Introduction-to-Sequential-Multiple-Assignment-Randomized-Trials-SMARTs-113-2048.jpg)


