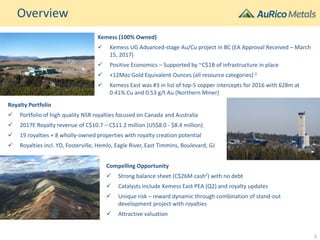
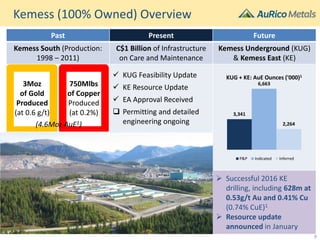
- The document is a corporate presentation for AuRico Metals that outlines its Kemess underground development project and royalty portfolio.
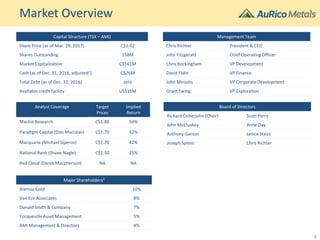
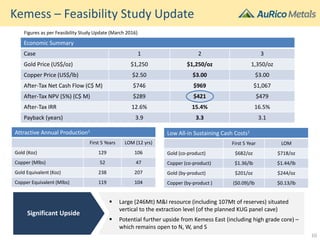
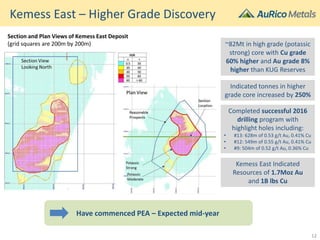
- AuRico has a strong balance sheet with $26M cash and no debt, and sees catalysts from an upcoming PEA on Kemess East and royalty updates.
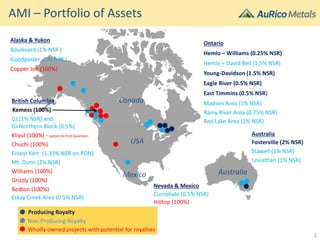
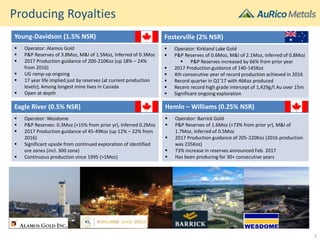
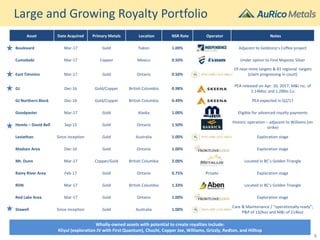
- The portfolio includes producing royalties on mines such as Young-Davidson, Fosterville, and Hemlo-Williams, and development stage royalties were recently acquired.