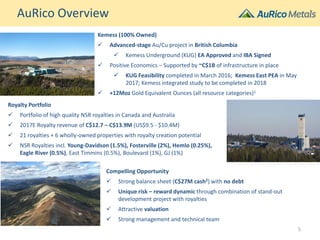
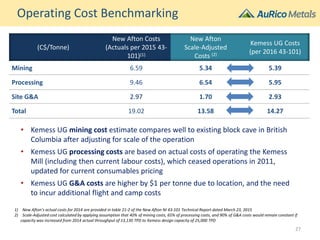
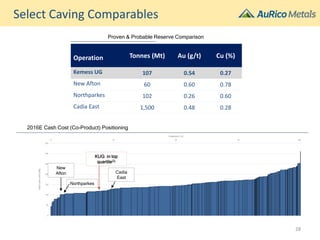
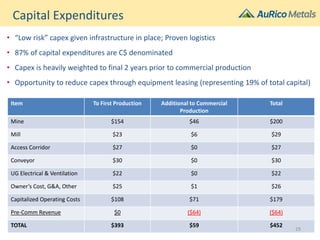
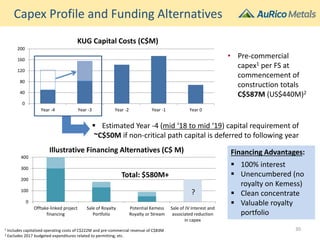
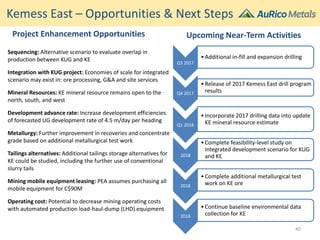
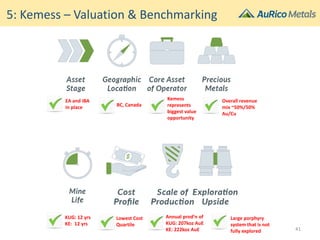
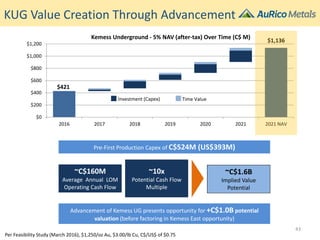
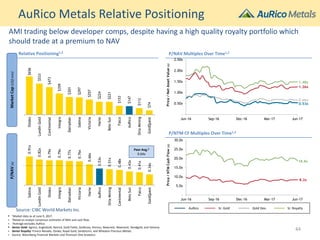
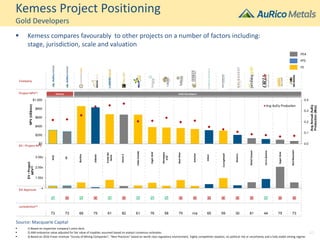
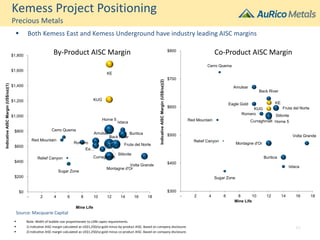
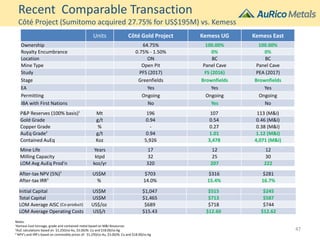
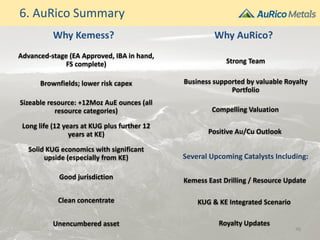
Kemess Project Overview
June 22, 2017
A Compelling Canadian Development Opportunity
Supported by High Quality Royalties
Forward-Looking Statements
Cautionary Statement
This presentation contains certain information that constitutes “forward-looking information” and “forward-looking statements” as defined under Canadian and U.S. securities laws. All statements in
this presentation, other than statements of historical fact, are forward-looking statements. The words “expect”, “believe”, “anticipate”, “contemplate”, “may”, “could”, “will”, “intend”, “estimate”,
“forecast”, “target”, “budget”, “schedule” and similar expressions identify forward-looking statements. Forward-looking statements in this presentation include, without limitation, information as to
our strategy, projected gold production from the Young-Davidson, Hemlo – Williams, Eagle River, and Fosterville mines, which are not owned by the Company, project timelines, resource and reserve
estimates, projected production and costs of the Kemess Underground Project and Kemess East Project, other statements that express our expectations or estimates of future performance, value
growth, value creation and shareholder returns, the success of exploration activities, mineral inventory including the Company’s ability to delineate additional resources and reserves as a result of such
programs, mineral reserves and mineral resources and anticipated grades, exploration expenditures, costs and timing of any future development, costs and timing of future exploration , the presence
of and continuity of metals at Kemess East at modeled grades, as well as expectations relating the assets acquired through the acquisition of Kiska Metals.
Forward-looking statements are necessarily based upon a number of factors and assumptions that, while considered reasonable by management at the time of making such statements, are inherently
subject to significant business, economic and competitive uncertainties and contingencies. Known and unknown factors could cause actual results to differ materially from those projected in the
forward-looking statements. Such factors and assumptions underlying the forward-looking statements in this presentation include, but are not limited to: changes to current estimates of mineral
reserves and resources; fluctuations in the price of gold and copper; changes in foreign exchange rates (particularly the Canadian dollar and U.S. dollar); performance of the Young-Davidson, Hemlo –
Williams, Eagle River, and Fosterville mines, which may impact the future cash flows associated with the Company’s royalty holdings; the impact of inflation; employee relations; litigation; uncertainty
with the Company’s ability to secure capital to execute its business plans; the speculative nature of mineral exploration and development, including the risks of obtaining necessary licenses, permits,
authorizations and/or approvals from the appropriate regulatory authorities for the Kemess Underground project; contests over title to properties; changes in national and local government legislation
in Canada and other jurisdictions in which the Company does or may carry on business in the future; risk of loss due to sabotage and civil disturbances; the impact of global liquidity and credit
availability and the values of assets and liabilities based on projected future cash flows; as well as business opportunities that may be pursued by the Company.
Actual results and developments are likely to differ, and may differ materially, from those expressed or implied by the forward-looking statements contained in this presentation. Such statements are
based on a number of assumptions, including those noted elsewhere in this document, which may prove to be incorrect. Readers are cautioned that forward-looking statements are not guarantees of
future performance. All of the forward-looking statements made in this presentation are qualified by these cautionary statements.
There can be no assurance that forward-looking statements or information will prove to be accurate, accordingly, investors should not place undue reliance on the forward-looking statements or
information contained herein. The Company disclaims any intention or obligation to update or revise any forward-looking statements whether as a result of new information, future events or
otherwise, except as required by applicable law.
Cautionary Note to U.S. Investors Concerning Measured, Indicated and Inferred Resources
This presentation uses the terms "measured", "indicated" and "inferred” resources. We advise investors that while those terms are recognized and required by Canadian regulations, the United States
Securities and Exchange Commission does not recognize them. “Inferred resources” have a great amount of uncertainty as to their existence and as to their economic and legal feasibility. It cannot be
assumed that all or any part of an inferred resource will ever be upgraded to a higher category. Under Canadian rules, estimates of inferred mineral resources may not form the basis of feasibility or
other economic studies. United States investors are cautioned not to assume that all or any part of measured or indicated mineral resources will ever be converted into mineral reserves. United States
investors are also cautioned not to assume that all or any part of an inferred mineral resource exists, or is economically or legally mineable.
Qualified Person as Defined by National Instrument 43-101
John Fitzgerald, Chief Operating Officer for AuRico Metals Inc. has reviewed and approved the scientific and technical information contained within this presentation. Mr. Fitzgerald is a “Qualified
Person” as defined by National Instrument 43-101.
Note: All amounts are in US dollars unless otherwise indicated.
2
1. Introduction and General Overview
2. Kemess Overview
3. Kemess Underground (KUG) - Feasibility Study Highlights
4. Kemess East (KE) – PEA Highlights & Exploration
5. Kemess Valuation & Benchmarking
6. Summary
7. Q&A
Table of Contents
3
Kemess Underground Project – Key Technical Team
John
Fitzgerald
Chief Operating
Officer
• Over 27 years experience
• Director of Mining at Northgate Minerals and part of Young Davidson development team
• Significant block/panel caving experience gained in various roles at Rio Tinto and De Beers
• Former management roles at Barrick Gold, Scotia Capital and successful independent
consultant
Chris
Rockingham
Vice President,
Development
• Over 30 years experience
• VP Exploration and Business Development at Northgate Minerals
• Extensive precious and base metal deposit experience throughout North and South
America
• Recipient of H.H. “Spud” Huestis Award in 2016
Sean Masse Mining Project
Manager
• Over 16 years experience
• Senior member of team that successfully brought New Gold's New Afton panel cave mine
into production
• Former superintendent and mine manager at New Afton
• Most recently working to build Cementation Canada's business in Western Canada
Mike Padula Surface
Construction
Project Manager
• Over 29 years experience
• Project Manager for Victoria Gold’s Eagle Gold Project in central Yukon
• Manager of mining wastes and water for MMG Limited's Izok Corridor Project in Nunavut
• Part of senior management group for both AMEC Americas and De Beers Canada which
advanced Snap Lake Diamond Project to construction
Harold Bent Director
Environment
• Over 25 years experience
• Working at Kemess since 1999 with progressive responsibilities
• Responsible for all environmental and regulatory compliance
1: Introduction
4
AuRico Overview
Compelling Opportunity
✓ Strong balance sheet (C$27M cash2) with no debt
✓ Unique risk – reward dynamic through combination of stand-out
development project with royalties
✓ Attractive valuation
✓ Strong management and technical team
Kemess (100% Owned)
✓ Advanced-stage Au/Cu project in British Columbia
✓ Kemess Underground (KUG) EA Approved and IBA Signed
✓ Positive Economics – Supported by ~C$1B of infrastructure in place
✓ KUG Feasibility completed in March 2016; Kemess East PEA in May
2017; Kemess integrated study to be completed in 2018
✓ +12Moz Gold Equivalent Ounces (all resource categories)1
Royalty Portfolio
✓ Portfolio of high quality NSR royalties in Canada and Australia
✓ 2017E Royalty revenue of C$12.7 – C$13.9M (US$9.5 - $10.4M)
✓ 21 royalties + 6 wholly-owned properties with royalty creation potential
✓ NSR Royalties incl. Young-Davidson (1.5%), Fosterville (2%), Hemlo (0.25%),
Eagle River (0.5%), East Timmins (0.5%), Boulevard (1%), GJ (1%)
5
0.20
0.40
0.60
0.80
1.00
1.20
1.40
Jul - 15 Oct - 15 Jan - 16 Apr - 16 Jul - 16 Oct - 16 Jan - 17 Apr - 17
AMI Share Price Since Inception in July 2015
AMI (C$/shr)
Gold Price US$/oz (indexed to AMI)
Track-Record of Adding Value
Kemess:
✓ Receipt of Environmental Assessment Certificate for
Kemess Underground (KUG)
✓ A 188% increase in Indicated resource for Kemess East
✓ Signed Impact Benefits Agreement for KUG
✓ Announced positive PEA results on Kemess East
Royalties:
✓ 2017E royalty revenue guidance increased by 19%-
24% to C$12.7 – C$13.9M
✓ Increase in P&P Reserves: Fosterville +66%; Hemlo
+73%; Eagle River +15%
✓ Increase in Production Guidance: Fosterville + 43%-
55%; YD + 18-24%; Eagle River + 12%-22%
✓ Acquisition of Kiska Metals completed
Key Developments – 2017 Year to Date AuRico Shares vs. Gold Price
+7%
+117%
6
$0.96
$2.66
$2.37
($0.26)
$5.72
-
1.00
2.00
3.00
4.00
5.00
6.00
7.00
Royalties +
Cash
Kemess UG
(per FS)
Kemess East
(per PEA)
Corporate
Outflow
Total
Net Asset Value per Share1
Significant Valuation Opportunity driven by:
1. Progressive recognition of Kemess’ value as project is advanced
2. Kemess East drilling and resource update
3. Integrated Feasibility Study for KUG and KE
4. Potential for royalties to continue to become more valuable / accretive deals
(C$/sh)
Royalty value
at royalty co.
P/NAV of 1.5x
Share Price
7
The Kemess Underground Project is 100% owned by AuRico Metals
2: Kemess Overview
Processing plant
(capacity of 52ktpd)
Admin building
Camp
(accommodations for +300)
KUG tailings
storage facility
KUG
8
Kemess Existing Infrastructure
Approximately C$1 Billion of Infrastructure is Already in Place
• Kemess South open pit mine operated from 1998 to 2011
• Tailings storage facility & waste rock dumps
• Currently on care & maintenance (forecast of $4M for 2017)
• Existing infrastructure includes:
• Process plant of 52ktpd with grinding capacity currently limited to 25ktpd
• Camp (7 x 40-person bunk house units, kitchen, potable water facility, sewage facility)
• Powerline (380 km, 230 kV-power line step-down transformers, backup diesel
generators)
• Concentrate rail load-out facility in Mackenzie (currently being leased to Mt. Milligan)
• Other (admin building, workshop, warehouse, 1,500m all weather air strip, 400 km
access road)
9
• Located in north-central British Columbia
• Approximately 250 km north of Smithers,
and ~430 km northwest of Prince George
• Kemess South (KS) mine, Kemess
Underground (KUG) & Kemess East (KE)
• KUG ~6.5 km north of existing KS processing
plant, and KE deposit ~1 km east of KUG
Location & General Overview
10
Kemess History
KS Mine - Successful Operating Track Record
• Produced between 1998 - 2011
• Comprised a large open pit and 52ktpd plant
• Produced ~3.0Moz Au, and 750M lbs Cu
• Production ceased due to depletion of open pit mineral reserves
1996: Kemess
property acquired
by Royal Oak
Mines
1998: Kemess South
open pit mine
commences operations
1999: Kemess
acquired by
Northgate
Minerals
2011: Kemess South
open pit mine
operation end
2011: Northgate
acquired by
AuRico Gold
2013: KUG
feasibility
study
released
2015: Kemess spun-out
to AuRico Metals
(as part of AuRico Gold -
Alamos merger)
2016: KUG
updated
feasibility
study released
2017:
KE resource
update
2017:
KUG EA
Approval
(Federal &
Provincial)
2017:
KUG IBA
Finalized
2017:
KE PEA
11
Kemess Site Overview
Kemess Underground (Feasibility – 2016)
▪ Reserves of 3.4Moz AuE1 (1.9Moz Au and 0.6Blbs Cu)
▪ NPV (5%, after tax) of C$420M and IRR of 15.4%2
▪ LOM of 12 years at 207Koz AuE/yr at AISC of $718/oz
▪ Environmental Approvals received
▪ Permitting and review of financing alternatives ongoing
 Unique development opportunity
Kemess South (Past Producer: 1998 – 2011)
▪ ~C$1B of infrastructure in place (including processing
facility, grid power, road, maintenance shop, etc.)
▪ Past production of 3Moz Au and 750Mlbs Cu
 Brownfields opportunity significantly reduces risk
Kemess East (PEA – May 2017)
▪ M&I rscs. of 4.0Moz AuE (1.7Moz Au and 1Blbs Cu)
▪ NPV (5%, after tax) of C$375M and IRR of 16.7%2
▪ LOM of 12 years at 222Koz AuE/yr at AISC of $744/oz
▪ Additional ~12,000m of drilling planned for 2017
 Exciting upside potential
12
Kemess – Key Study Outputs
Kemess South1
(Actual)
Kemess UG2
(Feasibility Study)
Kemess East2
(PEA – PR )
Tonnes, Au Grade, Cu Grade 219Mt / 0.63gpt /
0.21%
107Mt / 0.54gpt /
0.27%
103Mt / 0.42gpt /
0.34%
Throughput (tpd) 50,000 25,000 30,000
LOM Free Cash Flow (C$ M) $750 $987 $797
NPV (5%, After-tax) NA C$421M C$375M
After-Tax IRR NA 15.4% 16.7%
Initial Capex ~C$470M C$600M (US$450M) C$327 (US$245M)
Mine Life (years) 13 12 12
Avg. Annual Gold Production (Koz) 241 106 80
Avg. Annual Copper Production (Mlbs) 64 47 57
Avg. Annual AuE Production (Koz) 431 207 222
Avg. Annual CuE Production (Mlbs) 151 104 92
Cash Costs Gold (by-product) ($/oz) $169/oz $94/oz ($415)/oz
AISC – Co-product basis (Au; Cu) NA $718/oz; $1.44/lb $744/oz; $1.79/lb
AISC – By-product basis (Au) NA $244/oz ($69)/oz
KUG and KE have not been integrated –
Optimization opportunity to be evaluated through integrated study 13
KUG - Reserves & Resources
Classification Quantity
Grade Contained Metal
Gold (g/t) Copper (%) Silver (g/t) Gold (koz) Copper (klbs) Silver (koz)
Proven and Probable
Proven - - - - - - -
Probable 107,381 0.54 0.27 1.99 1,868 629,595 6,878
Total P&P 107,381 0.54 0.27 1.99 1,868 629,595 6,878
Measured - - - - - - -
Indicated 246,400 0.42 0.22 1.75 3,328 1,195,300 13,866
Total M&I 246,400 0.42 0.22 1.75 3,328 1,195,300 13,866
Inferred
Total Inferred 21,600 0.40 0.22 1.70 277 104,700 1,179
Kemess Underground
M&I Resources are inclusive of reserves
14
Kemess Timeline – And Cu Outlook
10,000
15,000
20,000
25,000
30,000
2014 2015 2016 2017 2018 2019 2020 2021 2022 2023 2024 2025
ThousandTonnes
Production from Existing and Fully Committed Mines
Supply (Mine Production + SXEW + Scrap) Demand
Source: Teck, Wood Mackenzie, CRU, ICSG
DEFICIT
Expected First Production at Kemess
Schedule as per Feasibility Study (March 2016)
Federal and Provincial EA Approvals
KUG Impact Benefit Agreement Signed
Normal Course Permitting
Detailed Engineering
Project Financing
Access Corridor Development
Decline Development
Develop Panel Cave
First Production
20222016 2017 2018 2019 2020 2021
15
3: KUG - Feasibility Study Highlights
March 2016 - Positive Feasibility Study Update Announced for Kemess UG
Footprint:
570 m E-W
90-300 m N-S
200 m draw height
200-500 m below surface
16
Kemess Underground Project
17
KUG – Feasibility Study Summary
• Meaningful production: 238Koz Gold Equivalent (AuE1) annually for first 5 years, 207Koz
AuE over life of mine (LOM) (12 years)
• Low cost: All-in Sustaining Costs per AuE of US$682/oz for first 5 years, US$718/oz LOM
• Solid economics:
• After-tax NPV (5%) of C$421M and IRR of 15.4% assuming $1,250/oz Au, $3.00/lb
Cu, and a C$/US$ of 0.75
• Pre-commercial production capital of C$603M (US$452M)
• Capital reduction opportunity exists by leasing all or a portion of the C$86M in
underground mobile equipment purchases
• Low risk: Project infrastructure is already in place (processing facility, grid power, access
road, camp, admin and maintenance facilities, etc.)
• Significant upside: Large (246Mt) M&I resource base (including 107Mt of reserves)
situated directly adjacent to the extraction level (of the planned KUG panel cave)
18
Proposed Mining Process
Panel caving underground mining
minimizes waste rock
1. Ore crushed underground
2. Placed on conveyor to surface
3. Process plant ~25,000 tpd
4. Tailings deposited into Kemess South
mined out pit
5. Au-Cu concentrate trucked to
Mackenzie
6. Concentrate transferred to rail and
sent to port/smelters
Underground panel caving
19
Waste Rock, Tailings Storage & Water
Management
• Existing Kemess South Pit will be the Kemess Underground Tailings Storage Facility (KUG TSF)
• Waste rock (~3Mt) & tailings (~107Mt) produced through 12-yr mine life will be stored
underwater in the facility
• East rim will be raised 25m to accommodate volume in Year 6 to 8
• Mine water will be pumped to the KUG TSF during operations
• Process water will be sourced from the KUG TSF
20
Kemess Underground
Cross Section showing Decline, Underground Workings & Panel Cave
• KUG reserve situated approximately 200 to 550 m below surface
• Mine will be accessed and supported by a triple decline system comprising access, ore
conveying and ventilation declines
• Total LOM development requirements are estimated to be 47,750m lateral and 2,200m
vertical development (all lateral development assumed to be by owner crews)
• Total 2,250t of ore per metre of lateral development results from this mine design,
representing a very high development efficiency compared to other UG mining methods
• KUG panel cave requires < 5% of ore tonnes to be blasted (vs. 100% for a typical UG mine)
“While all mining projects have
residual technical uncertainties,
the KUG Project is considered
to be relatively low risk for a
caving project in terms of key
mining-related risks including
production ramp-up, drawpoint
stability, subsidence and
mudrush.”
- SRK Consulting
21
KUG Extraction Level Layout
22
KUG Surface Expression
• Ore fed from undercut level to
extraction level via 582 total
drawpoints
• Avg production rate of 25ktpd
(9Mtpa)
• Caving initiated in highest value ore
at east end of KUG
• Ore delivered to one of four primary
jaw crushers located on extraction
level
• Following crushing, ore placed on
3.2km underground conveyor and
then on a 4.9km surface conveyor to
process plant
23
Simplified Process Flowsheet
• Processing of 9Mtpa using one of the two grinding circuits used to process KS ore
• Tailings pumped and stored in the KS open pit with minimum capacity of 107.4Mt ore treated
• Testwork resulted in estimated recoveries of 91% Cu, 72% Au and 65% Ag
• Produces clean concentrate with no penalty elements and an estimated 22% copper content
& high gold/silver by-product credits (30–50 g/t Au, and 75-100 g/t Ag in conc)
• Ore NSR values peak at almost C$48/t in Year 3 of production and average C$35/t over LOM
24
KUG: Production and Costs
Low Cost
Mining
▪ Avg LOM production of 106koz Au, 47M lbs Cu, 207koz AuE1
▪ Total LOM cash costs of US$639 and AISC of US$718 per AuE
▪ AISC of US$682/oz over first 5 years
▪ Caving initiated in the highest value ore
▪ Low ‘break-even’ in early years allows for accelerated debt repayment
▪ Payback of 3.3 years (consensus pricing case2)
0
50,000
100,000
150,000
200,000
250,000
300,000
350,000
0
100
200
300
400
500
600
700
800
900
-1 1 2 3 4 5 6 7 8 9 10 11 12 13
Annual Gold Equivalent Production vs. USD AISC
Gold Equivalent Production AISC(USD)
$/oz Ounces
25
Operating Expenses – Per FS
• Average life of mine operating costs estimated at C$14.27/t ore
• Labour significant component comprising: 53% of mining, 17% of processing and 26% G&A
• Other significant costs include consumables (37% of processing), electricity (32% of processing)
and flights and camp (28% of G&A)
• Estimated 85% of operating costs will be C$ denominated, with the other 15% largely in USD
consisting primarily of equipment spares, consumables and fuel
Item C$/t ore
Mining $5.39
Processing Plant $5.69
Water Treatment $0.26
G&A $2.93
Total $14.27
Mining
38%
Processing
40%
G&A
20%
Water
Treatment
2%
Opex Breakdown
26
Operating Cost Benchmarking
(C$/Tonne)
New Afton Costs
(Actuals per 2015 43-
101)(1)
New Afton
Scale-Adjusted
Costs (2)
Kemess UG Costs
(per 2016 43-101)
Mining 6.59 5.34 5.39
Processing 9.46 6.54 5.95
Site G&A 2.97 1.70 2.93
Total 19.02 13.58 14.27
• Kemess UG mining cost estimate compares well to existing block cave in British
Columbia after adjusting for scale of the operation
• Kemess UG processing costs are based on actual costs of operating the Kemess
Mill (including then current labour costs), which ceased operations in 2011,
updated for current consumables pricing
• Kemess UG G&A costs are higher by $1 per tonne due to location, and the need
to incur additional flight and camp costs
1) New Afton’s actual costs for 2014 are provided in table 21-2 of the New Afton NI 43-101 Technical Report dated March 23, 2015
2) Scale-Adjusted cost calculated by applying assumption that 40% of mining costs, 65% of processing costs, and 90% of G&A costs would remain constant if
capacity was increased from 2014 actual throughput of 13,130 TPD to Kemess design capacity of 25,000 TPD
27
Select Caving Comparables
2016E Cash Cost (Co-Product) Positioning
KUG in top
quartile(2)
Northparkes
Cadia
East
New
Afton
Operation Tonnes (Mt) Au (g/t) Cu (%)
Kemess UG 107 0.54 0.27
New Afton 60 0.60 0.78
Northparkes 102 0.26 0.60
Cadia East 1,500 0.48 0.28
Proven & Probable Reserve Comparison
28
Capital Expenditures
• “Low risk” capex given infrastructure in place; Proven logistics
• 87% of capital expenditures are C$ denominated
• Capex is heavily weighted to final 2 years prior to commercial production
• Opportunity to reduce capex through equipment leasing (representing 19% of total capital)
Item To First Production Additional to Commercial
Production
Total
Mine $154 $46 $200
Mill $23 $6 $29
Access Corridor $27 $0 $27
Conveyor $30 $0 $30
UG Electrical & Ventilation $22 $0 $22
Owner’s Cost, G&A, Other $25 $1 $26
Capitalized Operating Costs $108 $71 $179
Pre-Comm Revenue $0 ($64) ($64)
TOTAL $393 $59 $452
29
0
40
80
120
160
200
Year -4 Year -3 Year -2 Year -1 Year 0
KUG Capital Costs (C$M)
Capex Profile and Funding Alternatives
▪ Estimated Year -4 (mid ‘18 to mid ‘19) capital requirement of
~C$50M if non-critical path capital is deferred to following year
• Pre-commercial
capex1 per FS at
commencement of
construction totals
C$587M (US$440M)2
Financing Advantages:
▪ 100% interest
▪ Unencumbered (no
royalty on Kemess)
▪ Clean concentrate
▪ Valuable royalty
portfolio
1 Includes capitalized operating costs of C$222M and pre-commercial revenue of C$83M
2 Excludes 2017 budgeted expenditures related to permitting, etc.
Total: $580M+
0
100
200
300
400
Offtake-linked project
financing
Sale of Royalty
Portfolio
Potential Kemess
Royalty or Stream
Sale of JV Interest and
associated reduction
in capex
Illustrative Financing Alternatives (C$ M)
?
30
Project Commodity Agency Partner(s) Capital Cost1 Debt Arranged
(Agency / Total)
Direct Investment
(Interest / Acquisition Cost)
Escondida Copper JBIC
BHP, Rio Tinto,
Mitsubishi Corp., JX
Nippon Mining,
Mitsubishi Materials
N/A
$300m /
$500m
N/A (Expansion)
Caserones Copper
JBIC, NEXI,
JOGMEC
Pan Pacific Copper,
Mitsui US$2,000m
Undisclosed /
US$1,400m
N/A (Wholly-owned)
Cerro Verde Copper JBIC
Freeport McMoRan,
Sumitomo Metal
Mining, Cia de Minas
Buenaventura
US$985m
US$247.5m /
US$450m
21% / US$265m
Sierra Gorda Copper JBIC
KGHM, Sumitomo
Corp., Sumitomo
Metal Mining
US$2,877m
US$700m /
US$1,000m
45% / US$724m
Antucoya Copper JBIC
Antofagasta,
Marubeni
US$1,300m
US$195m /
US$650m
30% / US$350m
Copper
Mountain
Copper JBIC
Copper Mountain
Mining, Mitsubishi
Materials
C$437m
US$160m /
US$320m
25% / C$28.75m
Gibraltar Copper - Taseko Mines, Sojitz N/A N/A 12.5% / C$187m
Cote Gold -
IAMGOLD,
Sumitomo Metal
Mining
US$1,037m N/A 27.75% / US$195m
Select Offtake-Linked Transactions
1. Capital cost at announcement of project financing
Source: Cutfield Freeman & Co Ltd
31
Environmental Permitting
• On March 15th CEAA issued a positive Decision Statement and the BC EAO granted an
Environmental Assessment (EA) Certificate for KUG
• Currently preparing necessary permits to commence construction, with permitting
anticipated to be completed in Q2 2018
• In addition detailed engineering is in progress with a focus on access corridor construction
related activities which are expected to account for first 12 months of construction schedule
February 2014
Project Description submitted to the BC Environmental office (BCEAO) and Canadian
Environmental Assessment Agency (CEAA)
April 2014 Determination from BCEAO and CEAA that an Environmental Assessment is required
May 2014 – January 2016
Finalization of Applicant Information Requirements (Terms of Reference) and
preparation of Environmental Assessment Application
May 2016
Submission of Environmental Application
January 2017
EAO released draft Assessment Report which concluded that the project would not
result in significant adverse effects
March 2017
KUG granted EA Certificate from BCEAO and CEAA issued a positive Decision
Statement
Q2/2018 Expected receipt of normal course permits needed to commence construction
Environmental Permitting Timeline
32
Strong Relationships With First Nations
Which First Nations will be affected by the Project?
• Two Aboriginal traditional territories overlap the Kemess Project location: Tsay Keh Dene
and Takla Lake
• One Aboriginal traditional territory is adjacent & downstream from the project location:
Kwadacha
• These three nations identify themselves as the Tse Keh Nay (‘TKN’)
• On May 18th the Company entered into an Impact Benefits Agreement ("IBA") with TKN
• The IBA provides a framework that formalizes the long-term co-operative relationship
between AMI and TKN over the life of the project.
• Captures mutual commitment to consult and maintain an open, respectful and
cooperative relationship throughout the development and operation
• Provides for meaningful TKN participation through training, employment, business
opportunities, environmental protection and other means.
33
4: Kemess East– PEA Highlights & Exploration
34
Kemess: A History of Exploration Success
Zone of
Subsidence
• 1975: First hole drilled at Kemess South, delineated in early 90’s
• 1986 – 1992: Discover porphyry-style mineralisation at Kemess North (which is now KUG)
• 2003: Inferred KN Open Pit resource:
• 414 Mt @ 0.31 g/t Au and 0.16% Cu
• 2006 - 2007: IP surveys/drilling identified new zone east of KN
• Federal Review Panel recommended against developing Kemess North
Open Pit as risks outweighed benefits
• 2010 – 2013:
• Geotechnical/hydrogeological drilling completed at Kemess Underground
• 2013 Feasibility report deems Kemess Underground Panel Cave economic
• Kemess Underground – Proven and Probable Reserves: 100.4 Mt @ 0.56 g/t Au, 2.05 g/t Ag
and 0.28% Cu
• 2013 -2014:
• 2013: Revisit Kemess East, drilled 13,337m in 9 holes.
• 2014: Continued exploration drilling – 16,873m in 12 holes.
• Initial Kemess East resource estimate released January 21, 2015
• 2015-2016:
• Continued delineation of Kemess East system and expanded exploration drilling 35
Kemess East Resource Update
• Successful 2016 drilling program with highlight holes including:
• #13: 628m of 0.53 g/t Au, 0.41% Cu
• #12: 549m of 0.55 g/t Au, 0.41% Cu
• #9: 504m of 0.52 g/t Au, 0.36% Cu
• High grade core associated with strong potassic alteration zone
which remains open both to north and south, as does the
overall deposit
• Overall Indicated category tonnage increased by 74Mt (188%)
compared to March 2016 estimate
• High grade Indicated core includes: 67Mt at 0.43% Cu and 0.60
g/t Au
~82Mt in high grade (potassic
strong) core with Cu grade
60% higher and Au grade 8%
higher than KUG Reserves
Kemess UG + Kemess East
Reserves and Resources (all
categories) of +12Moz AuE
Indicated tonnes in high grade
core increased by 250%
Classification Quantity
Grade Contained Metal
Gold (g/t) Copper (%) Silver (g/t) Gold (koz) Copper (klbs) Silver (koz)
Indicated
potassic strong 67,200 0.60 0.43 2.06 1,292 640,000 4,457
potassic moderate 40,000 0.27 0.32 1.81 352 286,000 2,336
potassic weak 5,100 0.19 0.22 1.45 31 24,000 238
phyllic + propylitic 800 0.20 0.21 1.40 5 4,000 36
Indicated - Total 113,100 0.46 0.38 1.94 1,680 954,000 7,066
Inferred
potassic strong 15,200 0.51 0.41 2.05 249 137,000 1,003
potassic moderate 41,900 0.26 0.34 1.91 353 311,000 2,579
potassic weak 6,000 0.17 0.20 1.42 32 27,000 274
phyllic + propylitic 700 0.24 0.21 1.42 6 3,000 33
Total Inferred 63,800 0.31 0.34 1.90 640 478,000 3,889
Kemess East Resource1
M&I Resources are inclusive of reserves
36
Kemess East 2017 Drill Targets
Pad I
KOZ zone
Pad
E
Pad
D 5
Pad
A
Pad I
KOZ zone
• 2017 drill program of ~12,000 metres planned at KE
(~C$4M - $5M)
• Program will include:
• infill drilling targeting the potassic strong zone,
• growth holes on the outer edges of the known deposit, and
• looking for higher grade within the Kemess Offset Zone
• Kemess Offset Zone is located between the KUG and KE
deposits, which are one km apart
KE Looking South
Pad A
Pad I
KOZ zone
37
Kemess East (KE) – PEA Summary
• PEA for KE project completed by Golder Associates in May 2017, with NI 43-101 report to follow
• Presents stand-alone scenario that does not factor in or modify economics of the Feasibility stage
KUG Project
• KE underground panel cave is 0.9km east of KUG and 770m deeper
• Total life-of-mine production of 963koz gold, 687Mlbs copper and 3.8Moz silver
• After-tax NPV5% of C$375M, and IRR of 16.7%
• Key upsides include:
• Sequencing – consider overlapping production between KUG and KE
• Integration – potential economies of scale with KUG project on ore processing, G&A and site services
• Mineral Resources – Improving quality and quantity of KE mineral resource
• Next steps include:
• 2017 Kemess drilling (Q3) to lead to an updated KE mineral resource estimate (early 2018)
• Complete a feasibility-level study on integrated development scenario for KUG and KE
38
Significant Production Scale
-
50,000
100,000
150,000
200,000
250,000
300,000
350,000
Y4 Y5 Y6 Y7 Y8 Y9 Y10 Y11 Y12 Y13 Y14 Y15 Y16 Y17
Kemess East - Project Schedule Year
Kemess East AuE Production (oz)
0
50,000
100,000
150,000
200,000
250,000
300,000
350,000
-2 -1 1 2 3 4 5 6 7 8 9 10 11 12 13
KUG - Project Schedule Year
KUG AuE Production (oz)
• KUG (2016 – Feasibility) : LOM of 12 years at 207Koz AuE1/yr at AISC of $718/oz
• Kemess East (2017 – PEA): LOM of 12 years at 222Koz AuE1/yr at AISC of $744/oz
39
Kemess East – Opportunities & Next Steps
Upcoming Near-Term Activities
Q3 2017
•Additional in-fill and expansion drilling
Q4 2017
•Release of 2017 Kemess East drill program
results
Q1 2018
•Incorporate 2017 drilling data into update
KE mineral resource estimate
2018
•Complete feasibility-level study on
integrated development scenario for KUG
and KE
2018
•Complete additional metallurgical test
work on KE ore
2018
•Continue baseline environmental data
collection for KE
Project Enhancement Opportunities
Sequencing: Alternative scenario to evaluate overlap in
production between KUG and KE
Integration with KUG project: Economies of scale for integrated
scenario may exist in: ore processing, G&A and site services
Mineral Resources: KE mineral resource remains open to the
north, south, and west
Development advance rate: Increase development efficiencies
of forecasted UG development rate of 4.5 m/day per heading
Metallurgy: Further improvement in recoveries and concentrate
grade based on additional metallurgical test work
Tailings alternatives: Additional tailings storage alternatives for
KE could be studied, including the further use of conventional
slurry tails
Mining mobile equipment leasing: PEA assumes purchasing all
mobile equipment for C$90M
Operating cost: Potential to decrease mining operating costs
with automated production load-haul-dump (LHD) equipment
40
5: Kemess – Valuation & Benchmarking
EA and IBA
in place BC, Canada
Kemess
represents
biggest value
opportunity
Overall revenue
mix ~50%/50%
Au/Cu
KUG: 12 yrs
KE: 12 yrs
Lowest Cost
Quartile
Annual prod’n of
KUG: 207koz AuE
KE: 222koz AuE
Large porphyry
system that is not
fully explored 41
Kemess - Sensitivities
KUG Project Sensitivities 1 2 3
Gold Price (US$/oz) $1,250 $1,250 1,350
Copper Price (US$/lb) $2.50 $3.00 $3.00
C$/US$ 0.75 0.75 0.75
After-Tax Net Cash Flow (C$ M) $746 $969 $1,067
After-Tax NPV (5%) (C$ M) $289 $421 $479
After-Tax IRR 12.6% 15.4% 16.5%
Payback (years) 3.9 3.3 3.1
KUG Sensitivities - Figures as per Feasibility Study Update (March 2016)
KE Sensitivities - Figures as per PEA release (May 2017)
KE Project Sensitivities 1 2 3
Gold Price (US$/oz) $1,270 $1,250 $1,350
Copper Price (US$/lb) $2.60 $3.00 $3.25
C$/US$ 0.74 0.75 0.75
After-Tax Net Cash Flow (C$ M) $623 $797 $1,014
After-Tax NPV (5%) (C$ M) $269 $375 $507
After-Tax IRR 13.9% 16.7% 19.9%
Pre-tax Payback (years) 4 3 3
42
KUG Value Creation Through Advancement
$421
$1,136
$0
$200
$400
$600
$800
$1,000
$1,200
2016 2017 2018 2019 2020 2021 2021 NAV
Kemess Underground - 5% NAV (after-tax) Over Time (C$ M)
Investment (Capex) Time Value
~C$160M
Average Annual LOM
Operating Cash Flow
~10x
Potential Cash Flow
Multiple
~C$1.6B
Implied Value
Potential
Per Feasibility Study (March 2016), $1,250/oz Au, $3.00/lb Cu, C$/US$ of $0.75
Pre-First Production Capex of C$524M (US$393M)
Advancement of Kemess UG presents opportunity for +C$1.0B potential
valuation (before factoring in Kemess East opportunity)
43
0.91x
0.82x
0.79x
0.79x
0.77x
0.76x
0.66x
0.53x
0.51x
0.48x
0.43x
0.41x
0.34x
Sabina
LundinGold
Osisko
Integra
Dalradian
Victoria
Harte
AuRico
OrlaMining
Continental
BeloSun
Falco
GoldQuest
$656
$533
$473
$359
$301
$297
$257
$224
$221
$153
$147
$112
$74
Osisko
LundinGold
Continental
Integra
Dalradian
Sabina
Victoria
Harte
BeloSun
Falco
AuRico
OrlaMining
GoldQuest
-
0.50x
1.00x
1.50x
2.00x
2.50x
Jun-16 Sep-16 Dec-16 Mar-17 Jun-17
Price/NetAssetValue(x)
1.48x
0.66x
0.53x
1.26x
AuRico Metals Relative Positioning
-
5.0x
10.0x
15.0x
20.0x
25.0x
30.0x
Jun-16 Sep-16 Dec-16 Mar-17 Jun-17
Price/NTMCashFlow(x)
18.8x
8.2x
P/NAV Multiples Over Time1,2Relative Positioning1,2
P/NTM CF Multiples Over Time1,2
▪ 1Market data as at June 9, 2017.
▪ 2Based on analyst consensus estimates of NAV and cash flow.
▪ 3Average excludes AuRico.
▪ Senior Gold: Agnico, AngloGold, Barrick, Gold Fields, Goldcorp, Kinross, Newcrest, Newmont, Randgold, and Yamana.
▪ Senior Royalty: Franco-Nevada, Osisko, Royal Gold, Sandstorm, and Wheaton Precious Metals.
▪ Source: Bloomberg Financial Markets and Thomson One Analytics.
MarketCap(US$mm)P/NAV(x)
AuRico Sr. Gold Sr. RoyaltyGold Dev.
Peer Avg.3
0.64x
Source: CIBC World Markets Inc.
AMI trading below developer comps, despite having a high quality royalty portfolio which
should trade at a premium to NAV
44
Kemess Project Positioning
Gold Developers
▪ 1) Based on respective company’s price deck.
▪ 2) AMI enterprise value adjusted for fair value of royalties assumed based on analyst consensus estimates.
▪ 3) Based on 2016 Fraser Institute “Survey of Mining Companies”; “Best Practices” based on world class regulatory environment, highly competitive taxation, no political risk or uncertainty and a fully stable mining regime.
▪ Kemess compares favourably to other projects on a number of factors including:
stage, jurisdiction, scale and valuation
Company
Project NPV(1)
EV / Project NPV
EA Approval
                 
Jurisdiction(3)
73 73 69 75 61 82 61 76 58 75 n/a 65 59 30 81 44 75 73
AMI Gold Developers Gold DevelopersKemess
PEA
PFS
FS
0.0
0.1
0.2
0.3
0.4
$0
$200
$400
$600
$800
$1,000
AvgAnnualAuEq
Production(Moz)
NPV(US$mm)
Avg AuEq Production
- x
1.00x
2.00x
3.00x
EV/Project
NPV(2)
KUG
KE
Buritica
Stibnite
Frutaldel
Norte
Horne5
VoltaGrande
EagleGold
Montagne
d’Or
BackRiver
Amulsar
Ixtaca
Curraghinalt
Romero
ReliefCanyon
CerroQuema
SugarZone
RedMountain
Source: Macquarie Capital
45
▪ Both Kemess East and Kemess Underground have industry leading AISC margins
▪ Note: Width of bubble size proportionate to LOM capex requirements.
▪ 1) Indicative AISC margin calculated as US$1,250/oz gold minus by-product AISC. Based on company disclosure.
▪ 2) Indicative AISC margin calculated as US$1,250/oz gold minus co-product AISC. Based on company disclosure.
Kemess Project Positioning
Precious Metals
Buritica
Cerro Quema
Red Mountain
Amulsar
Back River
KEEagle Gold
Fruta del NorteKUG
Curraghinalt
Romero Stibnite
Horne 5
Relief Canyon
Volta Grande
Montagne d'Or
Ixtaca
Sugar Zone
$300
$400
$500
$600
$700
$800
- 2 4 6 8 10 12 14 16 18
IndicativeAISCMargin(US$/oz)(2)
Mine Life
Source: Macquarie Capital
Co-Product AISC Margin
KE
KUG
Horne 5
Ixtaca
Buritica
Cerro Quema
Red Mountain
Amulsar
Romero
Stibnite
Back River
Fruta del Norte
Ea…
Curraghinalt
Volta Grande
Montagne d'Or
Relief Canyon
Sugar Zone
$0
$200
$400
$600
$800
$1,000
$1,200
$1,400
$1,600
$1,800
- 2 4 6 8 10 12 14 16 18
IndicativeAISCMargin(US$/oz)(1)
Mine Life
By-Product AISC Margin
46
Recent Comparable Transaction
Côté Project (Sumitomo acquired 27.75% for US$195M) vs. Kemess
Units Côté Gold Project Kemess UG Kemess East
Ownership 64.75% 100.00% 100.00%
Royalty Encumbrance 0.75% - 1.50% 0% 0%
Location ON BC BC
Mine Type Open Pit Panel Cave Panel Cave
Study PFS (2017) FS (2016) PEA (2017)
Stage Greenfields Brownfields Brownfields
EA Yes Yes Yes
Permitting Ongoing Ongoing Ongoing
IBA with First Nations No Yes No
P&P Reserves (100% basis)1
Mt 196 107 113 (M&I)
Gold Grade g/t 0.94 0.54 0.46 (M&I)
Copper Grade % - 0.27 0.38 (M&I)
AuEq Grade2
g/t 0.94 1.01 1.12 (M&I)
Contained AuEq Koz 5,926 3,478 4,071 (M&I)
Mine Life Years 17 12 12
Milling Capacity ktpd 32 25 30
LOM Avg AuEq Prod’n koz/yr 320 207 222
Notes:
1Kemess East tonnage, grade and contained metal based on M&I Resources
2AuE calculations based on $1,250/oz Au, $3.00/lb Cu and $18.00/oz Ag
3 NPV’s and IRR’s based on commodity prices of: $1,250/oz Au, $3.00/lb Cu and $18.00/oz Ag
After-tax NPV (5%)3
US$M $703 $316 $281
After-tax IRR3
% 14.0% 15.4% 16.7%
Initial Capital US$M $1,047 $515 $245
Total Capital US$M $1,465 $713 $587
LOM Average AISC (Co-product) US$/oz $689 $718 $744
LOM Average Operating Costs US$/t $15.43 $12.60 $12.62
47
Advanced-stage (EA Approved, IBA in hand,
FS complete)
Brownfields; lower risk capex
Sizeable resource: +12Moz AuE ounces (all
resource categories)
Long life (12 years at KUG plus further 12
years at KE)
Solid KUG economics with significant
upside (especially from KE)
Good jurisdiction
Clean concentrate
Unencumbered asset
6. AuRico Summary
Why Kemess? Why AuRico?
Strong Team
Business supported by valuable Royalty
Portfolio
Compelling Valuation
Positive Au/Cu Outlook
Several Upcoming Catalysts Including:
Kemess East Drilling / Resource Update
KUG & KE Integrated Scenario
Royalty Updates
48
7. Questions & Answers
49
Endnotes
Slide 5 – Overview: 1) Gold equivalent calculated on basis of $1,250/oz Au and $2.75/lb Cu
2) Mar. 31, 2017 cash balance adjusted to include additional C$11M in cash, as per Q1 2017 announcement dated May 4, 2017
Slide 7 – 1) NAV per Share – Value of royalties based on analyst consensus using latest reports from Macquarie Capital Markets, National Bank Financial and
Laurentian Bank Securities; Kemess per FS (Mar. 23, 2016) at Consensus pricing ; Kemess East per PEA (May 29, 2017) at Base-case pricing; and Corporate Outflow per
analyst consensus
Slide 12 - 1) Gold equivalent calculated on basis of $1,250/oz Au and $2.75/lb Cu
2) Assumes $1,250/oz Au, $3.00/lb Cu, and C$/US$ of 0.75
Slide 13 - Kemess Key Study Outputs: Gold equivalent ounces calculated on the basis of $1,250/oz Au and $2.75/lb Cu
1) Kemess South data compiled from historical year-end MD&A reports from Northgate Minerals Corporation
2) Assumes $1,250/oz Au, $3.00/lb Cu, and C$/US$ of 0.75
Slide 18 –1) Gold equivalent calculated on basis of $1,250/oz Au and $2.75/lb Cu
Slide 25 –1) Gold equivalent calculated on basis of $1,250/oz Au and $2.75/lb Cu
2) ) Consensus pricing deck assumes $1,250/oz Au, $3.00/lb Cu, and C$/US$ of 0.75
Slide 28 - Select Caving Comparables
1) Proven and Probable Reserves for New Afton and Cadia East shown as of Dec 31, 2016; Kemess and Northparkes shown as of Dec. 31, 2015
2) KUG average total cash cost in commercial production
Slide 36 – Kemess East Resource Estimate as of January 13, 2017
▪ NSR cut-off value of C$17.3/t was used to define indicated and inferred resources within a reasonable prospects for economic extraction solid
▪ NSR calculation assumed US$3.20/lb copper, US$1,275/oz gold and US$21.0/oz silver prices; and C$/US$ exchange rate of 0.76.
▪ NSR calculation assumed metallurgical recoveries of 91% copper, 72% gold and 65% silver; as well as a 22% copper grade for concentrate. Molybdenum was excluded
from the NSR calculation.
▪ Details of the Sample Preparation and Quality Assurance and Quality Control are presented in AuRico Metals’ November 8, 2016 press release reporting on the results
of the Company’s 2016 drill program.
▪ Resources were generated from 81 holes drilled at Kemess East in 2006, 2007, 2013, 2014, 2015 and 2016.
▪ Exploration activities at the Kemess East deposit have been conducted under the supervision of Wade Barnes, PGeo, Kemess Project Geologist, for AuRico Metals. Mr.
Barnes is a “Qualified Person” as defined by NI 43-101.
▪ Mineral Resources were prepared under the supervision of Marek Nowak, SRK Consulting (Canada) Inc. Mr. Nowak is a “Qualified Person” as defined by NI 43-101.
Slide 39 –1) Gold equivalent calculated on basis of $1,250/oz Au and $2.75/lb Cu

Ami kemess lunch june 22 2017 final website

  • 1.
    Kemess Project Overview June22, 2017 A Compelling Canadian Development Opportunity Supported by High Quality Royalties
  • 2.
    Forward-Looking Statements Cautionary Statement Thispresentation contains certain information that constitutes “forward-looking information” and “forward-looking statements” as defined under Canadian and U.S. securities laws. All statements in this presentation, other than statements of historical fact, are forward-looking statements. The words “expect”, “believe”, “anticipate”, “contemplate”, “may”, “could”, “will”, “intend”, “estimate”, “forecast”, “target”, “budget”, “schedule” and similar expressions identify forward-looking statements. Forward-looking statements in this presentation include, without limitation, information as to our strategy, projected gold production from the Young-Davidson, Hemlo – Williams, Eagle River, and Fosterville mines, which are not owned by the Company, project timelines, resource and reserve estimates, projected production and costs of the Kemess Underground Project and Kemess East Project, other statements that express our expectations or estimates of future performance, value growth, value creation and shareholder returns, the success of exploration activities, mineral inventory including the Company’s ability to delineate additional resources and reserves as a result of such programs, mineral reserves and mineral resources and anticipated grades, exploration expenditures, costs and timing of any future development, costs and timing of future exploration , the presence of and continuity of metals at Kemess East at modeled grades, as well as expectations relating the assets acquired through the acquisition of Kiska Metals. Forward-looking statements are necessarily based upon a number of factors and assumptions that, while considered reasonable by management at the time of making such statements, are inherently subject to significant business, economic and competitive uncertainties and contingencies. Known and unknown factors could cause actual results to differ materially from those projected in the forward-looking statements. Such factors and assumptions underlying the forward-looking statements in this presentation include, but are not limited to: changes to current estimates of mineral reserves and resources; fluctuations in the price of gold and copper; changes in foreign exchange rates (particularly the Canadian dollar and U.S. dollar); performance of the Young-Davidson, Hemlo – Williams, Eagle River, and Fosterville mines, which may impact the future cash flows associated with the Company’s royalty holdings; the impact of inflation; employee relations; litigation; uncertainty with the Company’s ability to secure capital to execute its business plans; the speculative nature of mineral exploration and development, including the risks of obtaining necessary licenses, permits, authorizations and/or approvals from the appropriate regulatory authorities for the Kemess Underground project; contests over title to properties; changes in national and local government legislation in Canada and other jurisdictions in which the Company does or may carry on business in the future; risk of loss due to sabotage and civil disturbances; the impact of global liquidity and credit availability and the values of assets and liabilities based on projected future cash flows; as well as business opportunities that may be pursued by the Company. Actual results and developments are likely to differ, and may differ materially, from those expressed or implied by the forward-looking statements contained in this presentation. Such statements are based on a number of assumptions, including those noted elsewhere in this document, which may prove to be incorrect. Readers are cautioned that forward-looking statements are not guarantees of future performance. All of the forward-looking statements made in this presentation are qualified by these cautionary statements. There can be no assurance that forward-looking statements or information will prove to be accurate, accordingly, investors should not place undue reliance on the forward-looking statements or information contained herein. The Company disclaims any intention or obligation to update or revise any forward-looking statements whether as a result of new information, future events or otherwise, except as required by applicable law. Cautionary Note to U.S. Investors Concerning Measured, Indicated and Inferred Resources This presentation uses the terms "measured", "indicated" and "inferred” resources. We advise investors that while those terms are recognized and required by Canadian regulations, the United States Securities and Exchange Commission does not recognize them. “Inferred resources” have a great amount of uncertainty as to their existence and as to their economic and legal feasibility. It cannot be assumed that all or any part of an inferred resource will ever be upgraded to a higher category. Under Canadian rules, estimates of inferred mineral resources may not form the basis of feasibility or other economic studies. United States investors are cautioned not to assume that all or any part of measured or indicated mineral resources will ever be converted into mineral reserves. United States investors are also cautioned not to assume that all or any part of an inferred mineral resource exists, or is economically or legally mineable. Qualified Person as Defined by National Instrument 43-101 John Fitzgerald, Chief Operating Officer for AuRico Metals Inc. has reviewed and approved the scientific and technical information contained within this presentation. Mr. Fitzgerald is a “Qualified Person” as defined by National Instrument 43-101. Note: All amounts are in US dollars unless otherwise indicated. 2
  • 3.
    1. Introduction andGeneral Overview 2. Kemess Overview 3. Kemess Underground (KUG) - Feasibility Study Highlights 4. Kemess East (KE) – PEA Highlights & Exploration 5. Kemess Valuation & Benchmarking 6. Summary 7. Q&A Table of Contents 3
  • 4.
    Kemess Underground Project– Key Technical Team John Fitzgerald Chief Operating Officer • Over 27 years experience • Director of Mining at Northgate Minerals and part of Young Davidson development team • Significant block/panel caving experience gained in various roles at Rio Tinto and De Beers • Former management roles at Barrick Gold, Scotia Capital and successful independent consultant Chris Rockingham Vice President, Development • Over 30 years experience • VP Exploration and Business Development at Northgate Minerals • Extensive precious and base metal deposit experience throughout North and South America • Recipient of H.H. “Spud” Huestis Award in 2016 Sean Masse Mining Project Manager • Over 16 years experience • Senior member of team that successfully brought New Gold's New Afton panel cave mine into production • Former superintendent and mine manager at New Afton • Most recently working to build Cementation Canada's business in Western Canada Mike Padula Surface Construction Project Manager • Over 29 years experience • Project Manager for Victoria Gold’s Eagle Gold Project in central Yukon • Manager of mining wastes and water for MMG Limited's Izok Corridor Project in Nunavut • Part of senior management group for both AMEC Americas and De Beers Canada which advanced Snap Lake Diamond Project to construction Harold Bent Director Environment • Over 25 years experience • Working at Kemess since 1999 with progressive responsibilities • Responsible for all environmental and regulatory compliance 1: Introduction 4
  • 5.
    AuRico Overview Compelling Opportunity ✓Strong balance sheet (C$27M cash2) with no debt ✓ Unique risk – reward dynamic through combination of stand-out development project with royalties ✓ Attractive valuation ✓ Strong management and technical team Kemess (100% Owned) ✓ Advanced-stage Au/Cu project in British Columbia ✓ Kemess Underground (KUG) EA Approved and IBA Signed ✓ Positive Economics – Supported by ~C$1B of infrastructure in place ✓ KUG Feasibility completed in March 2016; Kemess East PEA in May 2017; Kemess integrated study to be completed in 2018 ✓ +12Moz Gold Equivalent Ounces (all resource categories)1 Royalty Portfolio ✓ Portfolio of high quality NSR royalties in Canada and Australia ✓ 2017E Royalty revenue of C$12.7 – C$13.9M (US$9.5 - $10.4M) ✓ 21 royalties + 6 wholly-owned properties with royalty creation potential ✓ NSR Royalties incl. Young-Davidson (1.5%), Fosterville (2%), Hemlo (0.25%), Eagle River (0.5%), East Timmins (0.5%), Boulevard (1%), GJ (1%) 5
  • 6.
    0.20 0.40 0.60 0.80 1.00 1.20 1.40 Jul - 15Oct - 15 Jan - 16 Apr - 16 Jul - 16 Oct - 16 Jan - 17 Apr - 17 AMI Share Price Since Inception in July 2015 AMI (C$/shr) Gold Price US$/oz (indexed to AMI) Track-Record of Adding Value Kemess: ✓ Receipt of Environmental Assessment Certificate for Kemess Underground (KUG) ✓ A 188% increase in Indicated resource for Kemess East ✓ Signed Impact Benefits Agreement for KUG ✓ Announced positive PEA results on Kemess East Royalties: ✓ 2017E royalty revenue guidance increased by 19%- 24% to C$12.7 – C$13.9M ✓ Increase in P&P Reserves: Fosterville +66%; Hemlo +73%; Eagle River +15% ✓ Increase in Production Guidance: Fosterville + 43%- 55%; YD + 18-24%; Eagle River + 12%-22% ✓ Acquisition of Kiska Metals completed Key Developments – 2017 Year to Date AuRico Shares vs. Gold Price +7% +117% 6
  • 7.
    $0.96 $2.66 $2.37 ($0.26) $5.72 - 1.00 2.00 3.00 4.00 5.00 6.00 7.00 Royalties + Cash Kemess UG (perFS) Kemess East (per PEA) Corporate Outflow Total Net Asset Value per Share1 Significant Valuation Opportunity driven by: 1. Progressive recognition of Kemess’ value as project is advanced 2. Kemess East drilling and resource update 3. Integrated Feasibility Study for KUG and KE 4. Potential for royalties to continue to become more valuable / accretive deals (C$/sh) Royalty value at royalty co. P/NAV of 1.5x Share Price 7
  • 8.
    The Kemess UndergroundProject is 100% owned by AuRico Metals 2: Kemess Overview Processing plant (capacity of 52ktpd) Admin building Camp (accommodations for +300) KUG tailings storage facility KUG 8
  • 9.
    Kemess Existing Infrastructure ApproximatelyC$1 Billion of Infrastructure is Already in Place • Kemess South open pit mine operated from 1998 to 2011 • Tailings storage facility & waste rock dumps • Currently on care & maintenance (forecast of $4M for 2017) • Existing infrastructure includes: • Process plant of 52ktpd with grinding capacity currently limited to 25ktpd • Camp (7 x 40-person bunk house units, kitchen, potable water facility, sewage facility) • Powerline (380 km, 230 kV-power line step-down transformers, backup diesel generators) • Concentrate rail load-out facility in Mackenzie (currently being leased to Mt. Milligan) • Other (admin building, workshop, warehouse, 1,500m all weather air strip, 400 km access road) 9
  • 10.
    • Located innorth-central British Columbia • Approximately 250 km north of Smithers, and ~430 km northwest of Prince George • Kemess South (KS) mine, Kemess Underground (KUG) & Kemess East (KE) • KUG ~6.5 km north of existing KS processing plant, and KE deposit ~1 km east of KUG Location & General Overview 10
  • 11.
    Kemess History KS Mine- Successful Operating Track Record • Produced between 1998 - 2011 • Comprised a large open pit and 52ktpd plant • Produced ~3.0Moz Au, and 750M lbs Cu • Production ceased due to depletion of open pit mineral reserves 1996: Kemess property acquired by Royal Oak Mines 1998: Kemess South open pit mine commences operations 1999: Kemess acquired by Northgate Minerals 2011: Kemess South open pit mine operation end 2011: Northgate acquired by AuRico Gold 2013: KUG feasibility study released 2015: Kemess spun-out to AuRico Metals (as part of AuRico Gold - Alamos merger) 2016: KUG updated feasibility study released 2017: KE resource update 2017: KUG EA Approval (Federal & Provincial) 2017: KUG IBA Finalized 2017: KE PEA 11
  • 12.
    Kemess Site Overview KemessUnderground (Feasibility – 2016) ▪ Reserves of 3.4Moz AuE1 (1.9Moz Au and 0.6Blbs Cu) ▪ NPV (5%, after tax) of C$420M and IRR of 15.4%2 ▪ LOM of 12 years at 207Koz AuE/yr at AISC of $718/oz ▪ Environmental Approvals received ▪ Permitting and review of financing alternatives ongoing  Unique development opportunity Kemess South (Past Producer: 1998 – 2011) ▪ ~C$1B of infrastructure in place (including processing facility, grid power, road, maintenance shop, etc.) ▪ Past production of 3Moz Au and 750Mlbs Cu  Brownfields opportunity significantly reduces risk Kemess East (PEA – May 2017) ▪ M&I rscs. of 4.0Moz AuE (1.7Moz Au and 1Blbs Cu) ▪ NPV (5%, after tax) of C$375M and IRR of 16.7%2 ▪ LOM of 12 years at 222Koz AuE/yr at AISC of $744/oz ▪ Additional ~12,000m of drilling planned for 2017  Exciting upside potential 12
  • 13.
    Kemess – KeyStudy Outputs Kemess South1 (Actual) Kemess UG2 (Feasibility Study) Kemess East2 (PEA – PR ) Tonnes, Au Grade, Cu Grade 219Mt / 0.63gpt / 0.21% 107Mt / 0.54gpt / 0.27% 103Mt / 0.42gpt / 0.34% Throughput (tpd) 50,000 25,000 30,000 LOM Free Cash Flow (C$ M) $750 $987 $797 NPV (5%, After-tax) NA C$421M C$375M After-Tax IRR NA 15.4% 16.7% Initial Capex ~C$470M C$600M (US$450M) C$327 (US$245M) Mine Life (years) 13 12 12 Avg. Annual Gold Production (Koz) 241 106 80 Avg. Annual Copper Production (Mlbs) 64 47 57 Avg. Annual AuE Production (Koz) 431 207 222 Avg. Annual CuE Production (Mlbs) 151 104 92 Cash Costs Gold (by-product) ($/oz) $169/oz $94/oz ($415)/oz AISC – Co-product basis (Au; Cu) NA $718/oz; $1.44/lb $744/oz; $1.79/lb AISC – By-product basis (Au) NA $244/oz ($69)/oz KUG and KE have not been integrated – Optimization opportunity to be evaluated through integrated study 13
  • 14.
    KUG - Reserves& Resources Classification Quantity Grade Contained Metal Gold (g/t) Copper (%) Silver (g/t) Gold (koz) Copper (klbs) Silver (koz) Proven and Probable Proven - - - - - - - Probable 107,381 0.54 0.27 1.99 1,868 629,595 6,878 Total P&P 107,381 0.54 0.27 1.99 1,868 629,595 6,878 Measured - - - - - - - Indicated 246,400 0.42 0.22 1.75 3,328 1,195,300 13,866 Total M&I 246,400 0.42 0.22 1.75 3,328 1,195,300 13,866 Inferred Total Inferred 21,600 0.40 0.22 1.70 277 104,700 1,179 Kemess Underground M&I Resources are inclusive of reserves 14
  • 15.
    Kemess Timeline –And Cu Outlook 10,000 15,000 20,000 25,000 30,000 2014 2015 2016 2017 2018 2019 2020 2021 2022 2023 2024 2025 ThousandTonnes Production from Existing and Fully Committed Mines Supply (Mine Production + SXEW + Scrap) Demand Source: Teck, Wood Mackenzie, CRU, ICSG DEFICIT Expected First Production at Kemess Schedule as per Feasibility Study (March 2016) Federal and Provincial EA Approvals KUG Impact Benefit Agreement Signed Normal Course Permitting Detailed Engineering Project Financing Access Corridor Development Decline Development Develop Panel Cave First Production 20222016 2017 2018 2019 2020 2021 15
  • 16.
    3: KUG -Feasibility Study Highlights March 2016 - Positive Feasibility Study Update Announced for Kemess UG Footprint: 570 m E-W 90-300 m N-S 200 m draw height 200-500 m below surface 16
  • 17.
  • 18.
    KUG – FeasibilityStudy Summary • Meaningful production: 238Koz Gold Equivalent (AuE1) annually for first 5 years, 207Koz AuE over life of mine (LOM) (12 years) • Low cost: All-in Sustaining Costs per AuE of US$682/oz for first 5 years, US$718/oz LOM • Solid economics: • After-tax NPV (5%) of C$421M and IRR of 15.4% assuming $1,250/oz Au, $3.00/lb Cu, and a C$/US$ of 0.75 • Pre-commercial production capital of C$603M (US$452M) • Capital reduction opportunity exists by leasing all or a portion of the C$86M in underground mobile equipment purchases • Low risk: Project infrastructure is already in place (processing facility, grid power, access road, camp, admin and maintenance facilities, etc.) • Significant upside: Large (246Mt) M&I resource base (including 107Mt of reserves) situated directly adjacent to the extraction level (of the planned KUG panel cave) 18
  • 19.
    Proposed Mining Process Panelcaving underground mining minimizes waste rock 1. Ore crushed underground 2. Placed on conveyor to surface 3. Process plant ~25,000 tpd 4. Tailings deposited into Kemess South mined out pit 5. Au-Cu concentrate trucked to Mackenzie 6. Concentrate transferred to rail and sent to port/smelters Underground panel caving 19
  • 20.
    Waste Rock, TailingsStorage & Water Management • Existing Kemess South Pit will be the Kemess Underground Tailings Storage Facility (KUG TSF) • Waste rock (~3Mt) & tailings (~107Mt) produced through 12-yr mine life will be stored underwater in the facility • East rim will be raised 25m to accommodate volume in Year 6 to 8 • Mine water will be pumped to the KUG TSF during operations • Process water will be sourced from the KUG TSF 20
  • 21.
    Kemess Underground Cross Sectionshowing Decline, Underground Workings & Panel Cave • KUG reserve situated approximately 200 to 550 m below surface • Mine will be accessed and supported by a triple decline system comprising access, ore conveying and ventilation declines • Total LOM development requirements are estimated to be 47,750m lateral and 2,200m vertical development (all lateral development assumed to be by owner crews) • Total 2,250t of ore per metre of lateral development results from this mine design, representing a very high development efficiency compared to other UG mining methods • KUG panel cave requires < 5% of ore tonnes to be blasted (vs. 100% for a typical UG mine) “While all mining projects have residual technical uncertainties, the KUG Project is considered to be relatively low risk for a caving project in terms of key mining-related risks including production ramp-up, drawpoint stability, subsidence and mudrush.” - SRK Consulting 21
  • 22.
  • 23.
    KUG Surface Expression •Ore fed from undercut level to extraction level via 582 total drawpoints • Avg production rate of 25ktpd (9Mtpa) • Caving initiated in highest value ore at east end of KUG • Ore delivered to one of four primary jaw crushers located on extraction level • Following crushing, ore placed on 3.2km underground conveyor and then on a 4.9km surface conveyor to process plant 23
  • 24.
    Simplified Process Flowsheet •Processing of 9Mtpa using one of the two grinding circuits used to process KS ore • Tailings pumped and stored in the KS open pit with minimum capacity of 107.4Mt ore treated • Testwork resulted in estimated recoveries of 91% Cu, 72% Au and 65% Ag • Produces clean concentrate with no penalty elements and an estimated 22% copper content & high gold/silver by-product credits (30–50 g/t Au, and 75-100 g/t Ag in conc) • Ore NSR values peak at almost C$48/t in Year 3 of production and average C$35/t over LOM 24
  • 25.
    KUG: Production andCosts Low Cost Mining ▪ Avg LOM production of 106koz Au, 47M lbs Cu, 207koz AuE1 ▪ Total LOM cash costs of US$639 and AISC of US$718 per AuE ▪ AISC of US$682/oz over first 5 years ▪ Caving initiated in the highest value ore ▪ Low ‘break-even’ in early years allows for accelerated debt repayment ▪ Payback of 3.3 years (consensus pricing case2) 0 50,000 100,000 150,000 200,000 250,000 300,000 350,000 0 100 200 300 400 500 600 700 800 900 -1 1 2 3 4 5 6 7 8 9 10 11 12 13 Annual Gold Equivalent Production vs. USD AISC Gold Equivalent Production AISC(USD) $/oz Ounces 25
  • 26.
    Operating Expenses –Per FS • Average life of mine operating costs estimated at C$14.27/t ore • Labour significant component comprising: 53% of mining, 17% of processing and 26% G&A • Other significant costs include consumables (37% of processing), electricity (32% of processing) and flights and camp (28% of G&A) • Estimated 85% of operating costs will be C$ denominated, with the other 15% largely in USD consisting primarily of equipment spares, consumables and fuel Item C$/t ore Mining $5.39 Processing Plant $5.69 Water Treatment $0.26 G&A $2.93 Total $14.27 Mining 38% Processing 40% G&A 20% Water Treatment 2% Opex Breakdown 26
  • 27.
    Operating Cost Benchmarking (C$/Tonne) NewAfton Costs (Actuals per 2015 43- 101)(1) New Afton Scale-Adjusted Costs (2) Kemess UG Costs (per 2016 43-101) Mining 6.59 5.34 5.39 Processing 9.46 6.54 5.95 Site G&A 2.97 1.70 2.93 Total 19.02 13.58 14.27 • Kemess UG mining cost estimate compares well to existing block cave in British Columbia after adjusting for scale of the operation • Kemess UG processing costs are based on actual costs of operating the Kemess Mill (including then current labour costs), which ceased operations in 2011, updated for current consumables pricing • Kemess UG G&A costs are higher by $1 per tonne due to location, and the need to incur additional flight and camp costs 1) New Afton’s actual costs for 2014 are provided in table 21-2 of the New Afton NI 43-101 Technical Report dated March 23, 2015 2) Scale-Adjusted cost calculated by applying assumption that 40% of mining costs, 65% of processing costs, and 90% of G&A costs would remain constant if capacity was increased from 2014 actual throughput of 13,130 TPD to Kemess design capacity of 25,000 TPD 27
  • 28.
    Select Caving Comparables 2016ECash Cost (Co-Product) Positioning KUG in top quartile(2) Northparkes Cadia East New Afton Operation Tonnes (Mt) Au (g/t) Cu (%) Kemess UG 107 0.54 0.27 New Afton 60 0.60 0.78 Northparkes 102 0.26 0.60 Cadia East 1,500 0.48 0.28 Proven & Probable Reserve Comparison 28
  • 29.
    Capital Expenditures • “Lowrisk” capex given infrastructure in place; Proven logistics • 87% of capital expenditures are C$ denominated • Capex is heavily weighted to final 2 years prior to commercial production • Opportunity to reduce capex through equipment leasing (representing 19% of total capital) Item To First Production Additional to Commercial Production Total Mine $154 $46 $200 Mill $23 $6 $29 Access Corridor $27 $0 $27 Conveyor $30 $0 $30 UG Electrical & Ventilation $22 $0 $22 Owner’s Cost, G&A, Other $25 $1 $26 Capitalized Operating Costs $108 $71 $179 Pre-Comm Revenue $0 ($64) ($64) TOTAL $393 $59 $452 29
  • 30.
    0 40 80 120 160 200 Year -4 Year-3 Year -2 Year -1 Year 0 KUG Capital Costs (C$M) Capex Profile and Funding Alternatives ▪ Estimated Year -4 (mid ‘18 to mid ‘19) capital requirement of ~C$50M if non-critical path capital is deferred to following year • Pre-commercial capex1 per FS at commencement of construction totals C$587M (US$440M)2 Financing Advantages: ▪ 100% interest ▪ Unencumbered (no royalty on Kemess) ▪ Clean concentrate ▪ Valuable royalty portfolio 1 Includes capitalized operating costs of C$222M and pre-commercial revenue of C$83M 2 Excludes 2017 budgeted expenditures related to permitting, etc. Total: $580M+ 0 100 200 300 400 Offtake-linked project financing Sale of Royalty Portfolio Potential Kemess Royalty or Stream Sale of JV Interest and associated reduction in capex Illustrative Financing Alternatives (C$ M) ? 30
  • 31.
    Project Commodity AgencyPartner(s) Capital Cost1 Debt Arranged (Agency / Total) Direct Investment (Interest / Acquisition Cost) Escondida Copper JBIC BHP, Rio Tinto, Mitsubishi Corp., JX Nippon Mining, Mitsubishi Materials N/A $300m / $500m N/A (Expansion) Caserones Copper JBIC, NEXI, JOGMEC Pan Pacific Copper, Mitsui US$2,000m Undisclosed / US$1,400m N/A (Wholly-owned) Cerro Verde Copper JBIC Freeport McMoRan, Sumitomo Metal Mining, Cia de Minas Buenaventura US$985m US$247.5m / US$450m 21% / US$265m Sierra Gorda Copper JBIC KGHM, Sumitomo Corp., Sumitomo Metal Mining US$2,877m US$700m / US$1,000m 45% / US$724m Antucoya Copper JBIC Antofagasta, Marubeni US$1,300m US$195m / US$650m 30% / US$350m Copper Mountain Copper JBIC Copper Mountain Mining, Mitsubishi Materials C$437m US$160m / US$320m 25% / C$28.75m Gibraltar Copper - Taseko Mines, Sojitz N/A N/A 12.5% / C$187m Cote Gold - IAMGOLD, Sumitomo Metal Mining US$1,037m N/A 27.75% / US$195m Select Offtake-Linked Transactions 1. Capital cost at announcement of project financing Source: Cutfield Freeman & Co Ltd 31
  • 32.
    Environmental Permitting • OnMarch 15th CEAA issued a positive Decision Statement and the BC EAO granted an Environmental Assessment (EA) Certificate for KUG • Currently preparing necessary permits to commence construction, with permitting anticipated to be completed in Q2 2018 • In addition detailed engineering is in progress with a focus on access corridor construction related activities which are expected to account for first 12 months of construction schedule February 2014 Project Description submitted to the BC Environmental office (BCEAO) and Canadian Environmental Assessment Agency (CEAA) April 2014 Determination from BCEAO and CEAA that an Environmental Assessment is required May 2014 – January 2016 Finalization of Applicant Information Requirements (Terms of Reference) and preparation of Environmental Assessment Application May 2016 Submission of Environmental Application January 2017 EAO released draft Assessment Report which concluded that the project would not result in significant adverse effects March 2017 KUG granted EA Certificate from BCEAO and CEAA issued a positive Decision Statement Q2/2018 Expected receipt of normal course permits needed to commence construction Environmental Permitting Timeline 32
  • 33.
    Strong Relationships WithFirst Nations Which First Nations will be affected by the Project? • Two Aboriginal traditional territories overlap the Kemess Project location: Tsay Keh Dene and Takla Lake • One Aboriginal traditional territory is adjacent & downstream from the project location: Kwadacha • These three nations identify themselves as the Tse Keh Nay (‘TKN’) • On May 18th the Company entered into an Impact Benefits Agreement ("IBA") with TKN • The IBA provides a framework that formalizes the long-term co-operative relationship between AMI and TKN over the life of the project. • Captures mutual commitment to consult and maintain an open, respectful and cooperative relationship throughout the development and operation • Provides for meaningful TKN participation through training, employment, business opportunities, environmental protection and other means. 33
  • 34.
    4: Kemess East–PEA Highlights & Exploration 34
  • 35.
    Kemess: A Historyof Exploration Success Zone of Subsidence • 1975: First hole drilled at Kemess South, delineated in early 90’s • 1986 – 1992: Discover porphyry-style mineralisation at Kemess North (which is now KUG) • 2003: Inferred KN Open Pit resource: • 414 Mt @ 0.31 g/t Au and 0.16% Cu • 2006 - 2007: IP surveys/drilling identified new zone east of KN • Federal Review Panel recommended against developing Kemess North Open Pit as risks outweighed benefits • 2010 – 2013: • Geotechnical/hydrogeological drilling completed at Kemess Underground • 2013 Feasibility report deems Kemess Underground Panel Cave economic • Kemess Underground – Proven and Probable Reserves: 100.4 Mt @ 0.56 g/t Au, 2.05 g/t Ag and 0.28% Cu • 2013 -2014: • 2013: Revisit Kemess East, drilled 13,337m in 9 holes. • 2014: Continued exploration drilling – 16,873m in 12 holes. • Initial Kemess East resource estimate released January 21, 2015 • 2015-2016: • Continued delineation of Kemess East system and expanded exploration drilling 35
  • 36.
    Kemess East ResourceUpdate • Successful 2016 drilling program with highlight holes including: • #13: 628m of 0.53 g/t Au, 0.41% Cu • #12: 549m of 0.55 g/t Au, 0.41% Cu • #9: 504m of 0.52 g/t Au, 0.36% Cu • High grade core associated with strong potassic alteration zone which remains open both to north and south, as does the overall deposit • Overall Indicated category tonnage increased by 74Mt (188%) compared to March 2016 estimate • High grade Indicated core includes: 67Mt at 0.43% Cu and 0.60 g/t Au ~82Mt in high grade (potassic strong) core with Cu grade 60% higher and Au grade 8% higher than KUG Reserves Kemess UG + Kemess East Reserves and Resources (all categories) of +12Moz AuE Indicated tonnes in high grade core increased by 250% Classification Quantity Grade Contained Metal Gold (g/t) Copper (%) Silver (g/t) Gold (koz) Copper (klbs) Silver (koz) Indicated potassic strong 67,200 0.60 0.43 2.06 1,292 640,000 4,457 potassic moderate 40,000 0.27 0.32 1.81 352 286,000 2,336 potassic weak 5,100 0.19 0.22 1.45 31 24,000 238 phyllic + propylitic 800 0.20 0.21 1.40 5 4,000 36 Indicated - Total 113,100 0.46 0.38 1.94 1,680 954,000 7,066 Inferred potassic strong 15,200 0.51 0.41 2.05 249 137,000 1,003 potassic moderate 41,900 0.26 0.34 1.91 353 311,000 2,579 potassic weak 6,000 0.17 0.20 1.42 32 27,000 274 phyllic + propylitic 700 0.24 0.21 1.42 6 3,000 33 Total Inferred 63,800 0.31 0.34 1.90 640 478,000 3,889 Kemess East Resource1 M&I Resources are inclusive of reserves 36
  • 37.
    Kemess East 2017Drill Targets Pad I KOZ zone Pad E Pad D 5 Pad A Pad I KOZ zone • 2017 drill program of ~12,000 metres planned at KE (~C$4M - $5M) • Program will include: • infill drilling targeting the potassic strong zone, • growth holes on the outer edges of the known deposit, and • looking for higher grade within the Kemess Offset Zone • Kemess Offset Zone is located between the KUG and KE deposits, which are one km apart KE Looking South Pad A Pad I KOZ zone 37
  • 38.
    Kemess East (KE)– PEA Summary • PEA for KE project completed by Golder Associates in May 2017, with NI 43-101 report to follow • Presents stand-alone scenario that does not factor in or modify economics of the Feasibility stage KUG Project • KE underground panel cave is 0.9km east of KUG and 770m deeper • Total life-of-mine production of 963koz gold, 687Mlbs copper and 3.8Moz silver • After-tax NPV5% of C$375M, and IRR of 16.7% • Key upsides include: • Sequencing – consider overlapping production between KUG and KE • Integration – potential economies of scale with KUG project on ore processing, G&A and site services • Mineral Resources – Improving quality and quantity of KE mineral resource • Next steps include: • 2017 Kemess drilling (Q3) to lead to an updated KE mineral resource estimate (early 2018) • Complete a feasibility-level study on integrated development scenario for KUG and KE 38
  • 39.
    Significant Production Scale - 50,000 100,000 150,000 200,000 250,000 300,000 350,000 Y4Y5 Y6 Y7 Y8 Y9 Y10 Y11 Y12 Y13 Y14 Y15 Y16 Y17 Kemess East - Project Schedule Year Kemess East AuE Production (oz) 0 50,000 100,000 150,000 200,000 250,000 300,000 350,000 -2 -1 1 2 3 4 5 6 7 8 9 10 11 12 13 KUG - Project Schedule Year KUG AuE Production (oz) • KUG (2016 – Feasibility) : LOM of 12 years at 207Koz AuE1/yr at AISC of $718/oz • Kemess East (2017 – PEA): LOM of 12 years at 222Koz AuE1/yr at AISC of $744/oz 39
  • 40.
    Kemess East –Opportunities & Next Steps Upcoming Near-Term Activities Q3 2017 •Additional in-fill and expansion drilling Q4 2017 •Release of 2017 Kemess East drill program results Q1 2018 •Incorporate 2017 drilling data into update KE mineral resource estimate 2018 •Complete feasibility-level study on integrated development scenario for KUG and KE 2018 •Complete additional metallurgical test work on KE ore 2018 •Continue baseline environmental data collection for KE Project Enhancement Opportunities Sequencing: Alternative scenario to evaluate overlap in production between KUG and KE Integration with KUG project: Economies of scale for integrated scenario may exist in: ore processing, G&A and site services Mineral Resources: KE mineral resource remains open to the north, south, and west Development advance rate: Increase development efficiencies of forecasted UG development rate of 4.5 m/day per heading Metallurgy: Further improvement in recoveries and concentrate grade based on additional metallurgical test work Tailings alternatives: Additional tailings storage alternatives for KE could be studied, including the further use of conventional slurry tails Mining mobile equipment leasing: PEA assumes purchasing all mobile equipment for C$90M Operating cost: Potential to decrease mining operating costs with automated production load-haul-dump (LHD) equipment 40
  • 41.
    5: Kemess –Valuation & Benchmarking EA and IBA in place BC, Canada Kemess represents biggest value opportunity Overall revenue mix ~50%/50% Au/Cu KUG: 12 yrs KE: 12 yrs Lowest Cost Quartile Annual prod’n of KUG: 207koz AuE KE: 222koz AuE Large porphyry system that is not fully explored 41
  • 42.
    Kemess - Sensitivities KUGProject Sensitivities 1 2 3 Gold Price (US$/oz) $1,250 $1,250 1,350 Copper Price (US$/lb) $2.50 $3.00 $3.00 C$/US$ 0.75 0.75 0.75 After-Tax Net Cash Flow (C$ M) $746 $969 $1,067 After-Tax NPV (5%) (C$ M) $289 $421 $479 After-Tax IRR 12.6% 15.4% 16.5% Payback (years) 3.9 3.3 3.1 KUG Sensitivities - Figures as per Feasibility Study Update (March 2016) KE Sensitivities - Figures as per PEA release (May 2017) KE Project Sensitivities 1 2 3 Gold Price (US$/oz) $1,270 $1,250 $1,350 Copper Price (US$/lb) $2.60 $3.00 $3.25 C$/US$ 0.74 0.75 0.75 After-Tax Net Cash Flow (C$ M) $623 $797 $1,014 After-Tax NPV (5%) (C$ M) $269 $375 $507 After-Tax IRR 13.9% 16.7% 19.9% Pre-tax Payback (years) 4 3 3 42
  • 43.
    KUG Value CreationThrough Advancement $421 $1,136 $0 $200 $400 $600 $800 $1,000 $1,200 2016 2017 2018 2019 2020 2021 2021 NAV Kemess Underground - 5% NAV (after-tax) Over Time (C$ M) Investment (Capex) Time Value ~C$160M Average Annual LOM Operating Cash Flow ~10x Potential Cash Flow Multiple ~C$1.6B Implied Value Potential Per Feasibility Study (March 2016), $1,250/oz Au, $3.00/lb Cu, C$/US$ of $0.75 Pre-First Production Capex of C$524M (US$393M) Advancement of Kemess UG presents opportunity for +C$1.0B potential valuation (before factoring in Kemess East opportunity) 43
  • 44.
    0.91x 0.82x 0.79x 0.79x 0.77x 0.76x 0.66x 0.53x 0.51x 0.48x 0.43x 0.41x 0.34x Sabina LundinGold Osisko Integra Dalradian Victoria Harte AuRico OrlaMining Continental BeloSun Falco GoldQuest $656 $533 $473 $359 $301 $297 $257 $224 $221 $153 $147 $112 $74 Osisko LundinGold Continental Integra Dalradian Sabina Victoria Harte BeloSun Falco AuRico OrlaMining GoldQuest - 0.50x 1.00x 1.50x 2.00x 2.50x Jun-16 Sep-16 Dec-16Mar-17 Jun-17 Price/NetAssetValue(x) 1.48x 0.66x 0.53x 1.26x AuRico Metals Relative Positioning - 5.0x 10.0x 15.0x 20.0x 25.0x 30.0x Jun-16 Sep-16 Dec-16 Mar-17 Jun-17 Price/NTMCashFlow(x) 18.8x 8.2x P/NAV Multiples Over Time1,2Relative Positioning1,2 P/NTM CF Multiples Over Time1,2 ▪ 1Market data as at June 9, 2017. ▪ 2Based on analyst consensus estimates of NAV and cash flow. ▪ 3Average excludes AuRico. ▪ Senior Gold: Agnico, AngloGold, Barrick, Gold Fields, Goldcorp, Kinross, Newcrest, Newmont, Randgold, and Yamana. ▪ Senior Royalty: Franco-Nevada, Osisko, Royal Gold, Sandstorm, and Wheaton Precious Metals. ▪ Source: Bloomberg Financial Markets and Thomson One Analytics. MarketCap(US$mm)P/NAV(x) AuRico Sr. Gold Sr. RoyaltyGold Dev. Peer Avg.3 0.64x Source: CIBC World Markets Inc. AMI trading below developer comps, despite having a high quality royalty portfolio which should trade at a premium to NAV 44
  • 45.
    Kemess Project Positioning GoldDevelopers ▪ 1) Based on respective company’s price deck. ▪ 2) AMI enterprise value adjusted for fair value of royalties assumed based on analyst consensus estimates. ▪ 3) Based on 2016 Fraser Institute “Survey of Mining Companies”; “Best Practices” based on world class regulatory environment, highly competitive taxation, no political risk or uncertainty and a fully stable mining regime. ▪ Kemess compares favourably to other projects on a number of factors including: stage, jurisdiction, scale and valuation Company Project NPV(1) EV / Project NPV EA Approval                   Jurisdiction(3) 73 73 69 75 61 82 61 76 58 75 n/a 65 59 30 81 44 75 73 AMI Gold Developers Gold DevelopersKemess PEA PFS FS 0.0 0.1 0.2 0.3 0.4 $0 $200 $400 $600 $800 $1,000 AvgAnnualAuEq Production(Moz) NPV(US$mm) Avg AuEq Production - x 1.00x 2.00x 3.00x EV/Project NPV(2) KUG KE Buritica Stibnite Frutaldel Norte Horne5 VoltaGrande EagleGold Montagne d’Or BackRiver Amulsar Ixtaca Curraghinalt Romero ReliefCanyon CerroQuema SugarZone RedMountain Source: Macquarie Capital 45
  • 46.
    ▪ Both KemessEast and Kemess Underground have industry leading AISC margins ▪ Note: Width of bubble size proportionate to LOM capex requirements. ▪ 1) Indicative AISC margin calculated as US$1,250/oz gold minus by-product AISC. Based on company disclosure. ▪ 2) Indicative AISC margin calculated as US$1,250/oz gold minus co-product AISC. Based on company disclosure. Kemess Project Positioning Precious Metals Buritica Cerro Quema Red Mountain Amulsar Back River KEEagle Gold Fruta del NorteKUG Curraghinalt Romero Stibnite Horne 5 Relief Canyon Volta Grande Montagne d'Or Ixtaca Sugar Zone $300 $400 $500 $600 $700 $800 - 2 4 6 8 10 12 14 16 18 IndicativeAISCMargin(US$/oz)(2) Mine Life Source: Macquarie Capital Co-Product AISC Margin KE KUG Horne 5 Ixtaca Buritica Cerro Quema Red Mountain Amulsar Romero Stibnite Back River Fruta del Norte Ea… Curraghinalt Volta Grande Montagne d'Or Relief Canyon Sugar Zone $0 $200 $400 $600 $800 $1,000 $1,200 $1,400 $1,600 $1,800 - 2 4 6 8 10 12 14 16 18 IndicativeAISCMargin(US$/oz)(1) Mine Life By-Product AISC Margin 46
  • 47.
    Recent Comparable Transaction CôtéProject (Sumitomo acquired 27.75% for US$195M) vs. Kemess Units Côté Gold Project Kemess UG Kemess East Ownership 64.75% 100.00% 100.00% Royalty Encumbrance 0.75% - 1.50% 0% 0% Location ON BC BC Mine Type Open Pit Panel Cave Panel Cave Study PFS (2017) FS (2016) PEA (2017) Stage Greenfields Brownfields Brownfields EA Yes Yes Yes Permitting Ongoing Ongoing Ongoing IBA with First Nations No Yes No P&P Reserves (100% basis)1 Mt 196 107 113 (M&I) Gold Grade g/t 0.94 0.54 0.46 (M&I) Copper Grade % - 0.27 0.38 (M&I) AuEq Grade2 g/t 0.94 1.01 1.12 (M&I) Contained AuEq Koz 5,926 3,478 4,071 (M&I) Mine Life Years 17 12 12 Milling Capacity ktpd 32 25 30 LOM Avg AuEq Prod’n koz/yr 320 207 222 Notes: 1Kemess East tonnage, grade and contained metal based on M&I Resources 2AuE calculations based on $1,250/oz Au, $3.00/lb Cu and $18.00/oz Ag 3 NPV’s and IRR’s based on commodity prices of: $1,250/oz Au, $3.00/lb Cu and $18.00/oz Ag After-tax NPV (5%)3 US$M $703 $316 $281 After-tax IRR3 % 14.0% 15.4% 16.7% Initial Capital US$M $1,047 $515 $245 Total Capital US$M $1,465 $713 $587 LOM Average AISC (Co-product) US$/oz $689 $718 $744 LOM Average Operating Costs US$/t $15.43 $12.60 $12.62 47
  • 48.
    Advanced-stage (EA Approved,IBA in hand, FS complete) Brownfields; lower risk capex Sizeable resource: +12Moz AuE ounces (all resource categories) Long life (12 years at KUG plus further 12 years at KE) Solid KUG economics with significant upside (especially from KE) Good jurisdiction Clean concentrate Unencumbered asset 6. AuRico Summary Why Kemess? Why AuRico? Strong Team Business supported by valuable Royalty Portfolio Compelling Valuation Positive Au/Cu Outlook Several Upcoming Catalysts Including: Kemess East Drilling / Resource Update KUG & KE Integrated Scenario Royalty Updates 48
  • 49.
    7. Questions &Answers 49
  • 50.
    Endnotes Slide 5 –Overview: 1) Gold equivalent calculated on basis of $1,250/oz Au and $2.75/lb Cu 2) Mar. 31, 2017 cash balance adjusted to include additional C$11M in cash, as per Q1 2017 announcement dated May 4, 2017 Slide 7 – 1) NAV per Share – Value of royalties based on analyst consensus using latest reports from Macquarie Capital Markets, National Bank Financial and Laurentian Bank Securities; Kemess per FS (Mar. 23, 2016) at Consensus pricing ; Kemess East per PEA (May 29, 2017) at Base-case pricing; and Corporate Outflow per analyst consensus Slide 12 - 1) Gold equivalent calculated on basis of $1,250/oz Au and $2.75/lb Cu 2) Assumes $1,250/oz Au, $3.00/lb Cu, and C$/US$ of 0.75 Slide 13 - Kemess Key Study Outputs: Gold equivalent ounces calculated on the basis of $1,250/oz Au and $2.75/lb Cu 1) Kemess South data compiled from historical year-end MD&A reports from Northgate Minerals Corporation 2) Assumes $1,250/oz Au, $3.00/lb Cu, and C$/US$ of 0.75 Slide 18 –1) Gold equivalent calculated on basis of $1,250/oz Au and $2.75/lb Cu Slide 25 –1) Gold equivalent calculated on basis of $1,250/oz Au and $2.75/lb Cu 2) ) Consensus pricing deck assumes $1,250/oz Au, $3.00/lb Cu, and C$/US$ of 0.75 Slide 28 - Select Caving Comparables 1) Proven and Probable Reserves for New Afton and Cadia East shown as of Dec 31, 2016; Kemess and Northparkes shown as of Dec. 31, 2015 2) KUG average total cash cost in commercial production Slide 36 – Kemess East Resource Estimate as of January 13, 2017 ▪ NSR cut-off value of C$17.3/t was used to define indicated and inferred resources within a reasonable prospects for economic extraction solid ▪ NSR calculation assumed US$3.20/lb copper, US$1,275/oz gold and US$21.0/oz silver prices; and C$/US$ exchange rate of 0.76. ▪ NSR calculation assumed metallurgical recoveries of 91% copper, 72% gold and 65% silver; as well as a 22% copper grade for concentrate. Molybdenum was excluded from the NSR calculation. ▪ Details of the Sample Preparation and Quality Assurance and Quality Control are presented in AuRico Metals’ November 8, 2016 press release reporting on the results of the Company’s 2016 drill program. ▪ Resources were generated from 81 holes drilled at Kemess East in 2006, 2007, 2013, 2014, 2015 and 2016. ▪ Exploration activities at the Kemess East deposit have been conducted under the supervision of Wade Barnes, PGeo, Kemess Project Geologist, for AuRico Metals. Mr. Barnes is a “Qualified Person” as defined by NI 43-101. ▪ Mineral Resources were prepared under the supervision of Marek Nowak, SRK Consulting (Canada) Inc. Mr. Nowak is a “Qualified Person” as defined by NI 43-101. Slide 39 –1) Gold equivalent calculated on basis of $1,250/oz Au and $2.75/lb Cu