- The document provides an overview and update of AuRico Metals Inc. in January 2016, including forward-looking statements and cautionary notes.
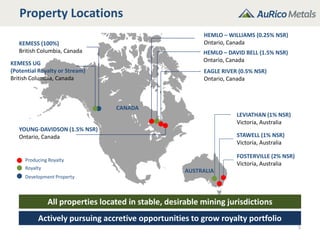
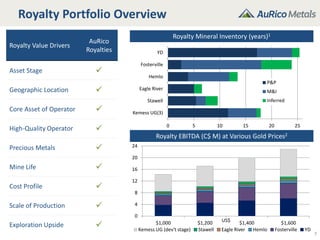
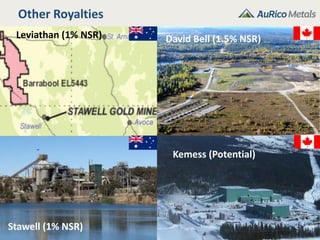
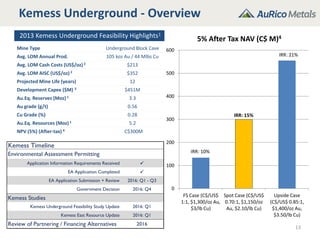
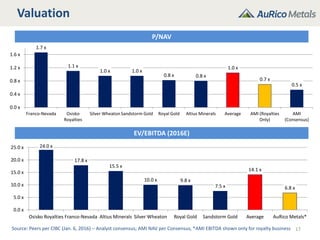
- It outlines AuRico's diversified royalty portfolio generating cash flow and its development-stage Kemess gold-copper project in British Columbia.
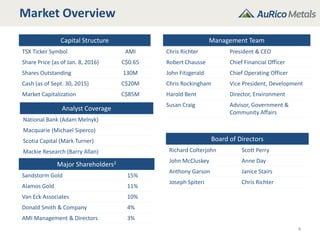
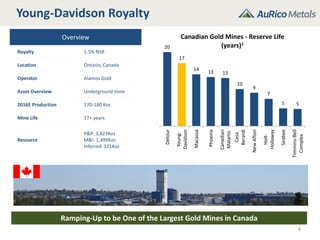
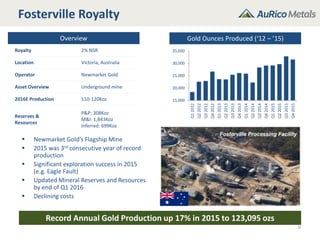
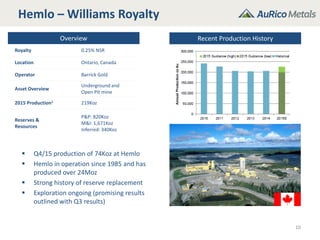
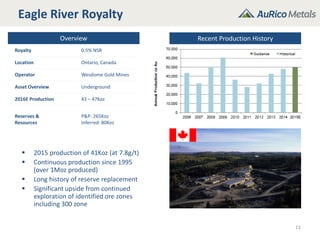
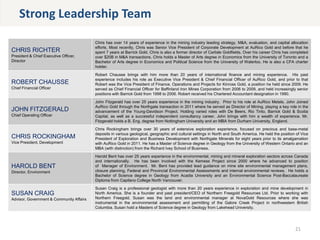
- Details are given on AuRico's capital structure, management team, and two of its most significant royalty assets - the Young-Davidson mine in Ontario and the Fosterville mine in Australia.


![OSHA 30 Hour certificate[1]](https://cdn.slidesharecdn.com/ss_thumbnails/9023e4a6-8a17-4b37-b395-894086993f89-151216002611-thumbnail.jpg?width=640&height=640&fit=bounds)


