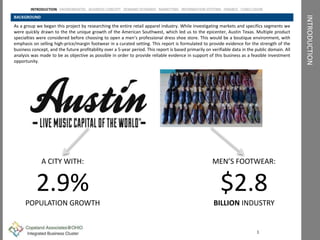
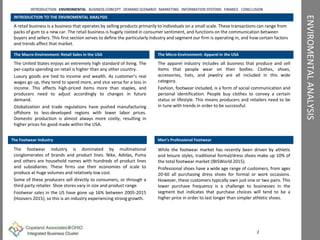
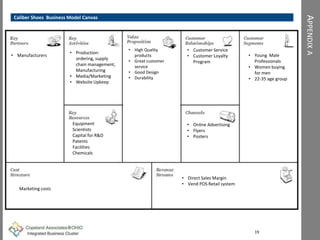
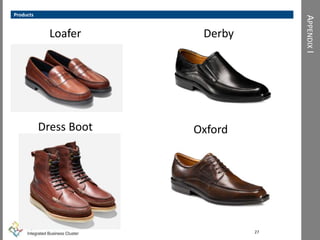
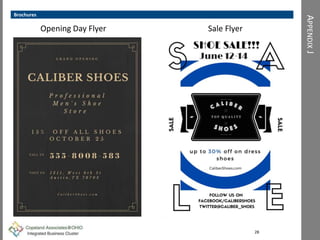
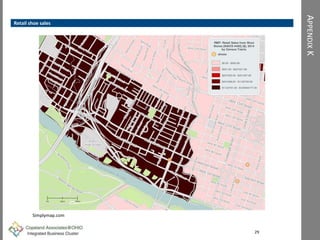
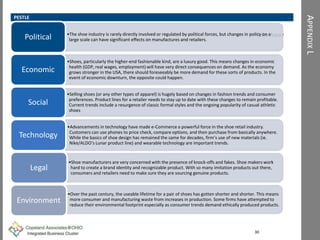
Company Analysis within the Pharmaceutical Industry
Prepared for use by:
Professor Keifer
Professor Lambert
Professor Levallet
Professor McElfresh
Prepared by: AM101 Cohort Team #5
Alex Baumann
Jeff Coad
Jack McCann
Andrew Ohl
Tara Tollett
November 3, 2015
Feasibility Analysis
INTRODUCTION ENVIROMENTAL BUSINESS CONCEPT DEMAND
SCENARIO MARKETING INFORMATION SYSTEMS FINANCE
CONCLUSION
TABLEOFCONENTS
Introduction
Environmental
Business Concept
Demand Scenario
Marketing
Information systems
Finance
Conclusion
1
2,3
4-6
7-9
10,11
12,13
14-16
17
Appendix 19-35
References 18
INTRODUCTION
BACKGROUND
As a group we began this project by researching the entire retail apparel industry. While investigating markets and specifics segments we
were quickly drawn to the the unique growth of the American Southwest, which led us to the epicenter, Austin Texas. Multiple product
specialties were considered before choosing to open a men’s professional dress shoe store. This would be a boutique environment, with
emphasis on selling high-price/margin footwear in a curated setting. This report is formulated to provide evidence for the strength of the
business concept, and the future profitability over a 5-year period. This report is based primarily on verifiable data in the public domain. All
analysis was made to be as objective as possible in order to provide reliable evidence in support of this business as a feasible investment
opportunity.
1
MEN’S FOOTWEAR:
$2.8
BILLION INDUSTRY
A CITY WITH:
2.9%
POPULATION GROWTH
INTRODUCTION ENVIROMENTAL BUSINESS CONCEPT DEMAND SCENARIO MARKETING INFORMATION SYSTEMS FINANCE CONCLUSION
ENVIROMENTALANALYSIS
INTRODUCTION TO THE ENVIROMENTAL ANALYSIS
A retail business is a business that operates by selling products primarily to individuals on a small scale. These transactions can range from
packs of gum to a new car. The retail business is hugely rooted in consumer sentiment, and functions on the communication between
buyers and sellers. This first section serves to define the particularly industry and segment our firm is operating in, and how certain factors
and trends affect that market.
The Macro-Environment: Retail Sales in the USA
The United States enjoys an extremely high standard of living. The
per-capita spending on retail is higher than any other country.
Luxury goods are tied to income and wealth. As customer’s real
wages go up, they tend to spend more, and vice versa for a loss in
income. This affects high-priced items more than staples, and
producers need to adjust accordingly to changes in future
demand.
Globalization and trade regulations have pushed manufacturing
offshore to less-developed regions with lower labor prices.
Domestic production is almost always more costly, resulting in
higher prices for good made within the USA.
The Micro-Environment: Apparel in the USA
The apparel industry includes all business that produce and sell
items that people wear on their bodies. Clothes, shoes,
accessories, hats, and jewelry are all included in this wide
category.
Fashion, footwear included, is a form of social communication and
personal identification. People buy clothes to convey a certain
status or lifestyle. This means producers and retailers need to be
in tune with trends in order to be successful.
2
The Footwear Industry Men’s Professional Footwear
INTRODUCTION ENVIROMENTAL BUSINESS CONCEPT DEMAND SCENARIO MARKETING INFORMATION SYSTEMS FINANCE CONCLUSION
The footwear industry is dominated by multinational
conglomerates of brands and product lines. Nike, Adidas, Puma
and others are household names with hundreds of product lines
and subsidiaries. These firms use their economies of scale to
produce at huge volumes and relatively low cost.
Some of these producers sell directly to consumers, or through a
third party retailer. Shoe stores vary in size and product range.
Footwear sales in the US have gone up 16% between 2005-2015
(Hoovers 2015), so this is an industry experiencing strong growth.
While the footwear market has recently been driven by athletic
and leisure styles, traditional formal/dress shoes make up 10% of
the total footwear market (IBISWorld 2015).
Professional shoes have a wide age range of customers, from ages
20-60 all purchasing dress shoes for formal or work occasions.
However, these customers typically own just one or two pairs. This
lower purchase frequency is a challenge to businesses in the
segment but indicates that purchase choices will tend to be a
higher price in order to last longer than simpler athletic shoes.
ENVIRONMENTALANALYSIS:CHOOSINGOURLOCATION
Introduction to Austin Texas
The city of Austin, Texas is home to nearly 1 million people. Often
called “The Live Music Capital Of The World”, the city is a primary
cultural center in Texas and the entire American South. Home to
the University of Texas and events like SXSW (South by Southwest)
and Austin City Limits, the city stands out in the region with it’s
young and progressive population. Being a vibrant city that stands
out in it’s environment is why we chose this as the site for our
business.
Demographics
The state of Texas is ground-zero for the Sunbelt boom, or
population growth in the warm climates in the South/Southwest
regions of the USA. The Austin metropolitan area is the 2nd fastest
growing area in the entire country (forbes.com).
Residents of Austin on average make nearly $7,000 more per year
than Texas as a whole and are twice as likely to have a bachelors
degree (Census.gov). The annual South by Southwest (SXSW)
music and technology conference has help cement the city’s
reputation as a national hub for technology and culture. This has
brought in an influx of young, urban professionals working for
large established firms and novel start-ups.
Conclusion
The demographics of Austin tell a compelling story, this is a rapidly growing market of high-earning young people. Austin is a place with
expanding economic opportunity for the educated consumer. Young people spend a large portion of their income on luxury goods, and
use apparel as a way to communicate and define themselves. Harder to quantify with statistics is Austin’s independent spirit that makes it
a great place for authentic/boutique retailers. As a group we chose Austin as a place that combined economic success with cultural
distinction. We made the inference that consumers in Austin would be interested in spending their disposable income on high-priced
apparel, and local data supports that independent businesses are succeeding in this and closely related markets.
3
INTRODUCTION ENVIROMENTAL BUSINESS CONCEPT DEMAND SCENARIO MARKETING INFORMATION SYSTEMS FINANCE CONCLUSION
Local Competition Online Competition
While brick-and-mortar stores are who Caliber will directly
compete with, the power of online retailers cannot be ignored. By
revenue, Amazon is the largest shoe seller in the world. Along with
other e-Commerce leaders like Zappos and CCS, these firms seek
to sell directly and efficiently. Our business will be challenged to
compete with these sellers on price, and will need to make up for
that weakness by delivering a quality consumer experience.
Customers buying expensive shoes may be more interested in
trying before they buy, so a complete inventory of sizes and styles
is critical.
The shoe market in Austin includes national chain stores (DSW,
Famous Footwear, etc) and more boutique independent stores
that are locally owned and operated. These are different business
models that cater to different sorts of consumers. The ‘big-box’
style stores are focused on value-based marketing. The boutiques
focus more on high-priced luxury goods and are more often small,
well-designed, artful spaces. Caliber shoes is a store that intends
to be more like the latter. The neighborhood we chose is centrally
located with nobody nearby who would directly compete.
BUSINESSCONCEPT
Introduction
Our business concept was developed through hours of discussion
and research about the retail apparel industry. Planning a business
around one location steered us towards selling high-priced/margin
goods. We narrowed our segment down to men’s professional
shoes after analyzing consumer trends and determining it was an
underserved market with opportunities for newcomers. We chose
the city of Austin after comparing similar multiple mid-sized cities.
We thought on the concept of what is a specialty retail store. Our
team defined it as a place you would go out of your way to go to.
We then thought what would that store sell. We didn’t want to
sell anything that you could easily pick up at a general or
department store. We chose to focus on men’s dress shoes. Our
team all agreed that we would go out of the way to get men’s
dress shoes. We expected to stores we would go to to have a sole
focus on men’s dress shoes and be able to provide valuable
information on them. We decided to call our store Caliber Shoes.
The history of the word caliber actually has meaning that is
directly related to shoes. Our store will also sell footwear
accessories including shoe trees, socks, laces, shoe horns, and
polish. We are targeting young wealthy individuals. The location
we have chosen for our company is around the downtown area of
Austin, Texas.
Etymology of Caliber
We chose the name Caliber for our company. The word originated
in the 1800’s with the word kalapous originally meant shoemakers
last, a tool used by shoemakers to repair and condition shoes. The
name has evolved over the years and is now caliber. Caliber is
typically associated with firearms however, it is also defined as
“the quality of one’s character” (Dictionary.com). Our company
stands for quality shoes and superior customer service. Shopping
at Caliber Shoes will demonstrate that person’s character as
someone who cares about the thing’s they buy and the shoes they
wear.
4
INTRODUCTION ENVIROMENTAL BUSINESS CONCEPT DEMAND SCENARIO MARKETING INFORMATION SYSTEMS FINANCE CONCLUSION
Figure 1
BUSINESSCONCEPT
Store Operations
We will have two sales associates that will be paid $8.50 an hour
plus 10% commissions. There will be two retail managers that will
make $45,000 each. The hours of our store will be 9am to 9pm
during weekdays. On Saturday we will extend operation hours to
9am to 10pm. Sunday we will be open from 12pm to 9pm.
Throughout the year we will be open daily except for select
holidays. Our company will carry five of the highest quality men’s
dress shoe brands in the industry. This will include Belvedere, Cole
Haan, ECCO, Joseph Abboud, and Magnanni. Our store will feature
local music and artwork to help connect our store to Austin’s
culture.
Location
The location we have chosen for Caliber Shoes is Austin, Texas.
We chose Austin Texas because we know how important culture is
to this city. Austin’s motto is “Keep Austin Weird” and was listed
as the 7th best city in America to start an independent business
(Washington Post, 2015). Austin is very culturally advanced and
highly supports creativity. In the area we chose 24% of the people
have and average income of over 150,000 a year (appendix N)
which mean’s customers would be willing to pay more for high
quality items. There is a large number of companies that are
headquartered or have a regional office in Austin. These
companies include Apple, Cisco, eBay, Google, IBM, Intel, and
Whole Foods Market (Austin Relocation Guide, 2013). This
provides a market for the young business professionals in Austin.
The location we have chosen within Austin is at the West 6th
Marketplace at 1211 W 6th St, Austin, TX 78703. The rent is $30
per square foot, and the square footage is 1,727. This comes out
to yearly rent of $51,810 (Loopnet, 2015). The amount of yearly
retail sales for footwear in this area of Austin is over $1 million
(Appendix K). There is an interesting opportunity to form a
business relationship with the shoe repair store that is two blocks
down the street. Partnering with local shoe repair stores and
offering a 10% discount for customers referred from their store
we can spread the word about our store’s opening brining in
customers. This could create an opportunity for a mutual
advertising relationship between the two companies. This area
only has one specialty shoe store and multiple shoe repair stores.
These few stores are bringing in are bringing in high revenue. The
median age of the people in the area of our store is 37. This
means that we will be targeting a fairly young demographic. With
a population of 20,774 in the zip code area nearly 5,500 people fit
into our target market (PRIZM, 2015).
5
INTRODUCTION ENVIROMENTAL BUSINESS CONCEPT DEMAND SCENARIO MARKETING INFORMATION SYSTEMS FINANCE CONCLUSION
Caliber Shoes will be a retail store that sells men’s footwear. The
store will focus specifically on dress shoes. The goal of our
company is to provide local businessmen with premium dress
shoes. In order to provide premium shoes to consumers, our
business will sell dress shoes that can be hefty in price. These
shoes are a requirement for the corporate world, and will
encompass a status symbol that we want our consumers to feel.
Our store will also sell footwear accessories like shoe trees, dress
socks, shoe laces, shoe horns, and polish. A shoe tree helps to
keep the form of the dress due to all of the moisture that is
accumulated within the shoe throughout the day (Business
Insider, 2015). Shoe horns are used to assist in putting on dress
shoes (Dictionary.com, 2015). The reason these are necessary is to
prevent damage to premium shoes.
Store Concept
The location we have chosen within Austin is at the
West 6th Marketplace at 1211 W 6th St, Austin, TX
78703. The rent is $30 per square foot, and the
square footage is 1,727. This comes out to yearly
rent of $51,810 (Loopnet, 2015). The amount of
yearly retail sales for footwear in this area of Austin
is over $1 million (Simply Map, 2015). There is an
interesting opportunity to form a business
relationship with the shoe repair store that is two
blocks down the street. Partnering with local shoe
repair stores and offering a 10% discount for
customers referred from their store we can spread
the word about our store’s opening bringing in
customers. This area only has one specialty shoe
store and multiple shoe repair stores. These few
stores are bringing in are bringing in high revenue.
The median age of the people in the area of our
store is 37. This means that we will be targeting a
fairly young demographic. With a population of
20,774 in the zip code area nearly 5,500 people fit
into our target market (PRIZM, 2015).
BUSINESSCONCEPT
The Building
6
Address: 1211 W 6th St
Rent: $4,317.50mo
INTRODUCTION ENVIROMENTAL BUSINESS CONCEPT DEMAND SCENARIO MARKETING INFORMATION SYSTEMS FINANCE CONCLUSION
The Layout:
The building layout for our retail space was designed from the ground up to meet our business's needs. Using an open layout, warm
lighting, and high-quality furniture we have created a space that is both comfortable and luxurious. Customers will be treated to an
image of the life they could be living when they are someone who wears fine leather shoes. An open floor plan with plenty of storage
space means this is a functional design for stocking inventory and displaying good for sale. Additional foot traffic from neighboring retail
businesses will increase days sales and advertise our location.
Utilities: $450~mo
Square Footage: 1727 feet
Figure 2
DEMANDSCENARIO
Comparable Markets
7
INTRODUCTION ENVIROMENTAL BUSINESS CONCEPT DEMAND SCENARIO MARKETING INFORMATION SYSTEMS FINANCE CONCLUSION
Location Average sales
per customer
Average
customers
per day
Average
daily sales
Average
Inventory
size
Demographics Number of
employees
$350 20 $7,000 1,000 25-50 3
$85 25 $2,125 5,000 20-40 5
$164 15 $2,460 1,500 25-32 2
$200 20 $4,000 2,000 22-34 3
When opening any business it is important to analyze
the area it will be operating in. The area of Austin Texas
is very unique and we needed to analyze how
companies were doing in these areas. We needed to
see what the demand for our store was so we broke it
down into two parts. First we called companies already
operating in that area and gathered information on
how they operate. Next we found information on our
demographic, which will be our main customer base.
In order to better understand our market we chose to compare ourselves to 3 distinct companies. Allen Edmonds, Aldo, and Johnston Murphy. Each of these stores operate
on a small scale usually having no more than 5 employees on staff. These companies all specialize in shoe sales. However, Aldo is a store that caters to both men and
women so the average number of customers per week is much higher due to a wider audience. We weighted Aldo at a 50% as this would give us roughly how many men
shop there.
Selling high quality and very specific items most specialty shoe stores chose to focus more on quality over quantity when it came to employees. The retail stores we
compared ourselves to are all around the same size and able to operate with very few employees. We chose to operate with 3 employees who would be experts in our
product.
The area in Austin we have targeted is located between Austin Texas University and Austin High school. Hoping to bring in a crowd of young professionals we set our
demographic at 22-34 years old which is 292,182 of Austin Texas’s 885,400 population.
Not all the customers that will be entering the stores will be willing to buy an item. Asking companies what the average number of customers they had per day then what
percentage of customers ended up actually purchasing an item. Calculating the average number of customers that actually made purchases other stores operate at we
estimate that we would be able to see around 20 customers a day.
Availability of item was an important point that all stores mentioned when asked “what they considered to be a key to success?” All the stores we researched carried a
sizable amount of inventory based on other stores our size we would carry on average we have around 2,000 products in the store. We estimate that we can have around
600 units of products in the stock room and 1,400 units on the floor.
Finally, taking the average sales of our customers we averaged our sales at $200 per customer. Basing that off the amount of customers per week we can average $4,000
per day
Our findings
Figure 3
DEMANDSCENARIO
Demographics
8
INTRODUCTION ENVIROMENTAL BUSINESS CONCEPT DEMAND SCENARIO MARKETING INFORMATION SYSTEMS FINANCE CONCLUSION
Step 1 # of people who buy dress
shoes in our area
885,400 x .36 = 318,744
We took the population of Austin and then
took the percentage of consumers who
purchased men’s dress shoes in men’s
apparel stores (Simplymap).
Step 2 Our demographic
318,744 x .34= 107,576.1
We then took that number and found that
.34 percent of Austin is in our age
demographic 22-34. We multiplied the
number of men who buy dress shoes by our
demographic percentage
(Austintx.areaconnect.com, 2015).
Step 3 # of men in our
demographic
107,576.1 x .51 =
54,863.81
Around half of the population of Austin
Texas are males. We took the number of
men in our demographic who by dress shoes
and multiplied it by .51 to determine how
many of those consumers were men
(Austintx.areaconnect.com, 2015).
Step 4 # of daily consumers
(theoretically)
54,863.81 / 360= 152.40
Next we took the men in our demographic
and figured out how many people would be
buying shoes on a daily basis.
Step 5Average market share
shoe stores own
152.4 x .2 = 30.48
The businesses in the area attract on
average around 20 percent of the customers
buying shoes in Austin. (Simplymap). We
took twenty percent of the number of
consumers in the area to find how many
could be our customers.
Step 6 (Bonus) # of customers
with conversion rate
30.48 x .25= 7.62
Talking to local businesses we learned that
typically an outside store is expected to have
a conversion rate of 25%. The conversion
rate is the percentage of customers that
come in the store that make a purchase.
Due to our location in Texas we wanted to target the young professionals. We set our age demographics at 22- 34 and calculated how
many people from that age demographic would visit our store. We found the population of Austin to be 885,400 and then calculated using
Simplymap and other sources to find the percentage of people who buy dress shoes, how many of them are in our demographic, how
many of them are men, and finally how many we would get a day. Retail stores don’t get consistent business on the weekday.
Figure 4
DEMANDSCENARIO
Final Results
9
INTRODUCTION ENVIROMENTAL BUSINESS CONCEPT DEMAND SCENARIO MARKETING INFORMATION SYSTEMS FINANCE CONCLUSION
Demand scenarios Weight Customers per day (raw) Customers per day (actual)
Comparable markets 60% 20 12
Demographics 40% 30 12
Total 100% - 24
Average conversion rate for outdoor stores
Conversion rate is the percentage of customers
that will make a purchase once the visit the
store.
24
x .25
6
Not all the customers visiting the store will be
making purchases. The number of customers
that will visit our store is 24 with an average
conversion rate of 25% for outside stores we
estimate that 6 people will be making
purchases
In order to find the average number of sales per day we have to analyze the number of customers coming into our store and how much
the average number sales per customers. We took the individual brands and weighted them according to how many customers would be
interested in purchasing them. Most customer’s would mainly be interested in the lower priced options and we weighted the brands
according: ECCO 30%, Cole Hann 25%, Joseph Abboud 15%, Belvadere 15%, Magnnani 15%. We added the total sales with the weighted
scores and found the average daily sales to be $16,340.
We decided to weight our scores differently at sixty percent for comparable markets and forty percent for demographics. The comparable
markets score will give the most accurate number to expect. The companies that we compared ourselves to are all very successful
companies and operate in similar conditions. This number will be closer to what we will be likely to see every week. Our demographic is
still an important number which is why it still receives a good weight. The demographic demand scenario customers will be the most loyal
to us and, hopefully, be repeat customers. After we weighted the scores and we then added them together to get 32, customers per day.
Figure 5
Figure 5.1
MARKETING
Target Market
“For the man living the professional or casual lifestyle, Caliber provides excellent footwear options to discover
Austin with a new sense of style”
-Positioning Statement
Segmentation
The strategy that Caliber Shoes entails is to market its products to the right customers. The main segmentation method Caliber Shoes
incorporates is the demographic of men who need to purchase dress shoes. Caliber is based in Austin Texas, a fast growing city experiencing
a steady incline of jobs. Many young professionals and newly grads of Texas University will be in the market for a new pair of professional
shoes. Men make up 51% of the city of Austin and 36% of men living in Austin buy dress shoes (Simply Map). Specialty stores greatest
determinant is all about household income. The median income level of the location we have chosen for our store in Austin is $81,300
(PRIZM) and the median income of Austin is $49,987.
Positioning
Caliber Shoes delivers excellent quality trendy men’s footwear with passionate and expert assistance that allows customers to leave feeling
satisfied with their new shoe selection. Our store has a variety of shoe styles designed to fit in with any professional or casual setting. A pair
of shoes from Caliber is just the first step towards a successful future
Targeting
From extensive research and evaluation, Caliber has determined a target market that is the most fitting for our business. Due to the
elevated quality of goods and trendy designer brands that Caliber Shoes offers, we choose to target men between the ages of 22-34. We
choose this group specifically because of the large majority it encompasses in Austin, approximately 34% (Simply Map) and the increased
probability that our targeted age group will be purchasing their first pair of professional dress shoes. After researching this, Caliber Shoes
choose a store location in downtown Austin. The main reason for this choice was due to the absence of any other men’s shoe stores
(Appendix K).
10
INTRODUCTION ENVIROMENTAL BUSINESS CONCEPT DEMAND SCENARIO MARKETING INFORMATION SYSTEMS FINANCE CONCLUSION
MARKETING
Marketing Strategy
In the Fall of 2015, Team members Alex Baumann, Jeff Coad, Andrew Ohl, Jack McCann, and Tara Tollet partnered together to
form Caliber, an independently owned high quality handmade luxury men’s dress shoe specialty retailer consisting of some of
the top designers around the world. Founded and based in Austin Texas, Caliber has continued to see success as our
professionals work with customers to discover the perfect pair of stylish shoes for each and every setting.
-Mission Statement
Product
We strive to provide the customer with a superior product and
service compared to any that a competitor offers. With the latest
in footwear fashion our shoes can provide the edge or sleek to
any outfit (refer to appendix I). We work with customers who
may or may not be familiar with dress shoes. This ensures that
the customers feel comfortable with the professional’s advice
and their new shoe purchase.
Place
For Caliber Shoes we have chosen a storefront on the outskirts of
downtown Austin. This location has a variety of other businesses
around it making it noticeable, but we believe that a customer in
need of dress shoes seeks out the store location beforehand and
because of this Caliber did not choose a location with prime real
estate. As previously mentioned the Austin area is filled with our
target market and without any comparable competition the
location expects to succeed.
Price
The price at Caliber Shoes varies per type and brand of shoe. On
average our shoes are priced between $150-$350.This is due to
each pair being handmade of high quality materials and the target
market having high household incomes (Refer to appendix N) .
These prices are about the same as any competitor or online
source, but because of the expertise Caliber provides and the fact
that you can test how the shoes fit and feel, the customer is
capturing greater value.
Promotion
Caliber Shoes advertising will rely strongly upon our various forms
of social media, in-store promotions, and flyers (Refer to
Appendixes G,H,J). As Caliber continues to grow we hope that
customers word of mouth spreads awareness and increases into a
new customer base. The goal of Caliber Shoes advertising
campaign is to communicate the quality of shoes and the message
that your shoe says about you through a mixed media approach.
11
INTRODUCTION ENVIROMENTAL BUSINESS CONCEPT DEMAND SCENARIO MARKETING INFORMATION SYSTEMS FINANCE CONCLUSION
INFORMATIONSYSTEMS
Differentiating From Competition Criteria for our MIS Systems
When choosing which systems to purchase, our company will
choose the systems that meet the following criteria in order to
help gain our strategy:
• Cost efficiency
• Scalability
• Convenience
• Compatibility
• Accessibility
Since Caliber shoes is a startup company it is important for us to
purchase an online booking and accounting system to fit our
budget. Since we plan on growing and expanding in the future, it is
also important to have systems that have scalability.
This will allow us to keep the same software when the business
grows. We also need the systems to help increase the efficiency of
the company and they must be convenient. The systems need to
be easy to access for all employees. This will help us differentiate
from our competitors
Retailers are currently functioning in a playing field that is more
complex than ever. These days, not only are businesses up against
merchants who are selling similar products for less, but also
dealing with services and apps that make it easier for consumers
to find alternatives and better deals.
Before formulating our competitive advantage, we should
understand why customers pay more money for merchandise
even when there are cheaper alternatives. “According to
vouchercloud, a service that delivers local deals in Australia, the
top 5 reasons customers pay more for the same products are:
items are easy to purchase, fast order fulfillment, prestige, low
cost of ownership, and exceptional customer service” (vendHQ).
While lowering prices and offering huge deals helps produce some
success it will not be sustainable. Instead of reducing prices
retailers should learn how to add value to products, brands, and
services. This will attract the right customers and keep them
coming back. In order for businesses to reach sustainable success,
they need to differentiate themselves from their competitors.
Businesses can do this by creating strategies that add value.
12
People
Customers
Employees
Manufacturer
Manager
Business Processes
Recording Sales
Loyalty Program
Updating Inventory
Technology
iPads
VendHQ
Bundle
Website
Wifi Setup
MIS Triangle
Our business is focusing on selling high quality dress shoes for men.
One of the ways our business is going to add value is by getting an
integrated information system. Specifically, a POS system that will
integrate all of our data together into one location. With the right
POS system, we can add more apps that will we believe will
decrease the time it takes to sell our products and help offer our
customers a personalized customer loyalty program. This system,
along with the compatible apps, will help us differentiate form our
competitors.
Information systems are a great way to get in a strategic position
that will help our company grow, adapt, and succeed. Therefore,
choosing the best information systems on the market is a very
important step in our business plan.
Adding Value As A Strategic Advantage
INTRODUCTION ENVIROMENTAL BUSINESS CONCEPT DEMAND SCENARIO MARKETING INFORMATION SYSTEMS FINANCE CONCLUSION
Figure 6
INFORMATIONSYSTEMS
QuickBooks online is the number one selling accounting solution
for retail stores (quickbooks.com). The software helps our
business track expenses, pay wages to our workers, and create
financial reports.
QuickBooks online makes it easier to know the current state of our
business, allows employees to work together in any location, send
professional invoices, allows access on multiple devices, syncs
easily with our other apps, and grants multiple users access.
The app also keeps track of our income and organizes it into one
location. From bank deposits to weekly timesheets organizing our
income has never been so easy. They can share data through the
cloud. Since we can sync our apps and link our bank accounts to it,
we can also pay our bills and keep records of them. This will save
the business time and money everyday.
13
QuickBooksOnline
Vend Retail POS System
Customer
Loyalty
EcommerceVend
Register
Vend Register
Vend Loyalty Program (CRM)
Vend Ecommerce
Vend has an ecommerce feature that helps our company set up a
beautiful website for customers to visit. Although our company
currently does not have the option to purchase online, as we
grow, we plan on adding an online store. Vend will help us set this
up and allow us to manage the online store on our iPads and other
mobile devices.
Vend has an information gathering system in place already that
collects customer’s data. We will use the data that is collected and
store it in our database. This data will contain standard info for
instance customer’s name, email, phone number, ect.. However,
we will also store info pertaining to the customer’s unique
purchase. We will store the brand and style of the item they had
purchased last and the date the item was purchased. Six out of 10
shoe people who buy shoes buy them to replace old and worn out
ones (Mintel). Reminding the customers of us and the deals we
offer will make customers what to come back for repeat business.
This will also help to build a better relationship with the customers
which will lead them to trust our company and brands.
The Vend Register iPad app will help our company sell more
efficiently. The point of sale will be much quicker. The Vend
Register feature allows the cashier to look up the products the
customer wants on the iPad, select the payment method, add the
customer’s information to the system, and record the sale. The
app also uses automated reordering and allows us to adjust
reorder points and restock levels to make sure we never have too
much or too little inventory. This is all done with a minimal steps.
For more details on the the steps for the Vend Register (refer to
appendix C). This makes the point of sale and our overall business
process very quick. Refer to appendix XX for the business process
with the integration of the Vend POS system.
The number one POS software on the market is Vend. The Vend
Retail POS software helps our company with data integrity,
customer tracking, and customer loyalty. The system helps keep
our data safe and secure in the cloud. Vend comes with three
important features that will help our company maintain
sustainable success (refer to figure XX ).
All of these features of Vend can be easily accessed on our iPads.
Our company decided to purchase the iPad bundle See appendix F
for more details on the iPad bundle). The bundle includes all the
hardware we need to run our business in one convenient and
affordable package.
INTRODUCTION ENVIROMENTAL BUSINESS CONCEPT DEMAND SCENARIO MARKETING INFORMATION SYSTEMS FINANCE CONCLUSION
Figure 7
FINANCIALDATA
Sales and COGS
As stated in our demand scenario, our company expects to have 6
customers per day. Of our sales we expect to make 80% on credit
and 20% cash sales. These are the standard rates of the retail
industry (IBIS, 2015). There is a growth of 10.3% expected in the
shoe store industry in the next five years (Mintel, 2014). This will
lead to our daily shoe sales increasing from 6 customers per day to
9 customers a day by year 5. We selected five brands and three
types of shoes within each brand to sell to our consumers. Our
company researched the recommended retail price of each brand
of shoes. Then our company took the average price of each brand
and multiplied it by a weighted score to come to a weighted
average price of each company. The raw retail price was divided
by two to account for 100% markup, which is the standard in the
retail industry. We then did the same weighted method to
determine the average cost of goods sold.
Our company calculated the sales and cost of goods sold for
footwear accessories separately from the shoes. Caliber found the
total sales of footwear accessories in Austin and divided that
number to discover a daily amount. Our company came to the
conclusion that we would have a 20% market share in our local
market. Again, we used the standard 100% markup to calculate
the COGS for the footwear accessories.
The second line of the income statement includes COGS, rent
costs, and utilities for our building. This becomes our cost of goods
sold and occupancy costs. This is then subtracted from the sales to
come to the gross profit of our company. To see further
information regarding the calculations of the income statement
please refer to Appendix O. Also to see the key numbers from this
financial statement refer to figure
Start-up Costs
The start-up costs for our company included initial stocking of our
store, supplies for our store, two iPads, VendHQ equipment,
trademarks for our brand and logo, and additional cash. The
maximum inventory we hold is 1500 shoes at a time. The supplies
that were included in our store were pens, paper, and custom
bags for those that make purchases at Caliber Shoes. The iPads are
for our company’s point of sale system which is VendHQ. We felt
that it was necessary to obtain a trademark so that we could stake
our rights to the name and company logo.
Net Income
Our company is expecting to operate at a loss in the first year of
our operations. A major reason for this is because of the
preopening expenses that will be used towards renovations and
advertising. In the next four years, Caliber Shoes will operate at a
profit. By year five our company is expected be operating with a
profit of $90,463. To see a further breakdown of Caliber Shoes’
expenses refer to Appendix O.
Income Statement Numbers
Year Sales COGS Net
Income
1 656,769 394,953 (69,196)
2 724,416 417,163 22,051
3 799,031 454,238 45,819
4 881,331 495,132 69,384
5 972,108 540,238 90,463
14
INTRODUCTION ENVIROMENTAL BUSINESS CONCEPT DEMAND SCENARIO MARKETING INFORMATION SYSTEMS FINANCE CONCLUSION
Figure 8
FINANCIALDATA
Accounts Receivable, Accounts Payable, and Inventory
Caliber Shoes operates with the assumption that all sales are net
30 days. This leaves 30 days worth of credit sales as the ending
accounts receivable for the end of the year. For our total sales
80% are credit sales. Our accounts payable for each year take into
account the last order for our store of each year. Our accrued
expenses include the supplies that we are purchasing for the next
year of business. Based on the turnover of our company, we will
make 2 mass orders of our product in four out of five years. Our
company has decided to hold inventory at a maximum of 15,000
shoes. This is based on primary research that we conducted with
various dress shoe companies.
Capital Structure
Our business is required to raise capital four our start-up costs.
70% of this capital must be in the form of equity. We would get
this money from an angel investor that is interested in our
company. Our company would acquire the other 30% of capital as
debt from a bank loan. The interest rate on this loan would be 8%
and the loan is a 7 year loan with payments due quarterly. Our
research shows that investors typically look for a return that is 2.5
times their original investment (Prive, 2013). For our company this
would make the required rate of return 20% per year. When
calculated this makes our weighted average cost of capital
16.03%. This would be the required rate of return for our
company as a whole. This WACC is used when making our net
present value calculations.
Fixed Assets
Our company has equipment that is depreciated using the 5-year
MACRS schedule. This is for the two iPads and the VendHQ
system. These are necessary elements to our business that create
a relatively affordable option for the company. The iPad is used
with the VendHQ system as the point of sale system for Caliber
Shoes. The equipment for the business costs $1,486. By the time it
is depreciated into the fifth year it has a net value of $86. Our
company decided to trademark our logo and company name. This
is amortized using the straight-line method. It costs $300 for each
trademark, so this totals $600. Trademarks are useful for 10 years
so there is an amortization expense of $60 per year. By the fifth
year of our business the trademarks are net $300. For more
detailed information regarding our fixed assets refer to Figure 9.
Net Fixed Assets
Year Equipment Intangible
Assets
Start-Up $1,485.59 $600
Year 1 $1,188.47 $540
Year 2 $713.08 $480
Year 3 $427.85 $420
Year 4 $256.71 $360
Year 5 $85.57 $300
15
INTRODUCTION ENVIROMENTAL BUSINESS CONCEPT DEMAND SCENARIO MARKETING INFORMATION SYSTEMS FINANCE CONCLUSION
Figure 9
FINANCIALDATA
Cash Flows
Our company expects to have cash outflows in both year 0 and
year 1 of our company. The reason for cash outflows in year 1 are
because of the amount of inventory we must invest. These
numbers are imperative to our NPV, IRR, and payback period
calculations. We also must use the WACC that is found by using
the 70% of equity and 30% of debt that is described on the
previous page. Due to a negative cash outflow in the first year, we
are looking at difficulties in finding investors. The cash inflows are
not nearly high enough to counteract the high cash outflows. If
someone were to invest in our company they would be expecting
a much better return on their investment than we are providing
them with. Please refer to the figure to gain a deeper
understanding of the cash flows that our company is producing.
WACC Calculation
Total Percent Cost of
Capital
After-
Tax
WACC
Debt 30% 8% .81 1.95%
Equity 70% 20% 14.08
%
Total 100% 16.03
%
Cash Flows
Year Outflows
Year 0 $(466,886)
Year 1 $(224,041)
Year 2 $22,899
Year 3 $22,756
Year 4 $22,211
Year 5 $510,840
NPV, IRR, and Payback Period
Due to our cash flows being an outflow in the first year, our
company has a weak NPV and IRR. Our company also has a
nonexistent payback period. Our NPV is $(373,241) and our IRR is
(3.91)%. Due to these numbers it is likely that an investor would
not want to invest in our company. In order to attract investors,
we need to find a way to make the cash flows in our first year be
an inflow as opposed to an outflow. If we can find a way to change
this number to be a positive number we will be able to better
attract angel investors.
16
INTRODUCTION ENVIROMENTAL BUSINESS CONCEPT DEMAND SCENARIO MARKETING INFORMATION SYSTEMS FINANCE CONCLUSION
Figure 10
Figure 11
CONCLUSION
Closing thoughts
17
Demand scenarios Weight Customers per day (raw) Customers per day (actual)
Comparable markets 60% 20 12
Demographics 40% 30 12
Total 100% - 24
Figure 2
INTRODUCTION ENVIROMENTAL BUSINESS CONCEPT DEMAND SCENARIO MARKETING INFORMATION SYSTEMS FINANCE CONCLUSION
Our marketing plan consists of heavy focus on social media advertising and utilizing the advantages that a wealthier target market
entails. We believe that our customers will be the strongest form of Caliber Shoes advertising. The more years Caliber Shoes is in
business the stronger consumer base and image it builds. This is the overall goal, to establish Caliber as a household name for
professional men’s shoes.
The demand in our area for our shoes is great. With local competition miles away and annual sales very high in the area for shoes
our business can truly thrive in this market. Other stores that are very similar to our’s have all done well in areas similar to ours.
Being able to bring in customers that are in our demographics is very important. Our location will bring in many young
professionals and hopefully bring them back again and again.
By investing in an integrated information system, we will be able to keep our data into one location. The POS software, VendHQ
coupled with the number one accounting software, QuickBooks will help our company create sustainable success. These systems
will help our company make our point of sale quicker, keep loyal customers with our personalized customer loyalty program,
create financial reports, know the current financial state, and help us create a website in the near future as the company grows.
This system, along with the compatible apps, will help us differentiate from our competitors.
Our company has a negative NPV and IRR. This is due to having a cash outflow in the first year of operations. If we can work to
change this number, we will be in a much better place to get an investment. Since we have initial cash outflows and cash outflows
in the first year, investors would avoid our company because they are expecting a much better return on a risky investment like a
startup company.
After thorough analysis of market trends and geographic competition, we chose a distinct apparel segment in a fast-growing
market. The barriers to entry are low and demand is growing. Austin was a the standout choice by having one of the fastest
growing populations of any city in the country, and our specific location within the city will have a strong local customer base, with
limited competition.
REFERENCES
Sources
18
References
• Austintx.areaconnect.com,. (2015). Austin Population and Demographics (Austin, TX). Retrieved 25 October 2015, from
http://austintx.areaconnect.com/statistics.htm
Blázquez, M. (2014). Fashion Shopping in Multichannel Retail: The Role of Technology in Enhancing the Customer Experience.
International Journal Of Electronic Commerce, 18(4), 97-116. doi:10.2753/
• Die Cut Handle Bags. (n.d.). Retrieved November 1, 2015, from http://www.uline.com/BL_5554/Die-Cut-Handle-Bags
• Mintel. (2014, September). Men’s and women’s footwear. Retrieved October 15, 2015 from http://academic.mintel.com/.
• Hoovers. (2014). Shoe Stores. Retrieved October 15, 2015, from
• Hoovers.com
(n.d.). Retrieved November 1, 2015, from
https://www.claritas.com/MyBestSegments/Default.jsp?ID=20&menuOption=ziplookup&pageName=ZIP+Code+Lookup#.
• Online Accounting Software- Free Trial for QuickBooks Online. (2015). Retrieved October 29, 2015, from
http://quickbooks.intuit.com/online.
• Payroll Services. (n.d.). Retrieved November 1, 2015, from https://www.utexas.edu/payroll/taxes/current.html
• Prive, T. (2013, March 12). Angel Investors: How the Rich Invest. Retrieved November 1, 2015, from
http://www.forbes.com/sites/tanyaprive/2013/03/12/angels-investors-how-the-rich-invest/2/.
• Statista. (2014). Sales of the leading apparel/footwear retailing companies worldwide in 2014 (in billion U.S. dollars). Retrieved
October 15, 2015, from Statista.com
• Vend - Point of sale you'll love to use. (2015). Retrieved October 29, 2015, from https://www.vendhq.com.
• Washington Post,. (2015). 25 best cities for independent businesses. Retrieved 23 October 2015, from
http://www.washingtonpost.com/business/capitalbusiness/25-best-cities-for-independent-
businesses/2011/10/18/gIQAylRC4L_gallery.html
• Will McKitterick. IBISWorld Industry Report 44821: Shoe Stores. Retrieved October 15, 2015 from IBISWorld.com
• 1211 W 6th St, Austin, TX 78703. (2015, July 1). Retrieved November 1, 2015, from
http://www.loopnet.com/Listing/19352105/1211-W-6th-St-Austin-TX/
APPENDIXA
Caliber Shoes Business Model Canvas
19
Equipment
Scientists
Capital for R&D
Patents
Facilities
Chemicals
• Production:
ordering, supply
chain management,
Manufacturing
• Media/Marketing
• Website Upkeep
• High Quality
products
• Great customer
service
• Good Design
• Durability
• Online Advertising
• Flyers
• Posters
• Customer Service
• Customer Loyalty
Program
• Young Male
Professionals
• Women buying
for men
• 22-35 age group
• Direct Sales Margin
• Vend POS Retail system
Marketing costs
• Manufacturers
APPENDIXB
QuickBooks Online
20
QuickBooks allows the company to stay up to date with the current financial state of the business. The accounting
software keeps track of the businesses income, expenses, profits, losses, etc. The software then takes the data and then
makes reports for the manager and other investors to make important decisions.
APPENDIXC
Step one: Choose the Products
Step three: Check out Customer
Step two: Enter the Product
Step four:Complete the Sale
21
APPENDIXD
As- Is diagram
22
APPENDIXE
23
Company website
APPENDIXF
Figure xx
The iPad bundle comes with one iPad stand, a cash register, receipt printer, and one cord. This bundle costs $483. The hardware that
comes with the bundle is compatible with the software. In addition to the bundle, we will have two iPads. The cash register and receipt
printer will be able to connect with the iPads from anywhere in the store. This will make it quicker for the cashiers to checkout the
customers.
24
iPad and register bundle
APPENDIXG
Twitter Account
25
APPENDIXH
Facebook Page
26
APPENDIXI
Products
27
Loafer Derby
Dress Boot Oxford
APPENDIXJ
Brochures
28
Opening Day Flyer Sale Flyer
APPENDIXK
29
Retail shoe sales
Simplymap.com
APPENDIXL
PESTLE
30
Take Away•The shoe industry is rarely directly involved or regulated by political forces, but changes in policy on a
large scale can have significant effects on manufactures and retailers.Political
•Shoes, particularly the higher-end fashionable kind, are a luxury good. This means changes in economic
health (GDP, real wages, employment) will have very direct consequences on demand. As the economy
grows stronger in the USA, there should foreseeably be more demand for these sorts of products. In the
event of economic downturn, the opposite could happen.
Economic
•Selling shoes (or any other types of apparel) is hugely based on changes in fashion trends and consumer
preferences. Product lines for a retailer needs to stay up to date with these changes to remain profitable.
Current trends include a resurgence of classic formal styles and the ongoing popularity of casual athletic
shoes
Social
•Advancements in technology have made e-Commerce a powerful force in the shoe retail industry.
Customers can use phones to price check, compare options, and then purchase from basically anywhere.
While the basics of shoe design has remained the same for decades, firm’s use of new materials (ie.
Nike/ALDO’s Lunar product line) and wearable technology are important trends.
Technology
•Shoe manufacturers are very concerned with the presence of knock-offs and fakes. Shoe makers work
hard to create a brand identity and recognizable product. With so many imitation products out there,
consumers and retailers need to make sure they are sourcing genuine products.
Legal
•Over the past century, the useable lifetime for a pair of shoes has gotten shorter and shorter. This means
more consumer and manufacturing waste from increases in production. Some firms have attempted to
reduce their environmental footprint especially as consumer trends demand ethically produced products.
Environment
PORTERS
FIVE
FORCES
Everyone has to wear something on
their feet, the consumer just has
options of where they will buy the
shoes, but almost 100% of people in
the developed world wear shoes
daily.
Footwear production is dominated
by a few large international firms
who dominate production of
finished goods. Using low-priced
materials and labor they compete
to produce goods efficiently at low
prices.
Footwear shoppers have a
multitude of options of both brands
and 3rd party retailers to choose
from. Customers do however have
low leverage on firms as individuals
since each sale is such a small
source of revenue.
Competition in the footwear retail
business is led by large chain stores
like DSW and Famous Footwear,
and online suppliers like Zappos and
Amazon. These firms typically excel
in high volume, low margin type
sales, while smaller boutique
retailers are more likely to operate
by selling at low volumes and high
margins.
An independent footwear retail
business has relatively low start-up
costs. Inventory and rent make up
the majority of those costs
Producing a completely new
product has much higher costs on
account of the complex
international supply chain of
producing a pair of shoes.
APPENDIXM
Porter’s Five Forces
31
Barriers to entry
Power of Buyers
Power of Suppliers
Threat of Substitutes
Competition
APPENDIXN
Average income by household
32
Mintel
APPENDIXO
Caliber Shoes Income Statement
33
INTRODUCTION ENVIROMENTAL BUSINESS CONCEPT DEMAND SCENARIO MARKETING INFORMATION SYSTEMS FINANCE CONCLUSION
Year 1 Year 2 Year 3 Year 4 Year 5
Cash Sales (20%) 131,354 144,883 159,806 176,266 194,422
Credit Sales (80%) 525,415 579,533 639,225 705,065 777,686
Sales (a) $ 656,769 $ 724,416 $ 799,031 $ 881,331 $ 972,108
Cost of goods sold and occupany costs (b) 394,453 417,163 454,238 495,132 540,238
Gross profit 262,316 307,253 344,793 386,199 431,870
Direct store expenses (c) 262,315 271,453 281,146 291,888 303,912
General and administrative expenses (d) 352 $479.40 $479.40 $479.40 $479.40
Pre-opening expenses $ 70,405.60 - - - -
Operating income (70,756) 35,320 63,167 93,832 127,479
Interest expense 10,651 9,377 8,000 6,508 4,893
Income before income taxes (81,407) 25,943 55,167 87,324 122,585
Provision for income taxes (12,211) 3,891 9,348 17,940 32,122
Net income $ (69,196) $ 22,051 $ 45,819 $ 69,384 $ 90,463
APPENDIXP
Caliber Shoes Balance Sheet
34
INTRODUCTION ENVIROMENTAL BUSINESS CONCEPT DEMAND SCENARIO MARKETING INFORMATION SYSTEMS FINANCE CONCLUSION
Start-Up Year 1 Year 2 Year 3 Year 4 Year 5
Cash $228,044.68 $ 457,247 $ 363,744 $ 557,201 $ 585,068 $ 677,063
Accounts Receivables $ - $43,784.58 $ 48,294 $ 53,269 $ 58,755 $ 64,807
Inventory $228,044.68 $118,846.20 $214,982.55 45,999 64,166 37,228
Prepaid expenses 4,582 5,049 5,564 6,133 6,760 7,451
Total current assets 460,671 624,927 632,586 662,602 714,749 786,550
Property and equipment, net (a) $1,485.59 $1,188.47 $713.08 $427.85 $256.71 $85.57
Intangible assets, net 600 540 480 420 360 300
Total assets $ 462,757 $ 626,655 $ 633,779 $ 663,450 $715,365.96 $786,935.12
Accounts payable $ - $228,044.68 $228,044.68 $228,044.68 $228,044.68 $228,044.68
Accrued expenses - 5,049 5,564 6,133 6,760 7,451
Current portion of long-term debt - $15,443.24 $16,716.26 $18,094.21 $19,585.76 $21,200.26
Total current liabilities $0.00 248,537 250,325 252,272 254,390 256,696
Long-term debt 138,827 123,384 106,668 88,573 68,988 47,787
Total liabilities $138,827.04 371,921 356,993 340,845 323,378 304,484
Paid-in equity capital 323,930 323,930 323,930 323,930 323,930 323,930
Retained earnings (b) - (69,196) (47,144) (1,325) 68,058 158,522
Total equity 323,930 254,734 276,785 322,604 391,988 482,452
Total liabilities and equity $ 462,757 $ 626,655 $ 633,778 $ 663,449 $ 715,366 $ 786,935
APPENDIXQ
Caliber Shoes Capital Budgeting
35
INTRODUCTION ENVIROMENTAL BUSINESS CONCEPT DEMAND SCENARIO MARKETING INFORMATION SYSTEMS FINANCE CONCLUSION
0 1 2 3 4 5
EBITDA
$
(70,399) $ 35,856 $ 63,510 $ 94,063
$
127,710
- Depreciation and amortization $357.12 $535.39 $345.23 $231.14 $231.14
EBIT (70,756) 35,320 63,165 93,832 127,479
x (1 - tax rate) 0.85 0.85 0.83 0.79 0.74
Operating profit after tax (60,143) 30,022 52,427 74,127 94,334
+ Depreciation and amortization $357.12 $535.39 $345.23 $231.14 $231.14
Operating cash flow $ -
$
(59,786) $ 30,558 $ 52,772 $ 74,358 $ 94,566
- Change in net working capital (460,671) (164,255) (7,659) (30,016) (52,147) (71,800)
- Capital spending
$
(6,214.32)
Free cash flow
$
(466,886)
$
(224,041) $ 22,899 $ 22,756 $ 22,211 $ 22,765
+ Horizon value (end of year 5) 510,840
Project cash flow
$
(466,886)
$
(224,041) $ 22,899 $ 22,756 $ 22,211
$
510,840
EBITDA (year 5)
$
127,710
x Market multiple 4.0
Horizon value (end of year
5)
$
510,840

AM101 Team 5 Project 2 Interim for Review-3

  • 1.
    Company Analysis withinthe Pharmaceutical Industry Prepared for use by: Professor Keifer Professor Lambert Professor Levallet Professor McElfresh Prepared by: AM101 Cohort Team #5 Alex Baumann Jeff Coad Jack McCann Andrew Ohl Tara Tollett November 3, 2015 Feasibility Analysis INTRODUCTION ENVIROMENTAL BUSINESS CONCEPT DEMAND SCENARIO MARKETING INFORMATION SYSTEMS FINANCE CONCLUSION
  • 2.
    TABLEOFCONENTS Introduction Environmental Business Concept Demand Scenario Marketing Informationsystems Finance Conclusion 1 2,3 4-6 7-9 10,11 12,13 14-16 17 Appendix 19-35 References 18
  • 3.
    INTRODUCTION BACKGROUND As a groupwe began this project by researching the entire retail apparel industry. While investigating markets and specifics segments we were quickly drawn to the the unique growth of the American Southwest, which led us to the epicenter, Austin Texas. Multiple product specialties were considered before choosing to open a men’s professional dress shoe store. This would be a boutique environment, with emphasis on selling high-price/margin footwear in a curated setting. This report is formulated to provide evidence for the strength of the business concept, and the future profitability over a 5-year period. This report is based primarily on verifiable data in the public domain. All analysis was made to be as objective as possible in order to provide reliable evidence in support of this business as a feasible investment opportunity. 1 MEN’S FOOTWEAR: $2.8 BILLION INDUSTRY A CITY WITH: 2.9% POPULATION GROWTH INTRODUCTION ENVIROMENTAL BUSINESS CONCEPT DEMAND SCENARIO MARKETING INFORMATION SYSTEMS FINANCE CONCLUSION
  • 4.
    ENVIROMENTALANALYSIS INTRODUCTION TO THEENVIROMENTAL ANALYSIS A retail business is a business that operates by selling products primarily to individuals on a small scale. These transactions can range from packs of gum to a new car. The retail business is hugely rooted in consumer sentiment, and functions on the communication between buyers and sellers. This first section serves to define the particularly industry and segment our firm is operating in, and how certain factors and trends affect that market. The Macro-Environment: Retail Sales in the USA The United States enjoys an extremely high standard of living. The per-capita spending on retail is higher than any other country. Luxury goods are tied to income and wealth. As customer’s real wages go up, they tend to spend more, and vice versa for a loss in income. This affects high-priced items more than staples, and producers need to adjust accordingly to changes in future demand. Globalization and trade regulations have pushed manufacturing offshore to less-developed regions with lower labor prices. Domestic production is almost always more costly, resulting in higher prices for good made within the USA. The Micro-Environment: Apparel in the USA The apparel industry includes all business that produce and sell items that people wear on their bodies. Clothes, shoes, accessories, hats, and jewelry are all included in this wide category. Fashion, footwear included, is a form of social communication and personal identification. People buy clothes to convey a certain status or lifestyle. This means producers and retailers need to be in tune with trends in order to be successful. 2 The Footwear Industry Men’s Professional Footwear INTRODUCTION ENVIROMENTAL BUSINESS CONCEPT DEMAND SCENARIO MARKETING INFORMATION SYSTEMS FINANCE CONCLUSION The footwear industry is dominated by multinational conglomerates of brands and product lines. Nike, Adidas, Puma and others are household names with hundreds of product lines and subsidiaries. These firms use their economies of scale to produce at huge volumes and relatively low cost. Some of these producers sell directly to consumers, or through a third party retailer. Shoe stores vary in size and product range. Footwear sales in the US have gone up 16% between 2005-2015 (Hoovers 2015), so this is an industry experiencing strong growth. While the footwear market has recently been driven by athletic and leisure styles, traditional formal/dress shoes make up 10% of the total footwear market (IBISWorld 2015). Professional shoes have a wide age range of customers, from ages 20-60 all purchasing dress shoes for formal or work occasions. However, these customers typically own just one or two pairs. This lower purchase frequency is a challenge to businesses in the segment but indicates that purchase choices will tend to be a higher price in order to last longer than simpler athletic shoes.
  • 5.
    ENVIRONMENTALANALYSIS:CHOOSINGOURLOCATION Introduction to AustinTexas The city of Austin, Texas is home to nearly 1 million people. Often called “The Live Music Capital Of The World”, the city is a primary cultural center in Texas and the entire American South. Home to the University of Texas and events like SXSW (South by Southwest) and Austin City Limits, the city stands out in the region with it’s young and progressive population. Being a vibrant city that stands out in it’s environment is why we chose this as the site for our business. Demographics The state of Texas is ground-zero for the Sunbelt boom, or population growth in the warm climates in the South/Southwest regions of the USA. The Austin metropolitan area is the 2nd fastest growing area in the entire country (forbes.com). Residents of Austin on average make nearly $7,000 more per year than Texas as a whole and are twice as likely to have a bachelors degree (Census.gov). The annual South by Southwest (SXSW) music and technology conference has help cement the city’s reputation as a national hub for technology and culture. This has brought in an influx of young, urban professionals working for large established firms and novel start-ups. Conclusion The demographics of Austin tell a compelling story, this is a rapidly growing market of high-earning young people. Austin is a place with expanding economic opportunity for the educated consumer. Young people spend a large portion of their income on luxury goods, and use apparel as a way to communicate and define themselves. Harder to quantify with statistics is Austin’s independent spirit that makes it a great place for authentic/boutique retailers. As a group we chose Austin as a place that combined economic success with cultural distinction. We made the inference that consumers in Austin would be interested in spending their disposable income on high-priced apparel, and local data supports that independent businesses are succeeding in this and closely related markets. 3 INTRODUCTION ENVIROMENTAL BUSINESS CONCEPT DEMAND SCENARIO MARKETING INFORMATION SYSTEMS FINANCE CONCLUSION Local Competition Online Competition While brick-and-mortar stores are who Caliber will directly compete with, the power of online retailers cannot be ignored. By revenue, Amazon is the largest shoe seller in the world. Along with other e-Commerce leaders like Zappos and CCS, these firms seek to sell directly and efficiently. Our business will be challenged to compete with these sellers on price, and will need to make up for that weakness by delivering a quality consumer experience. Customers buying expensive shoes may be more interested in trying before they buy, so a complete inventory of sizes and styles is critical. The shoe market in Austin includes national chain stores (DSW, Famous Footwear, etc) and more boutique independent stores that are locally owned and operated. These are different business models that cater to different sorts of consumers. The ‘big-box’ style stores are focused on value-based marketing. The boutiques focus more on high-priced luxury goods and are more often small, well-designed, artful spaces. Caliber shoes is a store that intends to be more like the latter. The neighborhood we chose is centrally located with nobody nearby who would directly compete.
  • 6.
    BUSINESSCONCEPT Introduction Our business conceptwas developed through hours of discussion and research about the retail apparel industry. Planning a business around one location steered us towards selling high-priced/margin goods. We narrowed our segment down to men’s professional shoes after analyzing consumer trends and determining it was an underserved market with opportunities for newcomers. We chose the city of Austin after comparing similar multiple mid-sized cities. We thought on the concept of what is a specialty retail store. Our team defined it as a place you would go out of your way to go to. We then thought what would that store sell. We didn’t want to sell anything that you could easily pick up at a general or department store. We chose to focus on men’s dress shoes. Our team all agreed that we would go out of the way to get men’s dress shoes. We expected to stores we would go to to have a sole focus on men’s dress shoes and be able to provide valuable information on them. We decided to call our store Caliber Shoes. The history of the word caliber actually has meaning that is directly related to shoes. Our store will also sell footwear accessories including shoe trees, socks, laces, shoe horns, and polish. We are targeting young wealthy individuals. The location we have chosen for our company is around the downtown area of Austin, Texas. Etymology of Caliber We chose the name Caliber for our company. The word originated in the 1800’s with the word kalapous originally meant shoemakers last, a tool used by shoemakers to repair and condition shoes. The name has evolved over the years and is now caliber. Caliber is typically associated with firearms however, it is also defined as “the quality of one’s character” (Dictionary.com). Our company stands for quality shoes and superior customer service. Shopping at Caliber Shoes will demonstrate that person’s character as someone who cares about the thing’s they buy and the shoes they wear. 4 INTRODUCTION ENVIROMENTAL BUSINESS CONCEPT DEMAND SCENARIO MARKETING INFORMATION SYSTEMS FINANCE CONCLUSION Figure 1
  • 7.
    BUSINESSCONCEPT Store Operations We willhave two sales associates that will be paid $8.50 an hour plus 10% commissions. There will be two retail managers that will make $45,000 each. The hours of our store will be 9am to 9pm during weekdays. On Saturday we will extend operation hours to 9am to 10pm. Sunday we will be open from 12pm to 9pm. Throughout the year we will be open daily except for select holidays. Our company will carry five of the highest quality men’s dress shoe brands in the industry. This will include Belvedere, Cole Haan, ECCO, Joseph Abboud, and Magnanni. Our store will feature local music and artwork to help connect our store to Austin’s culture. Location The location we have chosen for Caliber Shoes is Austin, Texas. We chose Austin Texas because we know how important culture is to this city. Austin’s motto is “Keep Austin Weird” and was listed as the 7th best city in America to start an independent business (Washington Post, 2015). Austin is very culturally advanced and highly supports creativity. In the area we chose 24% of the people have and average income of over 150,000 a year (appendix N) which mean’s customers would be willing to pay more for high quality items. There is a large number of companies that are headquartered or have a regional office in Austin. These companies include Apple, Cisco, eBay, Google, IBM, Intel, and Whole Foods Market (Austin Relocation Guide, 2013). This provides a market for the young business professionals in Austin. The location we have chosen within Austin is at the West 6th Marketplace at 1211 W 6th St, Austin, TX 78703. The rent is $30 per square foot, and the square footage is 1,727. This comes out to yearly rent of $51,810 (Loopnet, 2015). The amount of yearly retail sales for footwear in this area of Austin is over $1 million (Appendix K). There is an interesting opportunity to form a business relationship with the shoe repair store that is two blocks down the street. Partnering with local shoe repair stores and offering a 10% discount for customers referred from their store we can spread the word about our store’s opening brining in customers. This could create an opportunity for a mutual advertising relationship between the two companies. This area only has one specialty shoe store and multiple shoe repair stores. These few stores are bringing in are bringing in high revenue. The median age of the people in the area of our store is 37. This means that we will be targeting a fairly young demographic. With a population of 20,774 in the zip code area nearly 5,500 people fit into our target market (PRIZM, 2015). 5 INTRODUCTION ENVIROMENTAL BUSINESS CONCEPT DEMAND SCENARIO MARKETING INFORMATION SYSTEMS FINANCE CONCLUSION Caliber Shoes will be a retail store that sells men’s footwear. The store will focus specifically on dress shoes. The goal of our company is to provide local businessmen with premium dress shoes. In order to provide premium shoes to consumers, our business will sell dress shoes that can be hefty in price. These shoes are a requirement for the corporate world, and will encompass a status symbol that we want our consumers to feel. Our store will also sell footwear accessories like shoe trees, dress socks, shoe laces, shoe horns, and polish. A shoe tree helps to keep the form of the dress due to all of the moisture that is accumulated within the shoe throughout the day (Business Insider, 2015). Shoe horns are used to assist in putting on dress shoes (Dictionary.com, 2015). The reason these are necessary is to prevent damage to premium shoes. Store Concept
  • 8.
    The location wehave chosen within Austin is at the West 6th Marketplace at 1211 W 6th St, Austin, TX 78703. The rent is $30 per square foot, and the square footage is 1,727. This comes out to yearly rent of $51,810 (Loopnet, 2015). The amount of yearly retail sales for footwear in this area of Austin is over $1 million (Simply Map, 2015). There is an interesting opportunity to form a business relationship with the shoe repair store that is two blocks down the street. Partnering with local shoe repair stores and offering a 10% discount for customers referred from their store we can spread the word about our store’s opening bringing in customers. This area only has one specialty shoe store and multiple shoe repair stores. These few stores are bringing in are bringing in high revenue. The median age of the people in the area of our store is 37. This means that we will be targeting a fairly young demographic. With a population of 20,774 in the zip code area nearly 5,500 people fit into our target market (PRIZM, 2015). BUSINESSCONCEPT The Building 6 Address: 1211 W 6th St Rent: $4,317.50mo INTRODUCTION ENVIROMENTAL BUSINESS CONCEPT DEMAND SCENARIO MARKETING INFORMATION SYSTEMS FINANCE CONCLUSION The Layout: The building layout for our retail space was designed from the ground up to meet our business's needs. Using an open layout, warm lighting, and high-quality furniture we have created a space that is both comfortable and luxurious. Customers will be treated to an image of the life they could be living when they are someone who wears fine leather shoes. An open floor plan with plenty of storage space means this is a functional design for stocking inventory and displaying good for sale. Additional foot traffic from neighboring retail businesses will increase days sales and advertise our location. Utilities: $450~mo Square Footage: 1727 feet Figure 2
  • 9.
    DEMANDSCENARIO Comparable Markets 7 INTRODUCTION ENVIROMENTALBUSINESS CONCEPT DEMAND SCENARIO MARKETING INFORMATION SYSTEMS FINANCE CONCLUSION Location Average sales per customer Average customers per day Average daily sales Average Inventory size Demographics Number of employees $350 20 $7,000 1,000 25-50 3 $85 25 $2,125 5,000 20-40 5 $164 15 $2,460 1,500 25-32 2 $200 20 $4,000 2,000 22-34 3 When opening any business it is important to analyze the area it will be operating in. The area of Austin Texas is very unique and we needed to analyze how companies were doing in these areas. We needed to see what the demand for our store was so we broke it down into two parts. First we called companies already operating in that area and gathered information on how they operate. Next we found information on our demographic, which will be our main customer base. In order to better understand our market we chose to compare ourselves to 3 distinct companies. Allen Edmonds, Aldo, and Johnston Murphy. Each of these stores operate on a small scale usually having no more than 5 employees on staff. These companies all specialize in shoe sales. However, Aldo is a store that caters to both men and women so the average number of customers per week is much higher due to a wider audience. We weighted Aldo at a 50% as this would give us roughly how many men shop there. Selling high quality and very specific items most specialty shoe stores chose to focus more on quality over quantity when it came to employees. The retail stores we compared ourselves to are all around the same size and able to operate with very few employees. We chose to operate with 3 employees who would be experts in our product. The area in Austin we have targeted is located between Austin Texas University and Austin High school. Hoping to bring in a crowd of young professionals we set our demographic at 22-34 years old which is 292,182 of Austin Texas’s 885,400 population. Not all the customers that will be entering the stores will be willing to buy an item. Asking companies what the average number of customers they had per day then what percentage of customers ended up actually purchasing an item. Calculating the average number of customers that actually made purchases other stores operate at we estimate that we would be able to see around 20 customers a day. Availability of item was an important point that all stores mentioned when asked “what they considered to be a key to success?” All the stores we researched carried a sizable amount of inventory based on other stores our size we would carry on average we have around 2,000 products in the store. We estimate that we can have around 600 units of products in the stock room and 1,400 units on the floor. Finally, taking the average sales of our customers we averaged our sales at $200 per customer. Basing that off the amount of customers per week we can average $4,000 per day Our findings Figure 3
  • 10.
    DEMANDSCENARIO Demographics 8 INTRODUCTION ENVIROMENTAL BUSINESSCONCEPT DEMAND SCENARIO MARKETING INFORMATION SYSTEMS FINANCE CONCLUSION Step 1 # of people who buy dress shoes in our area 885,400 x .36 = 318,744 We took the population of Austin and then took the percentage of consumers who purchased men’s dress shoes in men’s apparel stores (Simplymap). Step 2 Our demographic 318,744 x .34= 107,576.1 We then took that number and found that .34 percent of Austin is in our age demographic 22-34. We multiplied the number of men who buy dress shoes by our demographic percentage (Austintx.areaconnect.com, 2015). Step 3 # of men in our demographic 107,576.1 x .51 = 54,863.81 Around half of the population of Austin Texas are males. We took the number of men in our demographic who by dress shoes and multiplied it by .51 to determine how many of those consumers were men (Austintx.areaconnect.com, 2015). Step 4 # of daily consumers (theoretically) 54,863.81 / 360= 152.40 Next we took the men in our demographic and figured out how many people would be buying shoes on a daily basis. Step 5Average market share shoe stores own 152.4 x .2 = 30.48 The businesses in the area attract on average around 20 percent of the customers buying shoes in Austin. (Simplymap). We took twenty percent of the number of consumers in the area to find how many could be our customers. Step 6 (Bonus) # of customers with conversion rate 30.48 x .25= 7.62 Talking to local businesses we learned that typically an outside store is expected to have a conversion rate of 25%. The conversion rate is the percentage of customers that come in the store that make a purchase. Due to our location in Texas we wanted to target the young professionals. We set our age demographics at 22- 34 and calculated how many people from that age demographic would visit our store. We found the population of Austin to be 885,400 and then calculated using Simplymap and other sources to find the percentage of people who buy dress shoes, how many of them are in our demographic, how many of them are men, and finally how many we would get a day. Retail stores don’t get consistent business on the weekday. Figure 4
  • 11.
    DEMANDSCENARIO Final Results 9 INTRODUCTION ENVIROMENTALBUSINESS CONCEPT DEMAND SCENARIO MARKETING INFORMATION SYSTEMS FINANCE CONCLUSION Demand scenarios Weight Customers per day (raw) Customers per day (actual) Comparable markets 60% 20 12 Demographics 40% 30 12 Total 100% - 24 Average conversion rate for outdoor stores Conversion rate is the percentage of customers that will make a purchase once the visit the store. 24 x .25 6 Not all the customers visiting the store will be making purchases. The number of customers that will visit our store is 24 with an average conversion rate of 25% for outside stores we estimate that 6 people will be making purchases In order to find the average number of sales per day we have to analyze the number of customers coming into our store and how much the average number sales per customers. We took the individual brands and weighted them according to how many customers would be interested in purchasing them. Most customer’s would mainly be interested in the lower priced options and we weighted the brands according: ECCO 30%, Cole Hann 25%, Joseph Abboud 15%, Belvadere 15%, Magnnani 15%. We added the total sales with the weighted scores and found the average daily sales to be $16,340. We decided to weight our scores differently at sixty percent for comparable markets and forty percent for demographics. The comparable markets score will give the most accurate number to expect. The companies that we compared ourselves to are all very successful companies and operate in similar conditions. This number will be closer to what we will be likely to see every week. Our demographic is still an important number which is why it still receives a good weight. The demographic demand scenario customers will be the most loyal to us and, hopefully, be repeat customers. After we weighted the scores and we then added them together to get 32, customers per day. Figure 5 Figure 5.1
  • 12.
    MARKETING Target Market “For theman living the professional or casual lifestyle, Caliber provides excellent footwear options to discover Austin with a new sense of style” -Positioning Statement Segmentation The strategy that Caliber Shoes entails is to market its products to the right customers. The main segmentation method Caliber Shoes incorporates is the demographic of men who need to purchase dress shoes. Caliber is based in Austin Texas, a fast growing city experiencing a steady incline of jobs. Many young professionals and newly grads of Texas University will be in the market for a new pair of professional shoes. Men make up 51% of the city of Austin and 36% of men living in Austin buy dress shoes (Simply Map). Specialty stores greatest determinant is all about household income. The median income level of the location we have chosen for our store in Austin is $81,300 (PRIZM) and the median income of Austin is $49,987. Positioning Caliber Shoes delivers excellent quality trendy men’s footwear with passionate and expert assistance that allows customers to leave feeling satisfied with their new shoe selection. Our store has a variety of shoe styles designed to fit in with any professional or casual setting. A pair of shoes from Caliber is just the first step towards a successful future Targeting From extensive research and evaluation, Caliber has determined a target market that is the most fitting for our business. Due to the elevated quality of goods and trendy designer brands that Caliber Shoes offers, we choose to target men between the ages of 22-34. We choose this group specifically because of the large majority it encompasses in Austin, approximately 34% (Simply Map) and the increased probability that our targeted age group will be purchasing their first pair of professional dress shoes. After researching this, Caliber Shoes choose a store location in downtown Austin. The main reason for this choice was due to the absence of any other men’s shoe stores (Appendix K). 10 INTRODUCTION ENVIROMENTAL BUSINESS CONCEPT DEMAND SCENARIO MARKETING INFORMATION SYSTEMS FINANCE CONCLUSION
  • 13.
    MARKETING Marketing Strategy In theFall of 2015, Team members Alex Baumann, Jeff Coad, Andrew Ohl, Jack McCann, and Tara Tollet partnered together to form Caliber, an independently owned high quality handmade luxury men’s dress shoe specialty retailer consisting of some of the top designers around the world. Founded and based in Austin Texas, Caliber has continued to see success as our professionals work with customers to discover the perfect pair of stylish shoes for each and every setting. -Mission Statement Product We strive to provide the customer with a superior product and service compared to any that a competitor offers. With the latest in footwear fashion our shoes can provide the edge or sleek to any outfit (refer to appendix I). We work with customers who may or may not be familiar with dress shoes. This ensures that the customers feel comfortable with the professional’s advice and their new shoe purchase. Place For Caliber Shoes we have chosen a storefront on the outskirts of downtown Austin. This location has a variety of other businesses around it making it noticeable, but we believe that a customer in need of dress shoes seeks out the store location beforehand and because of this Caliber did not choose a location with prime real estate. As previously mentioned the Austin area is filled with our target market and without any comparable competition the location expects to succeed. Price The price at Caliber Shoes varies per type and brand of shoe. On average our shoes are priced between $150-$350.This is due to each pair being handmade of high quality materials and the target market having high household incomes (Refer to appendix N) . These prices are about the same as any competitor or online source, but because of the expertise Caliber provides and the fact that you can test how the shoes fit and feel, the customer is capturing greater value. Promotion Caliber Shoes advertising will rely strongly upon our various forms of social media, in-store promotions, and flyers (Refer to Appendixes G,H,J). As Caliber continues to grow we hope that customers word of mouth spreads awareness and increases into a new customer base. The goal of Caliber Shoes advertising campaign is to communicate the quality of shoes and the message that your shoe says about you through a mixed media approach. 11 INTRODUCTION ENVIROMENTAL BUSINESS CONCEPT DEMAND SCENARIO MARKETING INFORMATION SYSTEMS FINANCE CONCLUSION
  • 14.
    INFORMATIONSYSTEMS Differentiating From CompetitionCriteria for our MIS Systems When choosing which systems to purchase, our company will choose the systems that meet the following criteria in order to help gain our strategy: • Cost efficiency • Scalability • Convenience • Compatibility • Accessibility Since Caliber shoes is a startup company it is important for us to purchase an online booking and accounting system to fit our budget. Since we plan on growing and expanding in the future, it is also important to have systems that have scalability. This will allow us to keep the same software when the business grows. We also need the systems to help increase the efficiency of the company and they must be convenient. The systems need to be easy to access for all employees. This will help us differentiate from our competitors Retailers are currently functioning in a playing field that is more complex than ever. These days, not only are businesses up against merchants who are selling similar products for less, but also dealing with services and apps that make it easier for consumers to find alternatives and better deals. Before formulating our competitive advantage, we should understand why customers pay more money for merchandise even when there are cheaper alternatives. “According to vouchercloud, a service that delivers local deals in Australia, the top 5 reasons customers pay more for the same products are: items are easy to purchase, fast order fulfillment, prestige, low cost of ownership, and exceptional customer service” (vendHQ). While lowering prices and offering huge deals helps produce some success it will not be sustainable. Instead of reducing prices retailers should learn how to add value to products, brands, and services. This will attract the right customers and keep them coming back. In order for businesses to reach sustainable success, they need to differentiate themselves from their competitors. Businesses can do this by creating strategies that add value. 12 People Customers Employees Manufacturer Manager Business Processes Recording Sales Loyalty Program Updating Inventory Technology iPads VendHQ Bundle Website Wifi Setup MIS Triangle Our business is focusing on selling high quality dress shoes for men. One of the ways our business is going to add value is by getting an integrated information system. Specifically, a POS system that will integrate all of our data together into one location. With the right POS system, we can add more apps that will we believe will decrease the time it takes to sell our products and help offer our customers a personalized customer loyalty program. This system, along with the compatible apps, will help us differentiate form our competitors. Information systems are a great way to get in a strategic position that will help our company grow, adapt, and succeed. Therefore, choosing the best information systems on the market is a very important step in our business plan. Adding Value As A Strategic Advantage INTRODUCTION ENVIROMENTAL BUSINESS CONCEPT DEMAND SCENARIO MARKETING INFORMATION SYSTEMS FINANCE CONCLUSION Figure 6
  • 15.
    INFORMATIONSYSTEMS QuickBooks online isthe number one selling accounting solution for retail stores (quickbooks.com). The software helps our business track expenses, pay wages to our workers, and create financial reports. QuickBooks online makes it easier to know the current state of our business, allows employees to work together in any location, send professional invoices, allows access on multiple devices, syncs easily with our other apps, and grants multiple users access. The app also keeps track of our income and organizes it into one location. From bank deposits to weekly timesheets organizing our income has never been so easy. They can share data through the cloud. Since we can sync our apps and link our bank accounts to it, we can also pay our bills and keep records of them. This will save the business time and money everyday. 13 QuickBooksOnline Vend Retail POS System Customer Loyalty EcommerceVend Register Vend Register Vend Loyalty Program (CRM) Vend Ecommerce Vend has an ecommerce feature that helps our company set up a beautiful website for customers to visit. Although our company currently does not have the option to purchase online, as we grow, we plan on adding an online store. Vend will help us set this up and allow us to manage the online store on our iPads and other mobile devices. Vend has an information gathering system in place already that collects customer’s data. We will use the data that is collected and store it in our database. This data will contain standard info for instance customer’s name, email, phone number, ect.. However, we will also store info pertaining to the customer’s unique purchase. We will store the brand and style of the item they had purchased last and the date the item was purchased. Six out of 10 shoe people who buy shoes buy them to replace old and worn out ones (Mintel). Reminding the customers of us and the deals we offer will make customers what to come back for repeat business. This will also help to build a better relationship with the customers which will lead them to trust our company and brands. The Vend Register iPad app will help our company sell more efficiently. The point of sale will be much quicker. The Vend Register feature allows the cashier to look up the products the customer wants on the iPad, select the payment method, add the customer’s information to the system, and record the sale. The app also uses automated reordering and allows us to adjust reorder points and restock levels to make sure we never have too much or too little inventory. This is all done with a minimal steps. For more details on the the steps for the Vend Register (refer to appendix C). This makes the point of sale and our overall business process very quick. Refer to appendix XX for the business process with the integration of the Vend POS system. The number one POS software on the market is Vend. The Vend Retail POS software helps our company with data integrity, customer tracking, and customer loyalty. The system helps keep our data safe and secure in the cloud. Vend comes with three important features that will help our company maintain sustainable success (refer to figure XX ). All of these features of Vend can be easily accessed on our iPads. Our company decided to purchase the iPad bundle See appendix F for more details on the iPad bundle). The bundle includes all the hardware we need to run our business in one convenient and affordable package. INTRODUCTION ENVIROMENTAL BUSINESS CONCEPT DEMAND SCENARIO MARKETING INFORMATION SYSTEMS FINANCE CONCLUSION Figure 7
  • 16.
    FINANCIALDATA Sales and COGS Asstated in our demand scenario, our company expects to have 6 customers per day. Of our sales we expect to make 80% on credit and 20% cash sales. These are the standard rates of the retail industry (IBIS, 2015). There is a growth of 10.3% expected in the shoe store industry in the next five years (Mintel, 2014). This will lead to our daily shoe sales increasing from 6 customers per day to 9 customers a day by year 5. We selected five brands and three types of shoes within each brand to sell to our consumers. Our company researched the recommended retail price of each brand of shoes. Then our company took the average price of each brand and multiplied it by a weighted score to come to a weighted average price of each company. The raw retail price was divided by two to account for 100% markup, which is the standard in the retail industry. We then did the same weighted method to determine the average cost of goods sold. Our company calculated the sales and cost of goods sold for footwear accessories separately from the shoes. Caliber found the total sales of footwear accessories in Austin and divided that number to discover a daily amount. Our company came to the conclusion that we would have a 20% market share in our local market. Again, we used the standard 100% markup to calculate the COGS for the footwear accessories. The second line of the income statement includes COGS, rent costs, and utilities for our building. This becomes our cost of goods sold and occupancy costs. This is then subtracted from the sales to come to the gross profit of our company. To see further information regarding the calculations of the income statement please refer to Appendix O. Also to see the key numbers from this financial statement refer to figure Start-up Costs The start-up costs for our company included initial stocking of our store, supplies for our store, two iPads, VendHQ equipment, trademarks for our brand and logo, and additional cash. The maximum inventory we hold is 1500 shoes at a time. The supplies that were included in our store were pens, paper, and custom bags for those that make purchases at Caliber Shoes. The iPads are for our company’s point of sale system which is VendHQ. We felt that it was necessary to obtain a trademark so that we could stake our rights to the name and company logo. Net Income Our company is expecting to operate at a loss in the first year of our operations. A major reason for this is because of the preopening expenses that will be used towards renovations and advertising. In the next four years, Caliber Shoes will operate at a profit. By year five our company is expected be operating with a profit of $90,463. To see a further breakdown of Caliber Shoes’ expenses refer to Appendix O. Income Statement Numbers Year Sales COGS Net Income 1 656,769 394,953 (69,196) 2 724,416 417,163 22,051 3 799,031 454,238 45,819 4 881,331 495,132 69,384 5 972,108 540,238 90,463 14 INTRODUCTION ENVIROMENTAL BUSINESS CONCEPT DEMAND SCENARIO MARKETING INFORMATION SYSTEMS FINANCE CONCLUSION Figure 8
  • 17.
    FINANCIALDATA Accounts Receivable, AccountsPayable, and Inventory Caliber Shoes operates with the assumption that all sales are net 30 days. This leaves 30 days worth of credit sales as the ending accounts receivable for the end of the year. For our total sales 80% are credit sales. Our accounts payable for each year take into account the last order for our store of each year. Our accrued expenses include the supplies that we are purchasing for the next year of business. Based on the turnover of our company, we will make 2 mass orders of our product in four out of five years. Our company has decided to hold inventory at a maximum of 15,000 shoes. This is based on primary research that we conducted with various dress shoe companies. Capital Structure Our business is required to raise capital four our start-up costs. 70% of this capital must be in the form of equity. We would get this money from an angel investor that is interested in our company. Our company would acquire the other 30% of capital as debt from a bank loan. The interest rate on this loan would be 8% and the loan is a 7 year loan with payments due quarterly. Our research shows that investors typically look for a return that is 2.5 times their original investment (Prive, 2013). For our company this would make the required rate of return 20% per year. When calculated this makes our weighted average cost of capital 16.03%. This would be the required rate of return for our company as a whole. This WACC is used when making our net present value calculations. Fixed Assets Our company has equipment that is depreciated using the 5-year MACRS schedule. This is for the two iPads and the VendHQ system. These are necessary elements to our business that create a relatively affordable option for the company. The iPad is used with the VendHQ system as the point of sale system for Caliber Shoes. The equipment for the business costs $1,486. By the time it is depreciated into the fifth year it has a net value of $86. Our company decided to trademark our logo and company name. This is amortized using the straight-line method. It costs $300 for each trademark, so this totals $600. Trademarks are useful for 10 years so there is an amortization expense of $60 per year. By the fifth year of our business the trademarks are net $300. For more detailed information regarding our fixed assets refer to Figure 9. Net Fixed Assets Year Equipment Intangible Assets Start-Up $1,485.59 $600 Year 1 $1,188.47 $540 Year 2 $713.08 $480 Year 3 $427.85 $420 Year 4 $256.71 $360 Year 5 $85.57 $300 15 INTRODUCTION ENVIROMENTAL BUSINESS CONCEPT DEMAND SCENARIO MARKETING INFORMATION SYSTEMS FINANCE CONCLUSION Figure 9
  • 18.
    FINANCIALDATA Cash Flows Our companyexpects to have cash outflows in both year 0 and year 1 of our company. The reason for cash outflows in year 1 are because of the amount of inventory we must invest. These numbers are imperative to our NPV, IRR, and payback period calculations. We also must use the WACC that is found by using the 70% of equity and 30% of debt that is described on the previous page. Due to a negative cash outflow in the first year, we are looking at difficulties in finding investors. The cash inflows are not nearly high enough to counteract the high cash outflows. If someone were to invest in our company they would be expecting a much better return on their investment than we are providing them with. Please refer to the figure to gain a deeper understanding of the cash flows that our company is producing. WACC Calculation Total Percent Cost of Capital After- Tax WACC Debt 30% 8% .81 1.95% Equity 70% 20% 14.08 % Total 100% 16.03 % Cash Flows Year Outflows Year 0 $(466,886) Year 1 $(224,041) Year 2 $22,899 Year 3 $22,756 Year 4 $22,211 Year 5 $510,840 NPV, IRR, and Payback Period Due to our cash flows being an outflow in the first year, our company has a weak NPV and IRR. Our company also has a nonexistent payback period. Our NPV is $(373,241) and our IRR is (3.91)%. Due to these numbers it is likely that an investor would not want to invest in our company. In order to attract investors, we need to find a way to make the cash flows in our first year be an inflow as opposed to an outflow. If we can find a way to change this number to be a positive number we will be able to better attract angel investors. 16 INTRODUCTION ENVIROMENTAL BUSINESS CONCEPT DEMAND SCENARIO MARKETING INFORMATION SYSTEMS FINANCE CONCLUSION Figure 10 Figure 11
  • 19.
    CONCLUSION Closing thoughts 17 Demand scenariosWeight Customers per day (raw) Customers per day (actual) Comparable markets 60% 20 12 Demographics 40% 30 12 Total 100% - 24 Figure 2 INTRODUCTION ENVIROMENTAL BUSINESS CONCEPT DEMAND SCENARIO MARKETING INFORMATION SYSTEMS FINANCE CONCLUSION Our marketing plan consists of heavy focus on social media advertising and utilizing the advantages that a wealthier target market entails. We believe that our customers will be the strongest form of Caliber Shoes advertising. The more years Caliber Shoes is in business the stronger consumer base and image it builds. This is the overall goal, to establish Caliber as a household name for professional men’s shoes. The demand in our area for our shoes is great. With local competition miles away and annual sales very high in the area for shoes our business can truly thrive in this market. Other stores that are very similar to our’s have all done well in areas similar to ours. Being able to bring in customers that are in our demographics is very important. Our location will bring in many young professionals and hopefully bring them back again and again. By investing in an integrated information system, we will be able to keep our data into one location. The POS software, VendHQ coupled with the number one accounting software, QuickBooks will help our company create sustainable success. These systems will help our company make our point of sale quicker, keep loyal customers with our personalized customer loyalty program, create financial reports, know the current financial state, and help us create a website in the near future as the company grows. This system, along with the compatible apps, will help us differentiate from our competitors. Our company has a negative NPV and IRR. This is due to having a cash outflow in the first year of operations. If we can work to change this number, we will be in a much better place to get an investment. Since we have initial cash outflows and cash outflows in the first year, investors would avoid our company because they are expecting a much better return on a risky investment like a startup company. After thorough analysis of market trends and geographic competition, we chose a distinct apparel segment in a fast-growing market. The barriers to entry are low and demand is growing. Austin was a the standout choice by having one of the fastest growing populations of any city in the country, and our specific location within the city will have a strong local customer base, with limited competition.
  • 20.
    REFERENCES Sources 18 References • Austintx.areaconnect.com,. (2015).Austin Population and Demographics (Austin, TX). Retrieved 25 October 2015, from http://austintx.areaconnect.com/statistics.htm Blázquez, M. (2014). Fashion Shopping in Multichannel Retail: The Role of Technology in Enhancing the Customer Experience. International Journal Of Electronic Commerce, 18(4), 97-116. doi:10.2753/ • Die Cut Handle Bags. (n.d.). Retrieved November 1, 2015, from http://www.uline.com/BL_5554/Die-Cut-Handle-Bags • Mintel. (2014, September). Men’s and women’s footwear. Retrieved October 15, 2015 from http://academic.mintel.com/. • Hoovers. (2014). Shoe Stores. Retrieved October 15, 2015, from • Hoovers.com (n.d.). Retrieved November 1, 2015, from https://www.claritas.com/MyBestSegments/Default.jsp?ID=20&menuOption=ziplookup&pageName=ZIP+Code+Lookup#. • Online Accounting Software- Free Trial for QuickBooks Online. (2015). Retrieved October 29, 2015, from http://quickbooks.intuit.com/online. • Payroll Services. (n.d.). Retrieved November 1, 2015, from https://www.utexas.edu/payroll/taxes/current.html • Prive, T. (2013, March 12). Angel Investors: How the Rich Invest. Retrieved November 1, 2015, from http://www.forbes.com/sites/tanyaprive/2013/03/12/angels-investors-how-the-rich-invest/2/. • Statista. (2014). Sales of the leading apparel/footwear retailing companies worldwide in 2014 (in billion U.S. dollars). Retrieved October 15, 2015, from Statista.com • Vend - Point of sale you'll love to use. (2015). Retrieved October 29, 2015, from https://www.vendhq.com. • Washington Post,. (2015). 25 best cities for independent businesses. Retrieved 23 October 2015, from http://www.washingtonpost.com/business/capitalbusiness/25-best-cities-for-independent- businesses/2011/10/18/gIQAylRC4L_gallery.html • Will McKitterick. IBISWorld Industry Report 44821: Shoe Stores. Retrieved October 15, 2015 from IBISWorld.com • 1211 W 6th St, Austin, TX 78703. (2015, July 1). Retrieved November 1, 2015, from http://www.loopnet.com/Listing/19352105/1211-W-6th-St-Austin-TX/
  • 21.
    APPENDIXA Caliber Shoes BusinessModel Canvas 19 Equipment Scientists Capital for R&D Patents Facilities Chemicals • Production: ordering, supply chain management, Manufacturing • Media/Marketing • Website Upkeep • High Quality products • Great customer service • Good Design • Durability • Online Advertising • Flyers • Posters • Customer Service • Customer Loyalty Program • Young Male Professionals • Women buying for men • 22-35 age group • Direct Sales Margin • Vend POS Retail system Marketing costs • Manufacturers
  • 22.
    APPENDIXB QuickBooks Online 20 QuickBooks allowsthe company to stay up to date with the current financial state of the business. The accounting software keeps track of the businesses income, expenses, profits, losses, etc. The software then takes the data and then makes reports for the manager and other investors to make important decisions.
  • 23.
    APPENDIXC Step one: Choosethe Products Step three: Check out Customer Step two: Enter the Product Step four:Complete the Sale 21
  • 24.
  • 25.
  • 26.
    APPENDIXF Figure xx The iPadbundle comes with one iPad stand, a cash register, receipt printer, and one cord. This bundle costs $483. The hardware that comes with the bundle is compatible with the software. In addition to the bundle, we will have two iPads. The cash register and receipt printer will be able to connect with the iPads from anywhere in the store. This will make it quicker for the cashiers to checkout the customers. 24 iPad and register bundle
  • 27.
  • 28.
  • 29.
  • 30.
  • 31.
  • 32.
    APPENDIXL PESTLE 30 Take Away•The shoeindustry is rarely directly involved or regulated by political forces, but changes in policy on a large scale can have significant effects on manufactures and retailers.Political •Shoes, particularly the higher-end fashionable kind, are a luxury good. This means changes in economic health (GDP, real wages, employment) will have very direct consequences on demand. As the economy grows stronger in the USA, there should foreseeably be more demand for these sorts of products. In the event of economic downturn, the opposite could happen. Economic •Selling shoes (or any other types of apparel) is hugely based on changes in fashion trends and consumer preferences. Product lines for a retailer needs to stay up to date with these changes to remain profitable. Current trends include a resurgence of classic formal styles and the ongoing popularity of casual athletic shoes Social •Advancements in technology have made e-Commerce a powerful force in the shoe retail industry. Customers can use phones to price check, compare options, and then purchase from basically anywhere. While the basics of shoe design has remained the same for decades, firm’s use of new materials (ie. Nike/ALDO’s Lunar product line) and wearable technology are important trends. Technology •Shoe manufacturers are very concerned with the presence of knock-offs and fakes. Shoe makers work hard to create a brand identity and recognizable product. With so many imitation products out there, consumers and retailers need to make sure they are sourcing genuine products. Legal •Over the past century, the useable lifetime for a pair of shoes has gotten shorter and shorter. This means more consumer and manufacturing waste from increases in production. Some firms have attempted to reduce their environmental footprint especially as consumer trends demand ethically produced products. Environment
  • 33.
    PORTERS FIVE FORCES Everyone has towear something on their feet, the consumer just has options of where they will buy the shoes, but almost 100% of people in the developed world wear shoes daily. Footwear production is dominated by a few large international firms who dominate production of finished goods. Using low-priced materials and labor they compete to produce goods efficiently at low prices. Footwear shoppers have a multitude of options of both brands and 3rd party retailers to choose from. Customers do however have low leverage on firms as individuals since each sale is such a small source of revenue. Competition in the footwear retail business is led by large chain stores like DSW and Famous Footwear, and online suppliers like Zappos and Amazon. These firms typically excel in high volume, low margin type sales, while smaller boutique retailers are more likely to operate by selling at low volumes and high margins. An independent footwear retail business has relatively low start-up costs. Inventory and rent make up the majority of those costs Producing a completely new product has much higher costs on account of the complex international supply chain of producing a pair of shoes. APPENDIXM Porter’s Five Forces 31 Barriers to entry Power of Buyers Power of Suppliers Threat of Substitutes Competition
  • 34.
    APPENDIXN Average income byhousehold 32 Mintel
  • 35.
    APPENDIXO Caliber Shoes IncomeStatement 33 INTRODUCTION ENVIROMENTAL BUSINESS CONCEPT DEMAND SCENARIO MARKETING INFORMATION SYSTEMS FINANCE CONCLUSION Year 1 Year 2 Year 3 Year 4 Year 5 Cash Sales (20%) 131,354 144,883 159,806 176,266 194,422 Credit Sales (80%) 525,415 579,533 639,225 705,065 777,686 Sales (a) $ 656,769 $ 724,416 $ 799,031 $ 881,331 $ 972,108 Cost of goods sold and occupany costs (b) 394,453 417,163 454,238 495,132 540,238 Gross profit 262,316 307,253 344,793 386,199 431,870 Direct store expenses (c) 262,315 271,453 281,146 291,888 303,912 General and administrative expenses (d) 352 $479.40 $479.40 $479.40 $479.40 Pre-opening expenses $ 70,405.60 - - - - Operating income (70,756) 35,320 63,167 93,832 127,479 Interest expense 10,651 9,377 8,000 6,508 4,893 Income before income taxes (81,407) 25,943 55,167 87,324 122,585 Provision for income taxes (12,211) 3,891 9,348 17,940 32,122 Net income $ (69,196) $ 22,051 $ 45,819 $ 69,384 $ 90,463
  • 36.
    APPENDIXP Caliber Shoes BalanceSheet 34 INTRODUCTION ENVIROMENTAL BUSINESS CONCEPT DEMAND SCENARIO MARKETING INFORMATION SYSTEMS FINANCE CONCLUSION Start-Up Year 1 Year 2 Year 3 Year 4 Year 5 Cash $228,044.68 $ 457,247 $ 363,744 $ 557,201 $ 585,068 $ 677,063 Accounts Receivables $ - $43,784.58 $ 48,294 $ 53,269 $ 58,755 $ 64,807 Inventory $228,044.68 $118,846.20 $214,982.55 45,999 64,166 37,228 Prepaid expenses 4,582 5,049 5,564 6,133 6,760 7,451 Total current assets 460,671 624,927 632,586 662,602 714,749 786,550 Property and equipment, net (a) $1,485.59 $1,188.47 $713.08 $427.85 $256.71 $85.57 Intangible assets, net 600 540 480 420 360 300 Total assets $ 462,757 $ 626,655 $ 633,779 $ 663,450 $715,365.96 $786,935.12 Accounts payable $ - $228,044.68 $228,044.68 $228,044.68 $228,044.68 $228,044.68 Accrued expenses - 5,049 5,564 6,133 6,760 7,451 Current portion of long-term debt - $15,443.24 $16,716.26 $18,094.21 $19,585.76 $21,200.26 Total current liabilities $0.00 248,537 250,325 252,272 254,390 256,696 Long-term debt 138,827 123,384 106,668 88,573 68,988 47,787 Total liabilities $138,827.04 371,921 356,993 340,845 323,378 304,484 Paid-in equity capital 323,930 323,930 323,930 323,930 323,930 323,930 Retained earnings (b) - (69,196) (47,144) (1,325) 68,058 158,522 Total equity 323,930 254,734 276,785 322,604 391,988 482,452 Total liabilities and equity $ 462,757 $ 626,655 $ 633,778 $ 663,449 $ 715,366 $ 786,935
  • 37.
    APPENDIXQ Caliber Shoes CapitalBudgeting 35 INTRODUCTION ENVIROMENTAL BUSINESS CONCEPT DEMAND SCENARIO MARKETING INFORMATION SYSTEMS FINANCE CONCLUSION 0 1 2 3 4 5 EBITDA $ (70,399) $ 35,856 $ 63,510 $ 94,063 $ 127,710 - Depreciation and amortization $357.12 $535.39 $345.23 $231.14 $231.14 EBIT (70,756) 35,320 63,165 93,832 127,479 x (1 - tax rate) 0.85 0.85 0.83 0.79 0.74 Operating profit after tax (60,143) 30,022 52,427 74,127 94,334 + Depreciation and amortization $357.12 $535.39 $345.23 $231.14 $231.14 Operating cash flow $ - $ (59,786) $ 30,558 $ 52,772 $ 74,358 $ 94,566 - Change in net working capital (460,671) (164,255) (7,659) (30,016) (52,147) (71,800) - Capital spending $ (6,214.32) Free cash flow $ (466,886) $ (224,041) $ 22,899 $ 22,756 $ 22,211 $ 22,765 + Horizon value (end of year 5) 510,840 Project cash flow $ (466,886) $ (224,041) $ 22,899 $ 22,756 $ 22,211 $ 510,840 EBITDA (year 5) $ 127,710 x Market multiple 4.0 Horizon value (end of year 5) $ 510,840