Recommended

Recommended
More Related Content
What's hot
What's hot (20)
Viewers also liked
Viewers also liked (16)
Similar to Alta Peg X%20 Poster
Similar to Alta Peg X%20 Poster (20)
Alta Peg X%20 Poster
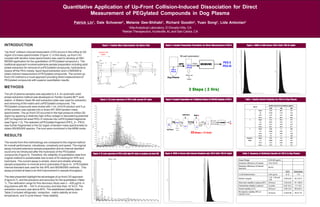
- 1. Quantitative Application of Up-Front Collision-Induced Dissociation for Direct Measurement of PEGylated Compounds in Dog Plasma Patrick Lin1 , Dale Schoener1 , Melanie Gee-Shihabi1 , Richard Goodin2 , Yuan Song2 , Lida Antonian2 1 AltaAnalytical Laboratory, El Dorado Hills, CA 2 Nektar Therapeutics, Huntsville,AL and San Carlos, CA INTRODUCTION “Up-front” collision-induced dissociation (CID) occurs in the orifice to Q0 region of a mass spectrometer (Figure 1). In this study, up-front CID coupled with tandem mass spectrometry was used to develop an MS/ MS/MS application for the quantitation of PEGylated compound x. The traditional approach involved extensive sample preparation including solid phase extraction for removal of unPEGylated compounds, hydrolysis to cleave off the PEG moiety, liquid-liquid extraction and LC/MS/MS to obtain indirect measurement of PEGylated compounds. The current up- front CID method is a novel approach providing direct measurement of PEGylated compounds with superior quantitation results. METHODS The pH of plasma samples was adjusted to 4.4. An automatic solid phase extraction method was developed on Tomtec Quadra 96™ work station. A Waters Oasis 96-well extraction plate was used for extraction and removing of the matrix and unPEGylated compounds. The PEGylated compounds were eluted with 1 mL of ACN solution and 5 µL of the solution was injected into a Sciex API 3000 tandem mass spectrometer. The up-front CID occurred in the high pressure orifice-Q0 region by applying a relatively high orifice voltage or declustering potential (DP) to fragment all sized PEG-X mixtures into unPEGylated fragments (see Figure 1-3). The selected unPEGylated fragment (PEG_X – PEG) was further fragmented in the Q2 region of tandem mass spectrometer to obtain MS/MS/MS spectra. The ions were monitored in the MRM mode. RESULTS The results from this methodology are compared to the original method for overall performance, robustness, complexity and speed. The original assay included extensive sample preparation and an internal standard could only be introduced after the hydrolysis of the PEGylated compounds (Figure 5). Therefore, the reliability of quantitation data from original method is questionable due to lack of IS tracking for SPE and hydrolysis. The current assay is simple, direct and reliable whereby sample preparation is minimal and is automated (Figure 4). A PEGylated internal standard was used for the SPE and MS/MS/MS methods. This assay provided at least a six-fold improvement in sample throughput. The data presented highlight the advantages of up-front CID approach (Figure 6,7), and the precision and accuracy for the quantitation (Table 1). The calibration range for this discovery study was 2 – 400 µg/mL in dog plasma with 98 – 104 % of accuracy and less than 16 %CV. The extraction recovery was above 60%. The established stability data in Table 2 included refrigerator, reinjection, matrix stability at room temperature, and 3-cycle freeze / thaw stability. Figure 1: Tandem Mass Spectrometer Ion Optics Path Figure 2: Q1 scan spectrum of PEG-X with normal DP value Figure 3: Q1 scan spectrum of PEG-X with high DP value to produce up-front CID Figure 4: Sample Preparation Procedures for Direct Measurement of PEG-X Figure 5: Sample Preparations for Traditional Indirect LC-MS/MS Analysis of PEG-X Figure 6: MRM of Extract with Internal Standard only: PEG-X (left), PEG-IS (right) Figure 7: MRM of LLOQ Extract: PEG-X (left), PEG-IS (right) Table 1: Quality Control Statistics for PEG-X in Dog Plasma Table 2: Summary of Validation Results for PEG-X in Dog Plasma Up-front CID region PEG X - PEG 3 Steps ( 2 Hrs) Dog Plasma X PEG-X PEG-IS MS/MS/MS PEG-X PEG-IS SPE PEG-X PEG-IS Elute Wash out X matrix 96-well automation Dog Plasma X ISX PEG-X PEG-X SPE Elute PEG-X Dry down Buffer Recon. Hydrolysis 900 C X IS PEG Shake Organic Layer decant Dry down Reconstitute LC-MS/MSX IS MTBE+IS 22 Steps ( 12 Hrs)! Wash out X matrix Assay Range 2.00-400 µg/mL Extraction Efficiency of Analyte 74.0-78.4% Extraction Efficiency of Internal Standard 69.4% %CV %Accuracy LLOQ Determination 2.00 ug/mL 8.12 114 Dilution integrity 1:10, 1:20 and 1:50 2.59-6.60 94.1-97.4 Short-term stability in plasma (RT) 24 hours 3.03-5.62 91.1-98.8 Freeze/thaw stability in plasma 3 cycles 6.57-10.3 111-121 Extract stability (4°C) 26 hours 2.99-12.9 89.5-93.2 Re-injection stability (RT) re- injected curve 34 hours 4.45-6.58 94.9-110 10110197.8%Acc. 6.838.4816.5%CV 19.38.580.969sdBatch 2821015.87MeanBetween - 106111115%Acc. 7.088.0612.0%CV 21.18.930.828sd 2981116.89Mean3 97.195.090.2%Acc. 5.793.099.37%CV 15.72.940.507sd 27295.05.41Mean2 98.998.390.0%Acc. 4.863.2113.6%CV 13.53.150.732sd 27798.35.40Mean1 2801006.00 Quality Control Concentrations (µg/mL) Run # 10110197.8%Acc. 6.838.4816.5%CV 19.38.580.969sdBatch 2821015.87MeanBetween - 106111115%Acc. 7.088.0612.0%CV 21.18.930.828sd 2981116.89Mean3 97.195.090.2%Acc. 5.793.099.37%CV 15.72.940.507sd 27295.05.41Mean2 98.998.390.0%Acc. 4.863.2113.6%CV 13.53.150.732sd 27798.35.40Mean1 2801006.00 Quality Control Concentrations (µg/mL) Run #