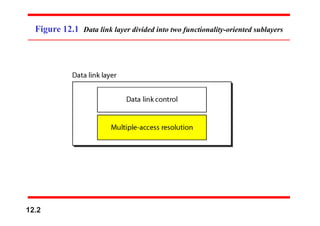
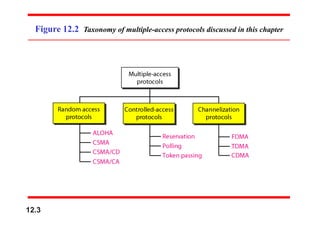
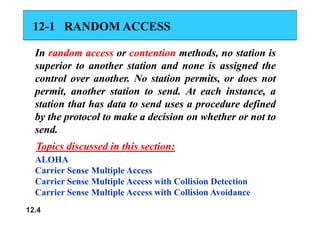
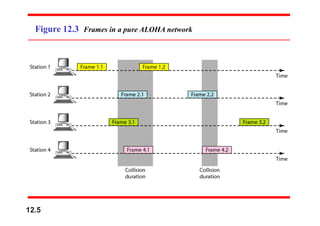
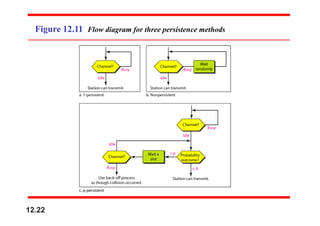
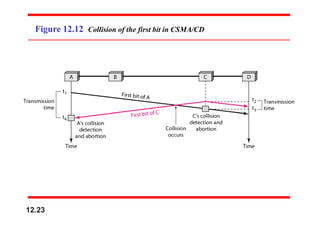
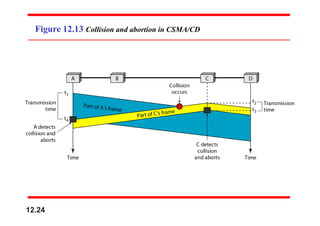
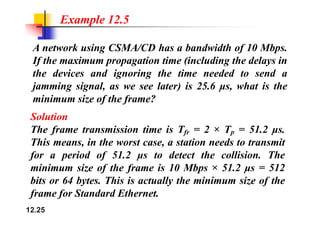
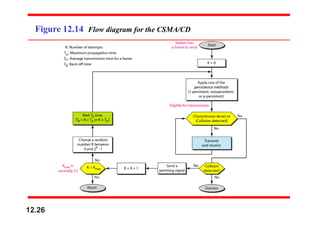
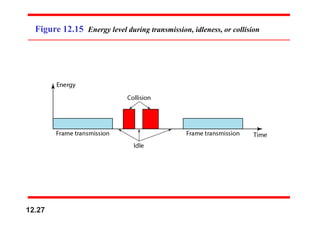
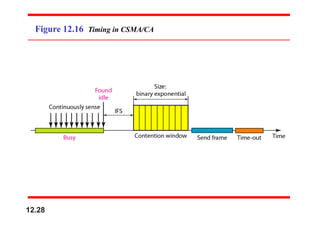
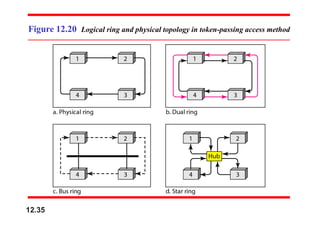
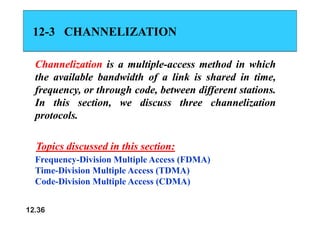
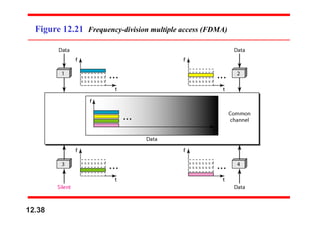
This document provides an overview of multiple access protocols and channelization methods for wireless networks. It discusses random access methods like ALOHA and slotted ALOHA, controlled access methods using reservation, polling, and token passing, and channelization methods including frequency-division multiple access (FDMA), time-division multiple access (TDMA), and code-division multiple access (CDMA). Examples are provided to illustrate how to calculate throughput for different frame arrival rates in ALOHA and slotted ALOHA networks. Figures and notes explain carrier sense multiple access (CSMA) variants and how the different channelization methods divide access to the channel.


![Example 12.6
Find the chips for a network with
a. Two stations b. Four stations
Solution
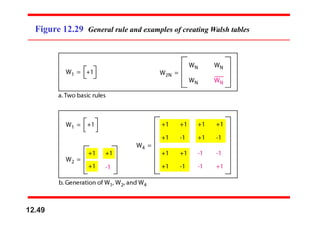
We can use the rows of W2 and W4 in Figure 12.29:
a. For a two-station network, we have
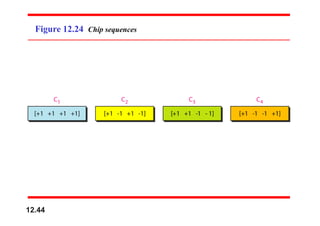
[+1 +1] and [+1 −1].
b. For a four-station network we have
[+1 +1 +1 +1], [+1 −1 +1 −1],
[+1 +1 −1 −1], and [+1 −1 −1 +1].
12.51](https://image.slidesharecdn.com/aloha-240414103329-54db5fd0/85/ALOHA-multiple-access-data-communication-and-networking-pdf-51-320.jpg)