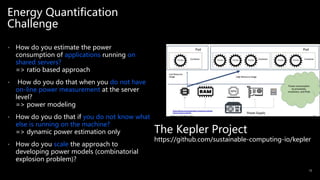
Downloaded 32 times


![16
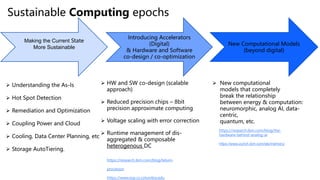
[1] https://github.com/sustainable-computing-io/kepler
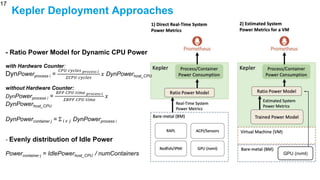
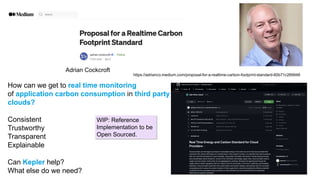
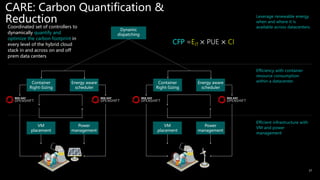
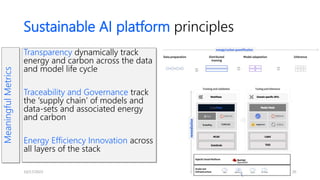
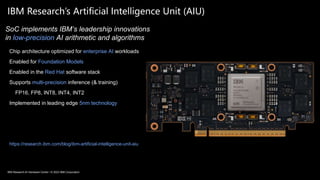
Kepler Architecture
• eBPF metrics:
hardware
counters, cpu
time and soft IRQ
• System Power
metrics from BMs
and VMs
• Ratio Power
Model for
containers
• Trained Power
Model to estimate
the VM’s
component
power
consumption](https://image.slidesharecdn.com/aisustainabilitymascots23-f-231017121854-36c4c7a2/85/AI-Sustainability-Mascots-23-f-pptx-16-320.jpg)


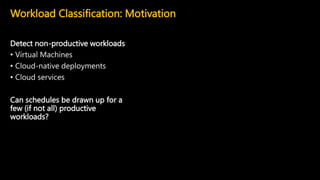
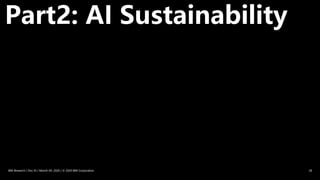
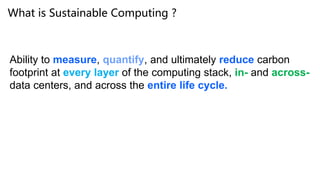
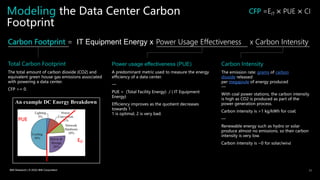
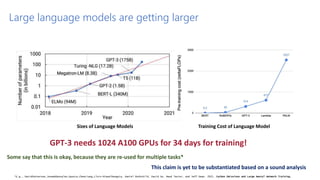
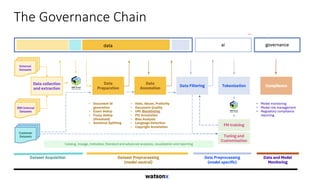
![AI demand keeps surging Training requirements
are doubling every 3.5
months
Source: Emma Strubell, Ananya Ganesh, and Andrew McCallum. 2019. Energy and
Policy Considerations for Deep Learning in NLP. CoRR abs/1906.02243 (2019).
arXiv:1906.02243
Source: Roy Schwartz, Jesse Dodge, Noah A. Smith, and Oren Etzioni. 2019. Green AI.
arXiv:1907.10597 [cs.CY]](https://image.slidesharecdn.com/aisustainabilitymascots23-f-231017121854-36c4c7a2/85/AI-Sustainability-Mascots-23-f-pptx-30-320.jpg)
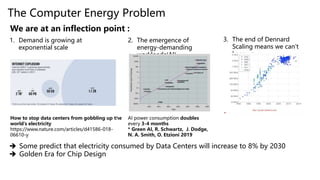
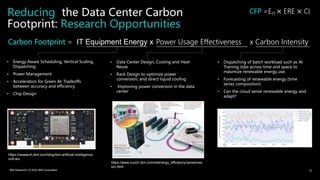
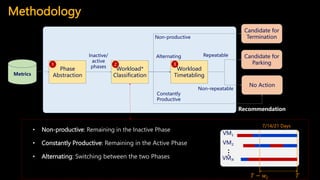
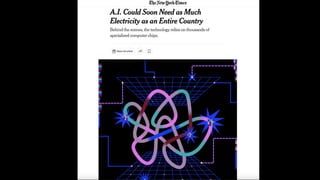
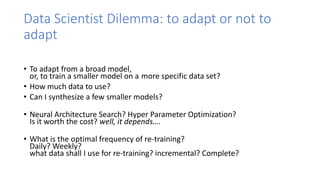
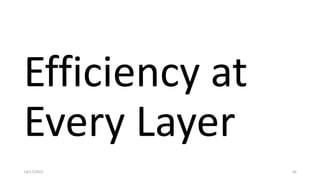
![The emergence of foundation models
Homogenization: a broad foundation
model is adapted to perform specific tasks.
Almost all state-of- the-art NLP models are
now adapted from one of a few foundation
models, such as BERT, RoBERTa, BART,
T5, etc.
Multi modal, and cross domains are next.
Source: RishiBommasani,DrewA.Hudson,EhsanAdeli,RussAltman,SimranArora, Sydney von Arx, Michael S.
Bernstein, Jeannette Bohg, Antoine Bosselut, Emma Brunskill, Erik Brynjolfsson, Shyamal Buch, Dallas Card,
Dallas Card, Rodrigo Castellon, Niladri Chatterji, Annie Chen, Kathleen Creel, Jared Quincy Davis, Dora
Dora Demszky, and Chris Donahue et al. 2022. On the Opportunities and Risks of Foundation Models.
Models. arXiv:2108.07258 [cs.LG]](https://image.slidesharecdn.com/aisustainabilitymascots23-f-231017121854-36c4c7a2/85/AI-Sustainability-Mascots-23-f-pptx-31-320.jpg)
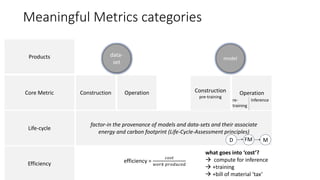

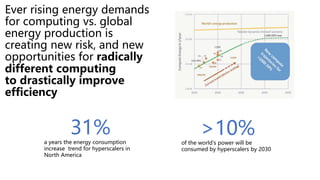
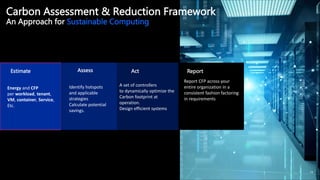
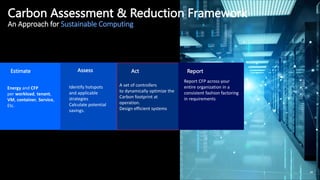
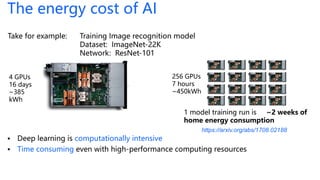
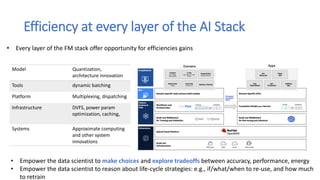
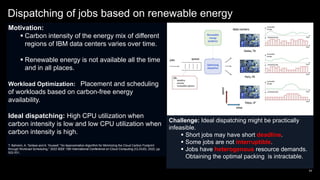
![SusQL: Context aware aggregation and energy accounting
Infrastructure: Kubernetes controller with its own CRD that gets data from Kepler for
aggregation
susql-controller
map[labels]->energy table
1 2
3
4
apiVersion: …
kind: LabelGroup
metadata: …
spec:
labels:
- <label-1>
- <label-2>
- <label-3>
- <label-4>
status:
totalEnergy: <total energy>](https://image.slidesharecdn.com/aisustainabilitymascots23-f-231017121854-36c4c7a2/85/AI-Sustainability-Mascots-23-f-pptx-40-320.jpg)

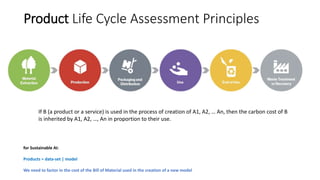

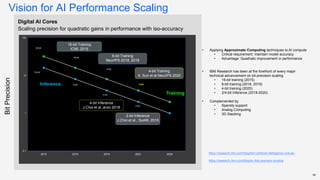

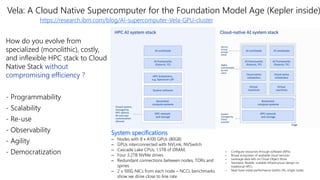


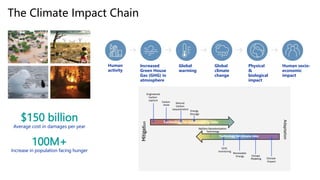
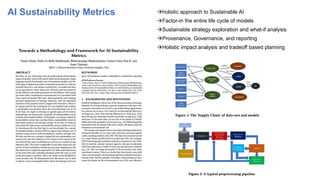
Dr. Tamar Eilam discusses sustainable computing and AI sustainability. Deep learning requires a lot of computation and energy to train large models. The demand for AI is growing exponentially, as are the sizes of language models. Foundation models are becoming more common, where a broad pre-trained model is adapted for specific tasks. However, continuously training larger models risks increasing energy consumption significantly. Sustainable AI research aims to dynamically track energy and carbon usage, while helping data scientists determine optimal model training strategies based on transparency around computational costs and model performance.

![WinZip Crack 27.0 Build 15240 + Activation Code Download [2025]](https://cdn.slidesharecdn.com/ss_thumbnails/artificialintelligence-250519084621-5869be70-thumbnail.jpg?width=640&height=640&fit=bounds)


![谷歌留痕技术 [ 𝙩𝙤𝙥 𝟮𝟯𝟯. 𝙘 𝙤𝙢 ]](https://cdn.slidesharecdn.com/ss_thumbnails/top233-260130174328-3833018c-thumbnail.jpg?width=640&height=640&fit=bounds)


