Download as PDF, PPTX

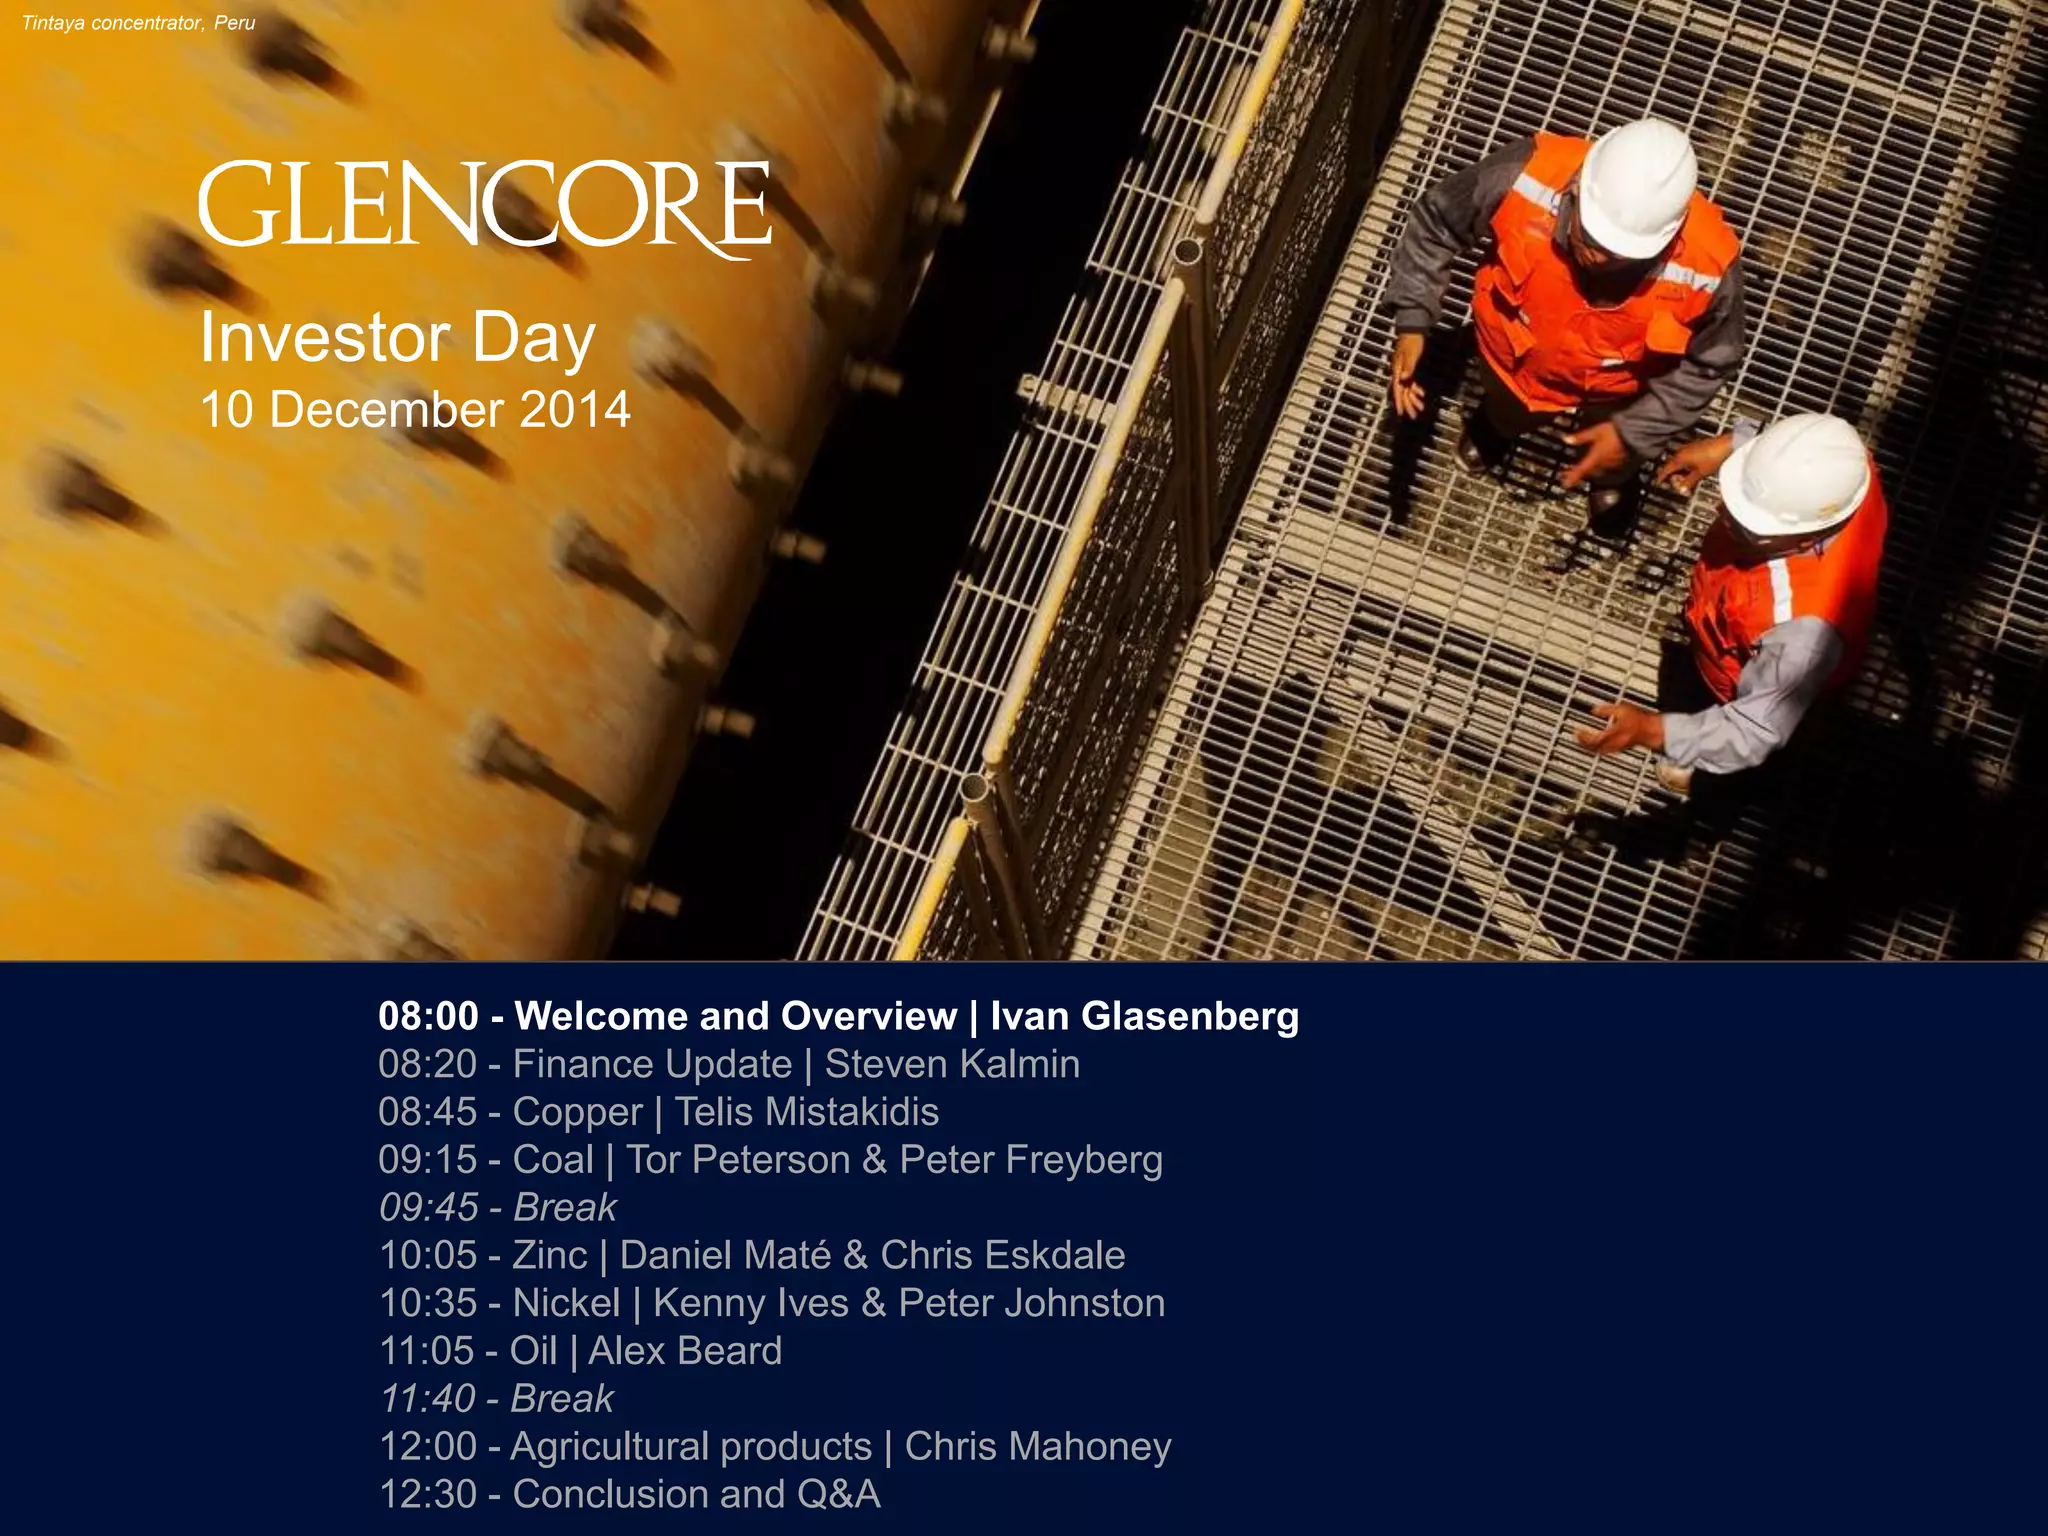


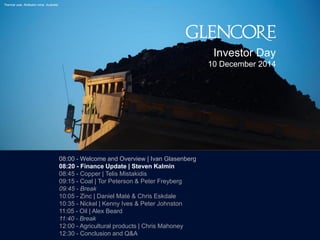


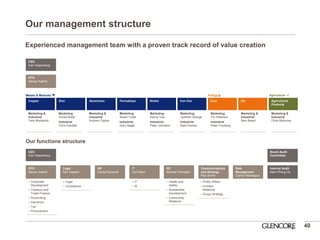
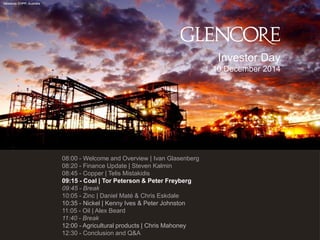

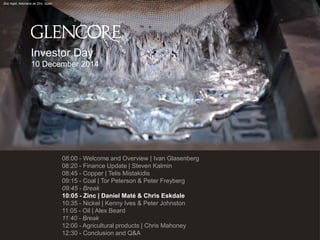
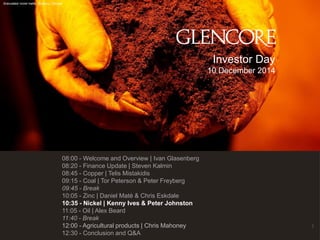
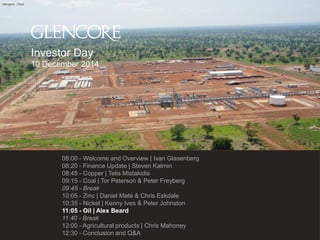


The document contains the agenda for Glencore's 2014 Investor Day, which includes presentations on various commodities and business units from senior leadership. The day will begin with welcome remarks from the CEO and then include updates on finance, copper, coal, zinc, nickel, oil, agricultural products and a conclusion with Q&A.


