Downloaded 214 times
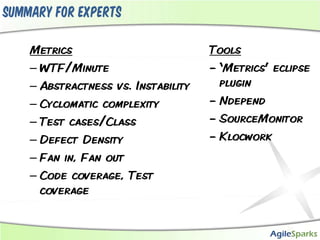
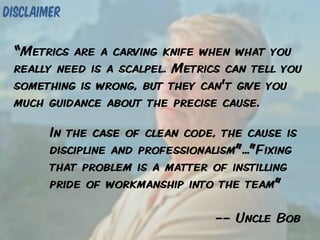

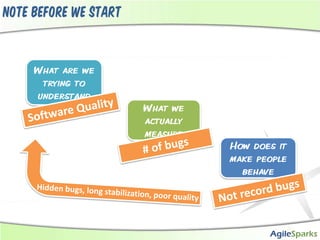


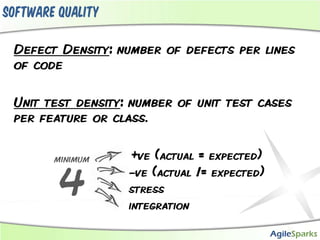
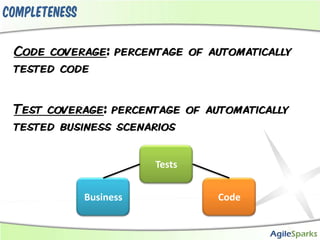
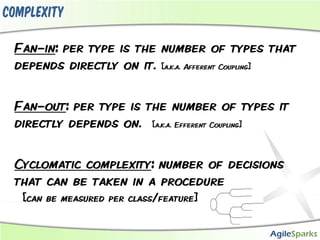

The document discusses various code quality metrics that can be used to understand software quality, including defects density, unit test density, code and test coverage, cyclomatic complexity, fan-in and fan-out, and WTFs per minute. While metrics can help identify issues, they cannot determine the precise cause. Metrics should be used carefully to avoid incentivizing behaviors like hiding bugs. Maintaining pride in craftsmanship is important for quality.