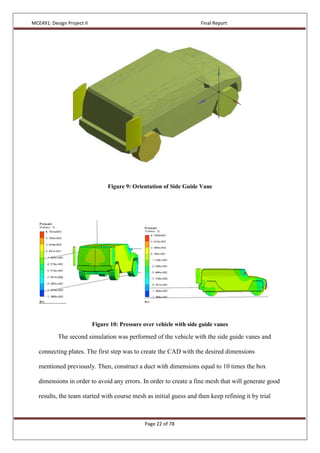
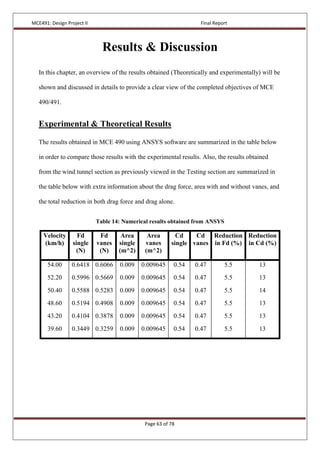
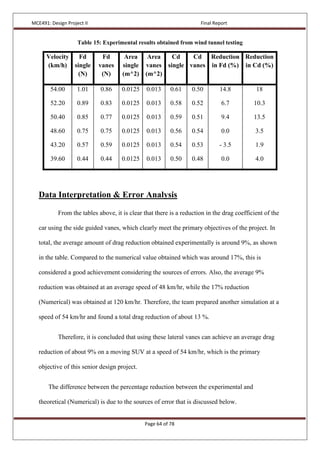
This document is the final report for an engineering design project aimed at reducing aerodynamic drag on sport utility vehicles using side guide vanes. A team of four students conducted simulations and experiments to test designs for side guide vanes on a scale model of a Hummer H2. In the second phase of the project, the team finalized their design, manufactured guide vanes out of plexiglass, attached them to the model using connecting plates, and tested the prototype in a wind tunnel. The simulations predicted a 15% reduction in drag coefficient with the guide vanes, while experimental testing yielded a 9% reduction, within 4% of the numerical results.


![MCE491: Design Project II Final Report
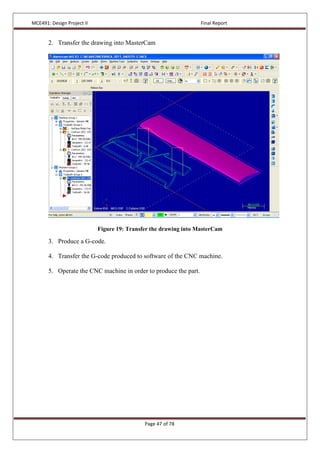
Page 72 of 78
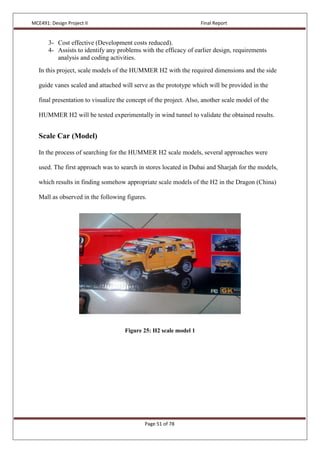
References
(2010). Real prospects for energy efficiency in the United states. (1 ed.). Washington, DC:
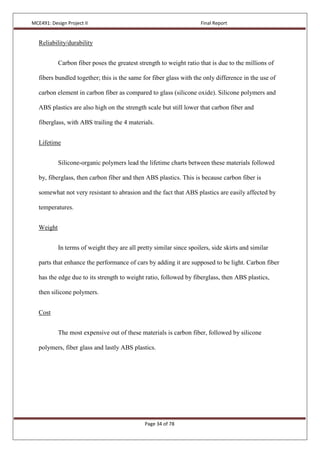
National Academics Press. Retrieved from
http://books.google.ae/books?id=lYXKCnphPNUC&printsec=frontcover&dq=Real
prospects for energy efficiency in the united
states&hl=en&sa=X&ei=BIsHT8TaHMu0hAeZpvCGCQ&redir_esc=y.
Abs/san. (n.d.). Retrieved from
http://machinedesign.com/BDE/materials/bdemat2/bdemat2_1.html
Andrews, R., & Kimber, G. (2000). Mechanical properties of carbon fiber composites for
environmental applications. Retrieved from http://www.anl.gov/PCS/acsfuel/preprint
archive/Files/41_1_NEW ORLEANS_03-96_0354.pdf.
Cengel Y. (2006). Fluid Mechanics. New Jersey, USA: McGraw-Hill.
Djavareshkian, M. H. and Esmaeli, A. (2011), "Smart Spoiler for Race Cars," World
Academy of Science, Engineering and Technology, vol. 73.
E. Suckow, Overview, http://history.nasa.gov/naca/overview.html, April. 29, 2009 [Nov. 15,
2011].
E. Suckow, Overview, http://history.nasa.gov/naca/overview.html, April. 29, 2009 [Nov. 15,
2011].
F. John, (2002). Fluid mechanics with engineering applications. Boston, USA: McGraw-Hill.
Fiberglass and Composite Material Design Guide. Performance Composites.
http://performance composite.com.
Fiberglass Manufacturing and the Environment. State of Oregon, Department of
Environmental Quality.](https://image.slidesharecdn.com/14098135-010a-4047-bfc8-65b534703df8-160921002542/85/Aerodynamic-Drag-Reduction-for-Ground-Vehicles-using-Lateral-Guide-Vanes-72-320.jpg)
![MCE491: Design Project II Final Report
Page 73 of 78
Franck, G. and D'Elia, J., "CFD Modeling of the Flow around the Ahmed Vehicle
Model," International Center for Computational Methods in Engineering.
Gislason, S. (2011), Air & Breathing, 3rd ed., New York: Environmental Research Inc.
Howell, J., Sherwin, C., Good, G. L. and Passmore, M. (2002), "Aerodynamic Drag of a
Compact SUV as Measured On-Road and in the Wind Tunnel," SAE Technical Paper
Series.
Hu, X. X. and Wong, E. T. T. (2011), "A Numerical Study On Rear-spoiler Of Passenger
Vehicle," World Academy of Science, Engineering and Technology, vol. 81.
J. Scott. NACA Airfoil Series, http://www.aerospaceweb.org/question/airfoils/q0041.shtml,
Aug. 26, 2001 [Nov. 15, 2011].
J. Scott. NACA Airfoil Series, http://www.aerospaceweb.org/question/airfoils/q0041.shtml,
Aug. 26, 2001 [Nov. 15, 2011].
Jindal, S., Khalighi, B. and Laccarino, G. (2005), "Numerical Investigation of Road Vehicle
Aerodynamics Using Immersed Boundary RANS Approach," SAE Technical Paper
Series.
John, F. (2002). Fluid mechanics with engineering applications. Boston, USA: McGraw-Hill.
Khalighi, B., Zhang, S., Koromilas, C., Balkanyi, S. R., and Bernal, L. P. (2001),
"Experimental and Computational Study of Unsteady Wake Flow Behind a Bluff Body
with a Drag Reduction Device," Society of Automotive Engineers.
Krishnani, P. N. (2006), "CFD Study of Drag Reduction of Generic Sport Utility Vehicle,"
Master of Science Thesis, Mumbai University, Mumbai, India.
Lamond, A. D., Kennedy, J. J. and Stickland, M. (2009), "An Investigation into Unsteady
Base Bleed for Drag Reduction in Bluff Two-Box SUV," Munich: 4th European
Automotive Simulation Conference.](https://image.slidesharecdn.com/14098135-010a-4047-bfc8-65b534703df8-160921002542/85/Aerodynamic-Drag-Reduction-for-Ground-Vehicles-using-Lateral-Guide-Vanes-73-320.jpg)
![MCE491: Design Project II Final Report
Page 74 of 78
NACA 4 Digits Series Profile Generator,
http://www.ppart.de/aerodynamics/profiles/NACA4.html, [Nov. 15, 2011]
O'Lenick, A. (2008). The silicone conundrum. Silicon Spectator. Retrieved from
http://www.siliconespectator.com/articles/September_2008.pdf
Pound, G. (2011, October 11) UAE Holds World Record for Number of Cars. [Online].
Available: http://experiencingtheemirates.blogspot.com/2007/04/uae-holds-world-record-
for-number-of.html.
Savas, O. and Tsuei, L., " Transient aerodynamics of vehicle platoons during in-line
oscillations," Department of Mechanical Engineering, University of California.
T. Benson, Wing Geometry Definitions, Internet: http://wright.nasa.gov/airplane/geom.html,
Mar. 25,2010 [Nov. 15,2011].
Tsia, C. H., Fu, L. M., Tai, C. H., Huang, Y. L., and Leong, J. C. (2009), "Computational
Aero-acoustic Analysis of a Passenger Car with a Rear Spoiler," Applied Mathematical
Modeling, vol. 33.
Why use fiberglass, composites, or carbon fiber?. (n.d.). Retrieved from
http://www.fiberglasssales.com/index.php/why_use_fiberglass.
Wood, R. M. and Bauer, S. X. S. (2003), "Simple and Low-Cost Aerodynamic Drag
Reduction Devices for Tractor-Trailer Trucks," SAE Technical Paper Series.](https://image.slidesharecdn.com/14098135-010a-4047-bfc8-65b534703df8-160921002542/85/Aerodynamic-Drag-Reduction-for-Ground-Vehicles-using-Lateral-Guide-Vanes-74-320.jpg)