Download to read offline
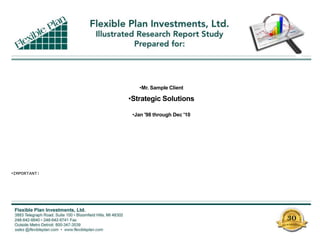
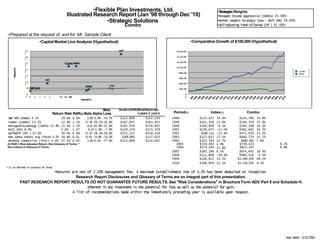
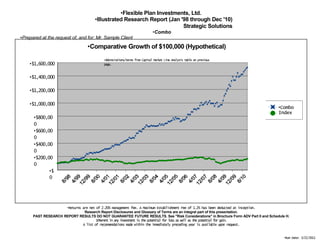
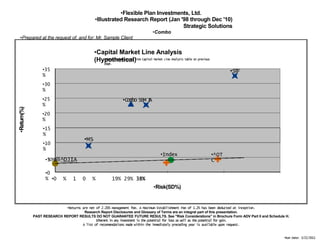
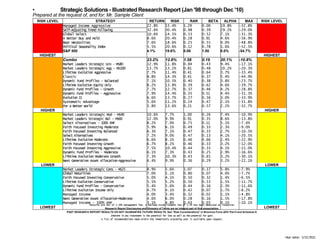

This document provides a 13-year performance summary of the "Strategic Solutions Combo" portfolio for Mr. Sample Client from January 1998 through December 2010. The Combo portfolio outperformed the S&P 500 index with returns of 23.2% annually compared to 4.1% for the index. It also shows lower risk than the index, as measured by standard deviation of returns. Charts compare the growth of a $100,000 investment in the Combo portfolio versus the S&P 500 index over time. Tables also rank the risk and return of the Combo versus other strategies and benchmarks.