Download as PDF, PPTX
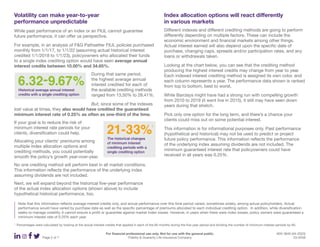
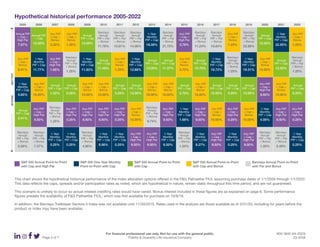
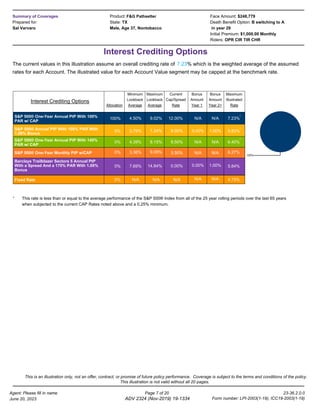

Diversifying premium allocations across multiple indexed interest crediting options in a fixed indexed universal life (FIUL) policy can help reduce risks. Using a single crediting option carries the risk that it may credit the minimum interest rate for as often as one-third of crediting periods. However, diversifying across options with varying performance in different market conditions can potentially smooth growth over time by reducing chances of minimum interest. While no option will always perform best, diversifying may help policyholders avoid missing out on potential interest from strongly performing options in any given year.


