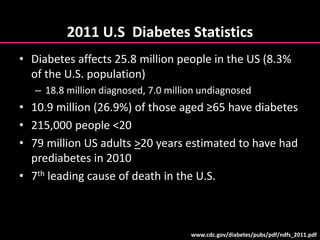
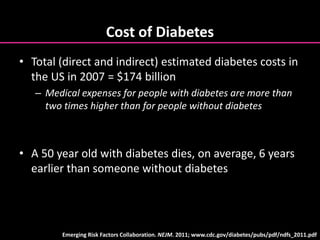
2011 U.S Diabetes Statistics
• Diabetes affects 25.8 million people in the US (8.3%
of the U.S. population)
– 18.8 million diagnosed, 7.0 million undiagnosed
• 10.9 million (26.9%) of those aged ≥65 have diabetes
• 215,000 people <20
• 79 million US adults >20 years estimated to have had
prediabetes in 2010
• 7th leading cause of death in the U.S.
www.cdc.gov/diabetes/pubs/pdf/ndfs_2011.pdf
Percentage of U.S. Adults With Diagnosed
Diabetes
1994 2000
No Data <4.5% 4.5-5.9% 6.0-7.4% 7.5-8.9% >9.0%
2009
www.cdc.gov/diabetes/statistics
Cost of Diabetes
• Total (direct and indirect) estimated diabetes costs in
the US in 2007 = $174 billion
– Medical expenses for people with diabetes are more than
two times higher than for people without diabetes
• A 50 year old with diabetes dies, on average, 6 years
earlier than someone without diabetes
Emerging Risk Factors Collaboration. NEJM. 2011; www.cdc.gov/diabetes/pubs/pdf/ndfs_2011.pdf
Type 2 Diabetes Pathophysiology
1Bergenstal RM, et al. Endocrinology. 2001; 2DeFronzo RA. Diabetes. 1988; 3Poitout V, et al. Endocrinology. 2002.
Gluco-
lipotoxicity
 Production of glucose
in the liver1,2
Acquired/genetic factors (obesity)1,2
 FFA1-3
Type 2 DM1
Inherited/acquired factors
 Glucose uptake1,2
Insulin deficiency,
inappropriate glucagon
secretion1,3
Insulin resistance1
Hyperglycemia1-3
FFA=free fatty acid
Decreased Incretin
Effect
Current Therapeutic Targets
Dopamine Analogs
Pramlintide
BRAIN PANCREAS
Insulin
GLP-1 Agonists
DPP-4 Inhibitors
Sulfonylureas
Pramlintide (α cells only)
Meglitinides
LIVER
Metformin
Thiazolidinediones (TZD)
GI TRACT
GLP-1 Agonists
Alpha Glucosidase
Inhibitors
MUSCLE/FAT
Metformin
Thiazolidinediones
(TZD)
?? KIDNEY ??
Updated ADA/EASD Consensus Algorithm
Nathan DM, et al. Diabetes Care. 2009.
At Diagnosis:
Lifestyle
+
Metformin Lifestyle + Metformin
+
Sulfonylurea
Lifestyle + Metformin
+
Basal Insulin
Lifestyle +
Metformin +
Intensive Insulin
Lifestyle + Metformin
+
Pioglitazone
No hypoglycemia,
edema/CHF, bone loss
Lifestyle + Metformin
+
GLP-1 agonist
No hypoglycemia,
weight loss,
nausea/vomiting
Lifestyle + Metformin
+
Basal Insulin
Lifestyle + Metformin
+
Pioglitazone
+
Sulfonylurea
STEP 1 STEP 2 STEP 3
Tier 2: Less well-validated therapies
Tier 1: Well-validated therapies
AACE/ACE DIABETES ALGORITHM
FOR GLYCEMIC CONTROL
American Association of Clinical Endocrinologists. AACE/ACE Diabetes Algorithm for Glycemic Control.
Available at https://www.aace.com/publications.
Risks of Current Therapies: Weight Gain
Met-
formin
DPP-4
Inhib-
itor
GLP-1
Agonist
SU Glinide TZD AGI Insulin
Pram-
lintide
Weight Gain
Met-
formin
DPP-4
Inhib-
itor
GLP-1
Agonist
SU Glinide TZD AGI Insulin
Pram-
lintide
Hypoglycemia
Neutral
Benefits
Causes
The Kidneys Play an Important Role in the
Handling of Glucose
Wright EM, et al. J Intern Med. 2007.
• Total glucose stored in body ~450 g
• Glucose utilization ~250 g/day
• Brain ~125 g/day
• Rest of body ~125 g/day
• Glucose in Western diet ~180 g/day
• Renal glucose production (gluconeogenesis + ~70 g/day
glycogenolysis)
• Renal glucose filtration and reabsorption ~180 g/day
• Urinary glucose 0 g
Sodium-Glucose Cotransporters
SGLT1 SGLT2
Site Mostly intestine with some kidney Almost exclusively kidney
Sugar specificity Glucose or galactose Glucose
Affinity for glucose
High
Km = 0.4 Mm
Low
Km = 2 Mm
Capacity for glucose
transport
Low High
Role
Dietary glucose absorption
Renal glucose reabsorption
Lee YJ, et al. Kidney Int Suppl. 2007.
Altered Renal Glucose Control in Diabetes
• Renal gluconeogenesis is increased in
patients with Type 2 DM
• Renal contribution to hyperglycemia
• 3-fold increase relative to patients without
diabetes
• Glucose reabsorption
• Increased SGLT2 expression and activity in renal
epithelial cells from patients with diabetes vs.
normoglycemic individuals
Marsenic O. Am J Kidney Dis. 2009; Bakris GL, et al. Kidney Int. 2009;
Rahmoune H, et al. Diabetes. 2005.
Rationale for SGLT2 Inhibitors
• The SGLT2 is a glucose transporter responsible for 90% of
glucose reabsorption
• Selective SGLT2 inhibitors could reduce blood glucose levels due
to increased renal excretion of glucose
• Mutations in the SGLT2 transporter linked to hereditary renal
glycosuria, a relatively benign condition in humans
• Selective SGLT2 inhibition would cause urine loss of the calories
from glucose (200-300 kcal/day), also potentially leading to
weight loss
Brooks AM, Thacker SM. Ann Pharmacother. 2009; Nair S, et al. J Clin Endocrinol Metab. 2010.
Effects of SGLT2 Inhibitors
Inhibition of renal tubular Na+-glucose cotransporter
Reversal of hyperglycemia
Reduction of “glucotoxicity”
Insulin sensitivity in muscle and liver
Gluconeogenesis
Improved beta cell function
Brooks AM, Thacker SM. Ann Pharmacother. 2009; Nair S, et al. J Clin Endocrinol Metab. 2010.
SGLT2 Inhibitors in
Phase 3 Development
• Dapagliflozin
• Canagliflozin
• Empagliflozin
• Ipragliflozin
• Tofogliflozin
Empagliflozin: Change in A1C
N = 408
Baseline A1C = 7.9%
*P<.001 vs. placebo
†500 mg BID for four weeks, then 1000 mg BID or the maximum tolerated dose
-0.8
-0.6
-0.4
-0.2
0
0.2
*
*
*
*
5 mg 25 mg10 mg Metformin
Placebo
ChangeinA1C(%)
Ferrannini E, et al. Abstract 877. EASD 2010.
Randomized, double-blind, 12 week trial comparing
empagliflozin and open-label metformin†
Empagliflozin: Change in FPG
N = 408
*P<.001 vs. placebo
†500 mg BID for four weeks, then 1000 mg BID or the maximum tolerated dose
Ferrannini E, et al. Abstract 877. EASD 2010.
-35
-30
-25
-20
-15
-10
-5
0
5
*
**
*
Placebo
5 mg 10 mg 25 mg Metformin
ChangeinFPG(mg/dl)
Randomized, double-blind, 12 week trial comparing
empagliflozin and open-label metformin†
Empagliflozin: Change in Weight
*
N = 408
Baseline BMI = 29 kg/m2
*P<.001 vs. placebo
†500 mg BID for four weeks, then 1000 mg BID or the maximum tolerated dose
Ferrannini E, et al. Abstract 877. EASD 2010.
-2.5
-2
-1.5
-1
-0.5
0
*
*
*
Placebo 5 mg 10 mg 25 mg Metformin
Changeinweight(%)
Randomized, double-blind, 12 week trial comparing
empagliflozin and open-label metformin†
Empagliflozin: Safety Considerations
Side effects:
– Polyuria (3.3% vs. 0% in placebo), thirst (3.3% vs. 0% in
placebo), and nasopharyngitis (2% vs. 1.2% in placebo)
were the most frequently reported side effects
– UTI 1.2% vs. 1.2% in placebo and 1.3% in metformin
Ferrannini E, et al. Abstract 877. EASD 2010.
Randomized, double-blind, 12 week trial comparing
empagliflozin and open-label metformin†
Canagliflozin: Change in A1C
*P<.001 vs. placebo calculated using LS means Rosenstock J, et al. Abstract 77-OR. ADA 2010.
N = 451
-0.22%
-0.79% -0.76%
-0.7%
-0.92% -0.95%
-0.74
-1
-0.8
-0.6
-0.4
-0.2
0
PBO 50 mg 100 mg 200 mg 300 mg 300 mg BID SITA 100 mg
ChangeinA1C(%)
*
**
*
Mean Baseline A1C (%) 7.71 8.01 7.81 7.57 7.70 7.71 7.62
*
*
Canagliflozin add-on to metformin, double-blind, placebo-
controlled, dose-ranging study (Phase 2)
Canagliflozin: Change in FPGChangeinFPG(mg/dl)
Rosenstock J, et al. Abstract 77-OR. ADA 2010.
N = 451
Baseline FGP 162 mg/dl)
*P<.001 vs. placebo calculated using LS means
-16.2
-25.2
-32.4 -32.4
-30.6
-18
-35
-30
-25
-20
-15
-10
-5
0
50 mg 100 mg 200 mg 300 mg 300 mg BID SITA 100 mg
*
*
* * *
*
Canagliflozin add-on to metformin, double-blind, placebo-
controlled, dose-ranging study (Phase 2)
Canagliflozin: Change in Weight
N = 451
Baseline weight 87 kg
*P<.01 vs. placebo calculated using LS means Rosenstock J, et al. Abstract 77-OR. ADA 2010.
-1.1
-2.3%
-2.6% -2.7%
-3.4% -3.4%
-0.6%
-4
-3
-2
-1
0
PBO 50 mg 100 mg 200 mg 300 mg 300 mg BID SITA 100 mg
Changeinweight(%)
Mean Baseline Weight (kg) 85.5 87.5 87.7 87.7 87.8 86.3 87
*
* *
* *
Canagliflozin add-on to metformin, double-blind, placebo-
controlled, dose-ranging study (Phase 2)
Canagliflozin: Safety Considerations
Side effects:
– Mild-to-moderate, transient
– Non dose-dependent increase in symptomatic genital
infections: 3-8% in canagliflozin vs. 2% in placebo and 2% in
sitagliptin
– UTI: 3-9% in canagliflozin (no dose-dependency) vs. 6% in
placebo and 2% in sitagliptin
– Hypoglycemia: 0-6% in canagliflozin (no dose dependency)
vs. 2% in placebo and 5% in sitagliptin
Rosenstock J, et al. Abstract 77-OR. ADA 2010.
Canagliflozin add-on to metformin, double-blind, placebo-
controlled, dose-ranging study (Phase 2)
Effects of Canagliflozin on
Vulvovaginal Candida Colonization (VCC)
– Relative to PBO/SITA, CANA treatment increased
conversion to positive vaginal Candida culture and
VVC events
– Incidence of VVC in female subjects was 2.9% and
3.7% with PBO and SITA, respectively, and 10.4%
with CANA
– None of the VVC events were serious or led to
discontinuation; most were treated with topical or
oral antifungals, and resolved without study drug
interruption
Nyirjesy P, et al. Abstract 0032-LB. ADA 2011.
Bacteria or UTI Incidence with
Canagliflozin
– At Week 12, CANA decreased A1C (0.45%-0.73% relative to PBO),
lowered weight (1.3%-2.3% relative to PBO), and increased urinary
glucose excretion (UGE) (35.4-61.6 mg/mg creatinine)
– Conversion from negative baseline urine bacterial culture to
positive culture did not differ in pooled CANA group vs pooled
PBO/SITA group (4.8% vs. 3.7%, respectively)
– UTI AEs (both symptomatic and positive post-baseline urine
culture reported as a UTI) occurred in 16 (5.0%) in pooled CANA
group and 5 (3.8%) in pooled PBO/SITA group
– All UTI AEs considered mild or moderate, and none led to
discontinuation
Nicolle L, et al. Abstract 0043-LB. ADA 2011.
Dapagliflozin Phase 3 Studies:
Change in A1C
-1
-0.9
-0.8
-0.7
-0.6
-0.5
-0.4
-0.3
-0.2
-0.1
0
Monotherapy
Met add-on
SU add-on
Insulin add-on
ChangeinA1C(%)
Placebo
Dapa
2.5mg
Dapa
5mg
Dapa
10mg
Wilding JPH, et al. Abstract 871. EASD 2010;
Strojek K, et al. Abstract 870. EASD 2010;
Ferrannini E, et al. Diabetes Care. 2010; Bailey CJ, et al. Lancet. 2010.
Baseline-
Monotherapy (N=591): 8.6%
Met add-on (N=546): 8%
SU add-on (N=597): 8.1%
Insulin add-on (N=808): 8.5%
ChangeinFPG(mg/dl)
Placebo
Dapa
2.5mg
Dapa
5mg
Dapa
10mg
Baseline-
Monotherapy (N=591): 179 mg/dl
Met add-on (N=546): 163.9 mg/dl
Insulin add-on (N=808): 178 mg/dl
Wilding JPH, et al. Abstract 871. EASD 2010;
Ferrannini E, et al. Diabetes Care. 2010; Bailey CJ, et al. Lancet. 2010.
Dapagliflozin Phase 3 Studies:
Change in FPG
-35
-30
-25
-20
-15
-10
-5
0
5
Monotherapy
Met add-on
Insulin add-on
-3.5
-3
-2.5
-2
-1.5
-1
-0.5
0
0.5
Monotherapy
Met add-on
SU add-on
Insulin add-on
Changeinweight(kg)
Placebo
Dapa
2.5mg
Dapa
5mg
Dapa
10mg
Baseline-
Monotherapy (N=591): 89.7 kg
Met add-on (N=546): 85.9 kg
SU add-on (N=597): 81.1 kg
Insulin add-on (N=808): 94 kg
Wilding JPH, et al. Abstract 871. EASD 2010;
Strojek K, et al. Abstract 870. EASD 2010;
Ferrannini E, et al. Diabetes Care. 2010; Bailey CJ, et al. Lancet. 2010.
Dapagliflozin Phase 3 Studies:
Change in Weight
Dapagliflozin, Metformin XR, or Both as
Initial Therapy
-3
-2
-1
0
-80
-60
-40
-20
0
-4
-3
-2
-1
0
M
E
T
D
A
P
A
5
m
g
D
A
P
A
+
M
E
T
D
A
P
A
+
M
E
T
D
A
P
A
1
0
m
g
M
E
T
M
E
T
D
A
P
A
5
m
g
D
A
P
A
+
M
E
T
D
A
P
A
+
M
E
T
D
A
P
A
1
0
m
g
M
E
T
M
E
T
D
A
P
A
5
m
g
D
A
P
A
+
M
E
T
D
A
P
A
+
M
E
T
D
A
P
A
1
0
m
g
M
E
T
Change in A1C Change in FPG
Change in Body Weight
Henry R, et al. Abstract 307-OR.
ADA 2011.
Dapagliflozin: Effect on BP and Lipids
HDL (% change)
– Placebo: +0.4
– Dapa 2.5mg: +1.8
– Dapa 5mg: +3.3
– Dapa 10mg: +4.4
Triglycerides (% change)
– Placebo: +2.1
– Dapa 2.5mg: -2.4
– Dapa 5mg: -6.2
– Dapa 10mg: -6.2
Systolic Blood Pressure (mmHg)
– Placebo: -0.2
– Dapa 2.5mg: -2.1
– Dapa 5mg: -4.3
– Dapa 10mg: -5.1
Diastolic Blood Pressure (mmHg)
– Placebo: -0.1
– Dapa 2.5mg: -1.8
– Dapa 5mg: -2.5
– Dapa 10mg: -1.8
Bailey CJ, et al. Lancet. 2010.
Dapagliflozin: Safety Considerations
Based on all trials (Monotherapy, metformin add-on,
sulfonylurea add-on, and insulin add-on)
Side effects:
– UTI*: 3.9-13.2% in dapagliflozin vs. 4-6.2% in placebo1-3
– Genital infections*: 3.9-12.9% in dapagliflozin vs. 0.7-5% in
placebo1-4
– Hypoglycemia: 0-7.9% in dapagliflozin vs. 2.7-4.8% in
placebo2-4
*Most occurred during the first 24 weeks, were generally mild, and responded to
routine management
1Wilding JPH, et al. Abstract 871. EASD 2010;
2Strojek K, et al. Abstract 870. EASD 2010;
3Ferrannini E, et al. Diabetes Care. 2010; 4Bailey CJ, et al. Lancet. 2010.
Dapagliflozin:
Sulfonylurea Comparator Study
Results
• Average A1C: 7.72%
• Change in A1C: -0.52% for dapagliflozin vs. -0.52% for glipizide
• Weight change: -3.2 kg for dapagliflozin vs. +1.4 kg for glipizide
• Hypoglycemic episodes: 3.5% for dapagliflozin vs. 40.8% with glipizide
• Significant reductions in diastolic and systolic blood pressure and
improvement in HDL with dapagliflozin vs. glipizide (P<.0001)
• Side effects:
• UTI: 10.8% with dapagliflozin vs. 6.4% with glipizide (actively solicited)
• Genital infection: 12.3% with dapagliflozin vs. 2.7% with glipizide (actively
solicited)
• Renal impairment: 5.9% with dapagliflozin vs. 3.4% with glipizide
Nauck MA, et al. Diabetes Care. 2011.
Randomized, double-blind, parallel-group, multicenter trial
comparing dapagliflozin to glipizide as add-on to metformin
Dapagliflozin + Insulin for 48 Weeks
Wilding J, et al. Abstract 0021-LB. ADA 2011.
• A1C reductions from baseline for PLA and DAPA 2.5, 5, and
10mg at 24 weeks were maintained at 48 weeks
– (−0.43%, −0.74%, −0.94%, −0.93%, respectively)
• 24 week body weight reductions with DAPA were maintained
at 48 weeks
– −1.5kg with DAPA 10mg vs. +0.9kg with PLA
• AEs, serious AEs, and discontinuations were balanced across
all groups
• Actively solicited s/sx suggestive of UTI and genital infections
(GI) were more with DAPA vs PLA
– UTI 7.9%-10.8% vs. 5.1%; GI 6.4%-10.7% vs. 2.5%
– most events were reported during the first 24 weeks, were of
mild/moderate intensity and responded to standard treatment
AE = Adverse events
s/sx = signs and symptoms
Dapagliflozin + Insulin for 48 Weeks:
Insulin Dose
Wilding J, et al. Abstract 0021-LB. ADA 2011.
15
10
5
0
-5
0 4 8 12 16 20 24 28 32 36 40 44 48
Timepoint (weeks)
PLA + INS
DAPA 2.5 mg + INS
DAPA 5 mg + INS
DAPA 10 mg + INS
Insulindose(IU/day)
Adjustedmeanchangefrombaseline±SE
Long-Term Efficacy of Dapagliflozin + Metformin
Week 102 Results
Adj. Mean ∆
From Baseline
PBO+MET
DAPA 2.5mg +
MET
DAPA 5mg +
MET
DAPA 10mg +
MET
A1C, % 0.02 -0.48 -0.58 -0.78
FPG, mg/dL -10.4 -19.3 -26.5 -24.5
Weight, kg -0.7 -2.2 -3.4 -2.8
% with ≥1
hypoglycemic
event
5.8 3.6 5.1 5.2
Bailey CJ, et al. Abstract 0988-P. ADA 2011.
Potential SGLT2 Safety Considerations???
• Evidence Demonstrates
• Urinary tract/genital infections
• Questions
• Hepatic toxicity?
• Breast and bladder cancer??
• Intravascular volume depletion due to osmotic diuresis??
• Nephrotoxicity (AGEs)??
• Drug-drug interactions??
• Evidence Does Not Demonstrate
• Electrolyte imbalance (Na+, K+, Ca++, PO4)
• Increased risk for hypoglycemia
• Nocturia
Dapagliflozin PDUFA Date
The FDA issued a Complete Response Letter to the makers
of dapagliflozin on January 19, 2012 requesting additional
information.
SGLT2 Inhibitors:
A New Era in Diabetes Treatment??
• In treatment-naive patients with newly-diagnosed
Type 2 DM, SGLT2 inhibitors resulted in:
• Clinically meaningful decreases in A1C and fasting
plasma glucose with no increased risk of hypoglycemia
• Also improved glycemic control in combination with a
variety of other antihyperglycemic agents
• Metformin, sulfonylureas, insulin
• Side effects generally appear to be mild and transient,
while avoiding increased risk of hypoglycemia or
weight gain

Advances in type 2 dm therapy

  • 2.
    2011 U.S DiabetesStatistics • Diabetes affects 25.8 million people in the US (8.3% of the U.S. population) – 18.8 million diagnosed, 7.0 million undiagnosed • 10.9 million (26.9%) of those aged ≥65 have diabetes • 215,000 people <20 • 79 million US adults >20 years estimated to have had prediabetes in 2010 • 7th leading cause of death in the U.S. www.cdc.gov/diabetes/pubs/pdf/ndfs_2011.pdf
  • 3.
    Percentage of U.S.Adults With Diagnosed Diabetes 1994 2000 No Data <4.5% 4.5-5.9% 6.0-7.4% 7.5-8.9% >9.0% 2009 www.cdc.gov/diabetes/statistics
  • 4.
    Cost of Diabetes •Total (direct and indirect) estimated diabetes costs in the US in 2007 = $174 billion – Medical expenses for people with diabetes are more than two times higher than for people without diabetes • A 50 year old with diabetes dies, on average, 6 years earlier than someone without diabetes Emerging Risk Factors Collaboration. NEJM. 2011; www.cdc.gov/diabetes/pubs/pdf/ndfs_2011.pdf
  • 5.
    Type 2 DiabetesPathophysiology 1Bergenstal RM, et al. Endocrinology. 2001; 2DeFronzo RA. Diabetes. 1988; 3Poitout V, et al. Endocrinology. 2002. Gluco- lipotoxicity  Production of glucose in the liver1,2 Acquired/genetic factors (obesity)1,2  FFA1-3 Type 2 DM1 Inherited/acquired factors  Glucose uptake1,2 Insulin deficiency, inappropriate glucagon secretion1,3 Insulin resistance1 Hyperglycemia1-3 FFA=free fatty acid Decreased Incretin Effect
  • 6.
    Current Therapeutic Targets DopamineAnalogs Pramlintide BRAIN PANCREAS Insulin GLP-1 Agonists DPP-4 Inhibitors Sulfonylureas Pramlintide (α cells only) Meglitinides LIVER Metformin Thiazolidinediones (TZD) GI TRACT GLP-1 Agonists Alpha Glucosidase Inhibitors MUSCLE/FAT Metformin Thiazolidinediones (TZD) ?? KIDNEY ??
  • 7.
    Updated ADA/EASD ConsensusAlgorithm Nathan DM, et al. Diabetes Care. 2009. At Diagnosis: Lifestyle + Metformin Lifestyle + Metformin + Sulfonylurea Lifestyle + Metformin + Basal Insulin Lifestyle + Metformin + Intensive Insulin Lifestyle + Metformin + Pioglitazone No hypoglycemia, edema/CHF, bone loss Lifestyle + Metformin + GLP-1 agonist No hypoglycemia, weight loss, nausea/vomiting Lifestyle + Metformin + Basal Insulin Lifestyle + Metformin + Pioglitazone + Sulfonylurea STEP 1 STEP 2 STEP 3 Tier 2: Less well-validated therapies Tier 1: Well-validated therapies
  • 8.
    AACE/ACE DIABETES ALGORITHM FORGLYCEMIC CONTROL American Association of Clinical Endocrinologists. AACE/ACE Diabetes Algorithm for Glycemic Control. Available at https://www.aace.com/publications.
  • 9.
    Risks of CurrentTherapies: Weight Gain Met- formin DPP-4 Inhib- itor GLP-1 Agonist SU Glinide TZD AGI Insulin Pram- lintide Weight Gain Met- formin DPP-4 Inhib- itor GLP-1 Agonist SU Glinide TZD AGI Insulin Pram- lintide Hypoglycemia Neutral Benefits Causes
  • 10.
    The Kidneys Playan Important Role in the Handling of Glucose Wright EM, et al. J Intern Med. 2007. • Total glucose stored in body ~450 g • Glucose utilization ~250 g/day • Brain ~125 g/day • Rest of body ~125 g/day • Glucose in Western diet ~180 g/day • Renal glucose production (gluconeogenesis + ~70 g/day glycogenolysis) • Renal glucose filtration and reabsorption ~180 g/day • Urinary glucose 0 g
  • 11.
    Sodium-Glucose Cotransporters SGLT1 SGLT2 SiteMostly intestine with some kidney Almost exclusively kidney Sugar specificity Glucose or galactose Glucose Affinity for glucose High Km = 0.4 Mm Low Km = 2 Mm Capacity for glucose transport Low High Role Dietary glucose absorption Renal glucose reabsorption Renal glucose reabsorption Lee YJ, et al. Kidney Int Suppl. 2007.
  • 12.
    Altered Renal GlucoseControl in Diabetes • Renal gluconeogenesis is increased in patients with Type 2 DM • Renal contribution to hyperglycemia • 3-fold increase relative to patients without diabetes • Glucose reabsorption • Increased SGLT2 expression and activity in renal epithelial cells from patients with diabetes vs. normoglycemic individuals Marsenic O. Am J Kidney Dis. 2009; Bakris GL, et al. Kidney Int. 2009; Rahmoune H, et al. Diabetes. 2005.
  • 13.
    Rationale for SGLT2Inhibitors • The SGLT2 is a glucose transporter responsible for 90% of glucose reabsorption • Selective SGLT2 inhibitors could reduce blood glucose levels due to increased renal excretion of glucose • Mutations in the SGLT2 transporter linked to hereditary renal glycosuria, a relatively benign condition in humans • Selective SGLT2 inhibition would cause urine loss of the calories from glucose (200-300 kcal/day), also potentially leading to weight loss Brooks AM, Thacker SM. Ann Pharmacother. 2009; Nair S, et al. J Clin Endocrinol Metab. 2010.
  • 14.
    Effects of SGLT2Inhibitors Inhibition of renal tubular Na+-glucose cotransporter Reversal of hyperglycemia Reduction of “glucotoxicity” Insulin sensitivity in muscle and liver Gluconeogenesis Improved beta cell function Brooks AM, Thacker SM. Ann Pharmacother. 2009; Nair S, et al. J Clin Endocrinol Metab. 2010.
  • 15.
    SGLT2 Inhibitors in Phase3 Development • Dapagliflozin • Canagliflozin • Empagliflozin • Ipragliflozin • Tofogliflozin
  • 16.
    Empagliflozin: Change inA1C N = 408 Baseline A1C = 7.9% *P<.001 vs. placebo †500 mg BID for four weeks, then 1000 mg BID or the maximum tolerated dose -0.8 -0.6 -0.4 -0.2 0 0.2 * * * * 5 mg 25 mg10 mg Metformin Placebo ChangeinA1C(%) Ferrannini E, et al. Abstract 877. EASD 2010. Randomized, double-blind, 12 week trial comparing empagliflozin and open-label metformin†
  • 17.
    Empagliflozin: Change inFPG N = 408 *P<.001 vs. placebo †500 mg BID for four weeks, then 1000 mg BID or the maximum tolerated dose Ferrannini E, et al. Abstract 877. EASD 2010. -35 -30 -25 -20 -15 -10 -5 0 5 * ** * Placebo 5 mg 10 mg 25 mg Metformin ChangeinFPG(mg/dl) Randomized, double-blind, 12 week trial comparing empagliflozin and open-label metformin†
  • 18.
    Empagliflozin: Change inWeight * N = 408 Baseline BMI = 29 kg/m2 *P<.001 vs. placebo †500 mg BID for four weeks, then 1000 mg BID or the maximum tolerated dose Ferrannini E, et al. Abstract 877. EASD 2010. -2.5 -2 -1.5 -1 -0.5 0 * * * Placebo 5 mg 10 mg 25 mg Metformin Changeinweight(%) Randomized, double-blind, 12 week trial comparing empagliflozin and open-label metformin†
  • 19.
    Empagliflozin: Safety Considerations Sideeffects: – Polyuria (3.3% vs. 0% in placebo), thirst (3.3% vs. 0% in placebo), and nasopharyngitis (2% vs. 1.2% in placebo) were the most frequently reported side effects – UTI 1.2% vs. 1.2% in placebo and 1.3% in metformin Ferrannini E, et al. Abstract 877. EASD 2010. Randomized, double-blind, 12 week trial comparing empagliflozin and open-label metformin†
  • 20.
    Canagliflozin: Change inA1C *P<.001 vs. placebo calculated using LS means Rosenstock J, et al. Abstract 77-OR. ADA 2010. N = 451 -0.22% -0.79% -0.76% -0.7% -0.92% -0.95% -0.74 -1 -0.8 -0.6 -0.4 -0.2 0 PBO 50 mg 100 mg 200 mg 300 mg 300 mg BID SITA 100 mg ChangeinA1C(%) * ** * Mean Baseline A1C (%) 7.71 8.01 7.81 7.57 7.70 7.71 7.62 * * Canagliflozin add-on to metformin, double-blind, placebo- controlled, dose-ranging study (Phase 2)
  • 21.
    Canagliflozin: Change inFPGChangeinFPG(mg/dl) Rosenstock J, et al. Abstract 77-OR. ADA 2010. N = 451 Baseline FGP 162 mg/dl) *P<.001 vs. placebo calculated using LS means -16.2 -25.2 -32.4 -32.4 -30.6 -18 -35 -30 -25 -20 -15 -10 -5 0 50 mg 100 mg 200 mg 300 mg 300 mg BID SITA 100 mg * * * * * * Canagliflozin add-on to metformin, double-blind, placebo- controlled, dose-ranging study (Phase 2)
  • 22.
    Canagliflozin: Change inWeight N = 451 Baseline weight 87 kg *P<.01 vs. placebo calculated using LS means Rosenstock J, et al. Abstract 77-OR. ADA 2010. -1.1 -2.3% -2.6% -2.7% -3.4% -3.4% -0.6% -4 -3 -2 -1 0 PBO 50 mg 100 mg 200 mg 300 mg 300 mg BID SITA 100 mg Changeinweight(%) Mean Baseline Weight (kg) 85.5 87.5 87.7 87.7 87.8 86.3 87 * * * * * Canagliflozin add-on to metformin, double-blind, placebo- controlled, dose-ranging study (Phase 2)
  • 23.
    Canagliflozin: Safety Considerations Sideeffects: – Mild-to-moderate, transient – Non dose-dependent increase in symptomatic genital infections: 3-8% in canagliflozin vs. 2% in placebo and 2% in sitagliptin – UTI: 3-9% in canagliflozin (no dose-dependency) vs. 6% in placebo and 2% in sitagliptin – Hypoglycemia: 0-6% in canagliflozin (no dose dependency) vs. 2% in placebo and 5% in sitagliptin Rosenstock J, et al. Abstract 77-OR. ADA 2010. Canagliflozin add-on to metformin, double-blind, placebo- controlled, dose-ranging study (Phase 2)
  • 24.
    Effects of Canagliflozinon Vulvovaginal Candida Colonization (VCC) – Relative to PBO/SITA, CANA treatment increased conversion to positive vaginal Candida culture and VVC events – Incidence of VVC in female subjects was 2.9% and 3.7% with PBO and SITA, respectively, and 10.4% with CANA – None of the VVC events were serious or led to discontinuation; most were treated with topical or oral antifungals, and resolved without study drug interruption Nyirjesy P, et al. Abstract 0032-LB. ADA 2011.
  • 25.
    Bacteria or UTIIncidence with Canagliflozin – At Week 12, CANA decreased A1C (0.45%-0.73% relative to PBO), lowered weight (1.3%-2.3% relative to PBO), and increased urinary glucose excretion (UGE) (35.4-61.6 mg/mg creatinine) – Conversion from negative baseline urine bacterial culture to positive culture did not differ in pooled CANA group vs pooled PBO/SITA group (4.8% vs. 3.7%, respectively) – UTI AEs (both symptomatic and positive post-baseline urine culture reported as a UTI) occurred in 16 (5.0%) in pooled CANA group and 5 (3.8%) in pooled PBO/SITA group – All UTI AEs considered mild or moderate, and none led to discontinuation Nicolle L, et al. Abstract 0043-LB. ADA 2011.
  • 26.
    Dapagliflozin Phase 3Studies: Change in A1C -1 -0.9 -0.8 -0.7 -0.6 -0.5 -0.4 -0.3 -0.2 -0.1 0 Monotherapy Met add-on SU add-on Insulin add-on ChangeinA1C(%) Placebo Dapa 2.5mg Dapa 5mg Dapa 10mg Wilding JPH, et al. Abstract 871. EASD 2010; Strojek K, et al. Abstract 870. EASD 2010; Ferrannini E, et al. Diabetes Care. 2010; Bailey CJ, et al. Lancet. 2010. Baseline- Monotherapy (N=591): 8.6% Met add-on (N=546): 8% SU add-on (N=597): 8.1% Insulin add-on (N=808): 8.5%
  • 27.
    ChangeinFPG(mg/dl) Placebo Dapa 2.5mg Dapa 5mg Dapa 10mg Baseline- Monotherapy (N=591): 179mg/dl Met add-on (N=546): 163.9 mg/dl Insulin add-on (N=808): 178 mg/dl Wilding JPH, et al. Abstract 871. EASD 2010; Ferrannini E, et al. Diabetes Care. 2010; Bailey CJ, et al. Lancet. 2010. Dapagliflozin Phase 3 Studies: Change in FPG -35 -30 -25 -20 -15 -10 -5 0 5 Monotherapy Met add-on Insulin add-on
  • 28.
    -3.5 -3 -2.5 -2 -1.5 -1 -0.5 0 0.5 Monotherapy Met add-on SU add-on Insulinadd-on Changeinweight(kg) Placebo Dapa 2.5mg Dapa 5mg Dapa 10mg Baseline- Monotherapy (N=591): 89.7 kg Met add-on (N=546): 85.9 kg SU add-on (N=597): 81.1 kg Insulin add-on (N=808): 94 kg Wilding JPH, et al. Abstract 871. EASD 2010; Strojek K, et al. Abstract 870. EASD 2010; Ferrannini E, et al. Diabetes Care. 2010; Bailey CJ, et al. Lancet. 2010. Dapagliflozin Phase 3 Studies: Change in Weight
  • 29.
    Dapagliflozin, Metformin XR,or Both as Initial Therapy -3 -2 -1 0 -80 -60 -40 -20 0 -4 -3 -2 -1 0 M E T D A P A 5 m g D A P A + M E T D A P A + M E T D A P A 1 0 m g M E T M E T D A P A 5 m g D A P A + M E T D A P A + M E T D A P A 1 0 m g M E T M E T D A P A 5 m g D A P A + M E T D A P A + M E T D A P A 1 0 m g M E T Change in A1C Change in FPG Change in Body Weight Henry R, et al. Abstract 307-OR. ADA 2011.
  • 30.
    Dapagliflozin: Effect onBP and Lipids HDL (% change) – Placebo: +0.4 – Dapa 2.5mg: +1.8 – Dapa 5mg: +3.3 – Dapa 10mg: +4.4 Triglycerides (% change) – Placebo: +2.1 – Dapa 2.5mg: -2.4 – Dapa 5mg: -6.2 – Dapa 10mg: -6.2 Systolic Blood Pressure (mmHg) – Placebo: -0.2 – Dapa 2.5mg: -2.1 – Dapa 5mg: -4.3 – Dapa 10mg: -5.1 Diastolic Blood Pressure (mmHg) – Placebo: -0.1 – Dapa 2.5mg: -1.8 – Dapa 5mg: -2.5 – Dapa 10mg: -1.8 Bailey CJ, et al. Lancet. 2010.
  • 31.
    Dapagliflozin: Safety Considerations Basedon all trials (Monotherapy, metformin add-on, sulfonylurea add-on, and insulin add-on) Side effects: – UTI*: 3.9-13.2% in dapagliflozin vs. 4-6.2% in placebo1-3 – Genital infections*: 3.9-12.9% in dapagliflozin vs. 0.7-5% in placebo1-4 – Hypoglycemia: 0-7.9% in dapagliflozin vs. 2.7-4.8% in placebo2-4 *Most occurred during the first 24 weeks, were generally mild, and responded to routine management 1Wilding JPH, et al. Abstract 871. EASD 2010; 2Strojek K, et al. Abstract 870. EASD 2010; 3Ferrannini E, et al. Diabetes Care. 2010; 4Bailey CJ, et al. Lancet. 2010.
  • 32.
    Dapagliflozin: Sulfonylurea Comparator Study Results •Average A1C: 7.72% • Change in A1C: -0.52% for dapagliflozin vs. -0.52% for glipizide • Weight change: -3.2 kg for dapagliflozin vs. +1.4 kg for glipizide • Hypoglycemic episodes: 3.5% for dapagliflozin vs. 40.8% with glipizide • Significant reductions in diastolic and systolic blood pressure and improvement in HDL with dapagliflozin vs. glipizide (P<.0001) • Side effects: • UTI: 10.8% with dapagliflozin vs. 6.4% with glipizide (actively solicited) • Genital infection: 12.3% with dapagliflozin vs. 2.7% with glipizide (actively solicited) • Renal impairment: 5.9% with dapagliflozin vs. 3.4% with glipizide Nauck MA, et al. Diabetes Care. 2011. Randomized, double-blind, parallel-group, multicenter trial comparing dapagliflozin to glipizide as add-on to metformin
  • 33.
    Dapagliflozin + Insulinfor 48 Weeks Wilding J, et al. Abstract 0021-LB. ADA 2011. • A1C reductions from baseline for PLA and DAPA 2.5, 5, and 10mg at 24 weeks were maintained at 48 weeks – (−0.43%, −0.74%, −0.94%, −0.93%, respectively) • 24 week body weight reductions with DAPA were maintained at 48 weeks – −1.5kg with DAPA 10mg vs. +0.9kg with PLA • AEs, serious AEs, and discontinuations were balanced across all groups • Actively solicited s/sx suggestive of UTI and genital infections (GI) were more with DAPA vs PLA – UTI 7.9%-10.8% vs. 5.1%; GI 6.4%-10.7% vs. 2.5% – most events were reported during the first 24 weeks, were of mild/moderate intensity and responded to standard treatment AE = Adverse events s/sx = signs and symptoms
  • 34.
    Dapagliflozin + Insulinfor 48 Weeks: Insulin Dose Wilding J, et al. Abstract 0021-LB. ADA 2011. 15 10 5 0 -5 0 4 8 12 16 20 24 28 32 36 40 44 48 Timepoint (weeks) PLA + INS DAPA 2.5 mg + INS DAPA 5 mg + INS DAPA 10 mg + INS Insulindose(IU/day) Adjustedmeanchangefrombaseline±SE
  • 35.
    Long-Term Efficacy ofDapagliflozin + Metformin Week 102 Results Adj. Mean ∆ From Baseline PBO+MET DAPA 2.5mg + MET DAPA 5mg + MET DAPA 10mg + MET A1C, % 0.02 -0.48 -0.58 -0.78 FPG, mg/dL -10.4 -19.3 -26.5 -24.5 Weight, kg -0.7 -2.2 -3.4 -2.8 % with ≥1 hypoglycemic event 5.8 3.6 5.1 5.2 Bailey CJ, et al. Abstract 0988-P. ADA 2011.
  • 36.
    Potential SGLT2 SafetyConsiderations??? • Evidence Demonstrates • Urinary tract/genital infections • Questions • Hepatic toxicity? • Breast and bladder cancer?? • Intravascular volume depletion due to osmotic diuresis?? • Nephrotoxicity (AGEs)?? • Drug-drug interactions?? • Evidence Does Not Demonstrate • Electrolyte imbalance (Na+, K+, Ca++, PO4) • Increased risk for hypoglycemia • Nocturia
  • 37.
    Dapagliflozin PDUFA Date TheFDA issued a Complete Response Letter to the makers of dapagliflozin on January 19, 2012 requesting additional information.
  • 38.
    SGLT2 Inhibitors: A NewEra in Diabetes Treatment?? • In treatment-naive patients with newly-diagnosed Type 2 DM, SGLT2 inhibitors resulted in: • Clinically meaningful decreases in A1C and fasting plasma glucose with no increased risk of hypoglycemia • Also improved glycemic control in combination with a variety of other antihyperglycemic agents • Metformin, sulfonylureas, insulin • Side effects generally appear to be mild and transient, while avoiding increased risk of hypoglycemia or weight gain