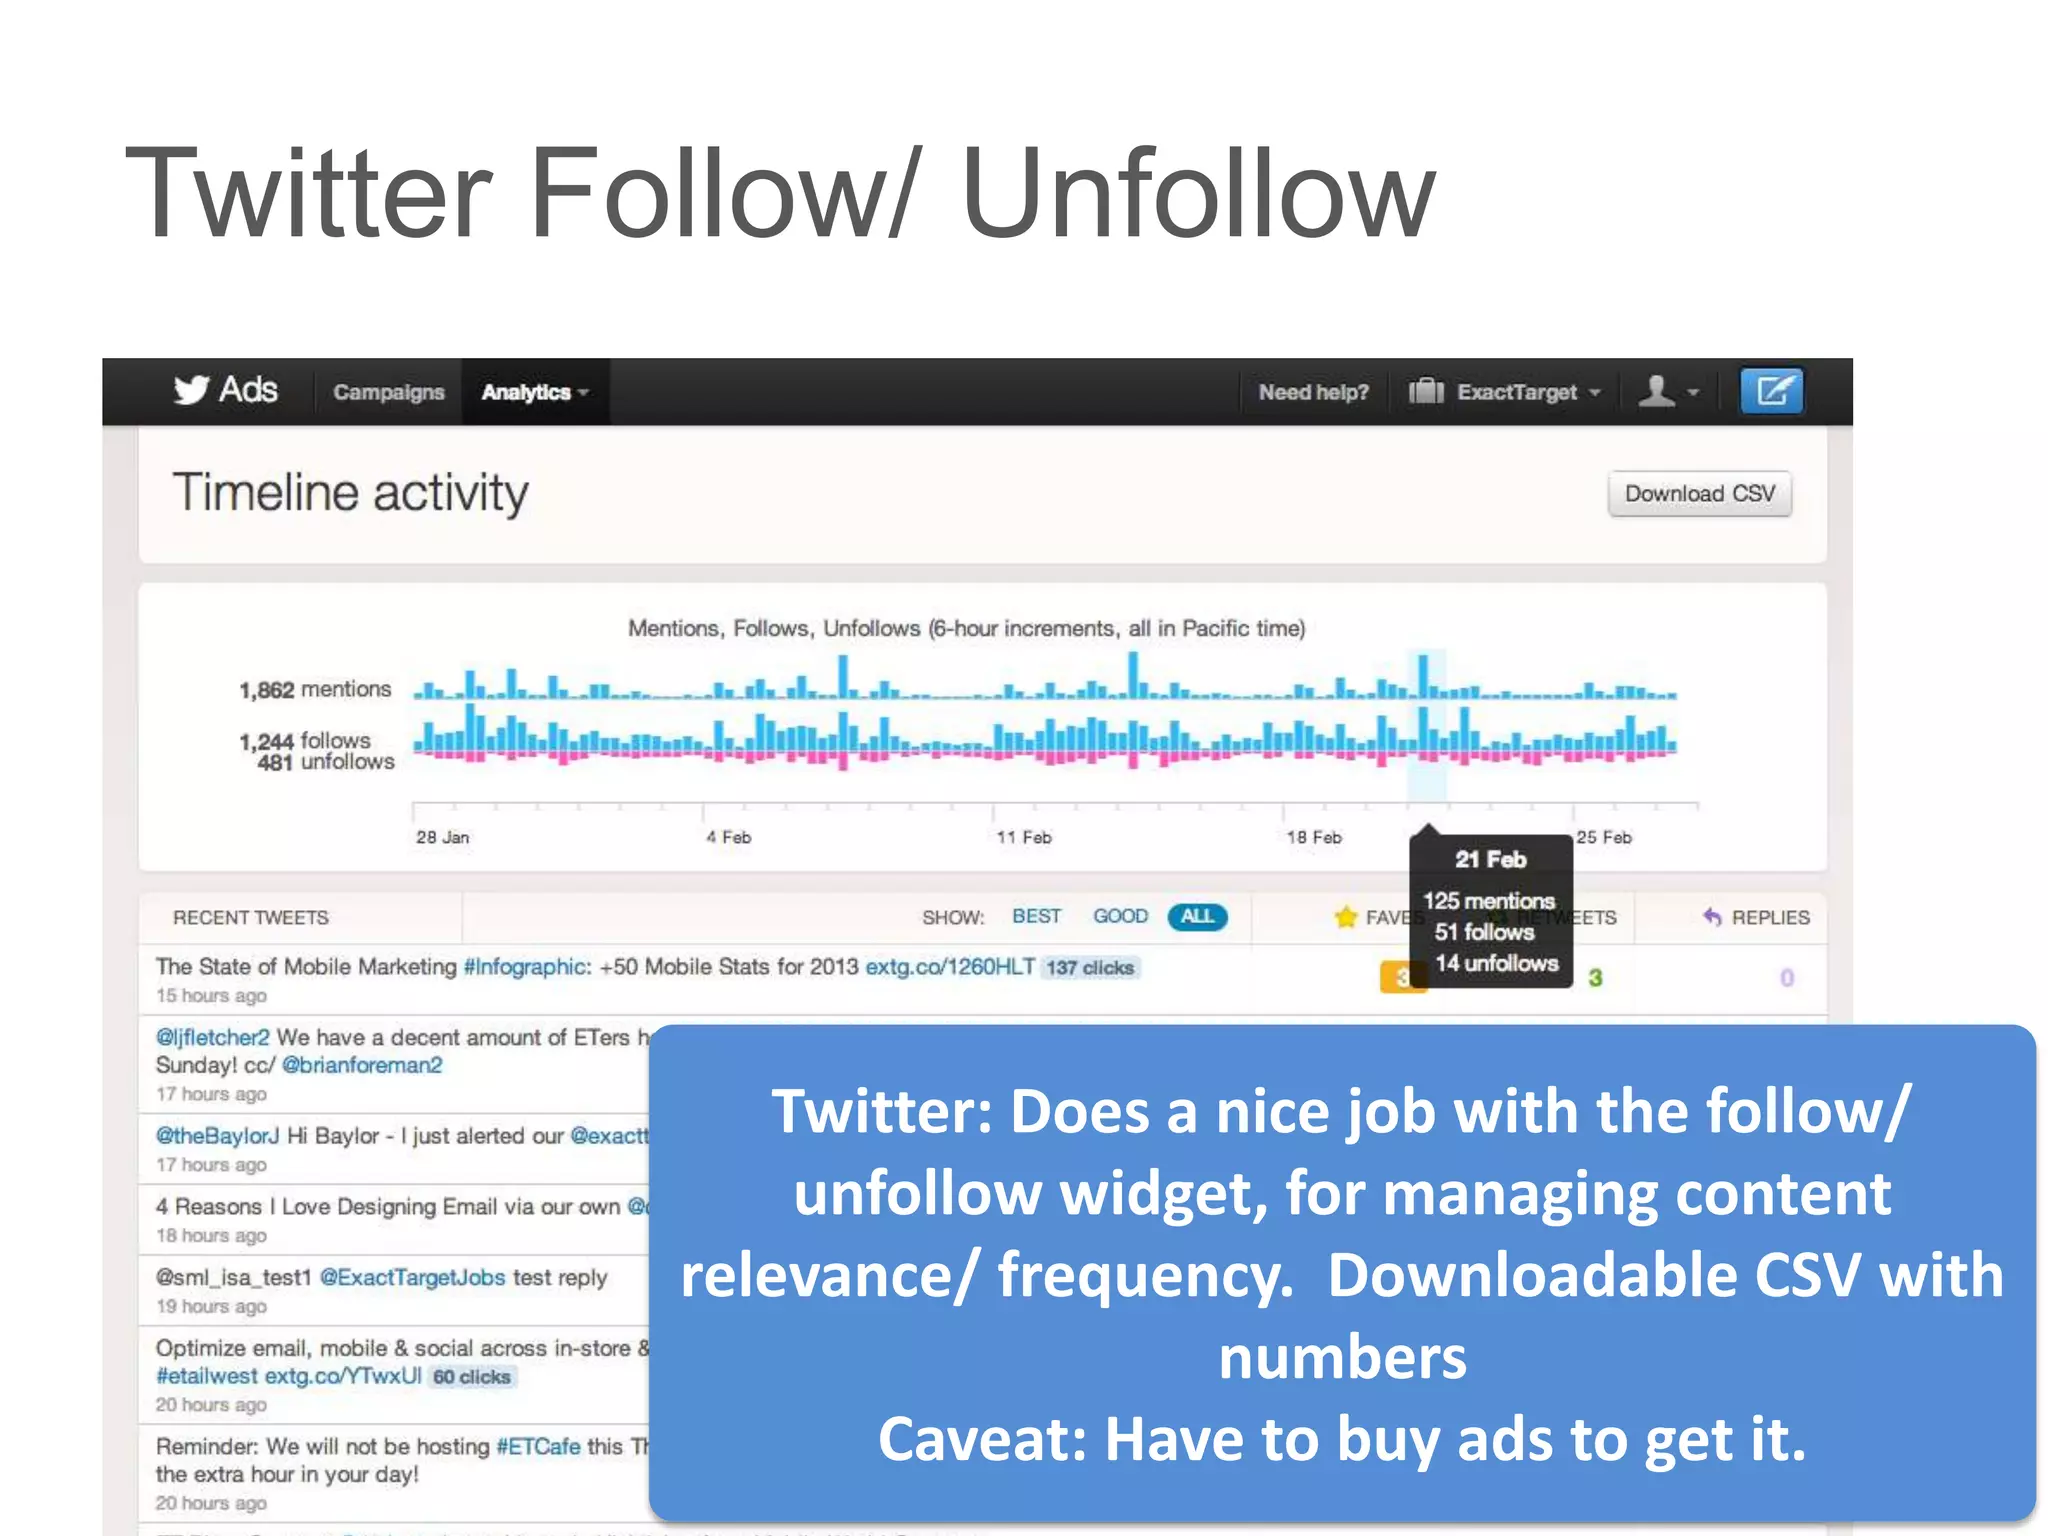
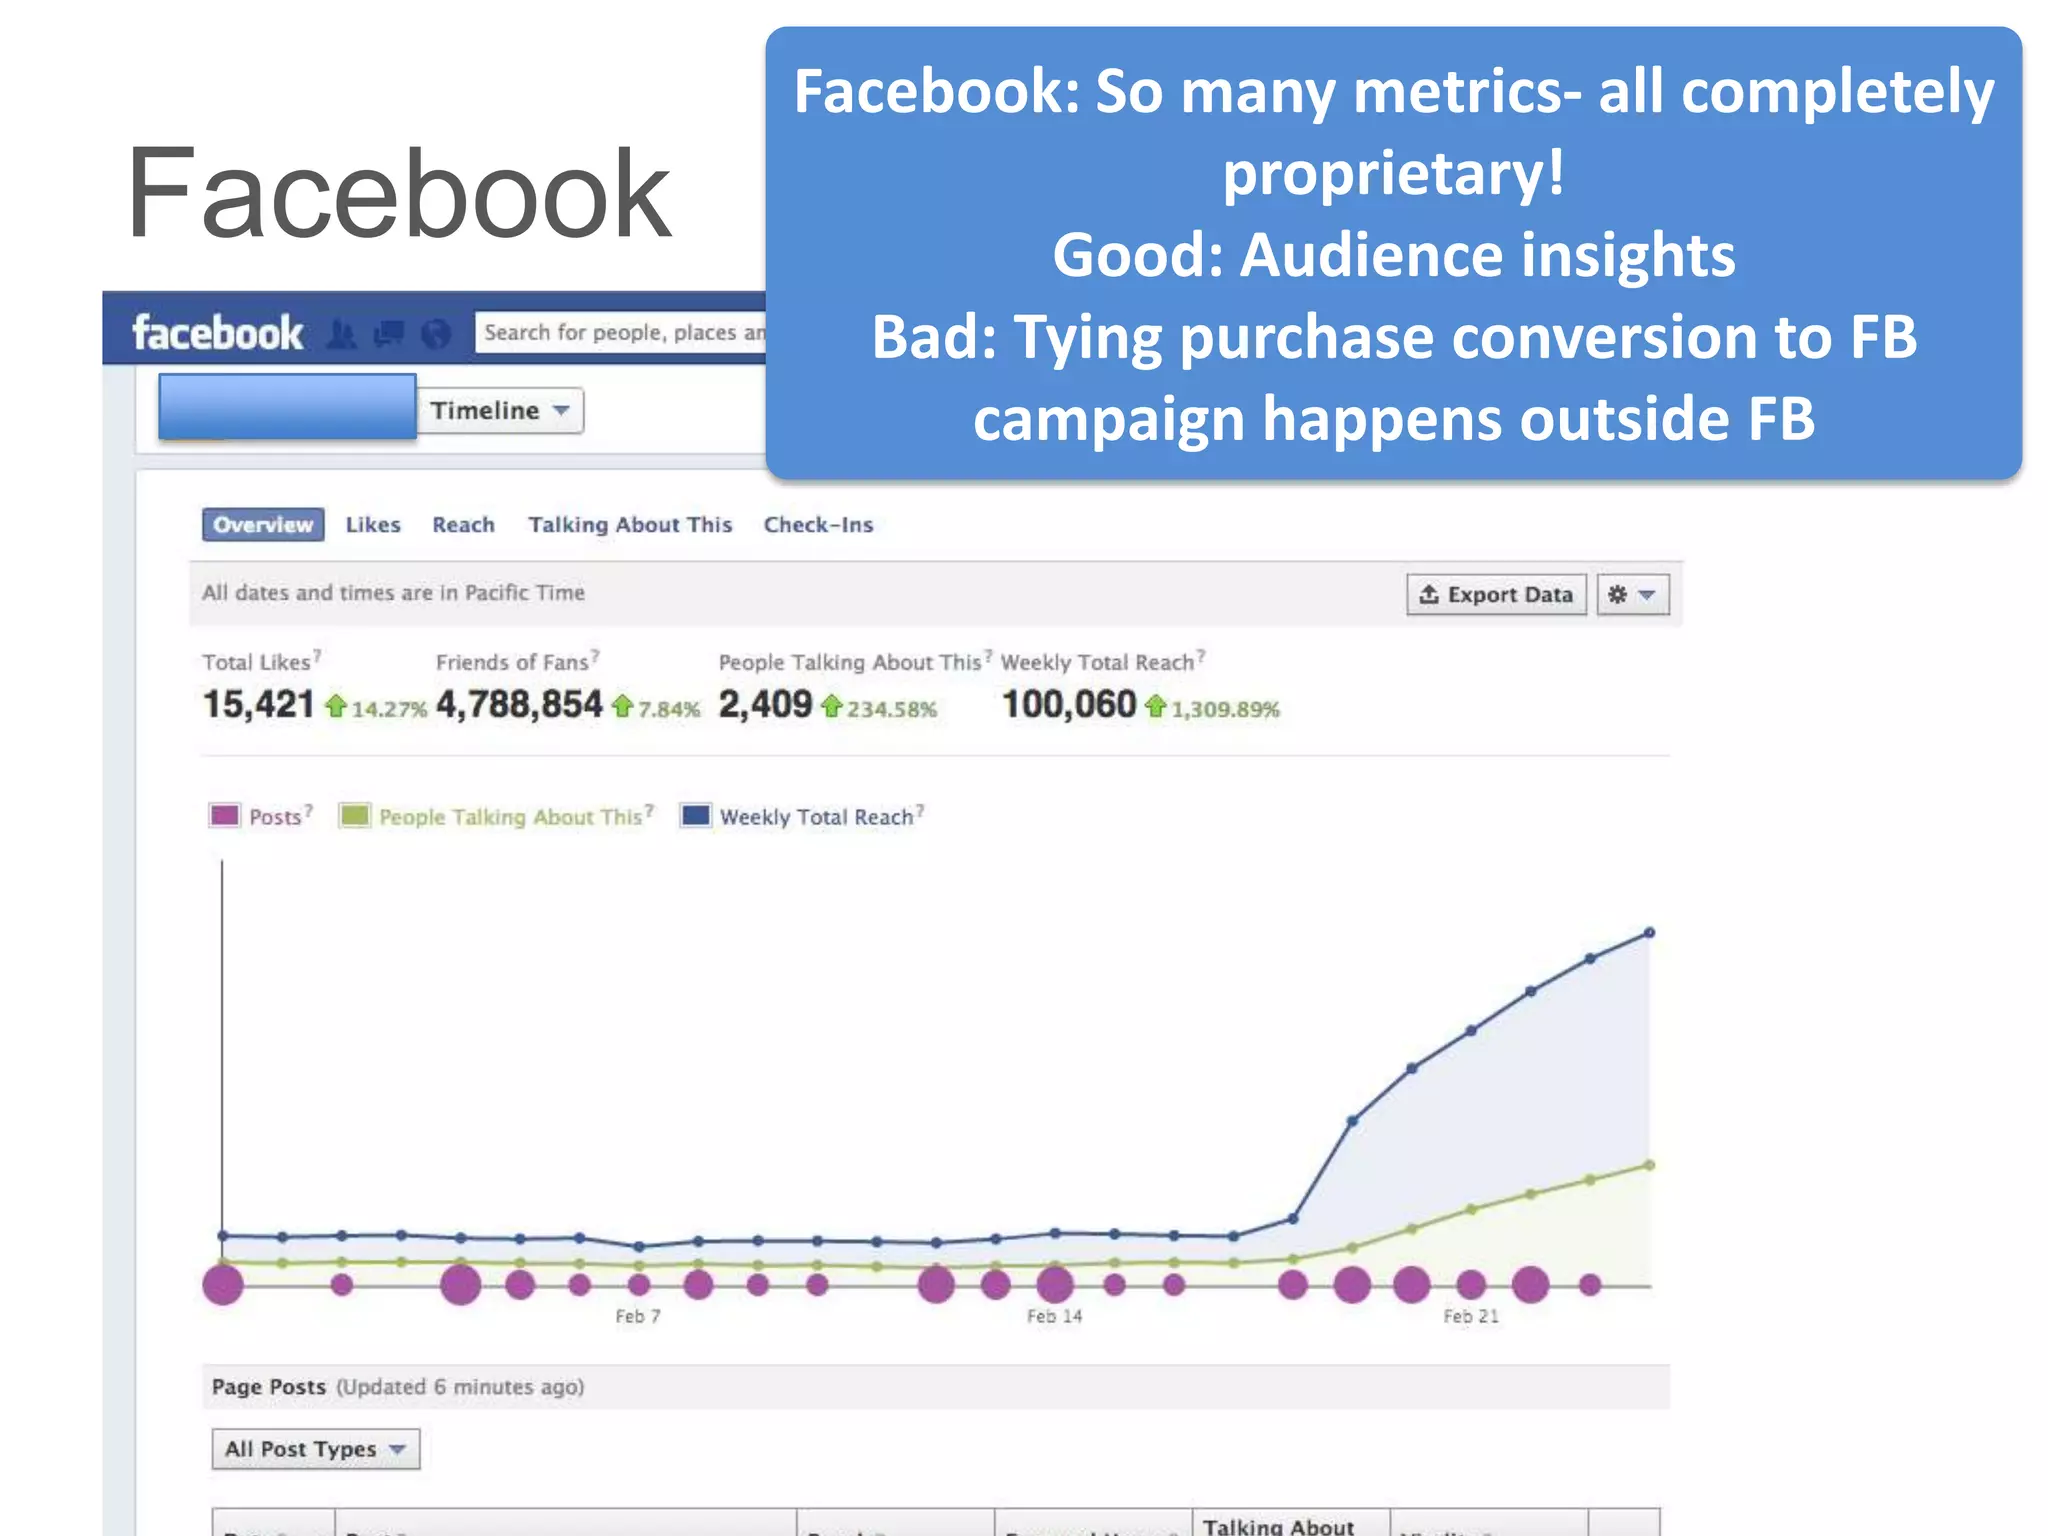
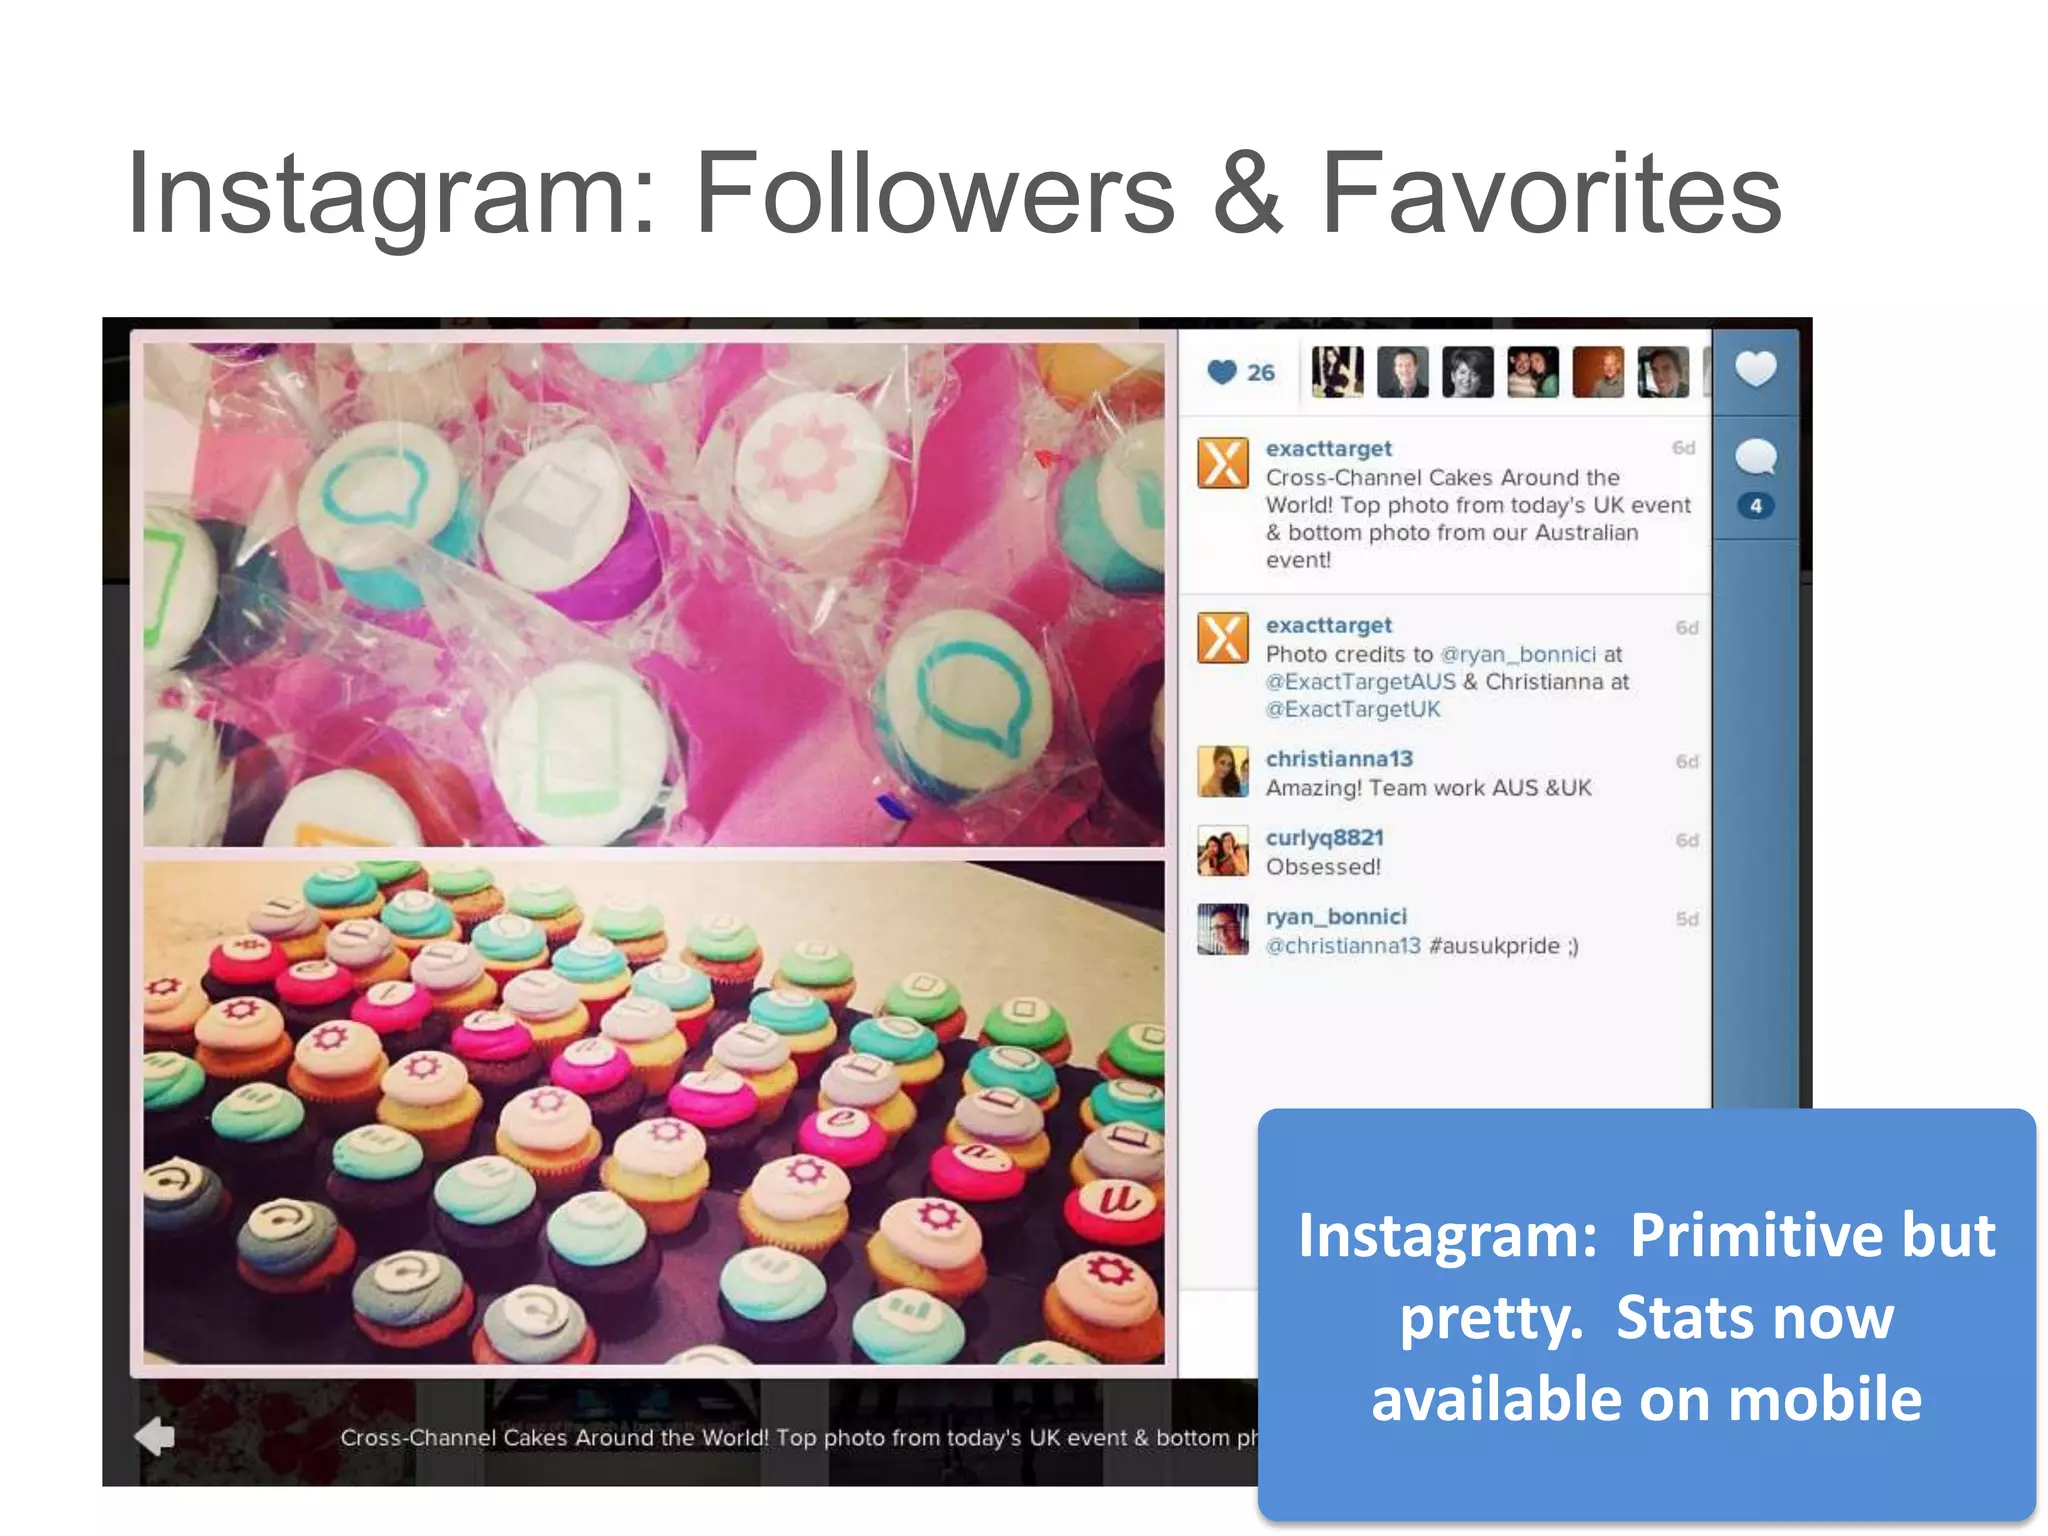
Social Media Analytics Workshop
 #SXSW 2013
 #leansocial #socialmeasure


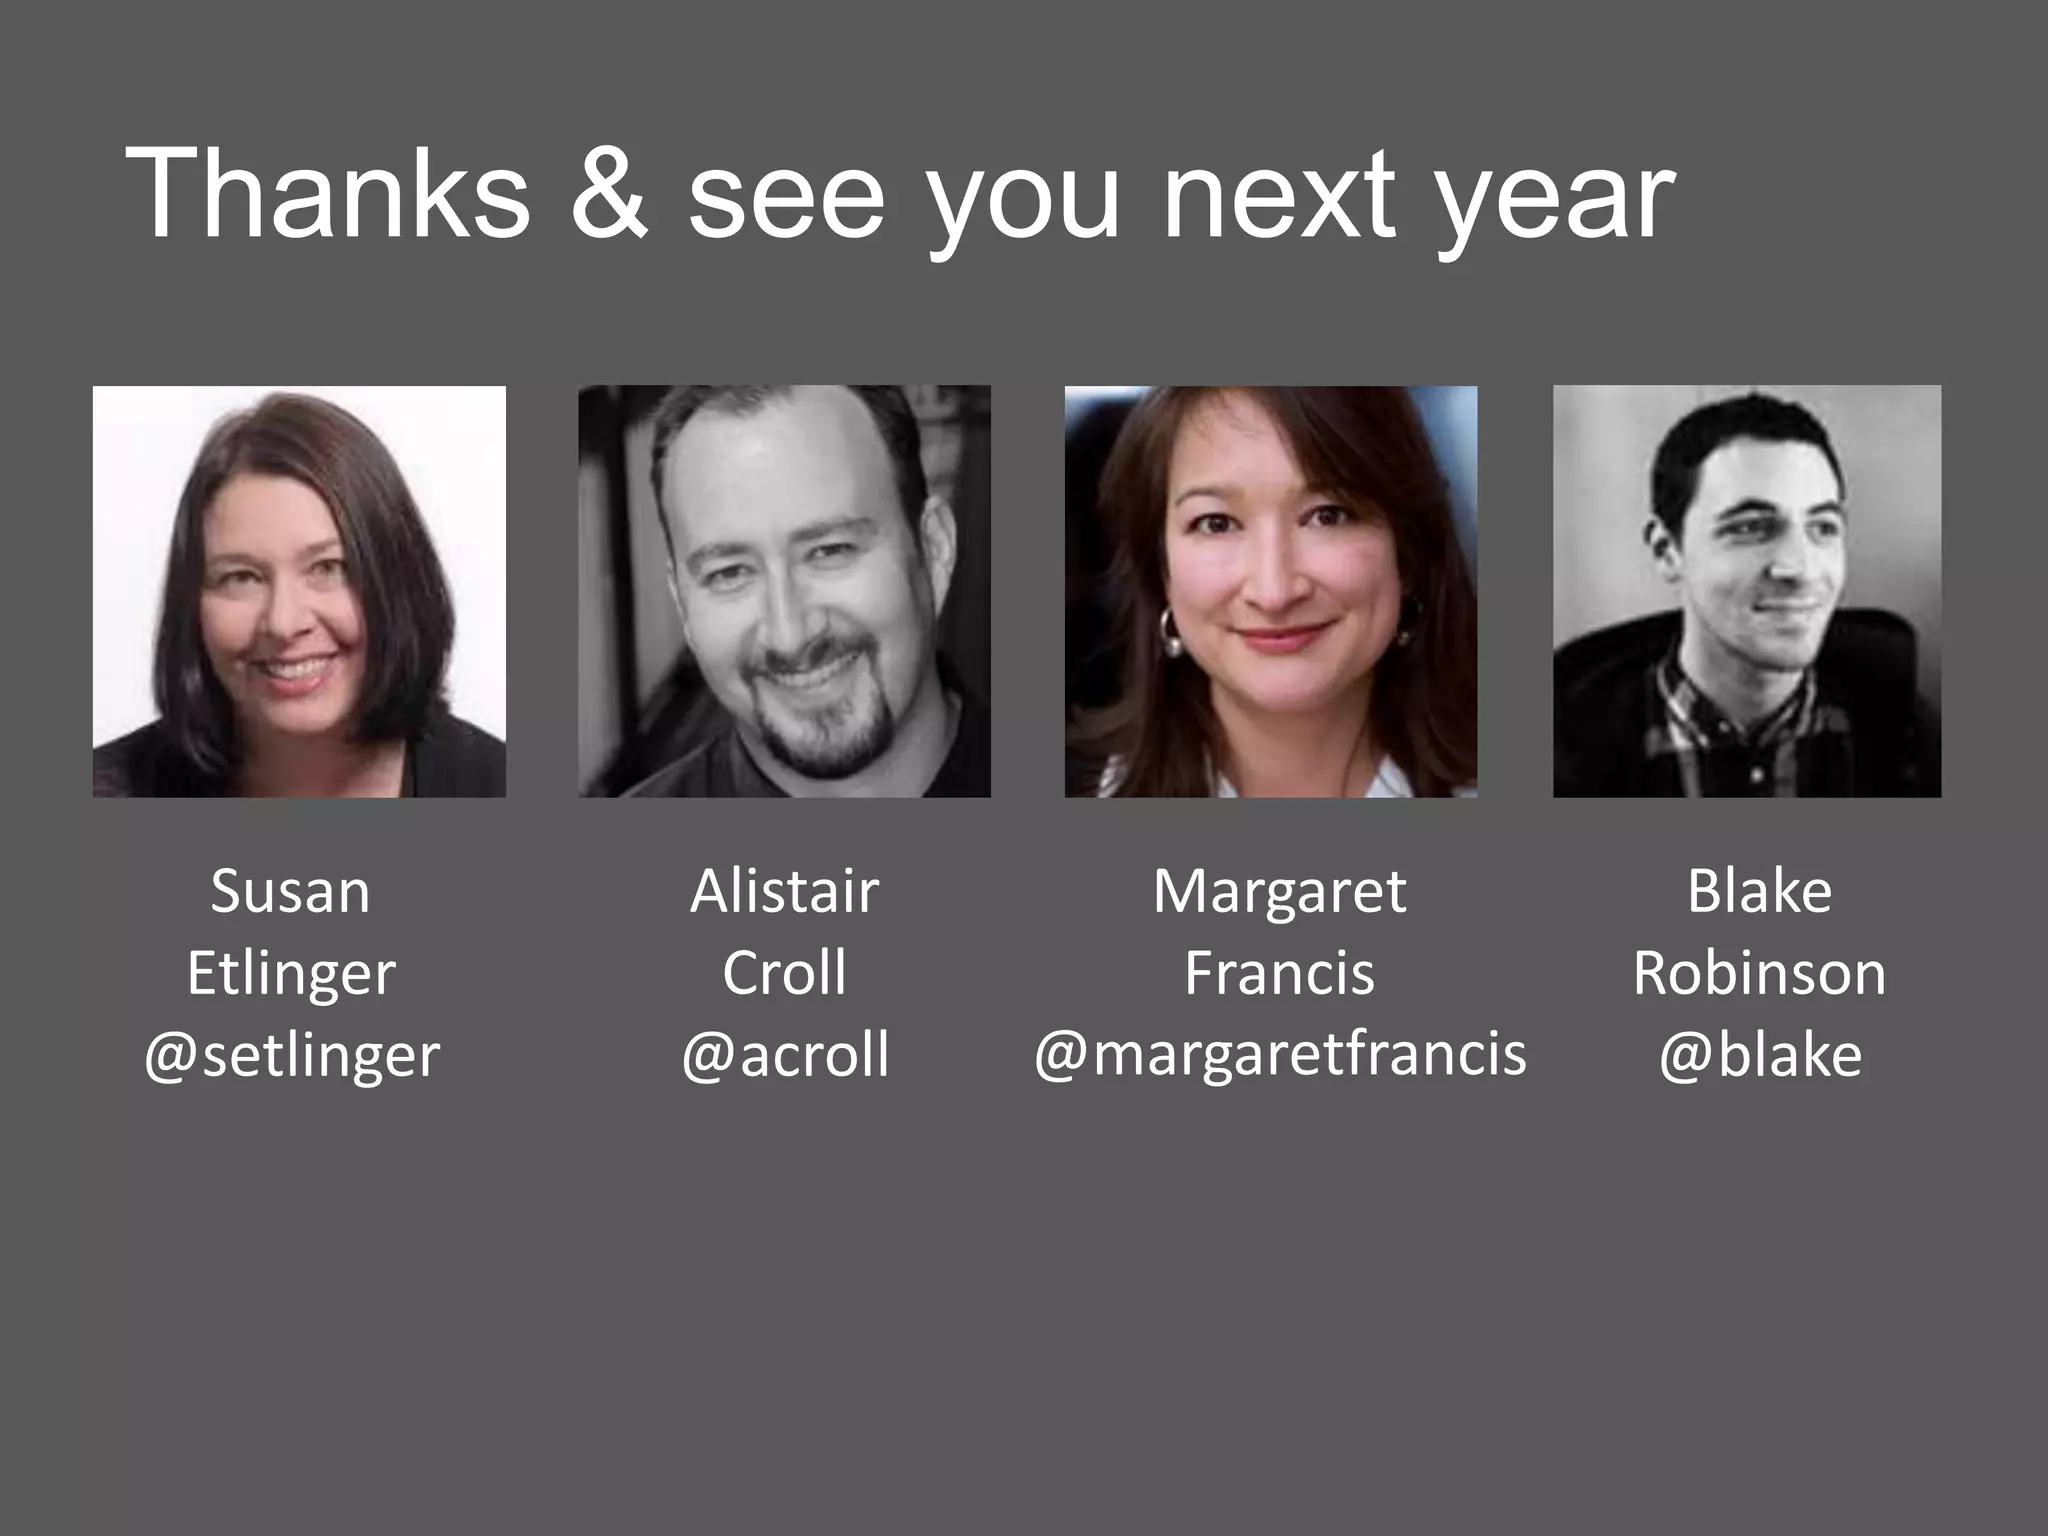
  Susan      Alistair     Margaret           Blake
 Etlinger     Croll        Francis         Robinson
@setlinger   @acroll    @margaretfrancis    @blake
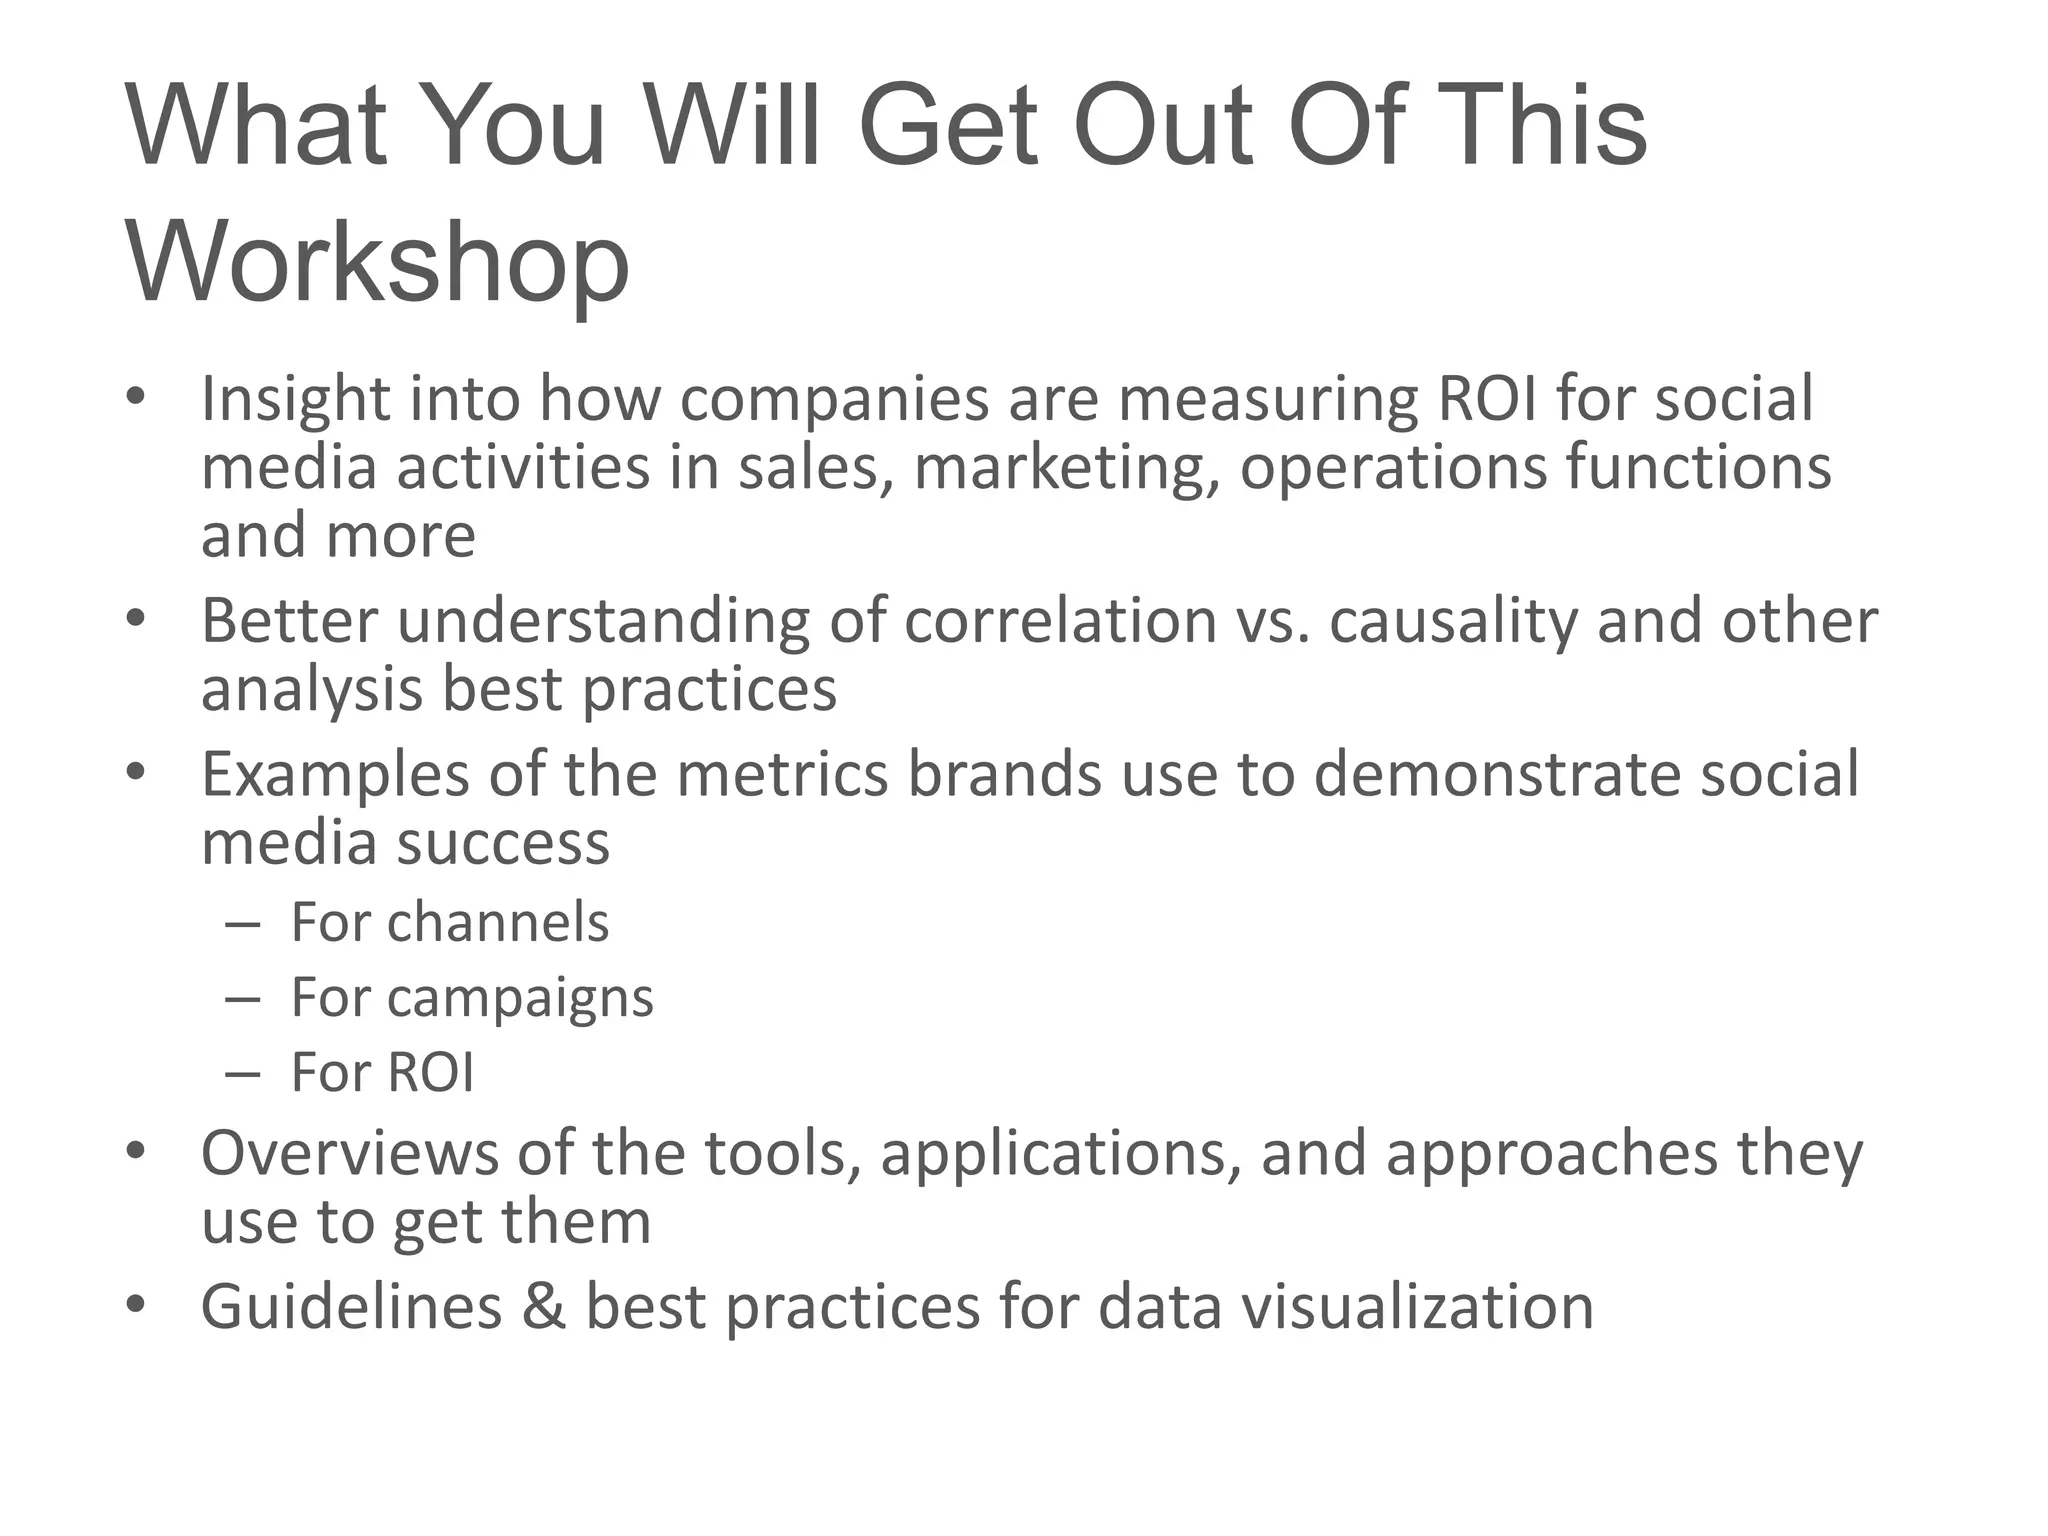
What You Will Get Out Of This
Workshop
• Insight into how companies are measuring ROI for social
  media activities in sales, marketing, operations functions
  and more
• Better understanding of correlation vs. causality and other
  analysis best practices
• Examples of the metrics brands use to demonstrate social
  media success
   – For channels
   – For campaigns
   – For ROI
• Overviews of the tools, applications, and approaches they
  use to get them
• Guidelines & best practices for data visualization
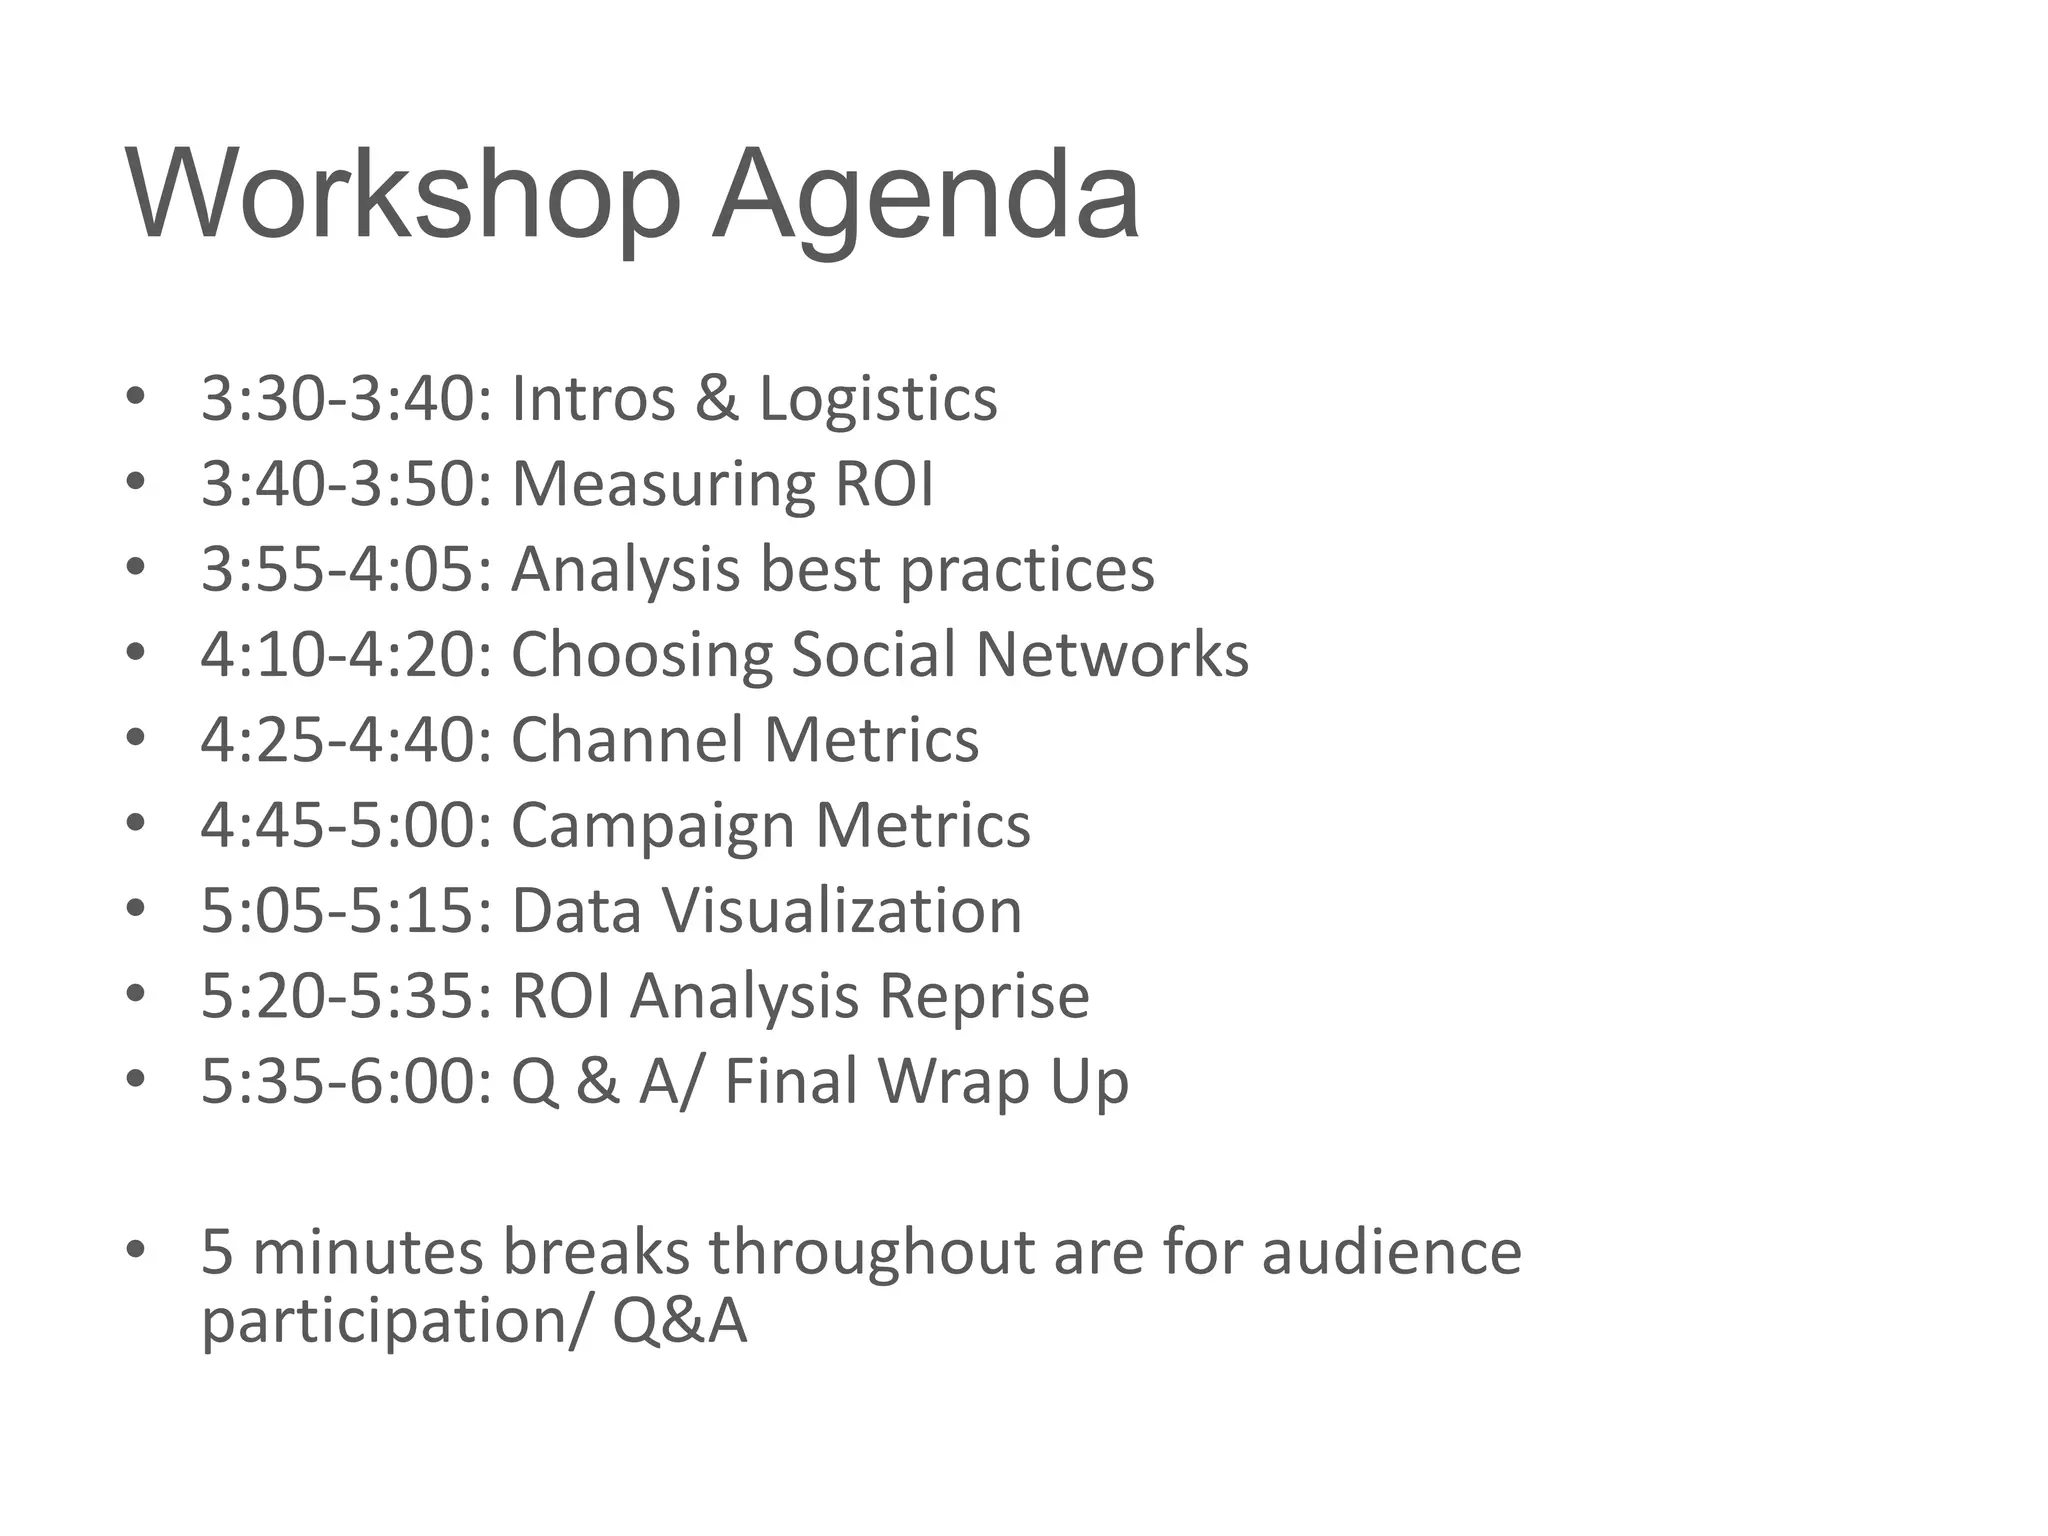
Workshop Agenda
•   3:30-3:40: Intros & Logistics
•   3:40-3:50: Measuring ROI
•   3:55-4:05: Analysis best practices
•   4:10-4:20: Choosing Social Networks
•   4:25-4:40: Channel Metrics
•   4:45-5:00: Campaign Metrics
•   5:05-5:15: Data Visualization
•   5:20-5:35: ROI Analysis Reprise
•   5:35-6:00: Q & A/ Final Wrap Up

• 5 minutes breaks throughout are for audience
  participation/ Q&A
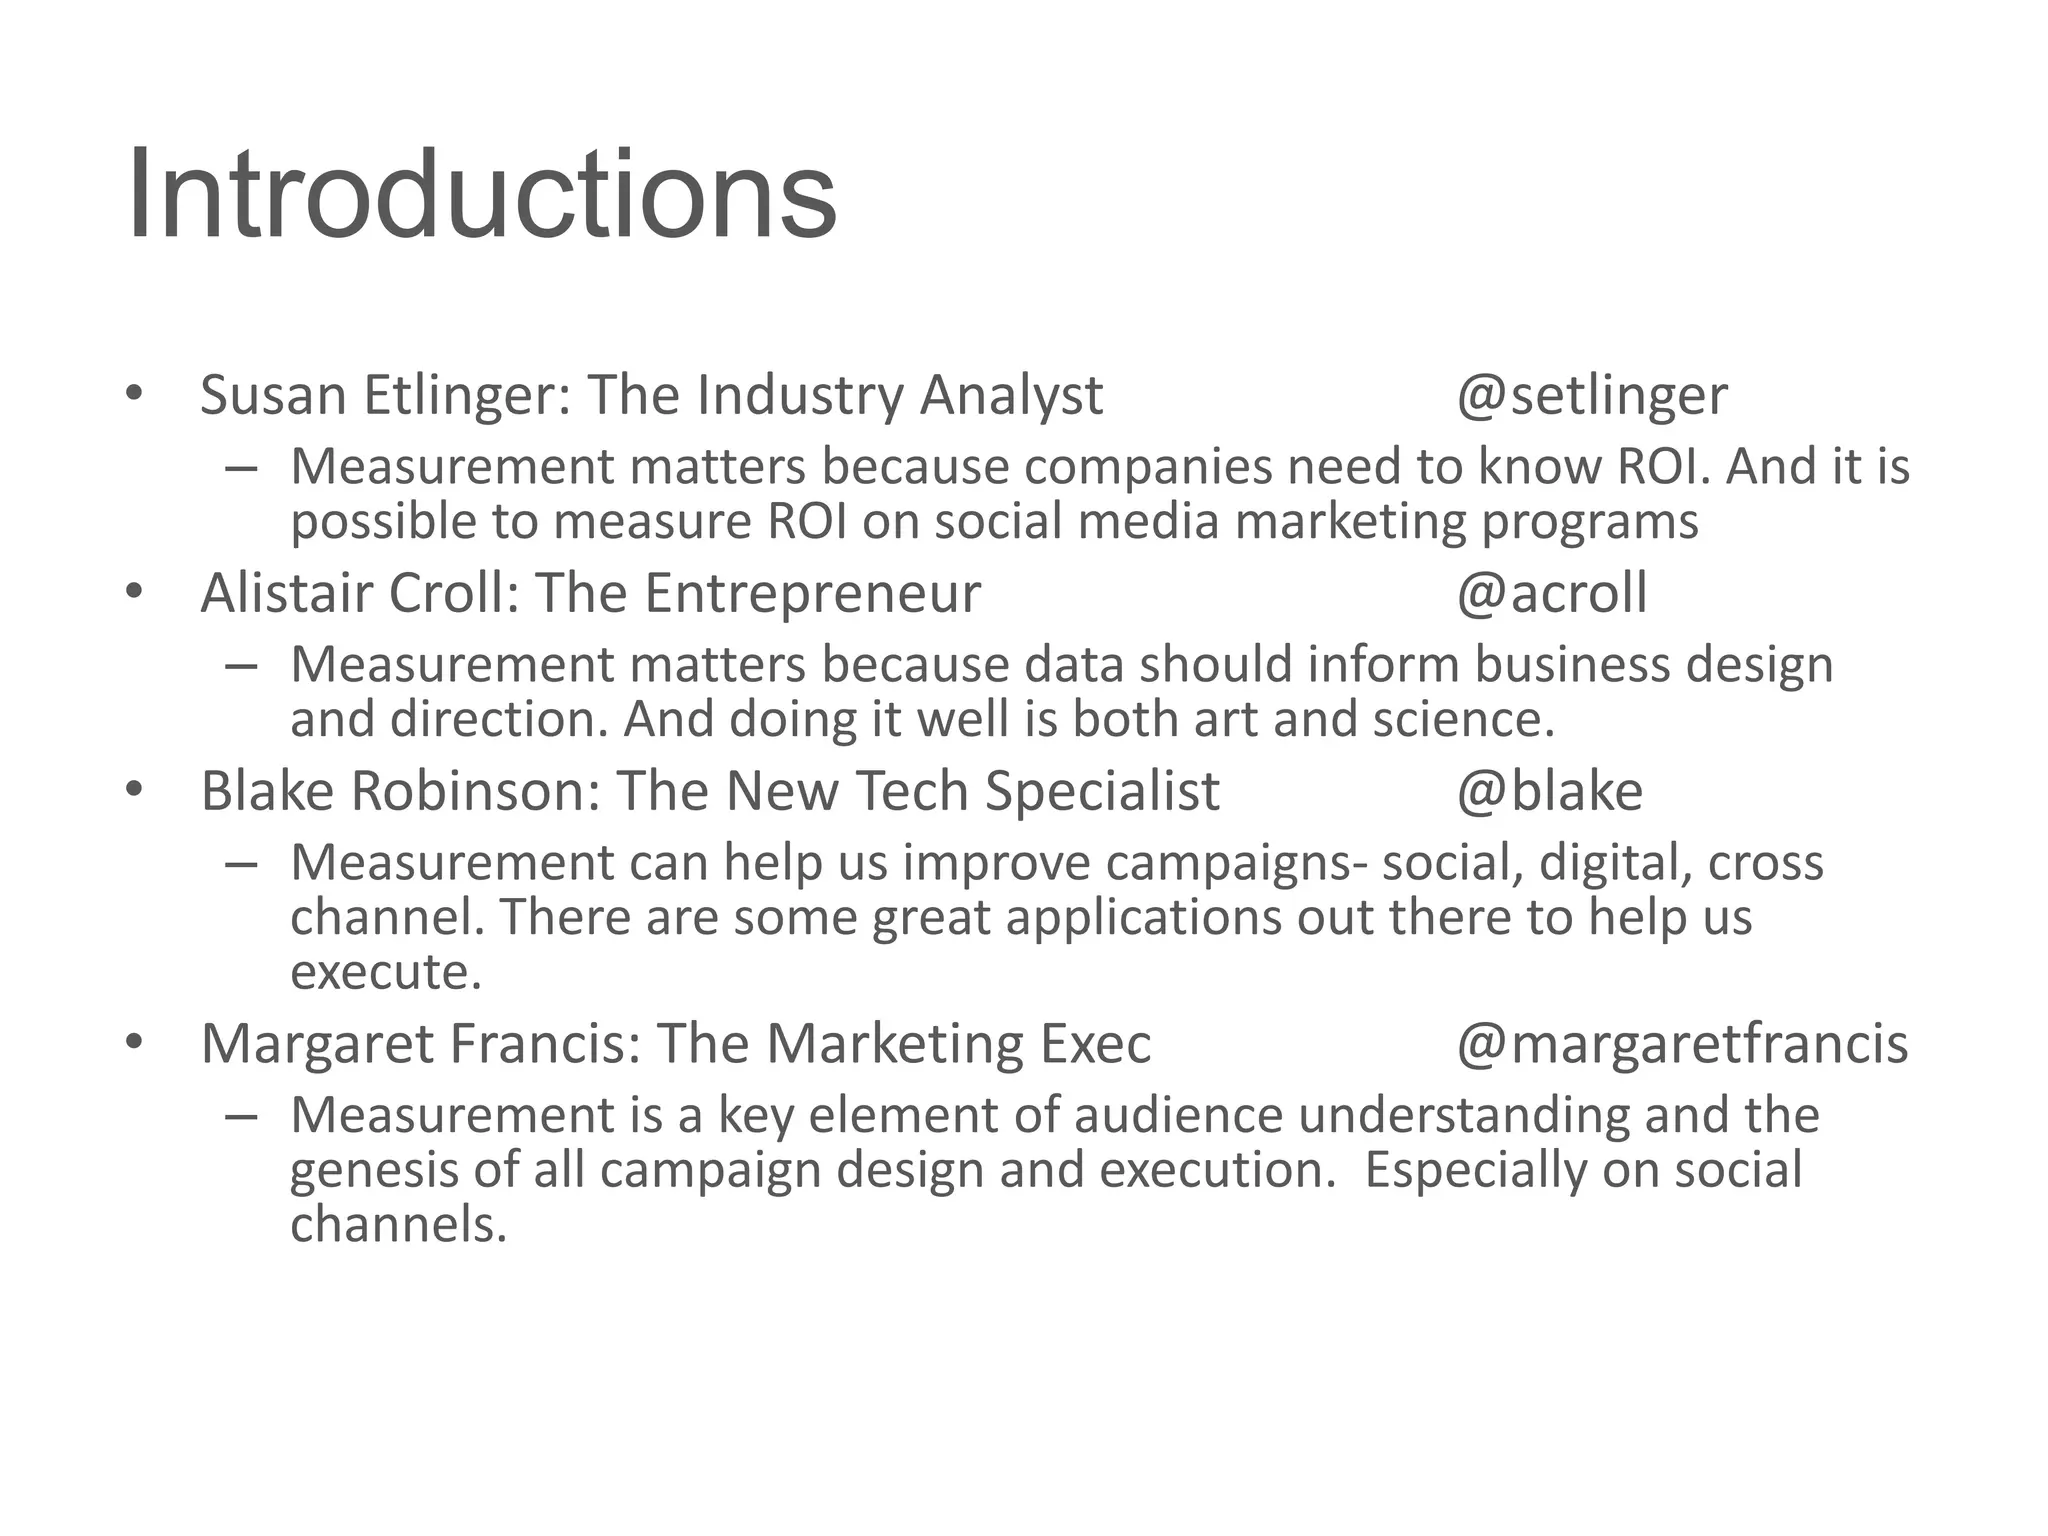
Introductions
• Susan Etlinger: The Industry Analyst                  @setlinger
    – Measurement matters because companies need to know ROI. And it is
      possible to measure ROI on social media marketing programs
• Alistair Croll: The Entrepreneur                      @acroll
    – Measurement matters because data should inform business design
      and direction. And doing it well is both art and science.
• Blake Robinson: The New Tech Specialist               @blake
    – Measurement can help us improve campaigns- social, digital, cross
      channel. There are some great applications out there to help us
      execute.
• Margaret Francis: The Marketing Exec                  @margaretfrancis
    – Measurement is a key element of audience understanding and the
      genesis of all campaign design and execution. Especially on social
      channels.
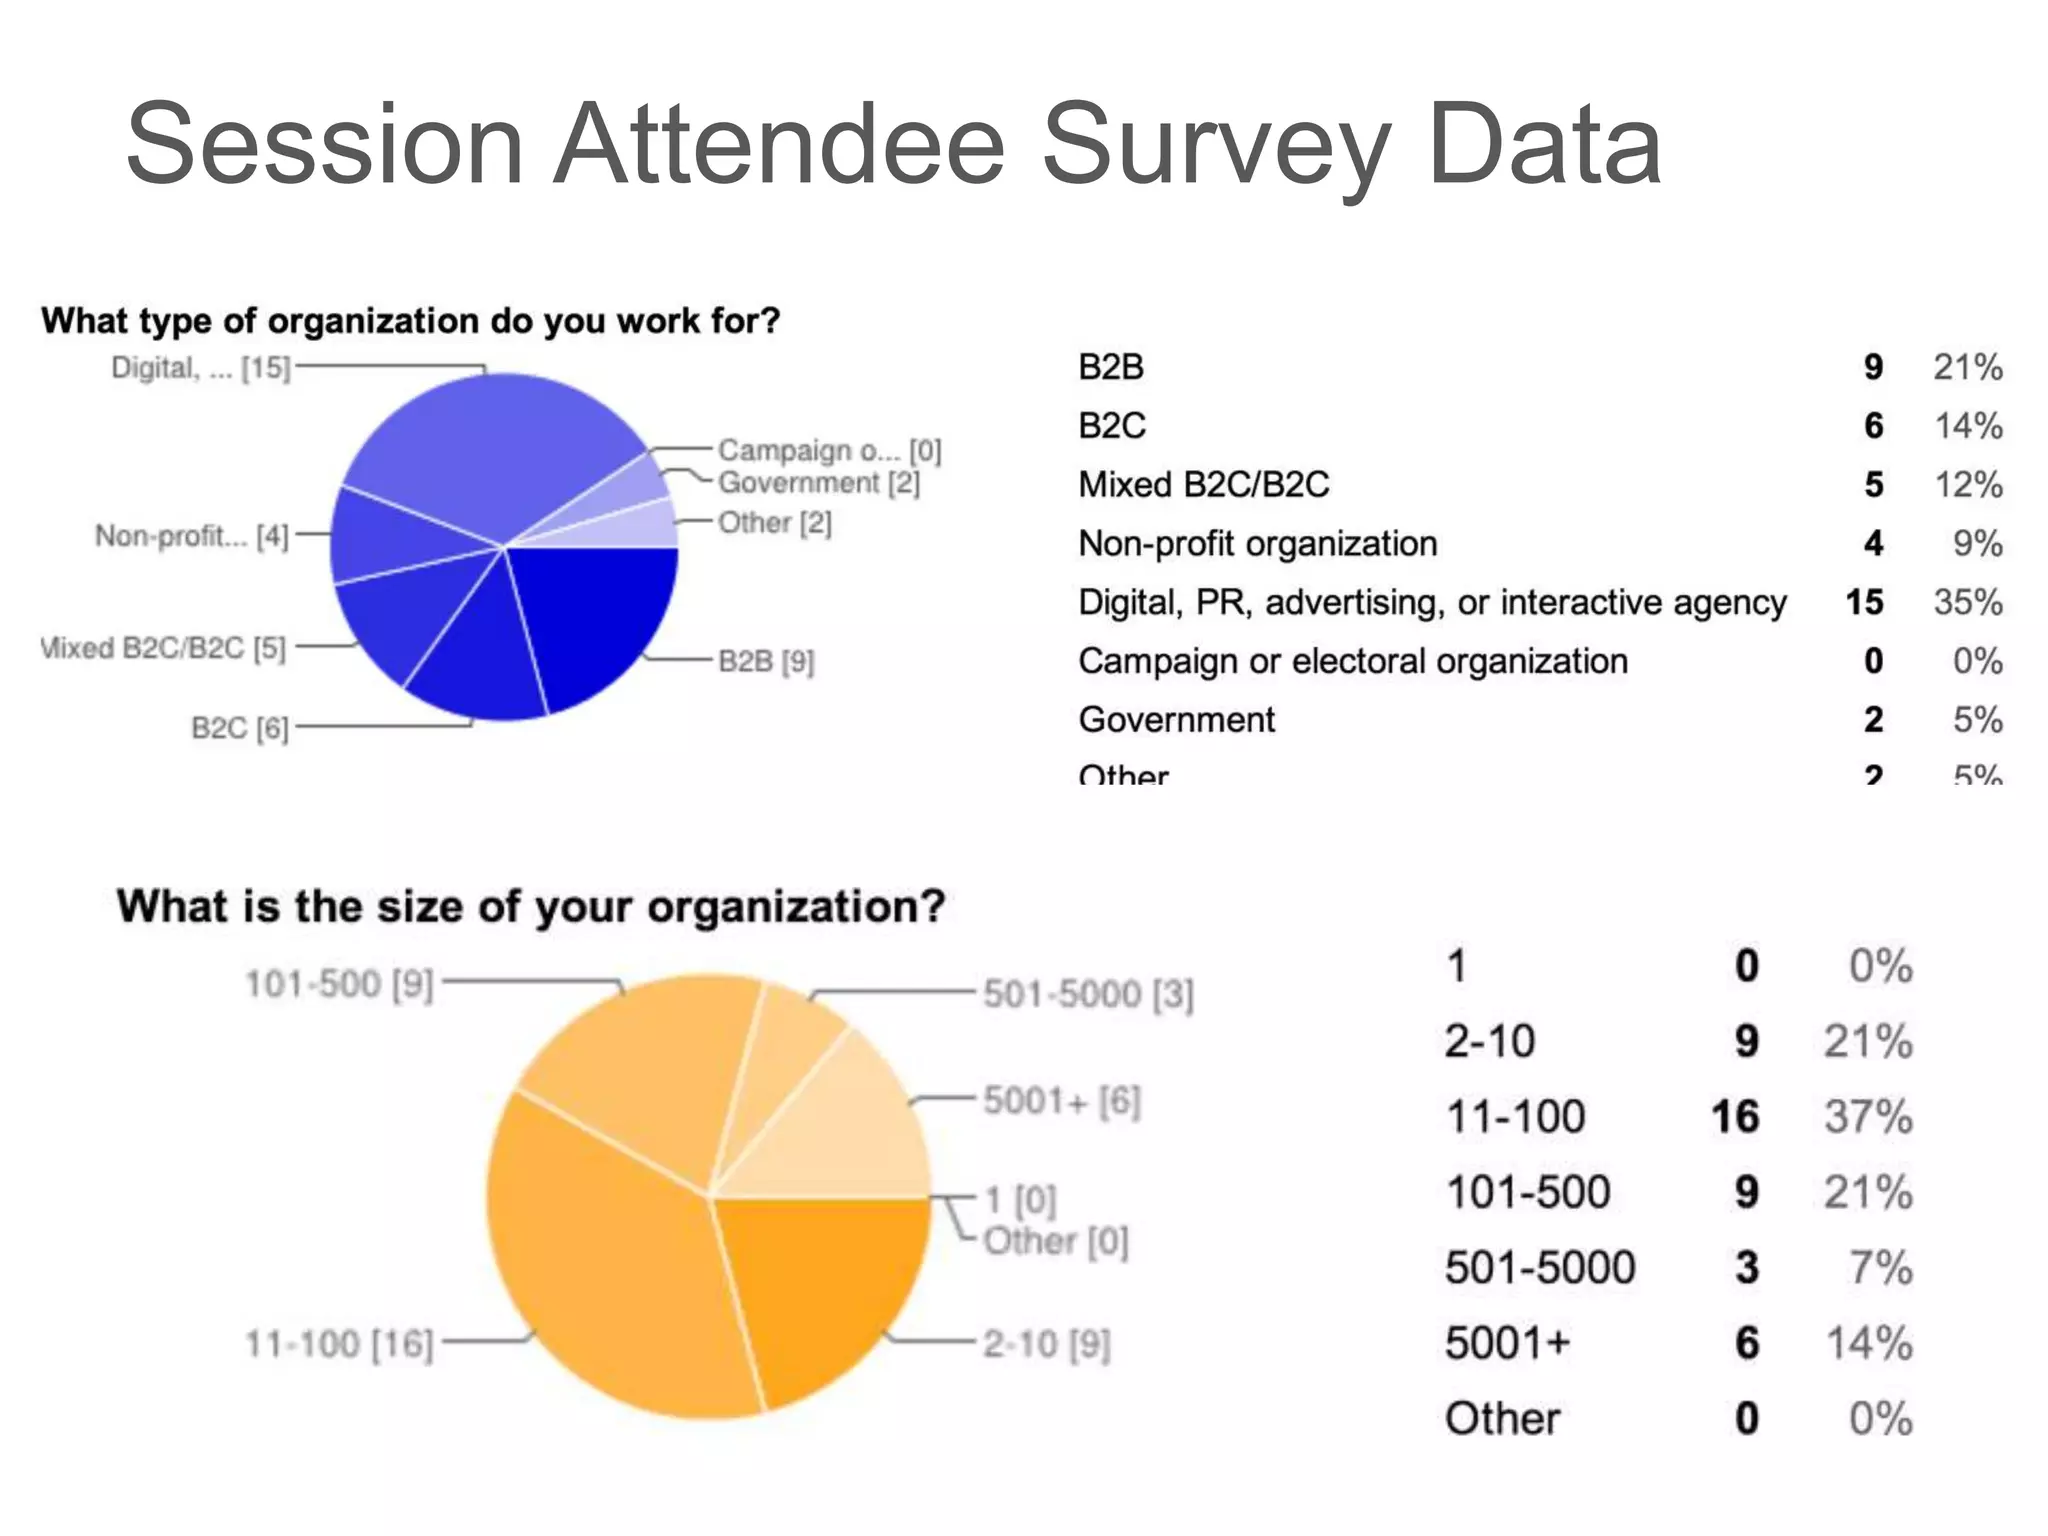
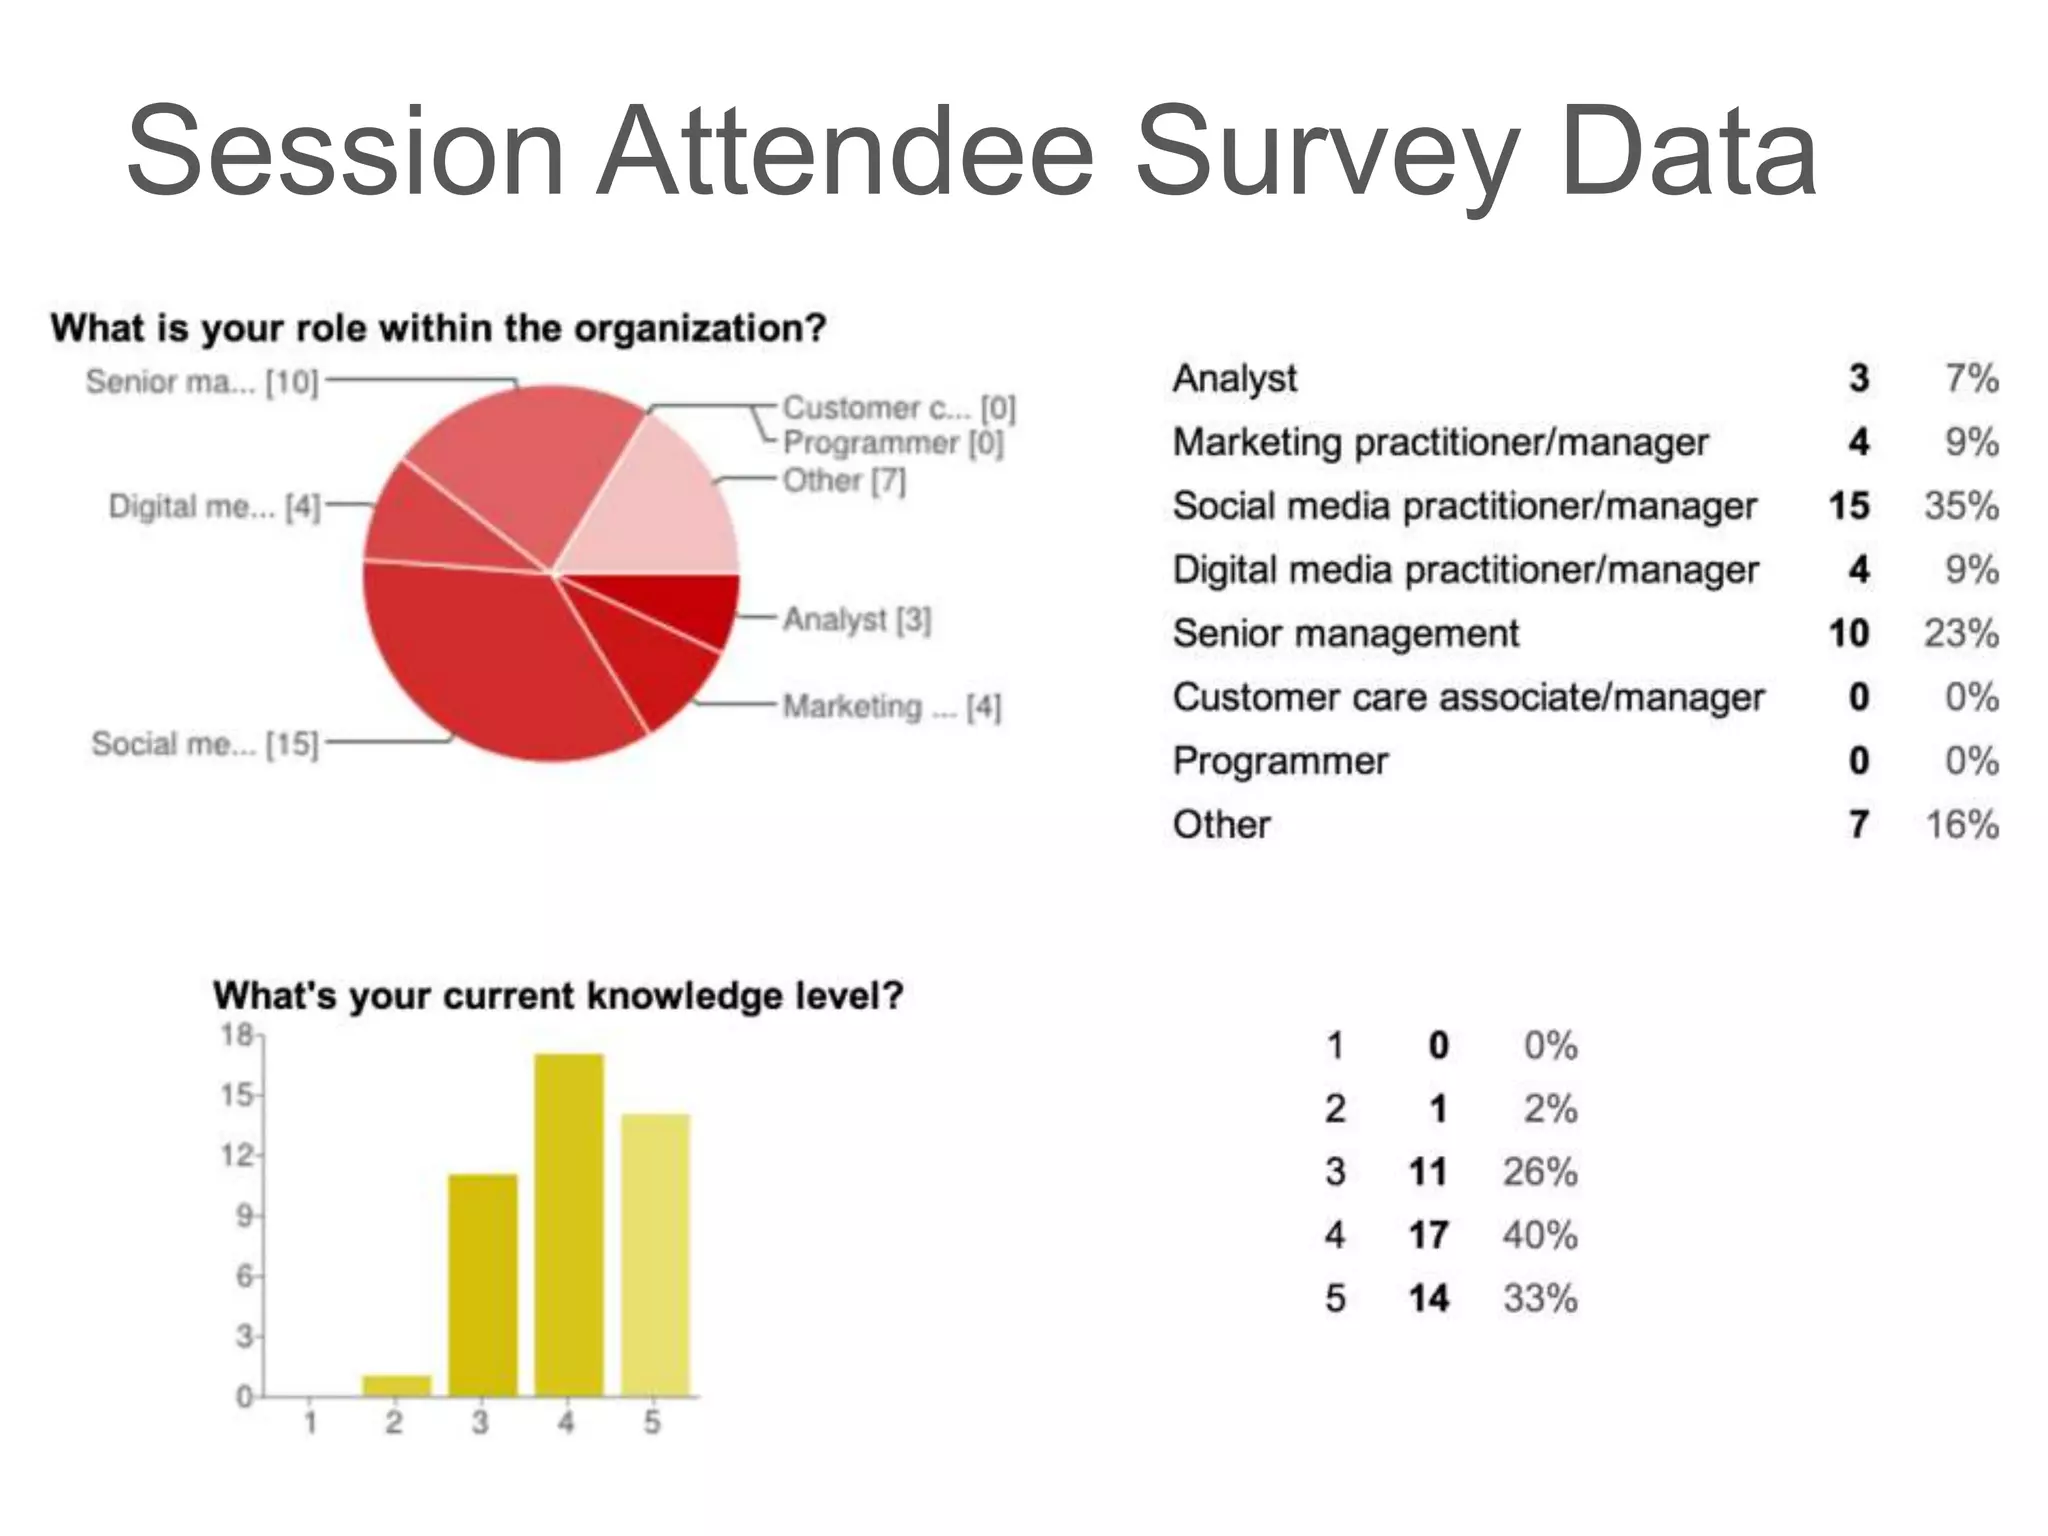
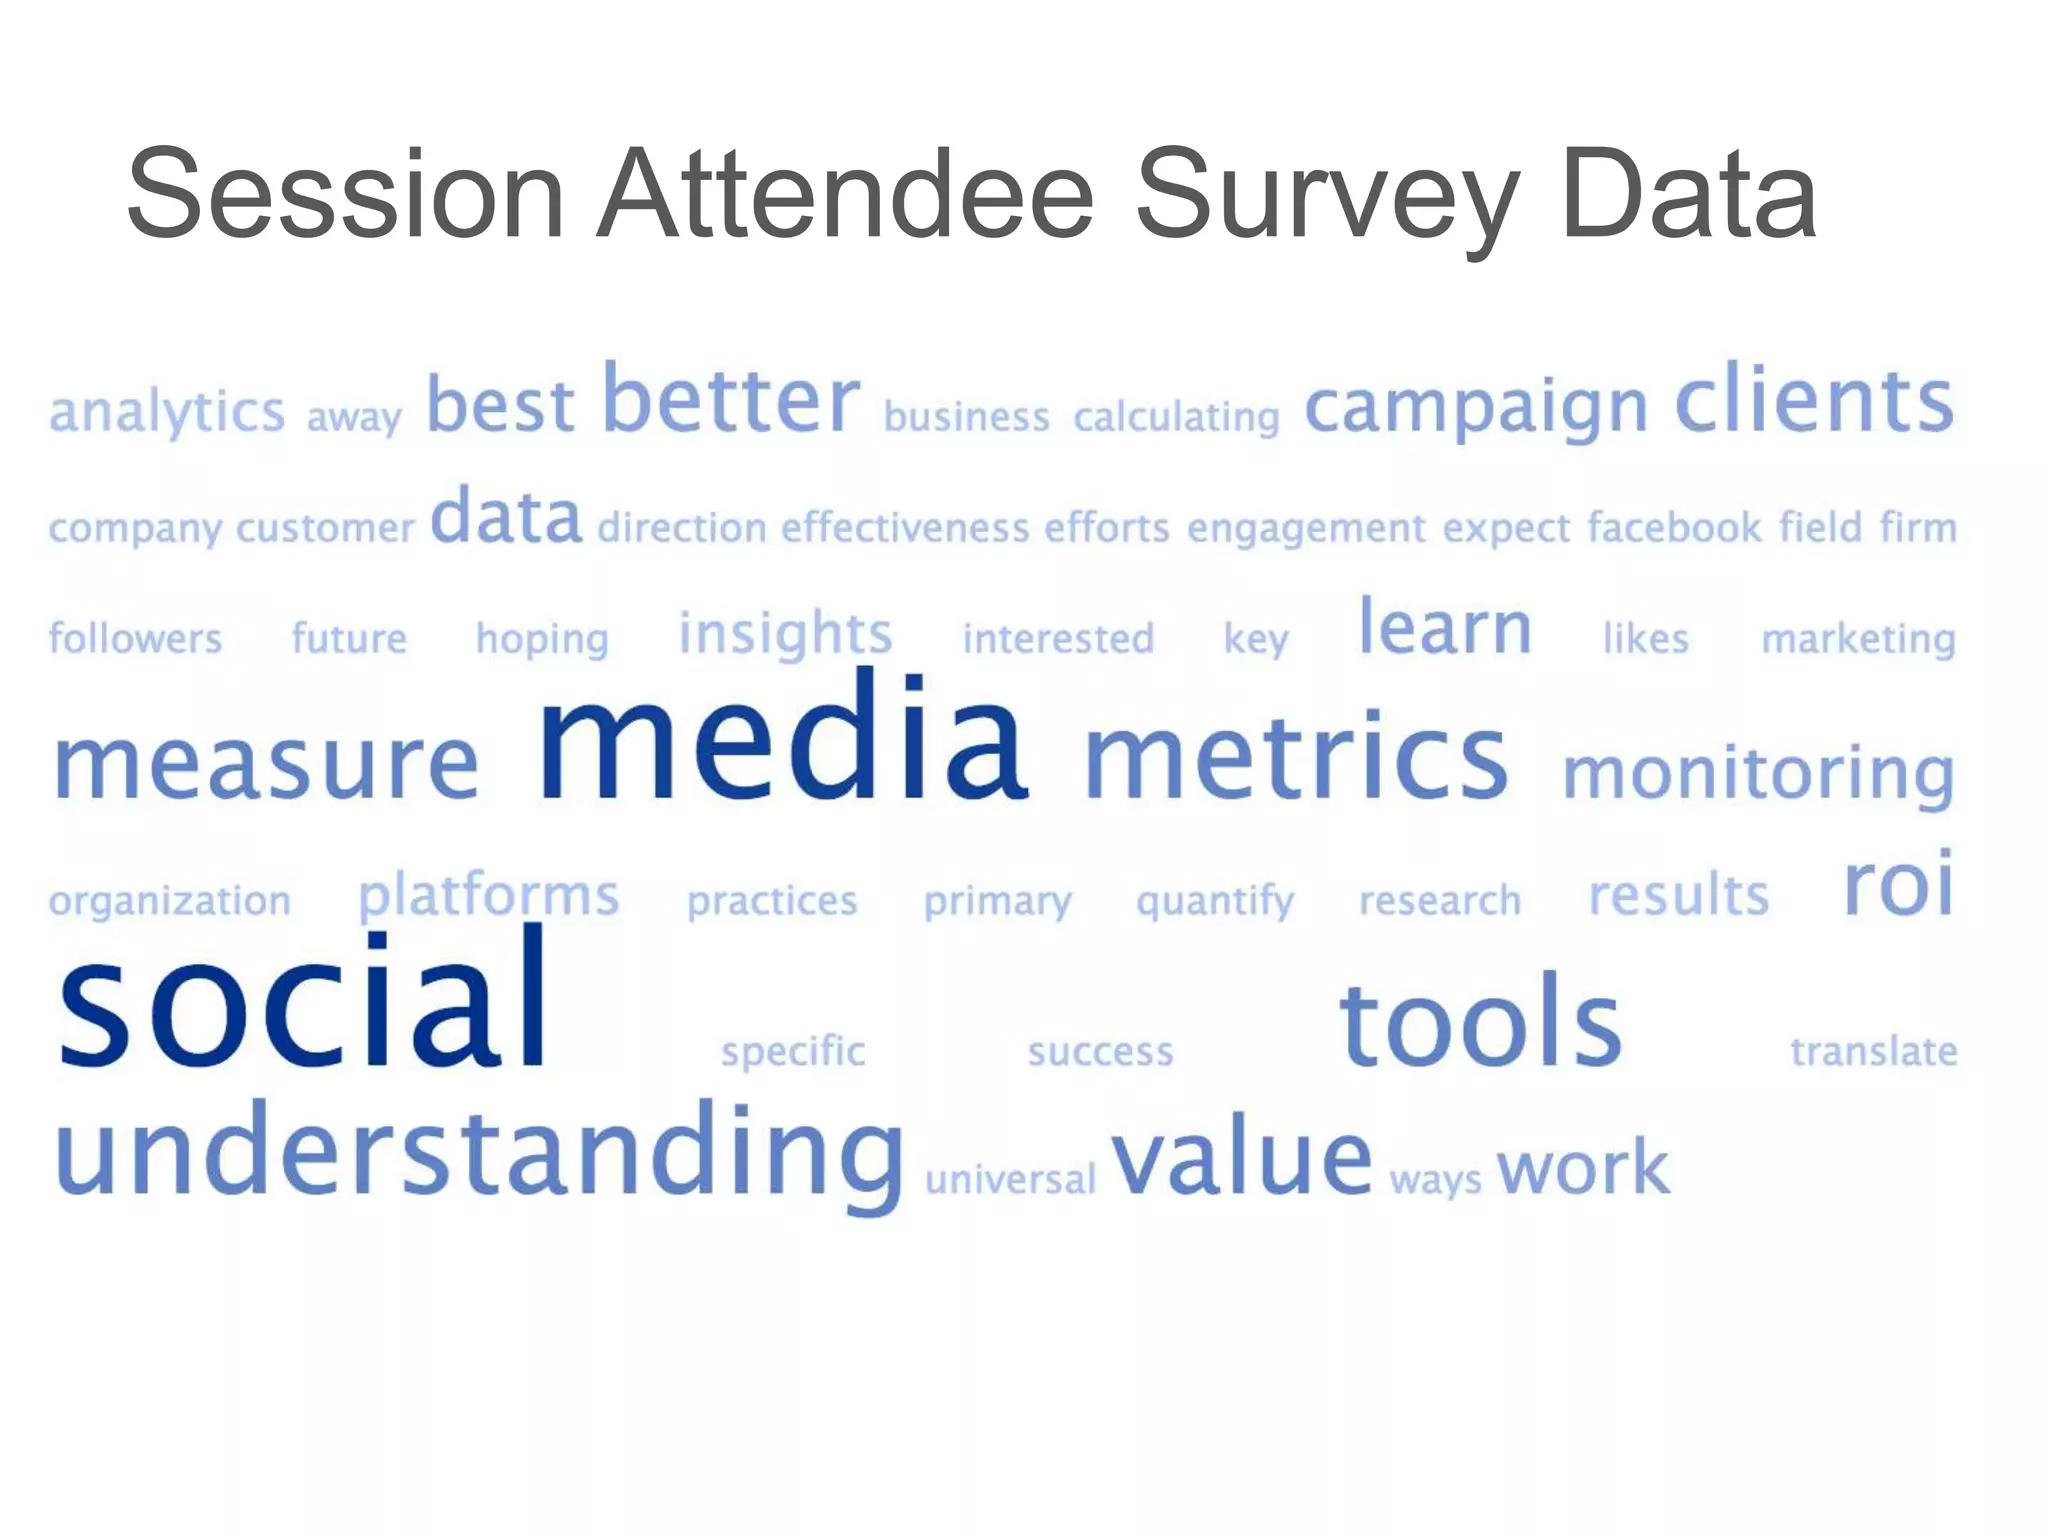
Session Attendee Survey Data
• >insert survey results< ALISTAIR
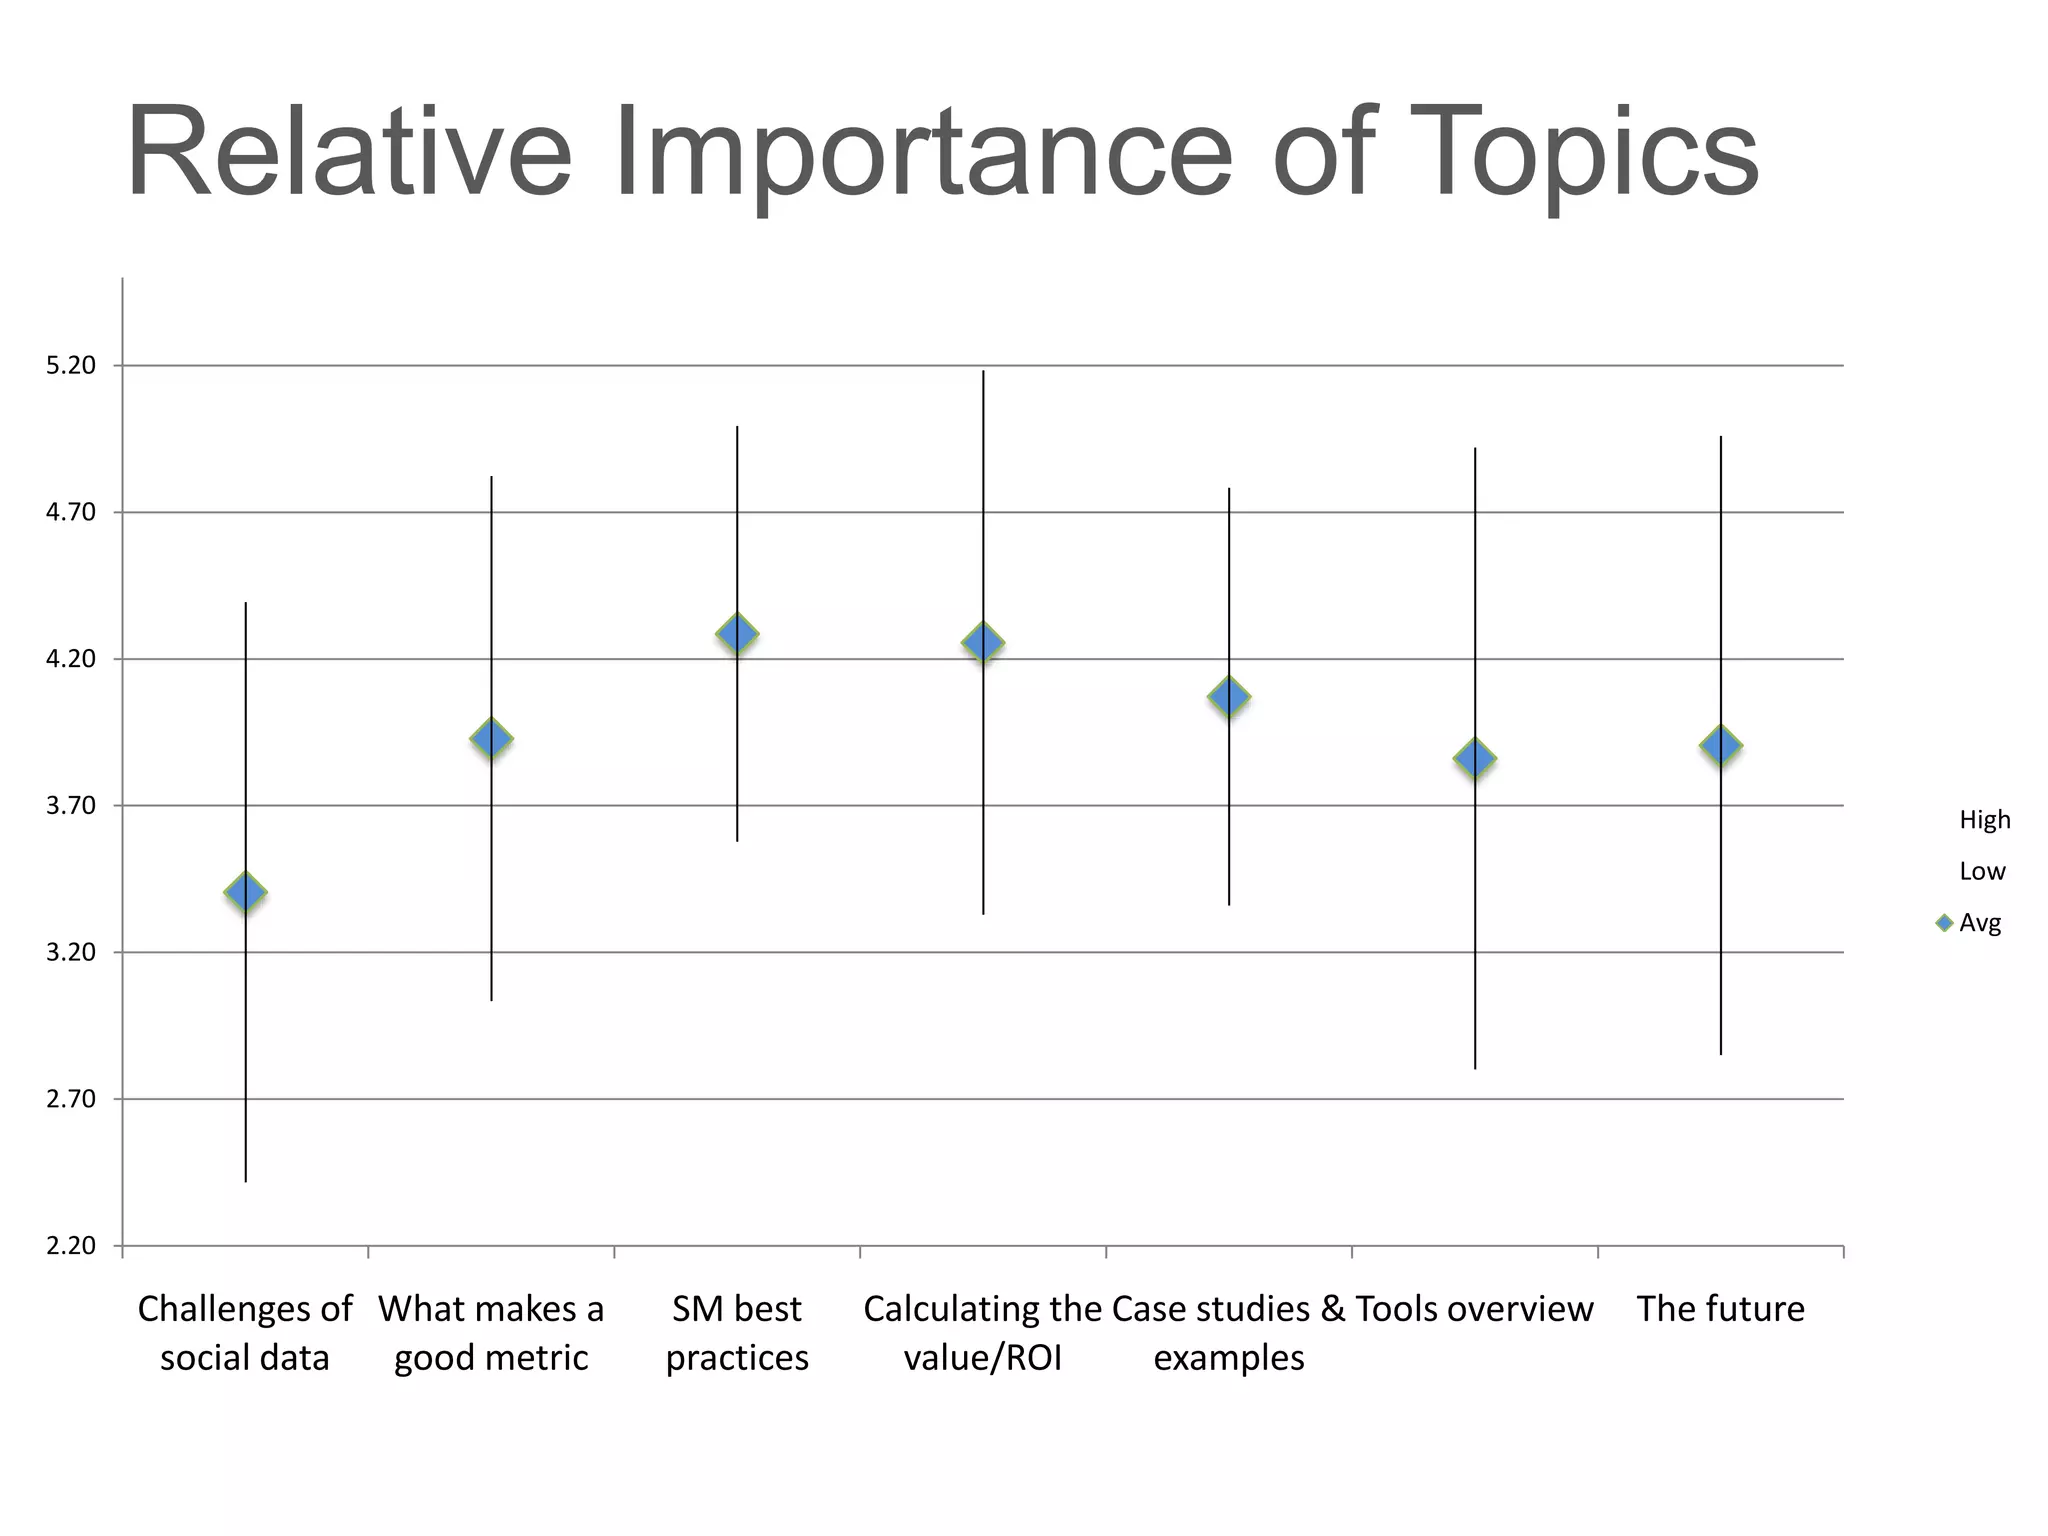
Relative Importance of Topics
5.20


4.70


4.20


3.70
                                                                                                             High
                                                                                                             Low
                                                                                                             Avg
3.20


2.70


2.20

       Challenges of What makes a   SM best     Calculating the Case studies & Tools overview   The future
        social data  good metric    practices     value/ROI       examples
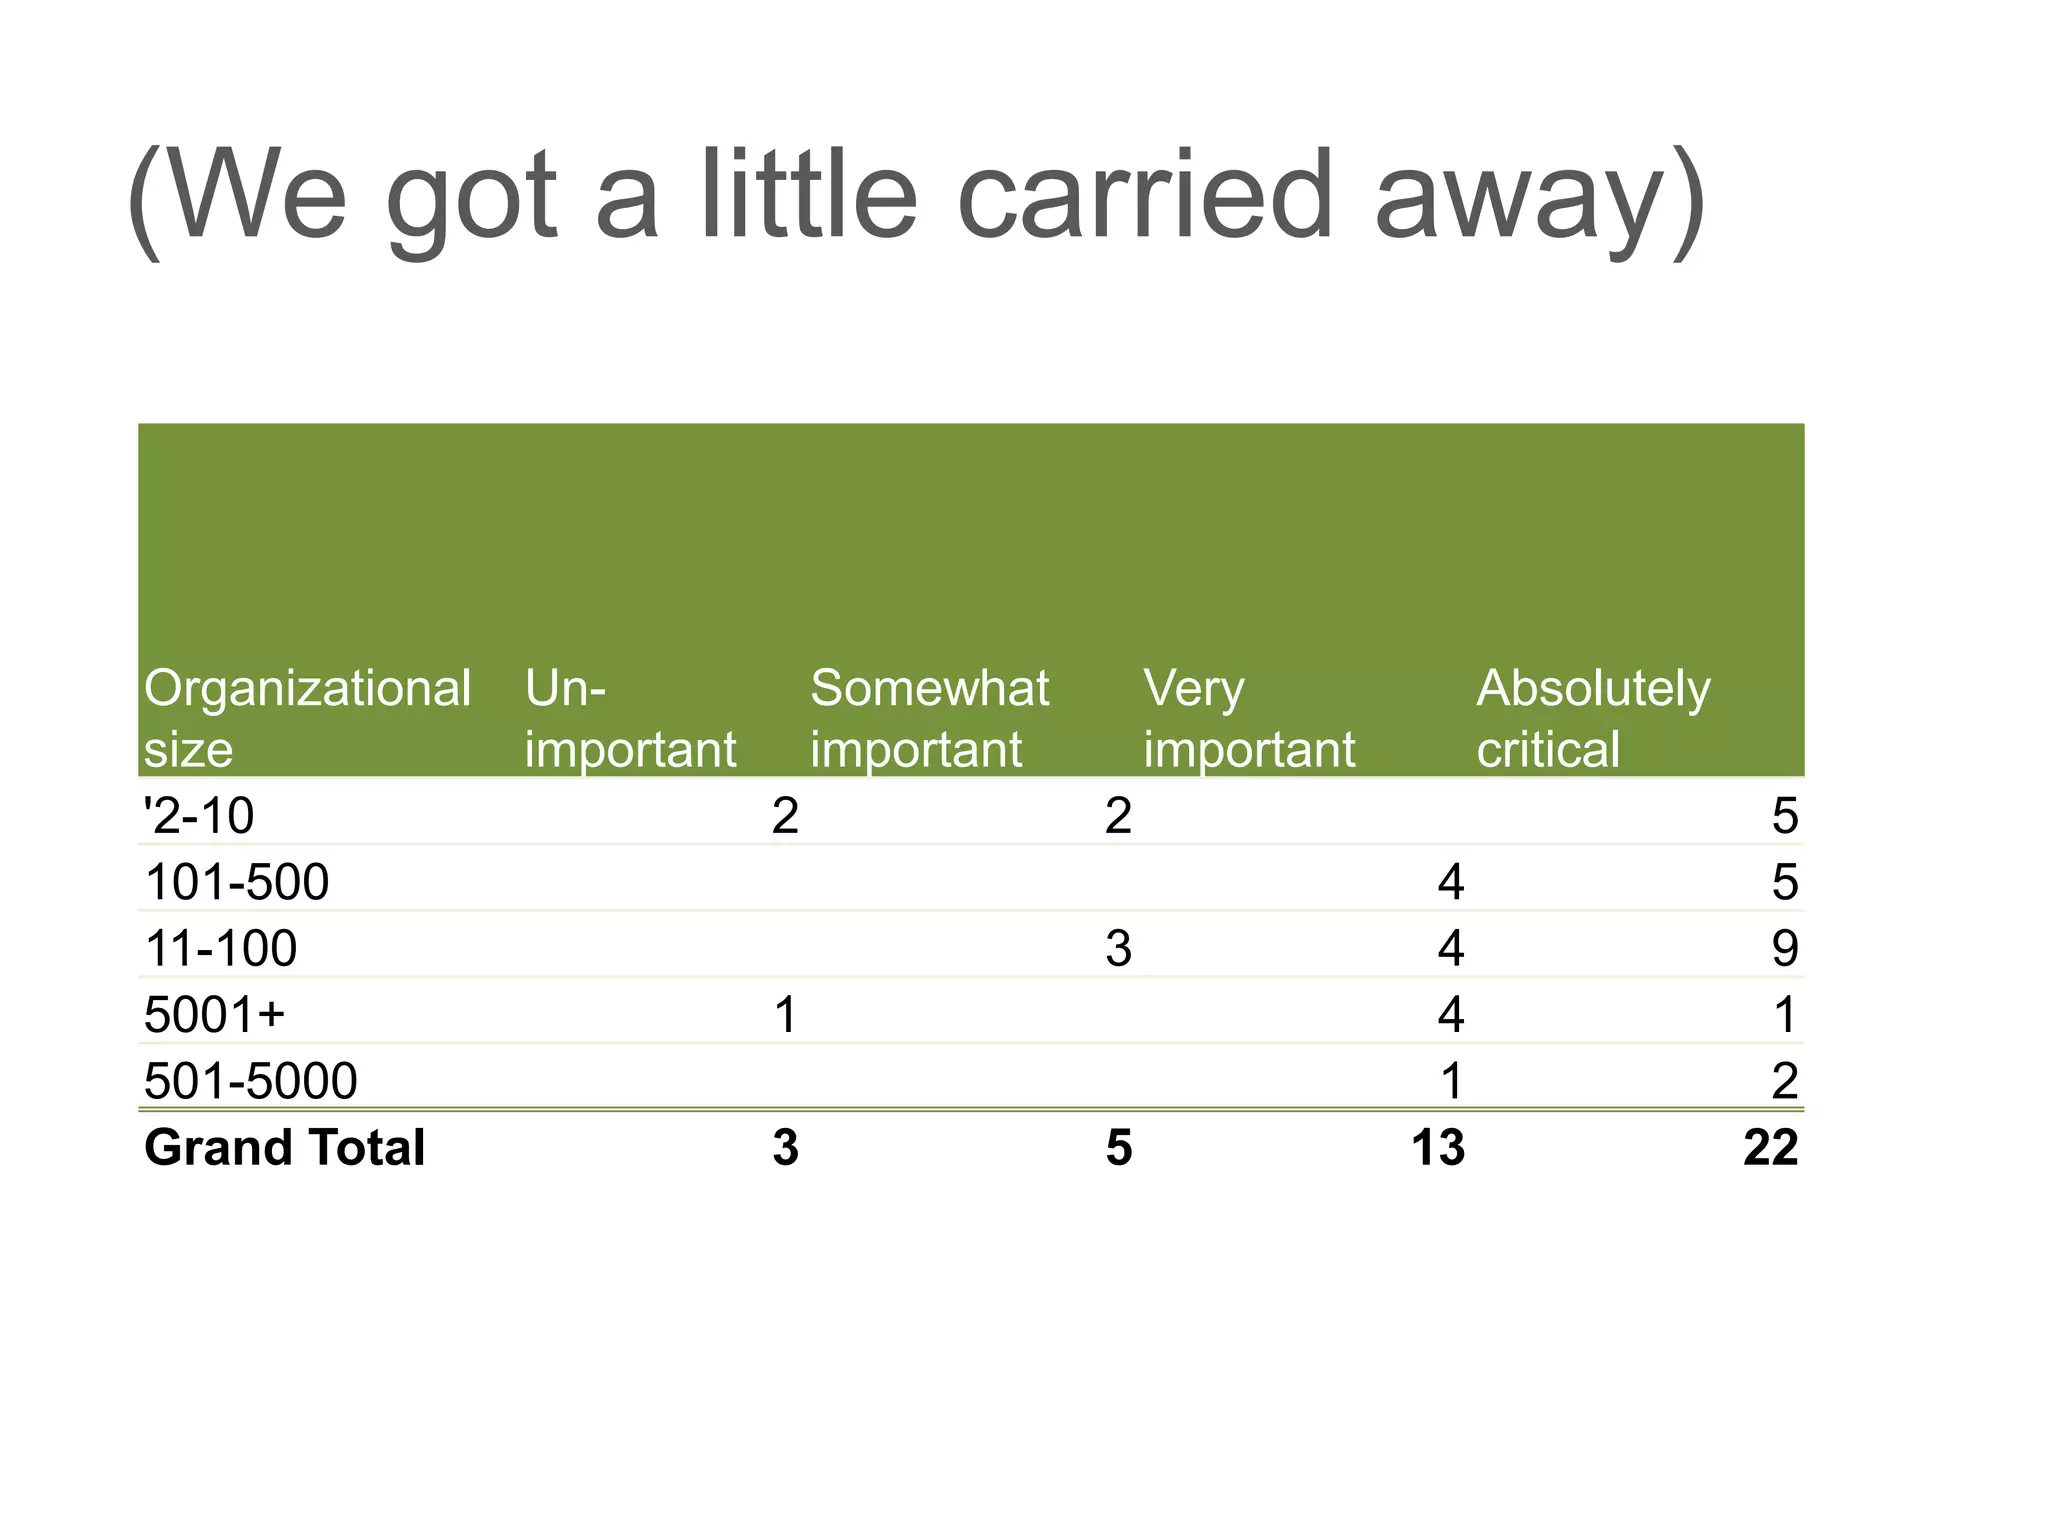
(We got a little carried away)


Organizational   Un-             Somewhat        Very             Absolutely
size             important       important       important        critical
'2-10                        2               2                                  5
101-500                                                       4                 5
11-100                                       3                4                 9
5001+                        1                                4                 1
501-5000                                                      1                 2
Grand Total                  3               5               13                22
Qualitative Insights
• “There’s no consensus on how to measure ROI
  in the industry. Or even on my team.”
• “There’s no one tool that does it all.”
• “I have to go to every single social network to
  get metrics.”
• “The metrics are different on every network.”
• “I know it’s important to analyze. I just have
  limited time and resources to do it.”
Q&A
• What other topics should we hold time at the
  end of the session for?
ROI on Social Media:
State of the State
13


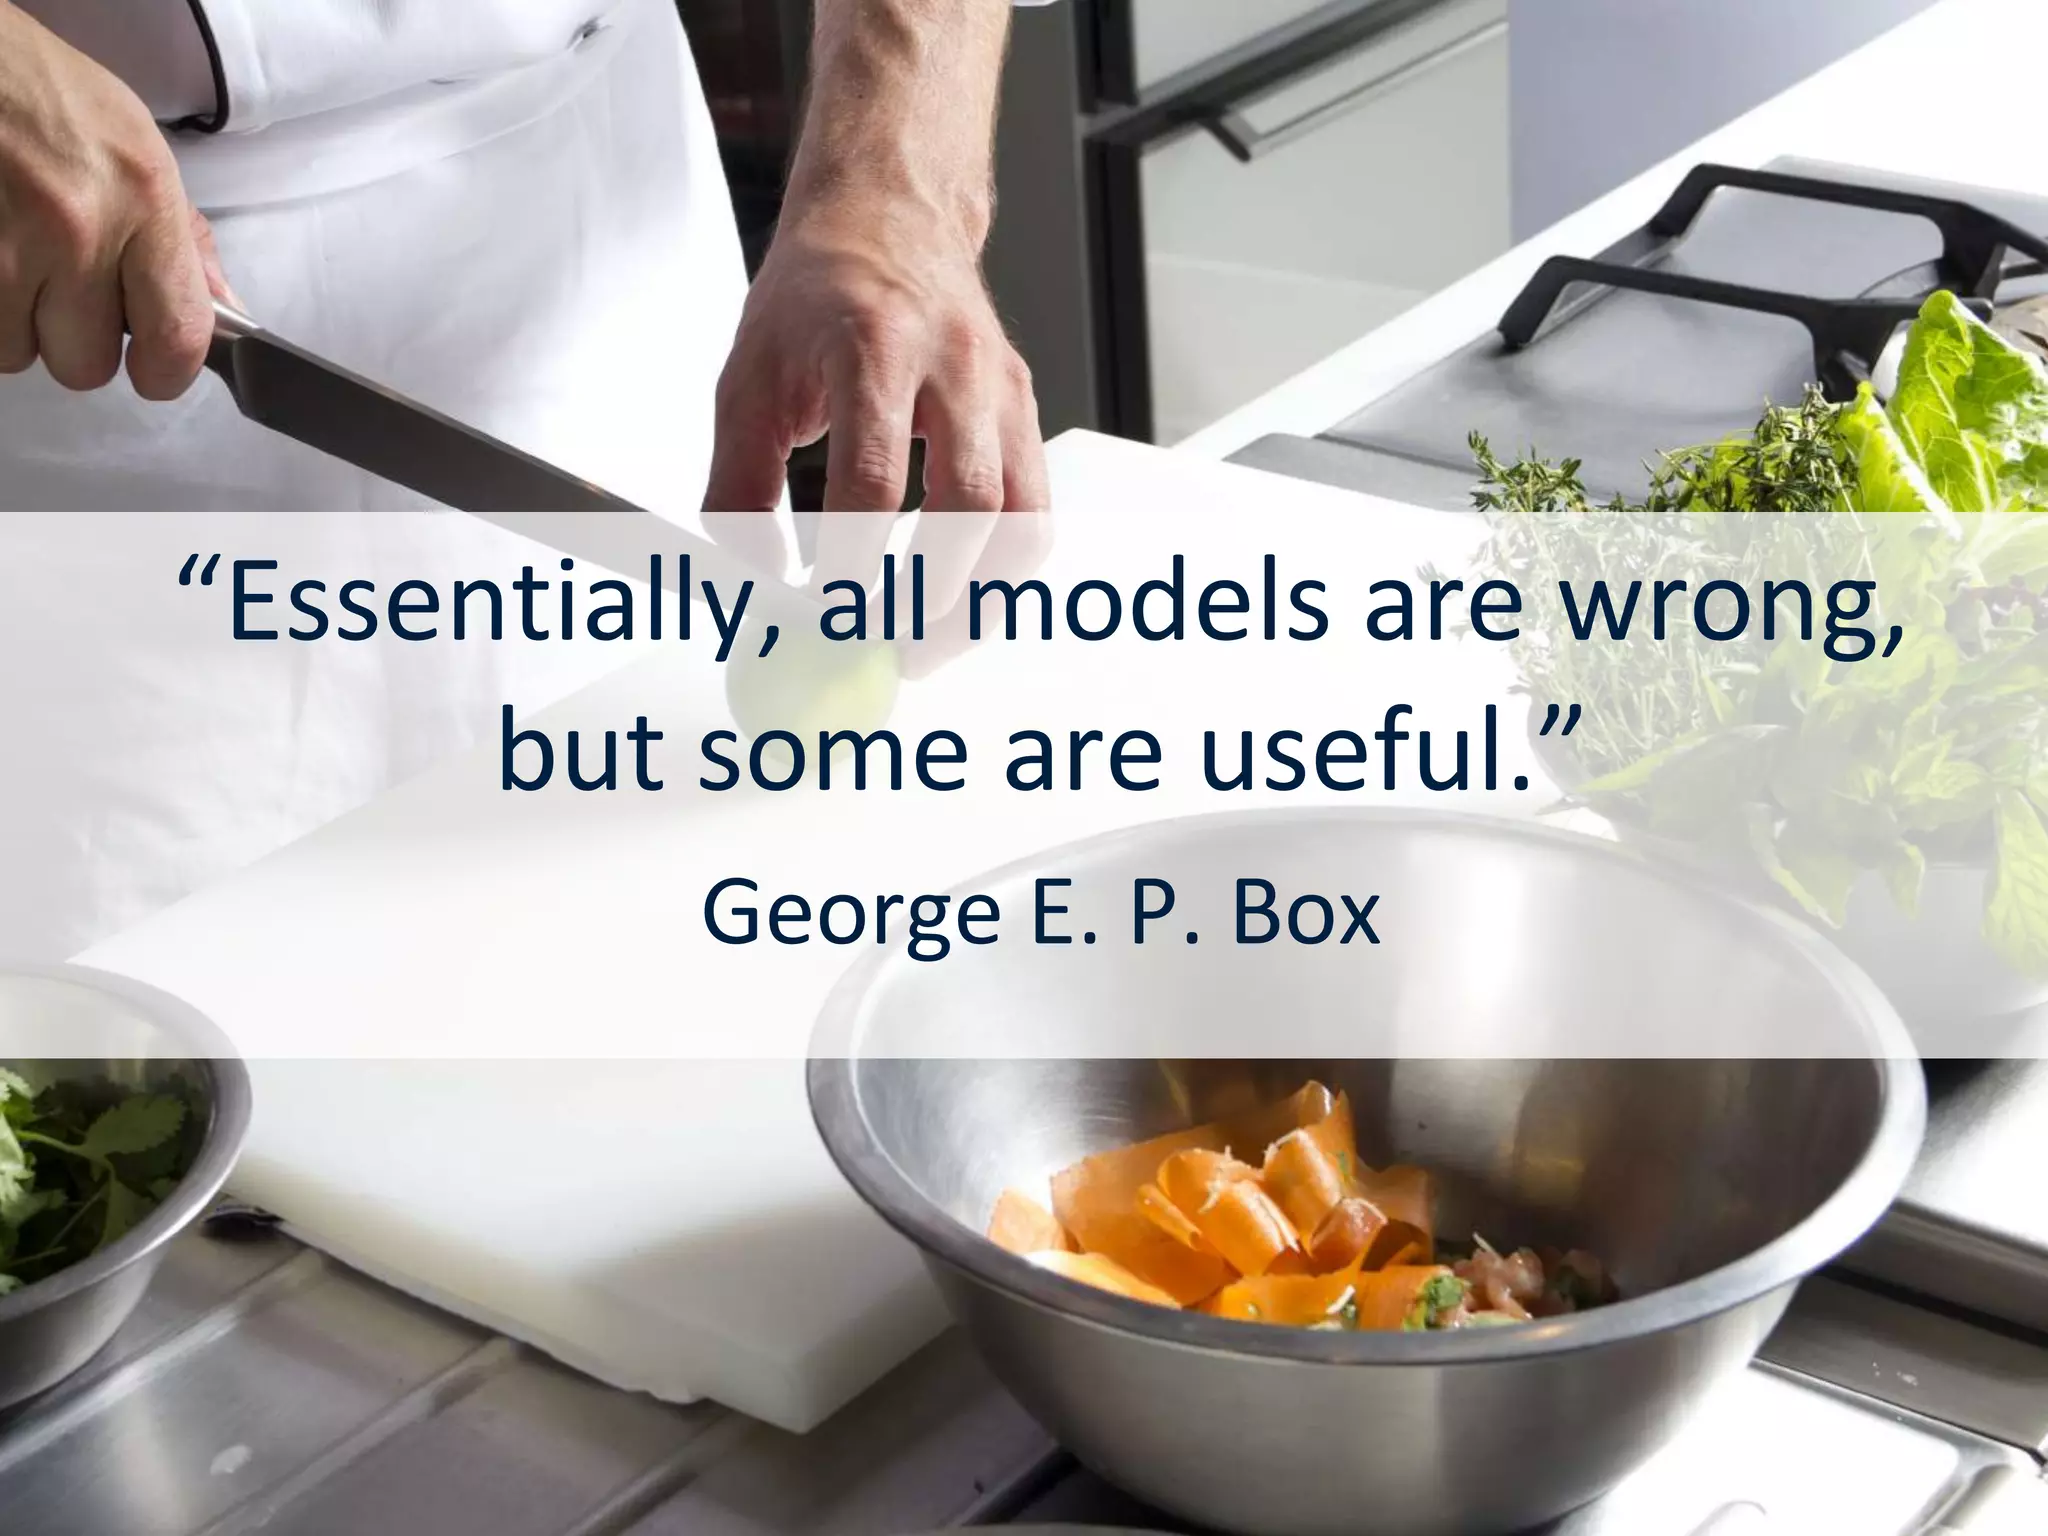
“Essentially, all models are wrong,
      but some are useful.”
          George E. P. Box
14


Where are we?
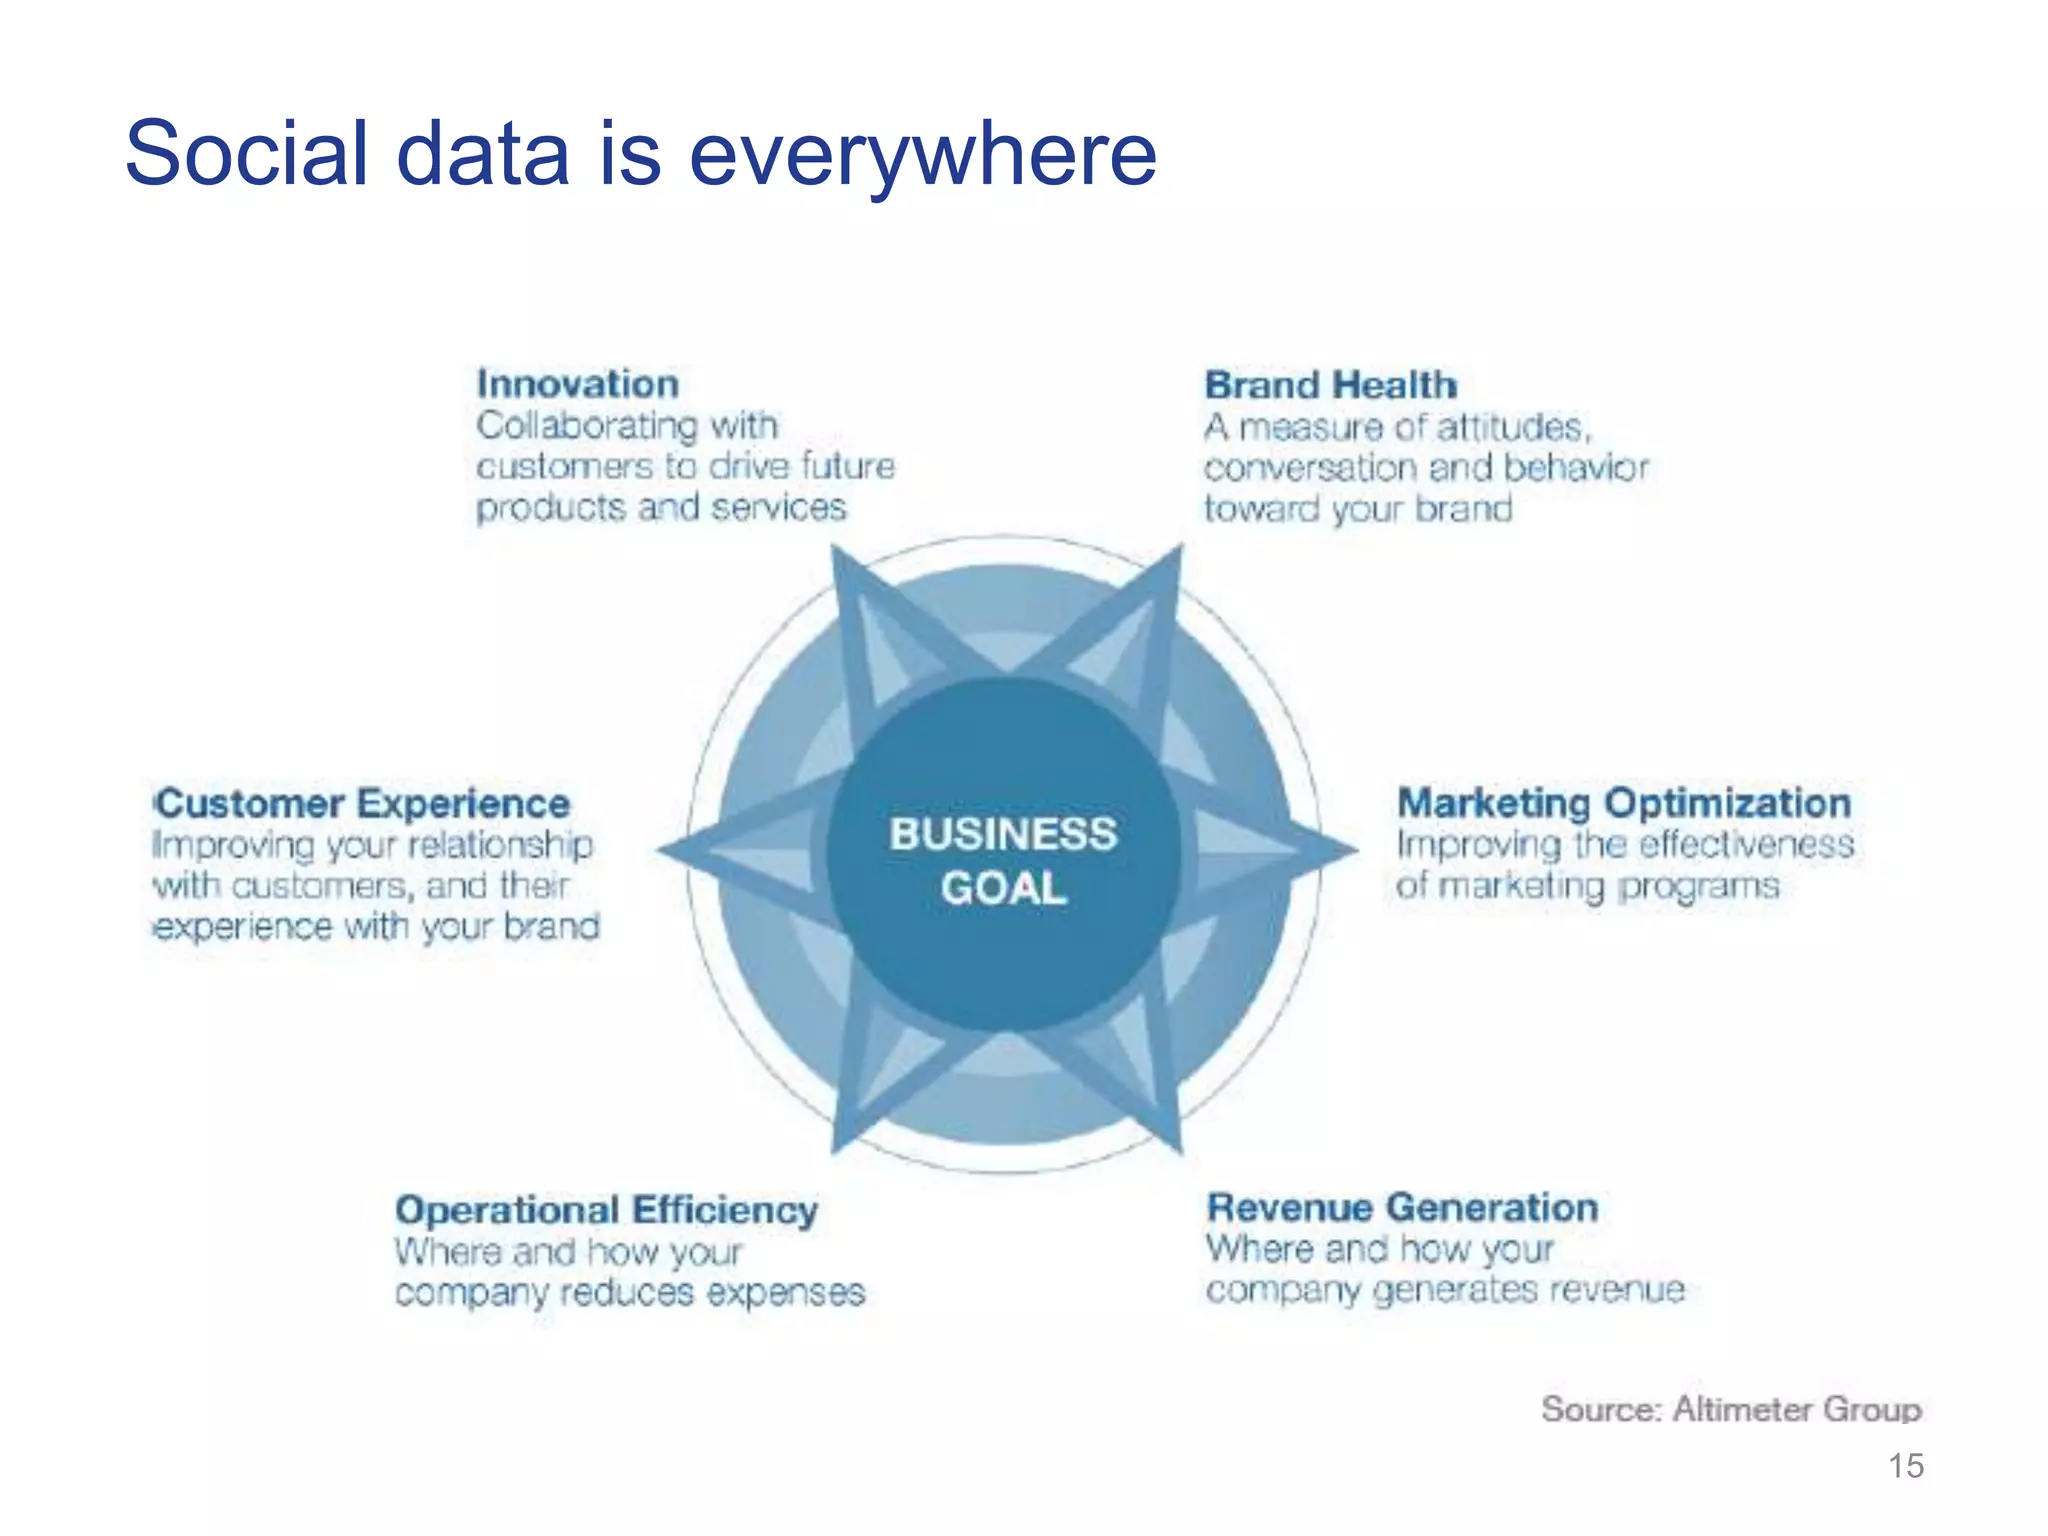
Social data is everywhere


                            15
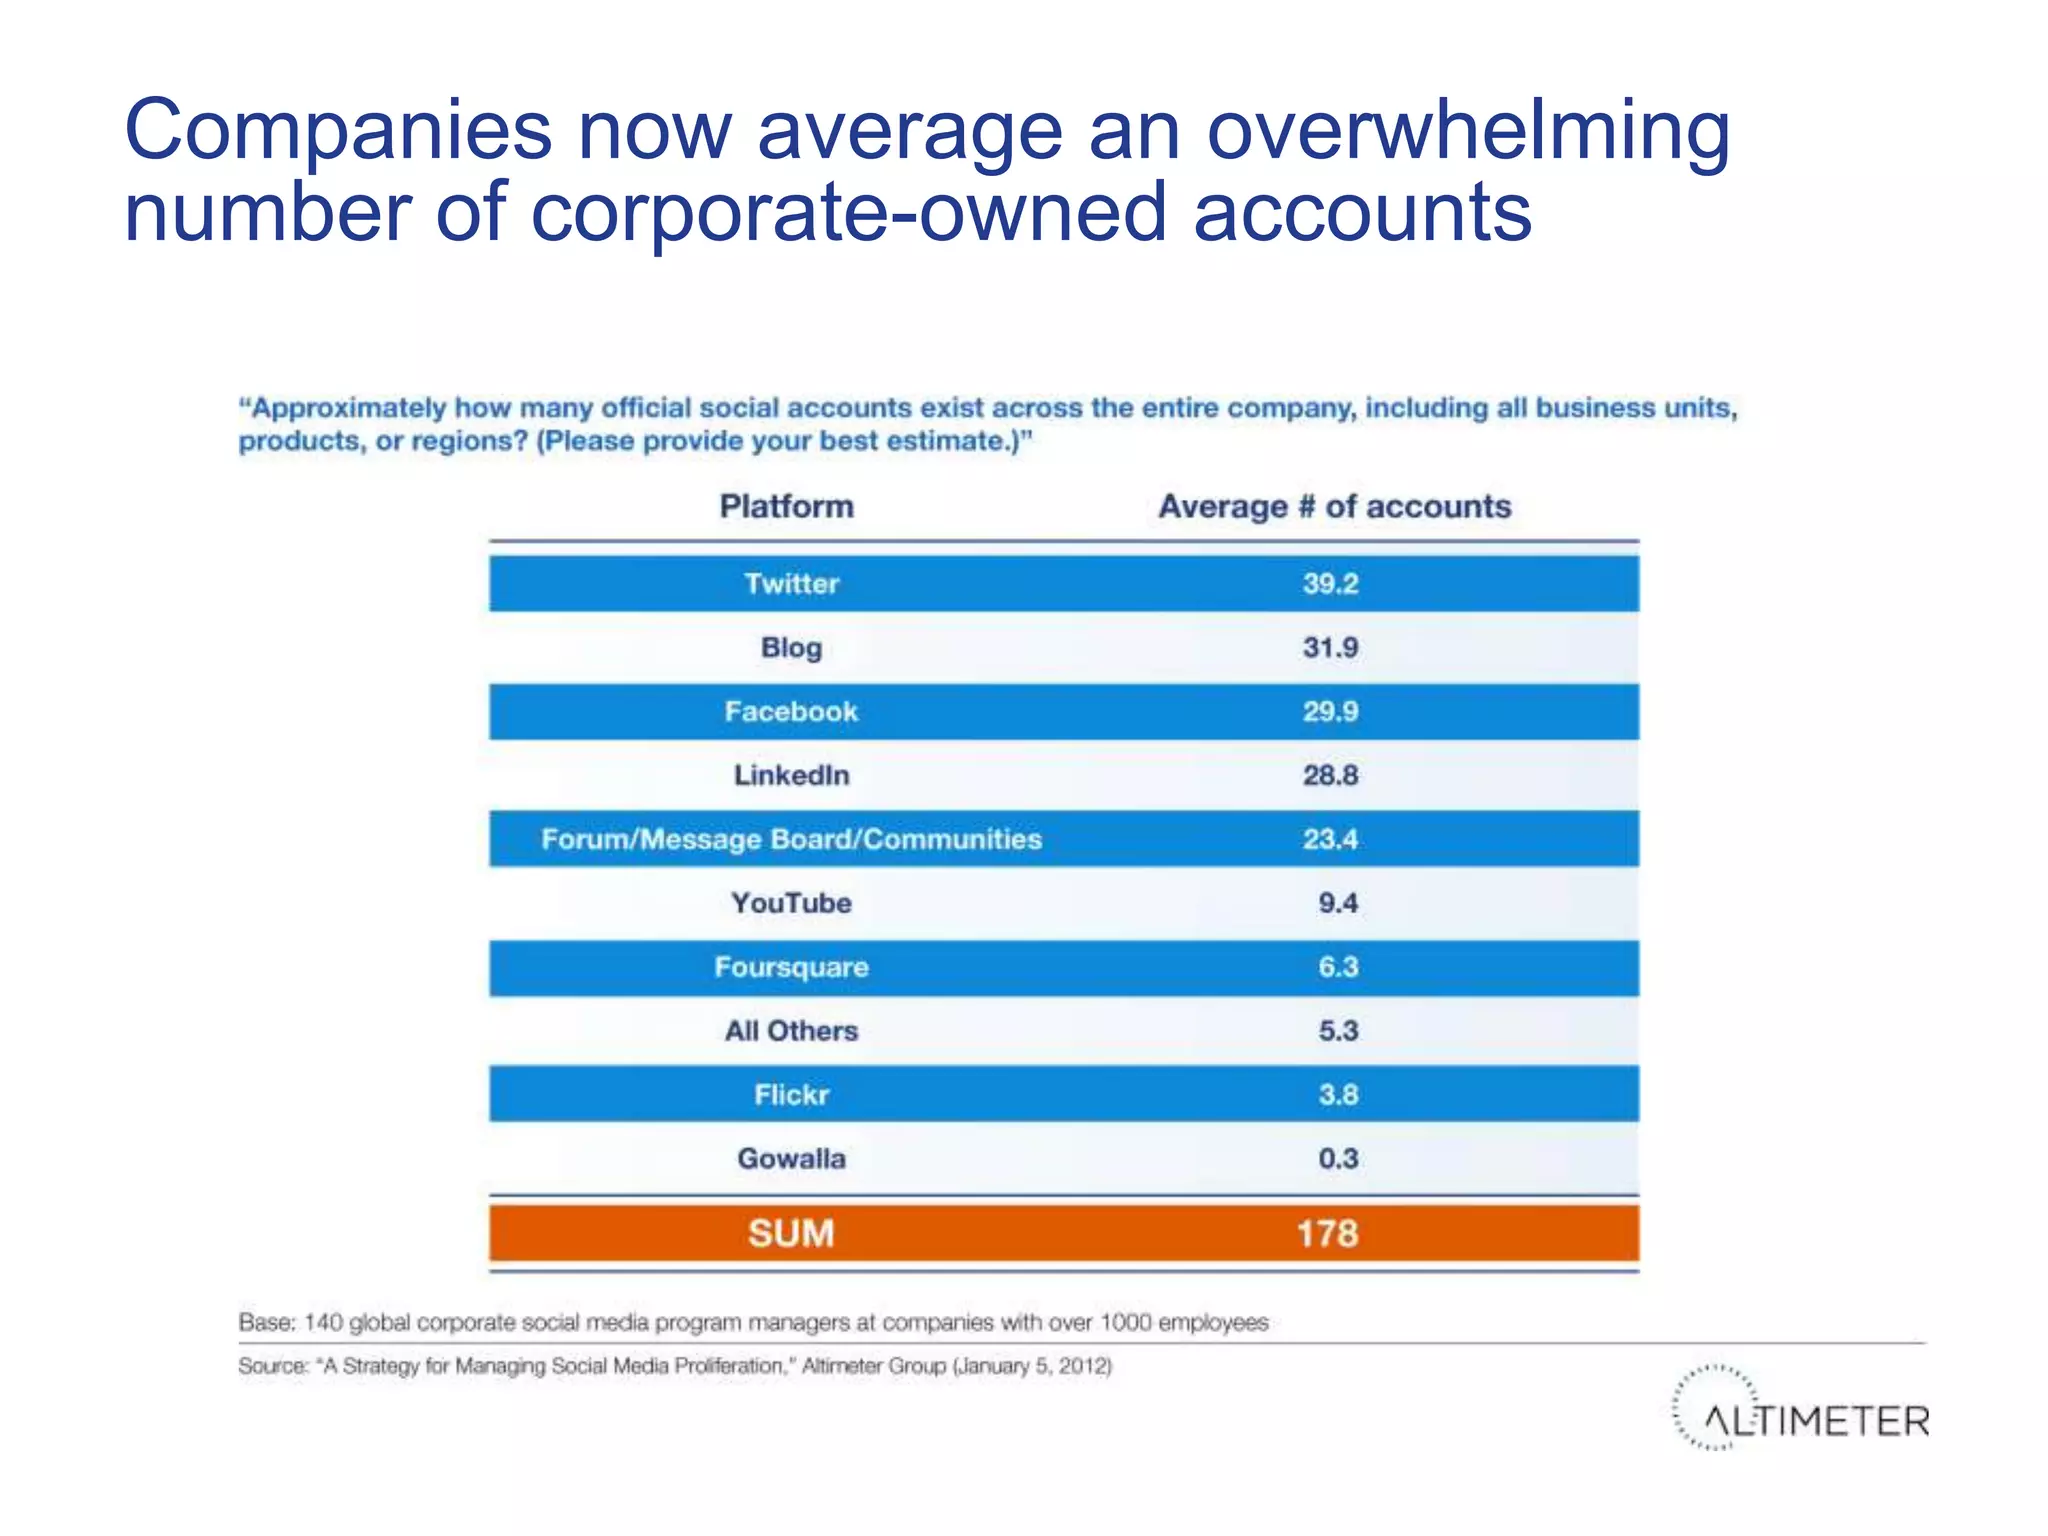
Companies now average an overwhelming
number of corporate-owned accounts
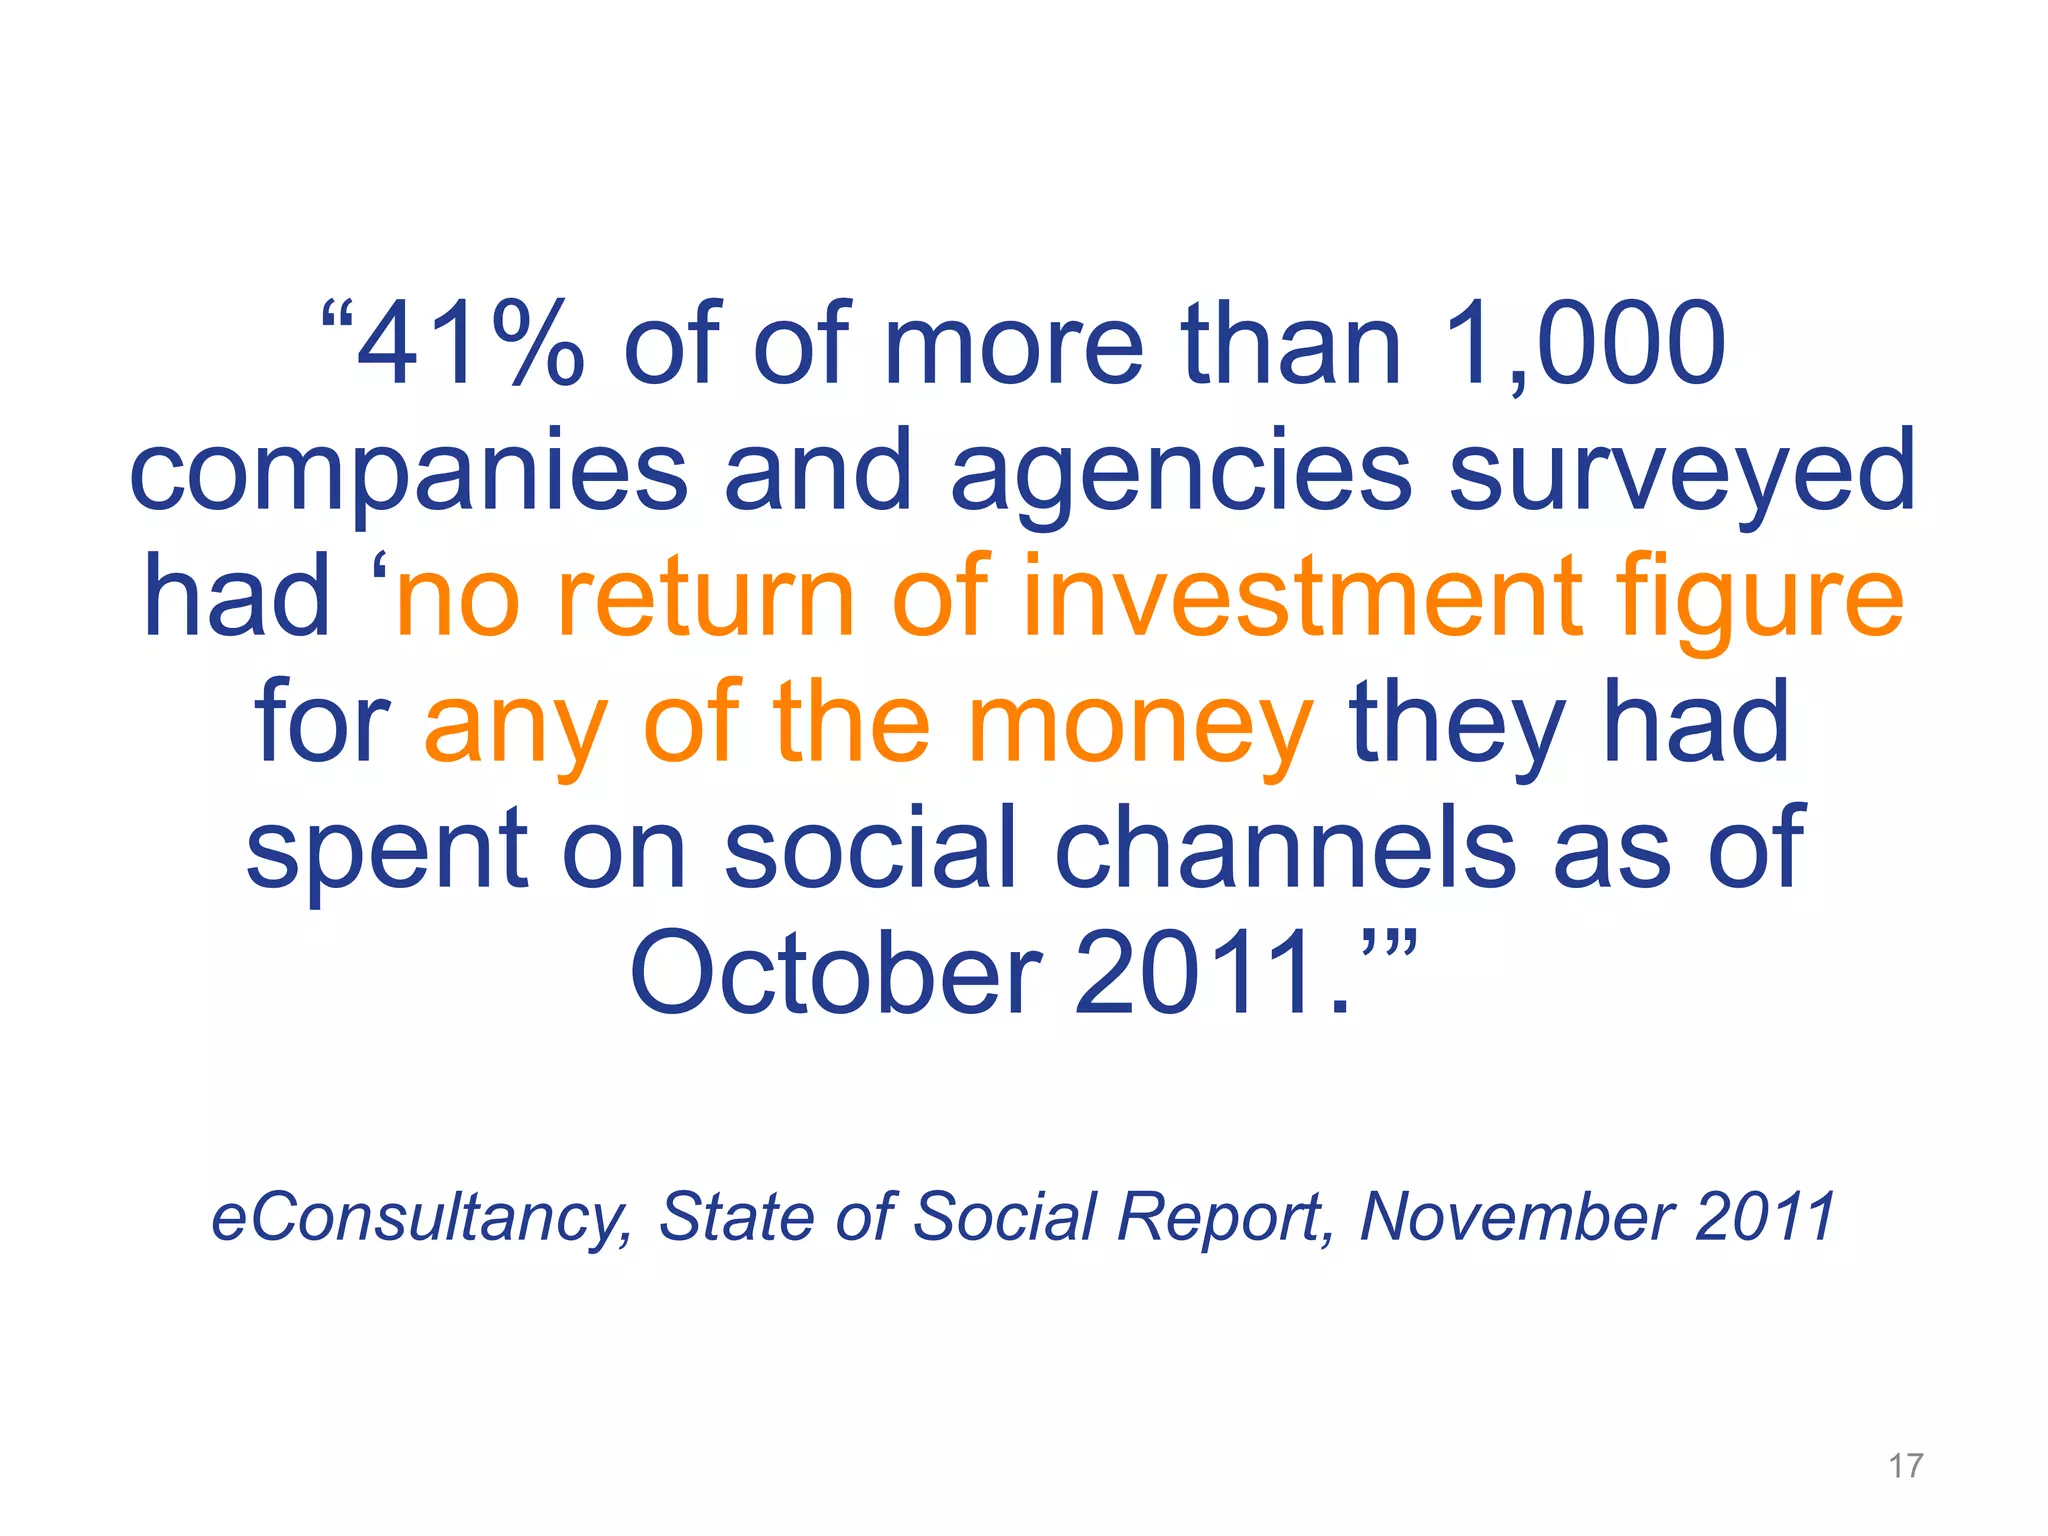
―41% of of more than 1,000
companies and agencies surveyed
had ‗no return of investment figure
  for any of the money they had
  spent on social channels as of
          October 2011.‘‖
 eConsultancy, State of Social Report, November 2011


                                                       17
“There is no single ROI
  for social media.”
Richard Binhammer, Dell Inc.
19


Measurement Challenges
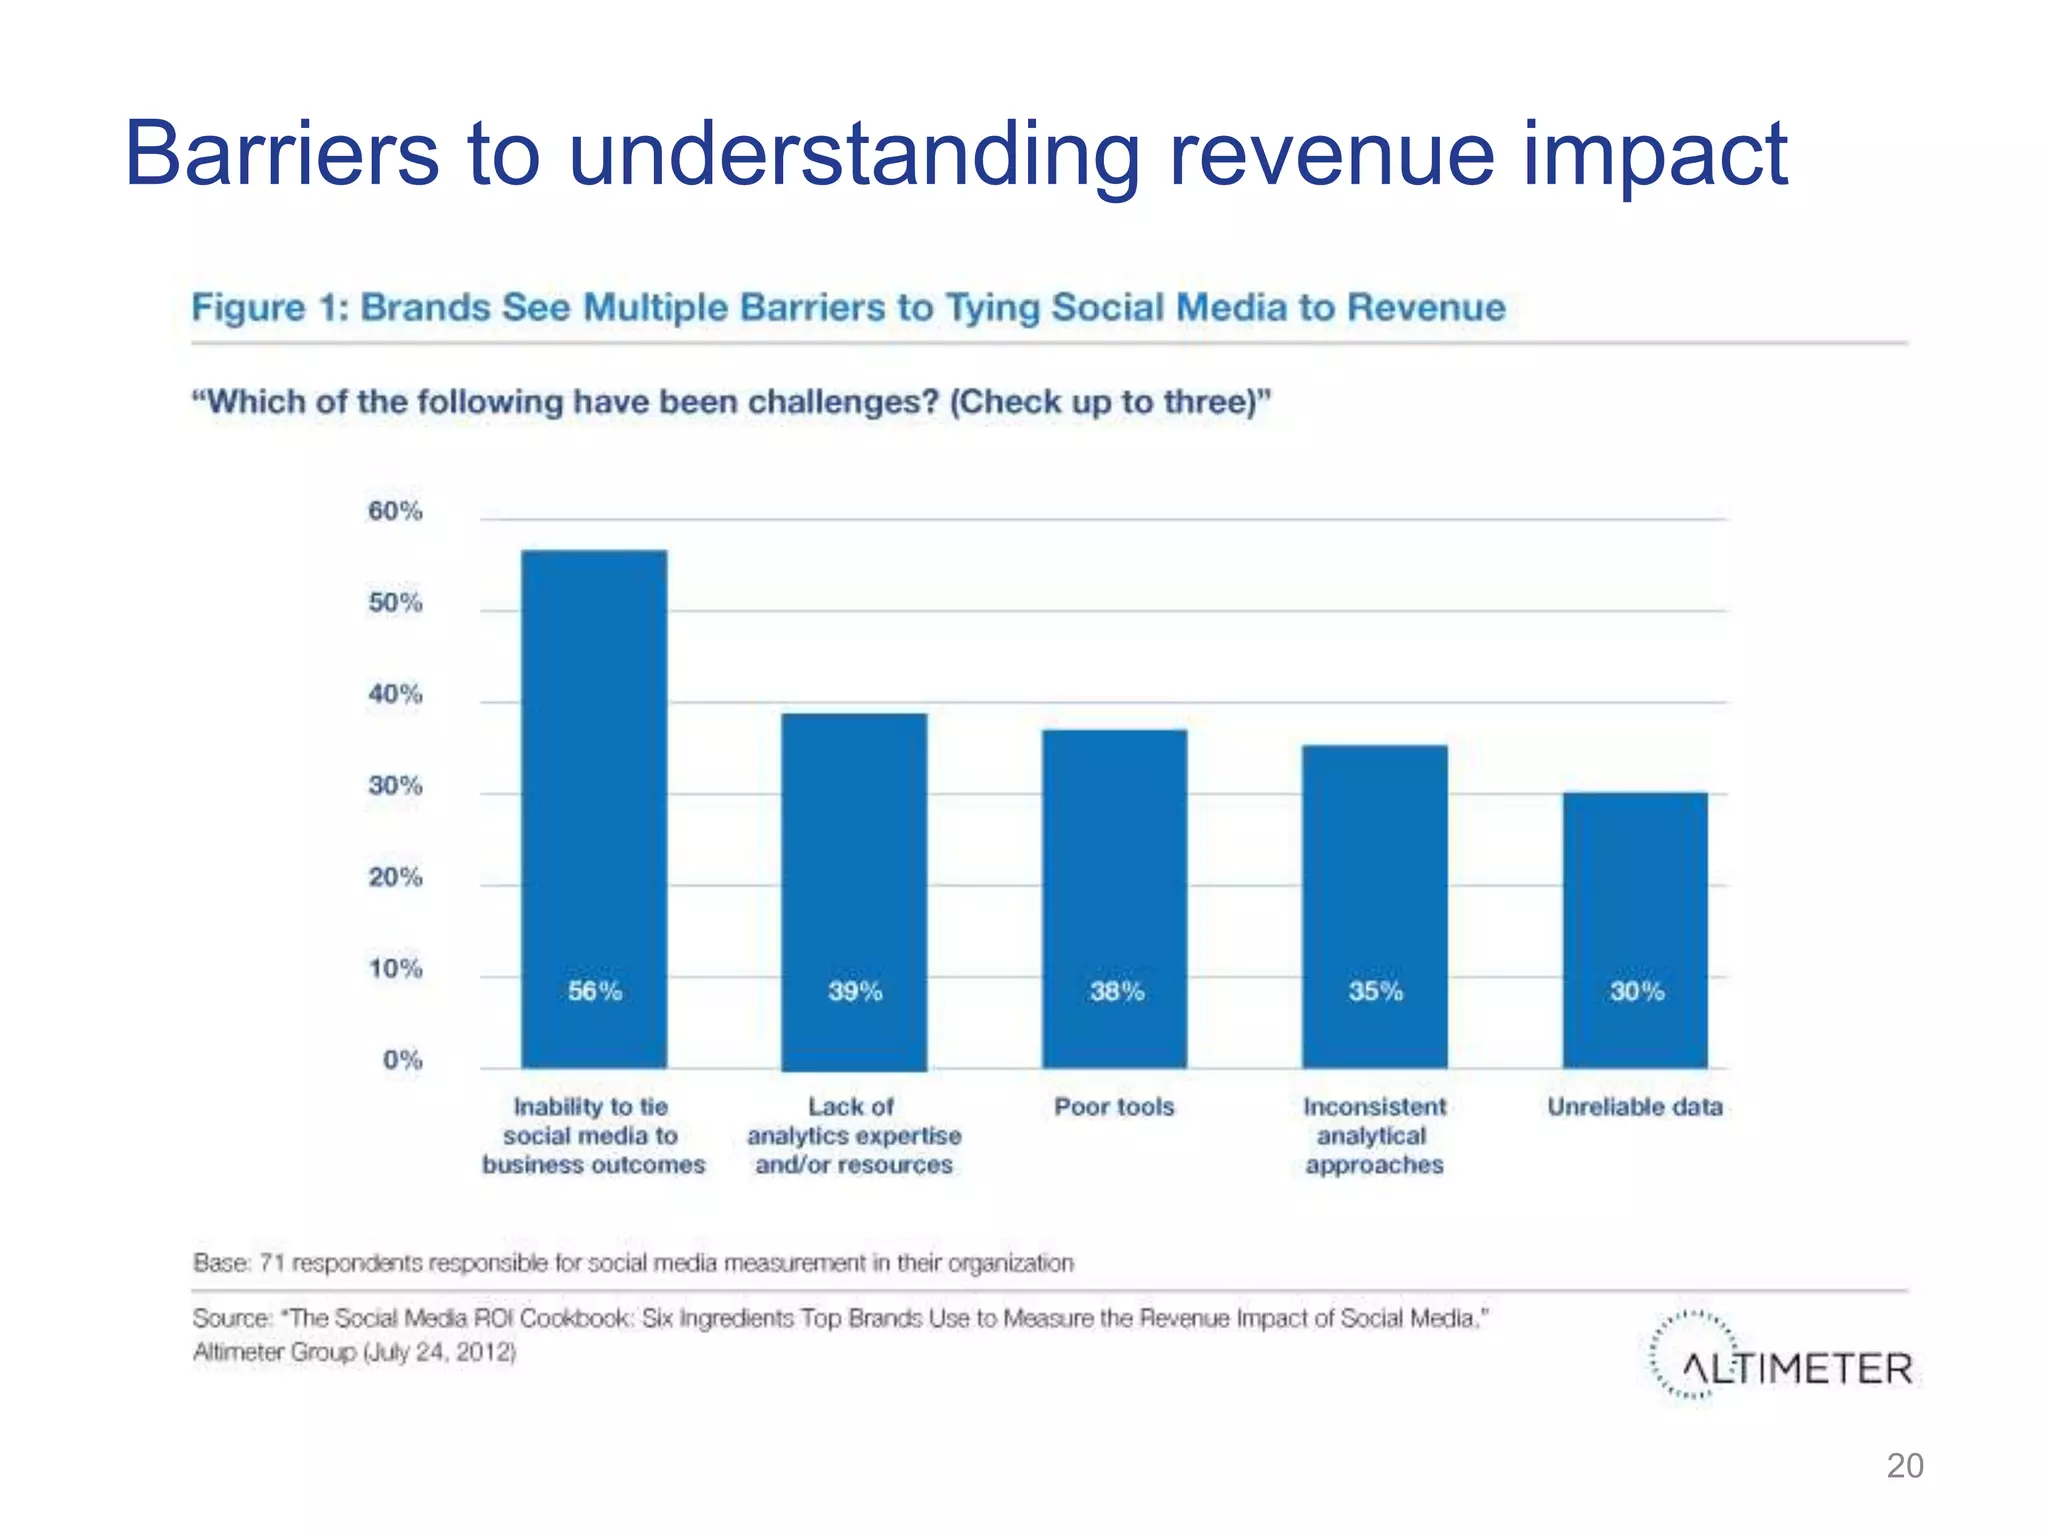
Barriers to understanding revenue impact


                                           20
21


How Companies Measure
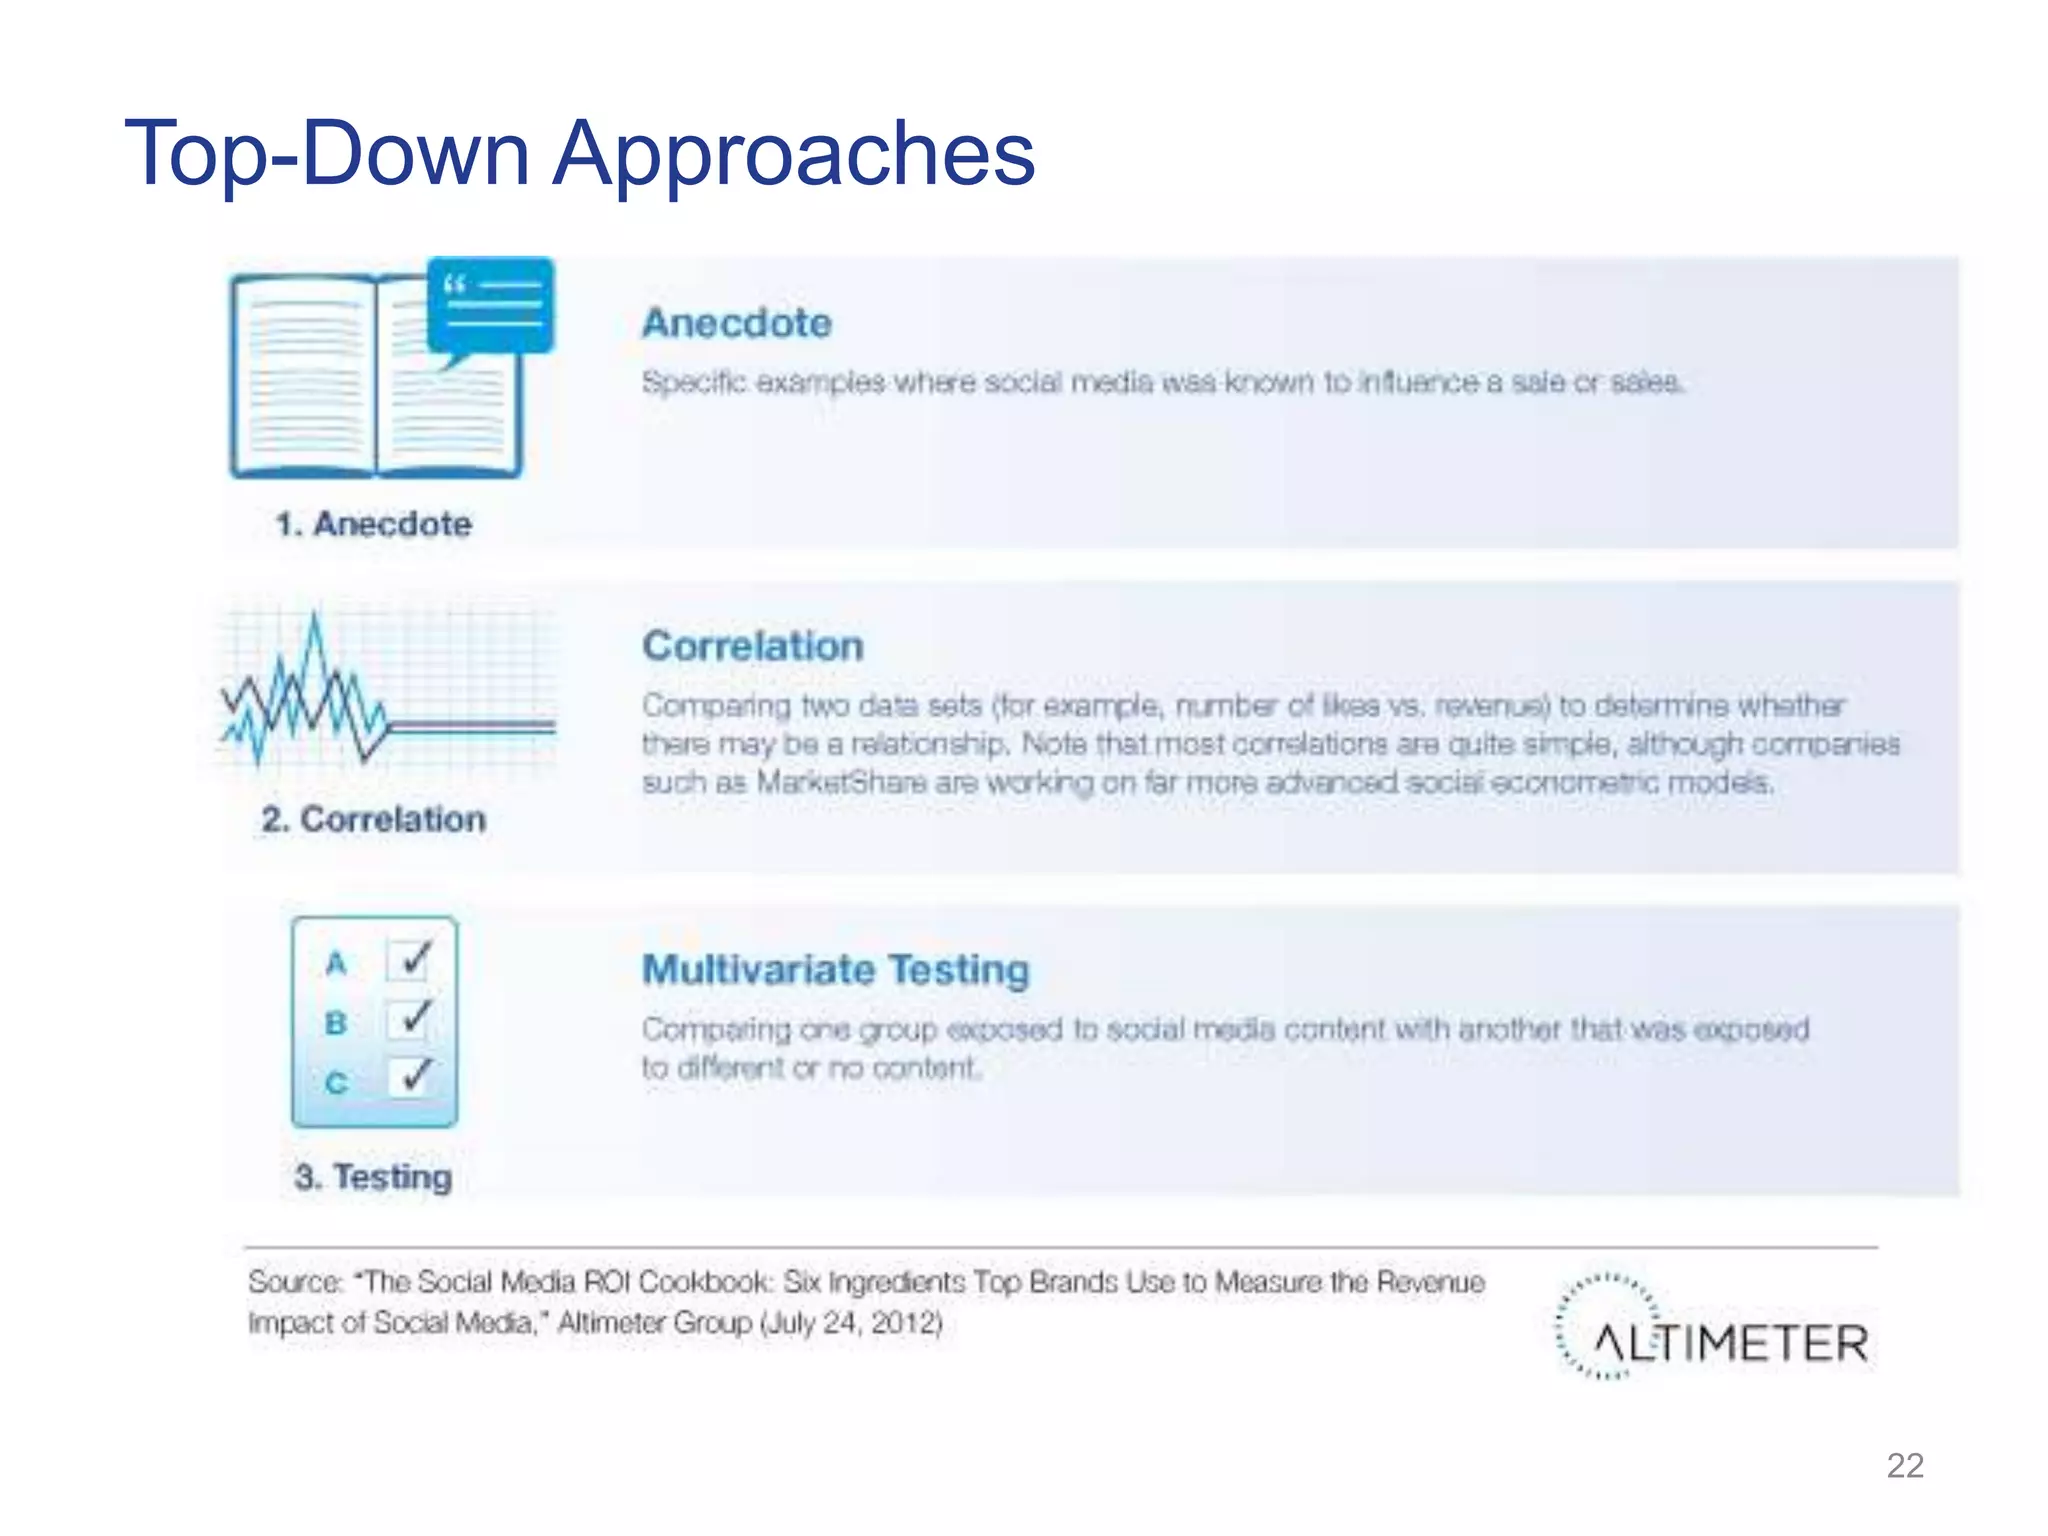
Top-Down Approaches


                      22
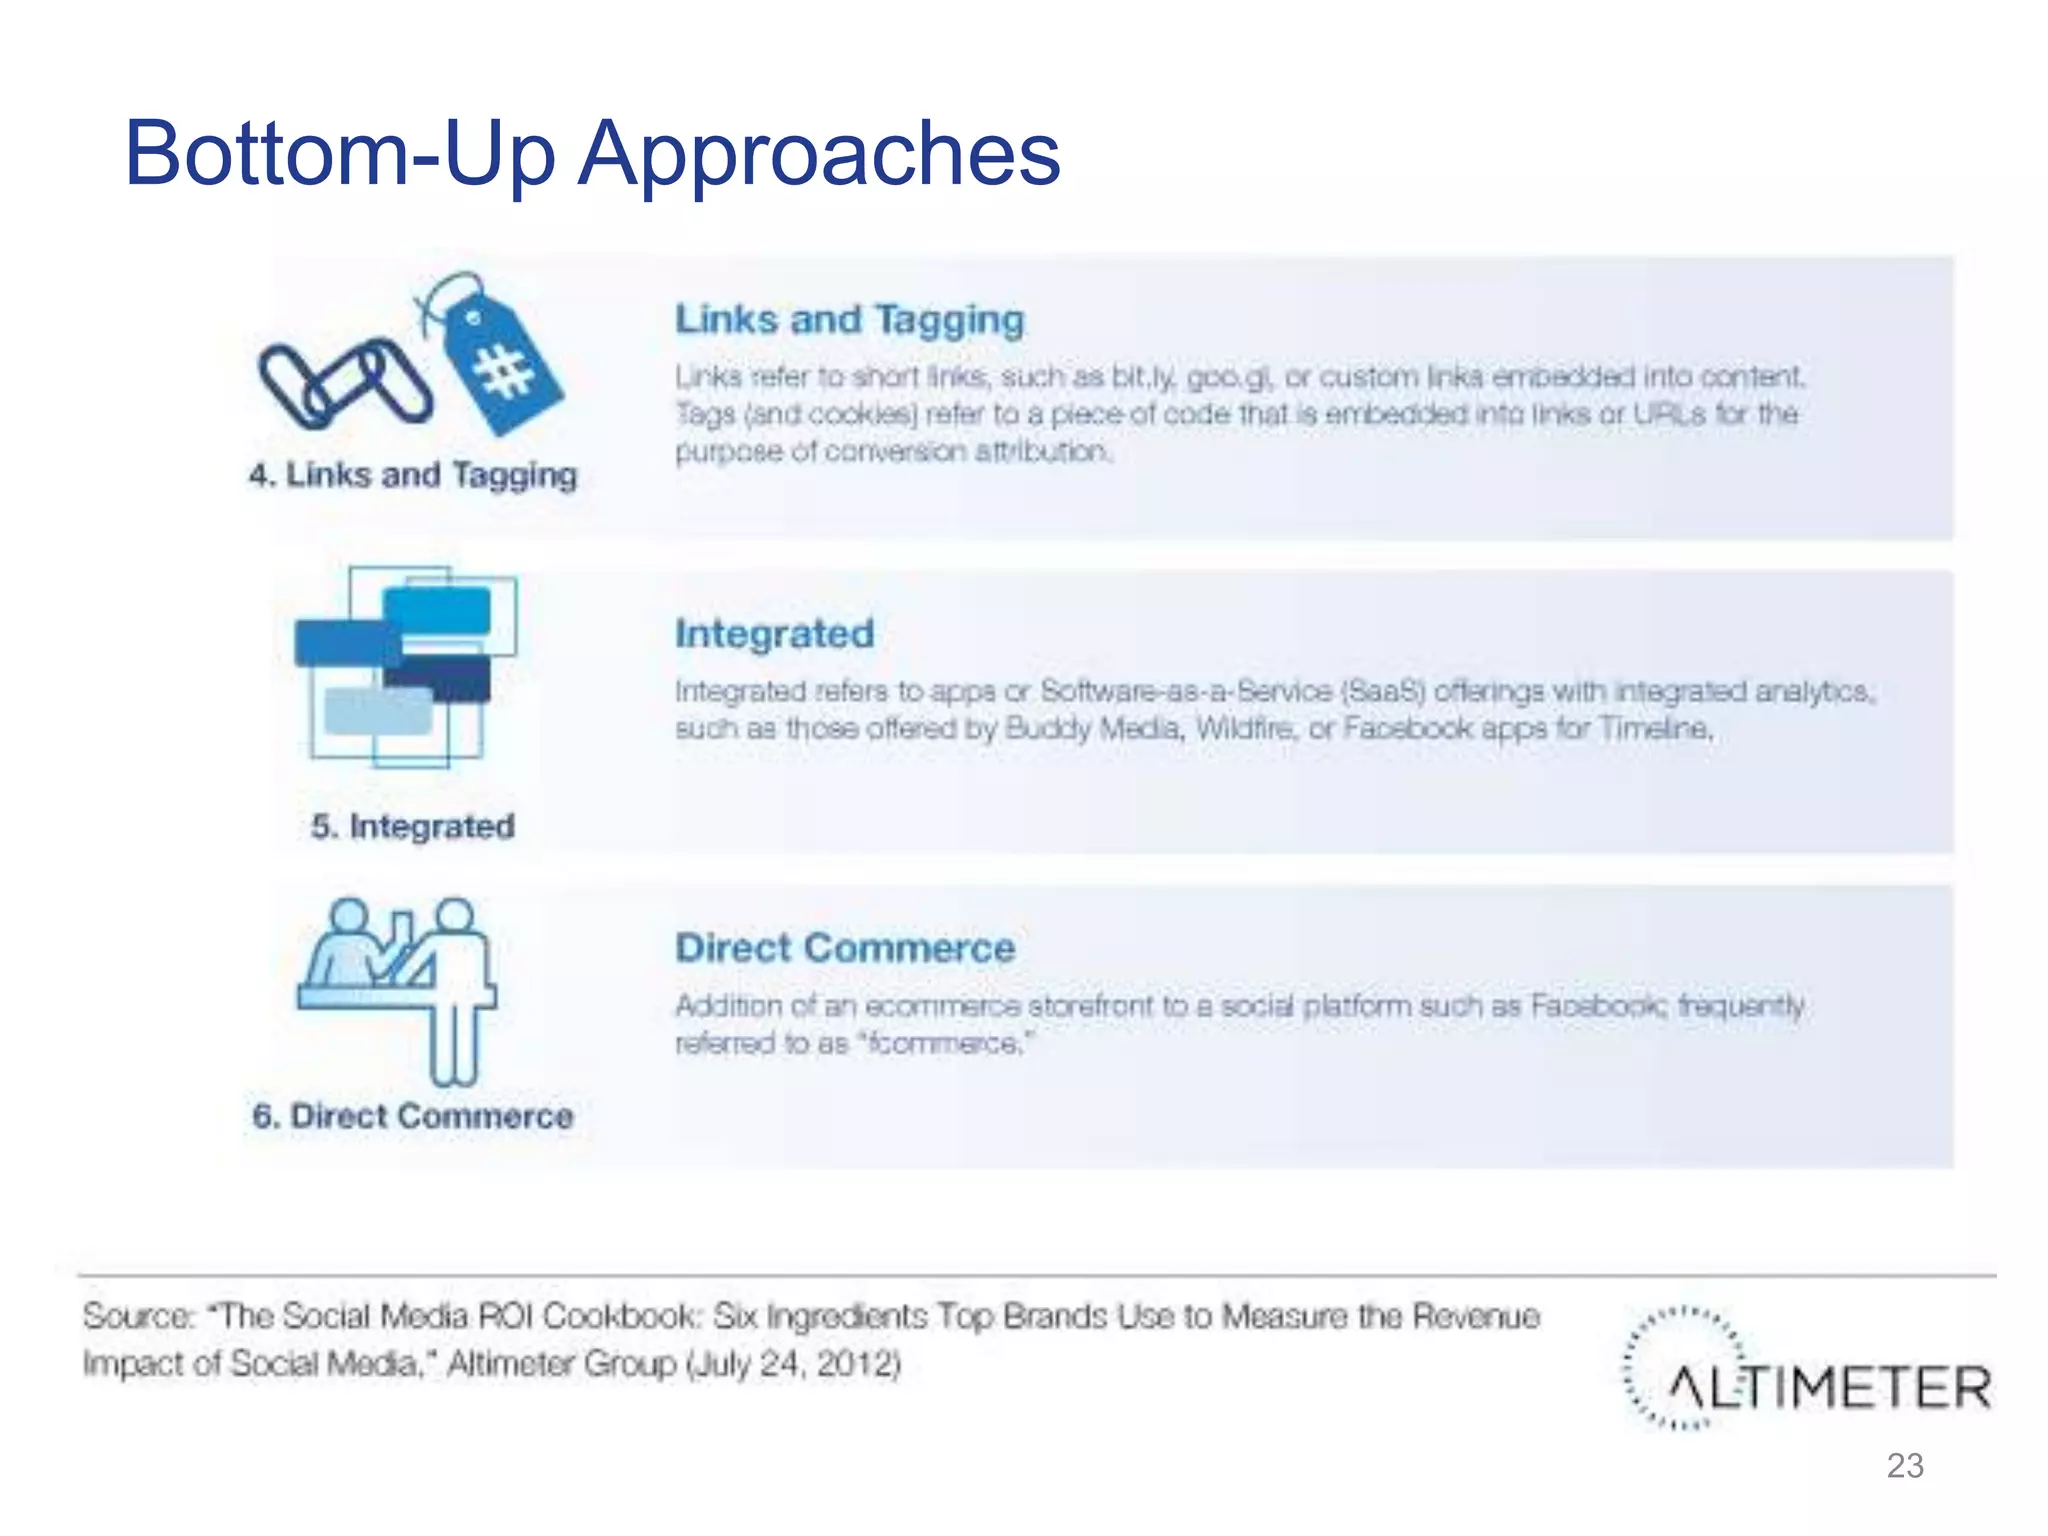
Bottom-Up Approaches


                       23
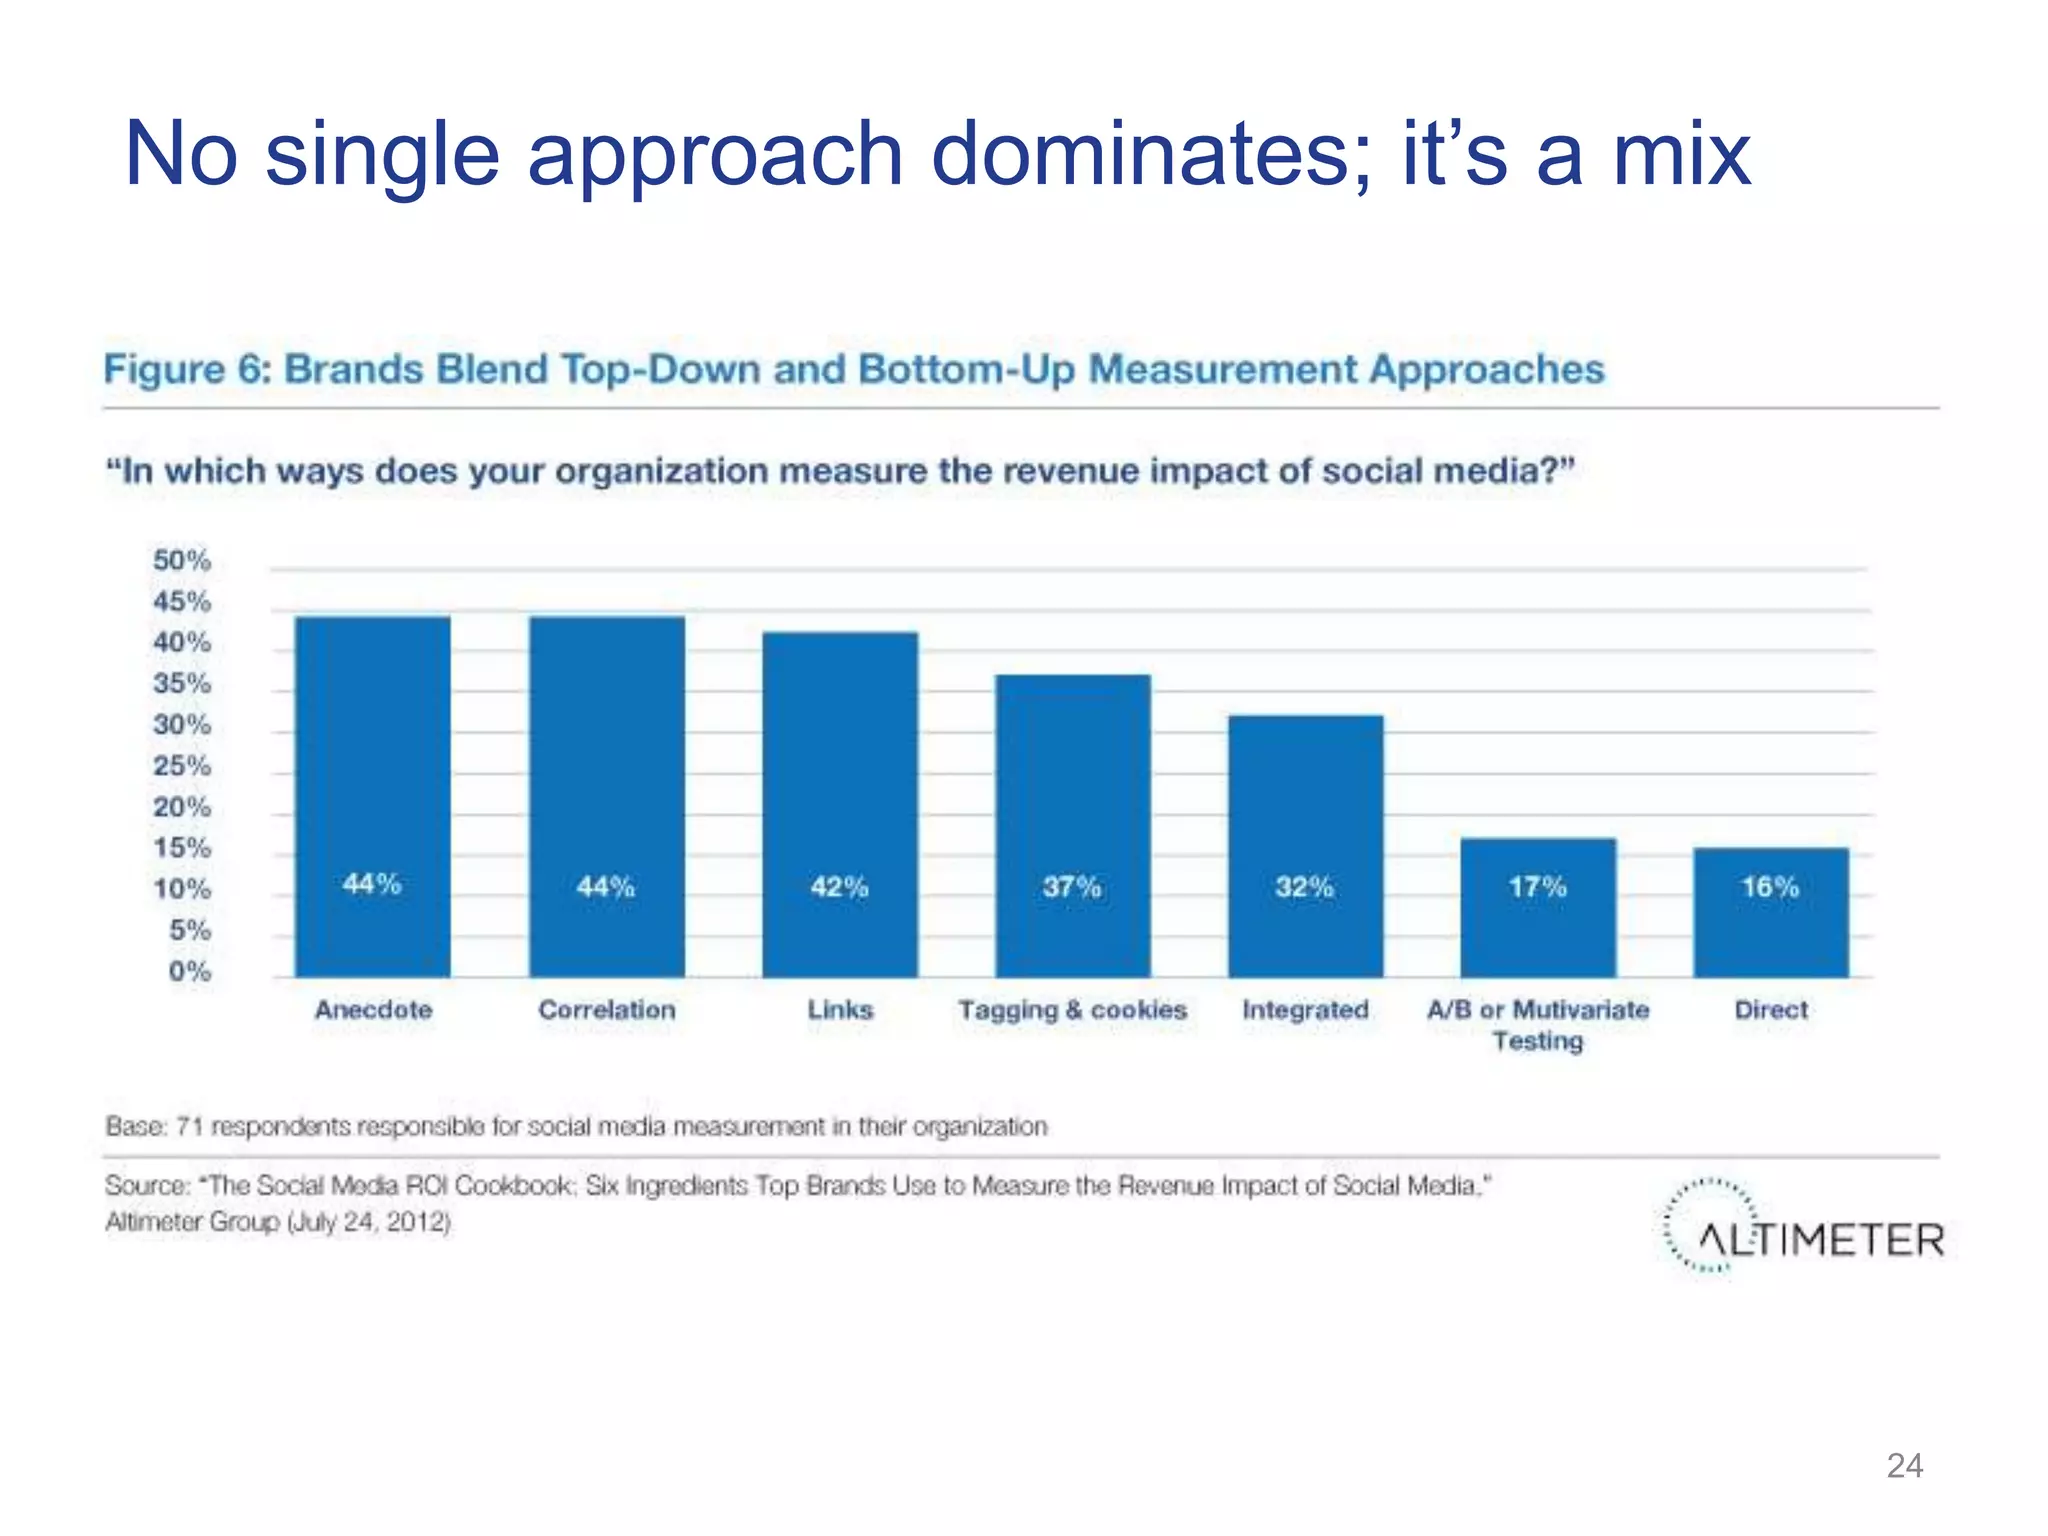
No single approach dominates; it‘s a mix


                                           24
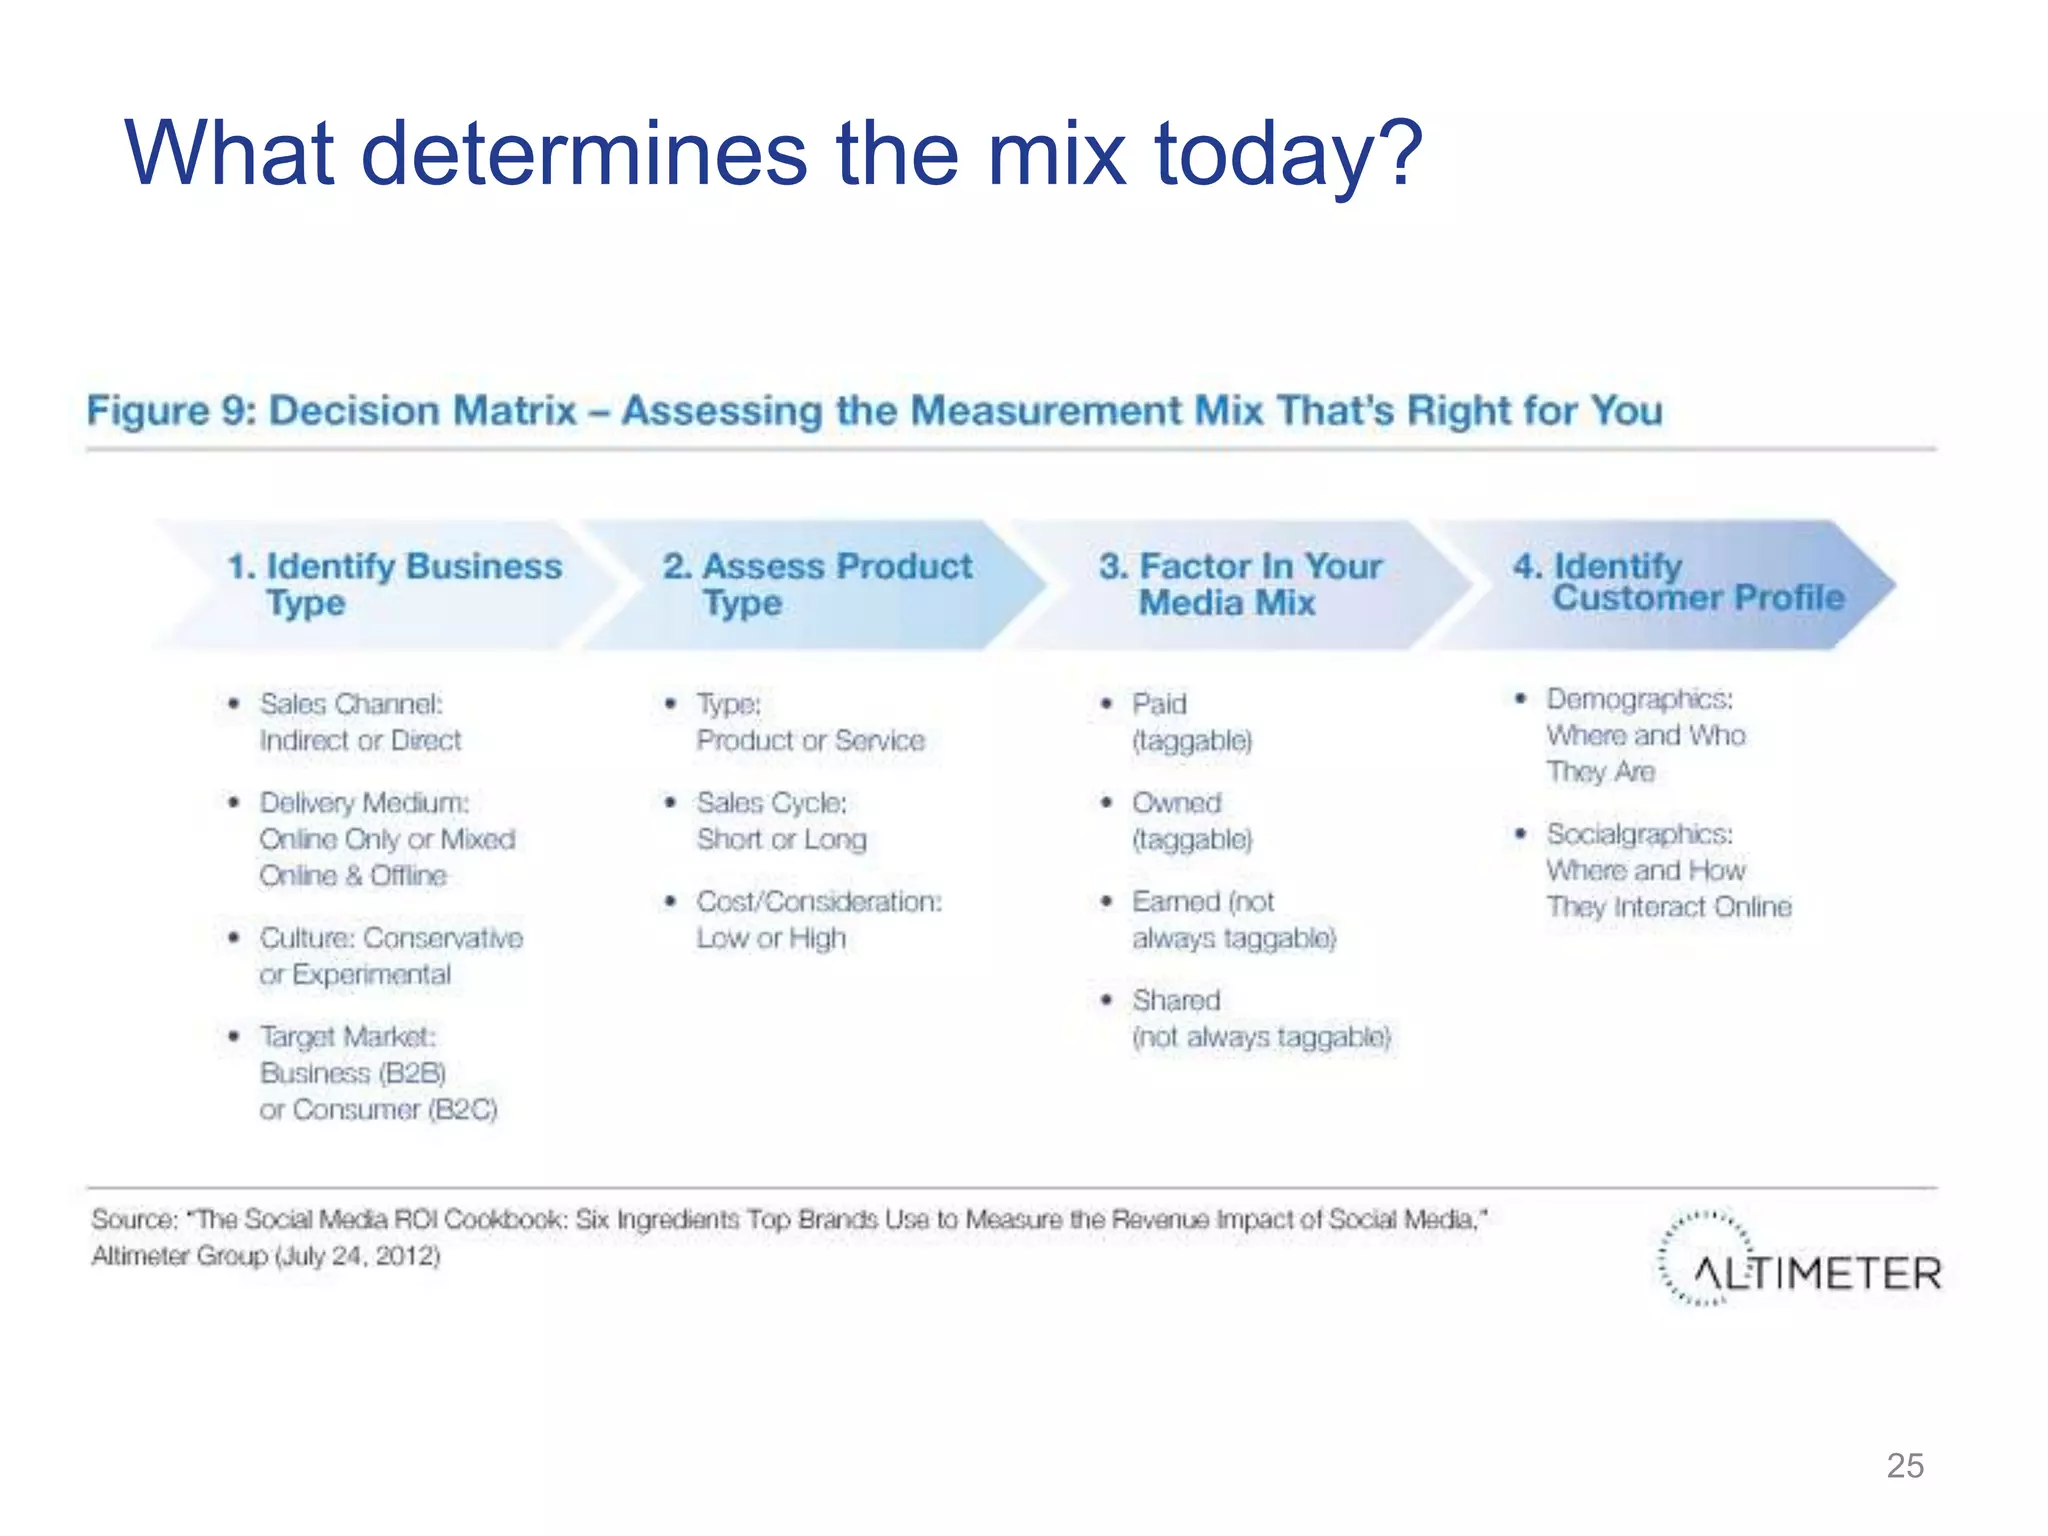
What determines the mix today?


                                 25
Examples


           26
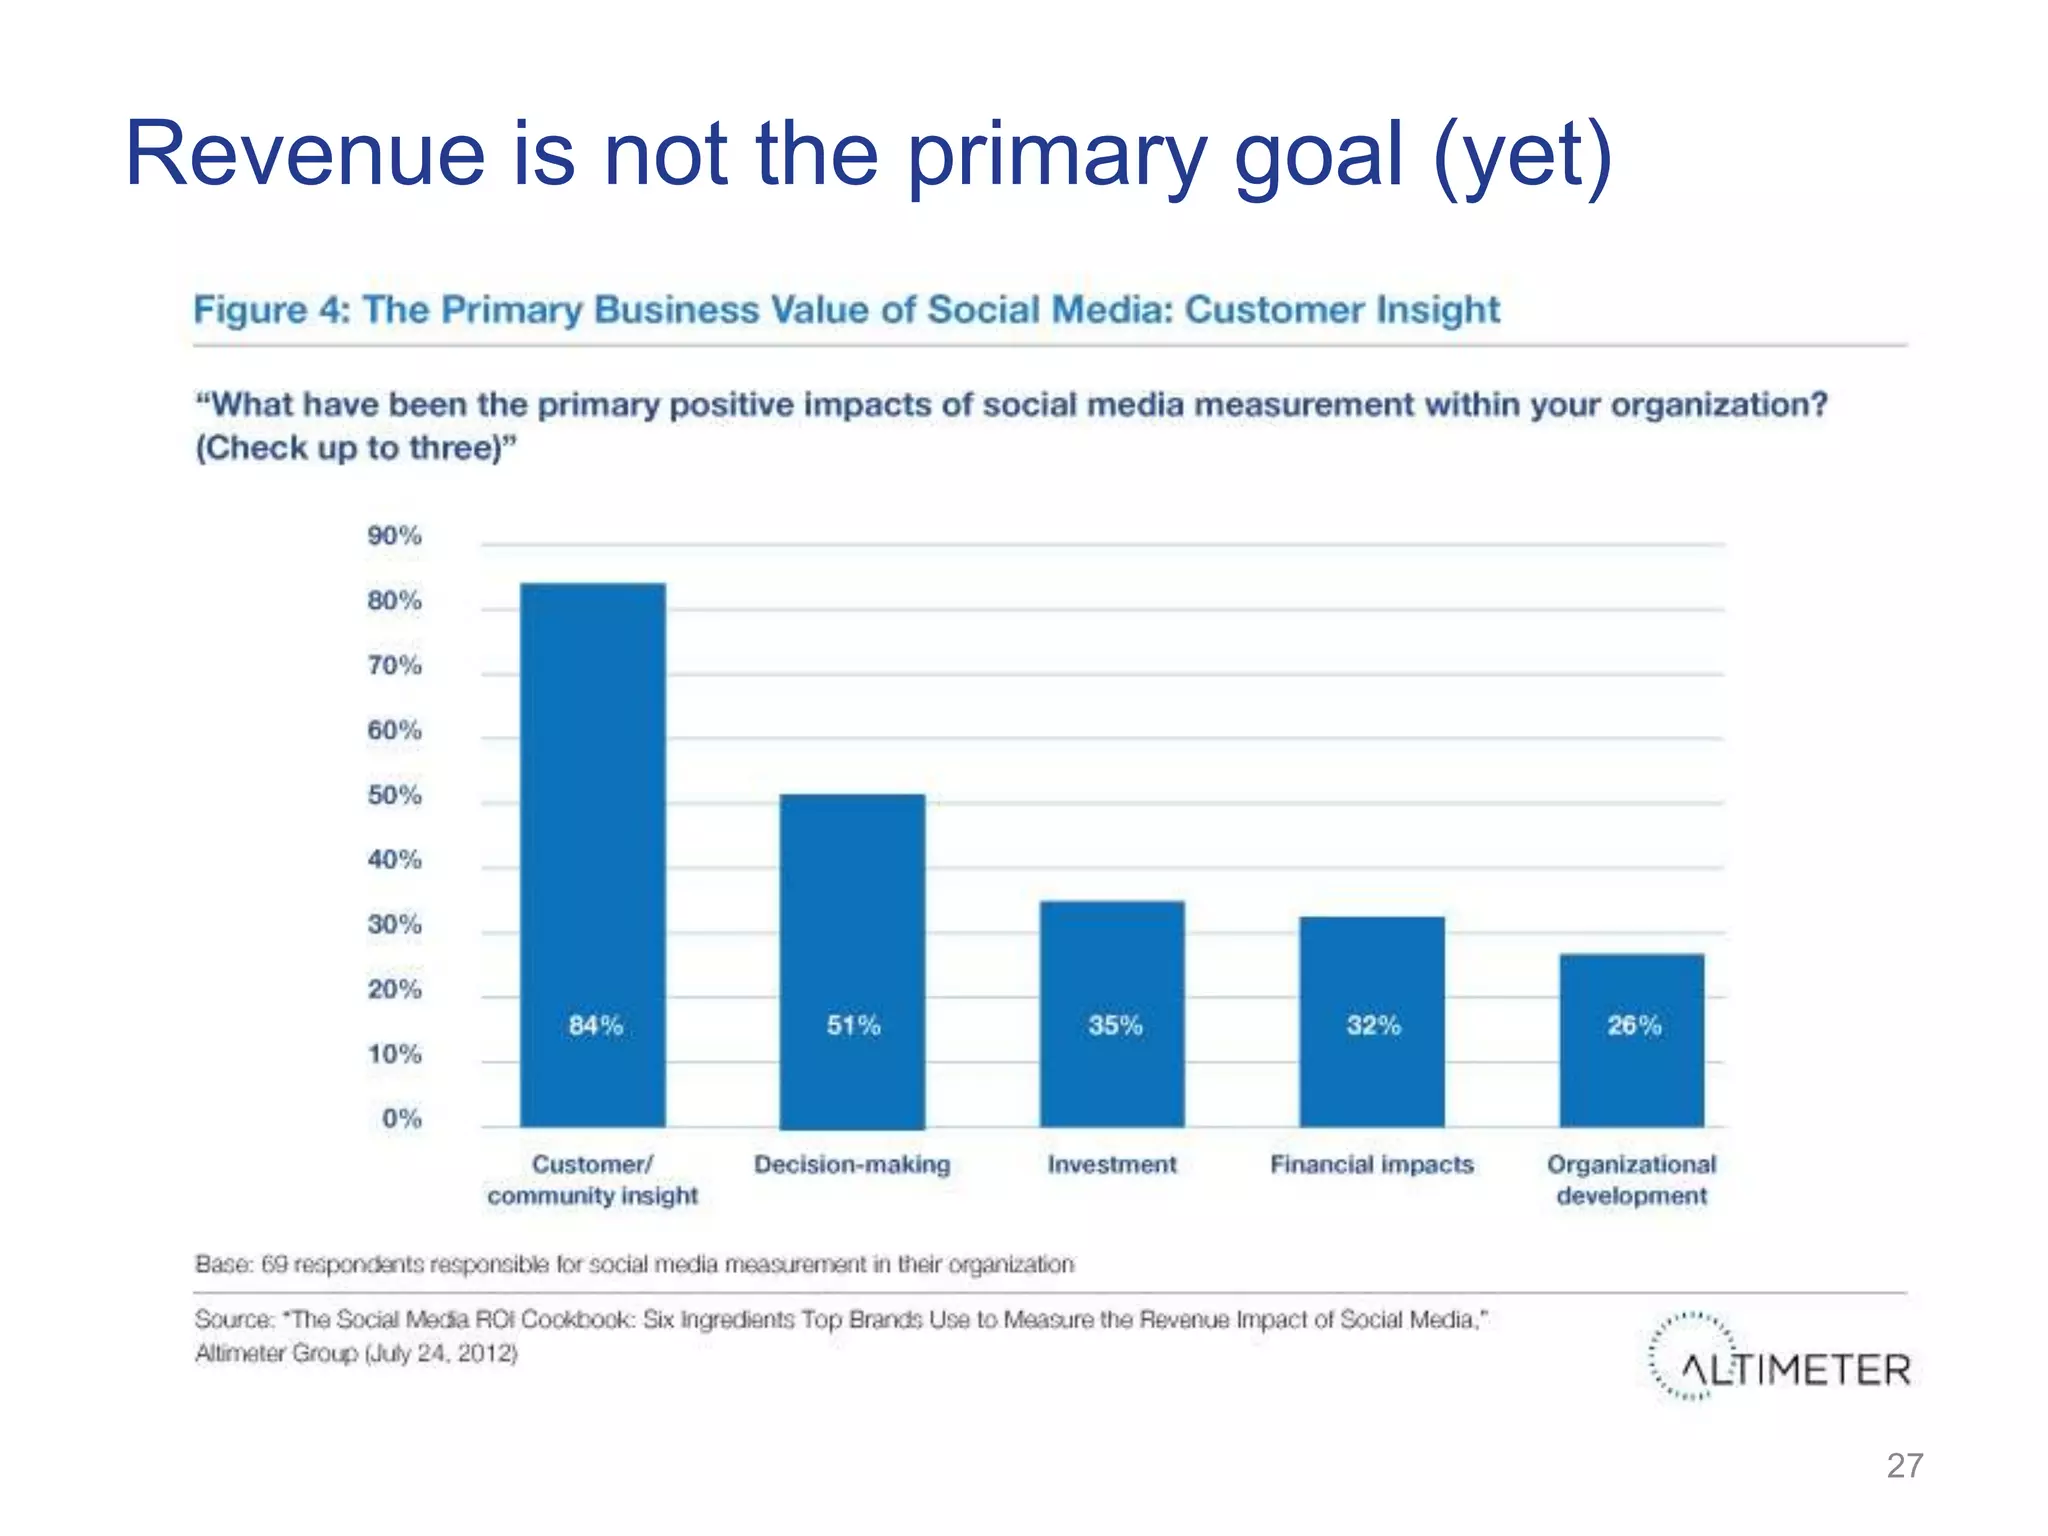
Revenue is not the primary goal (yet)


                                        27
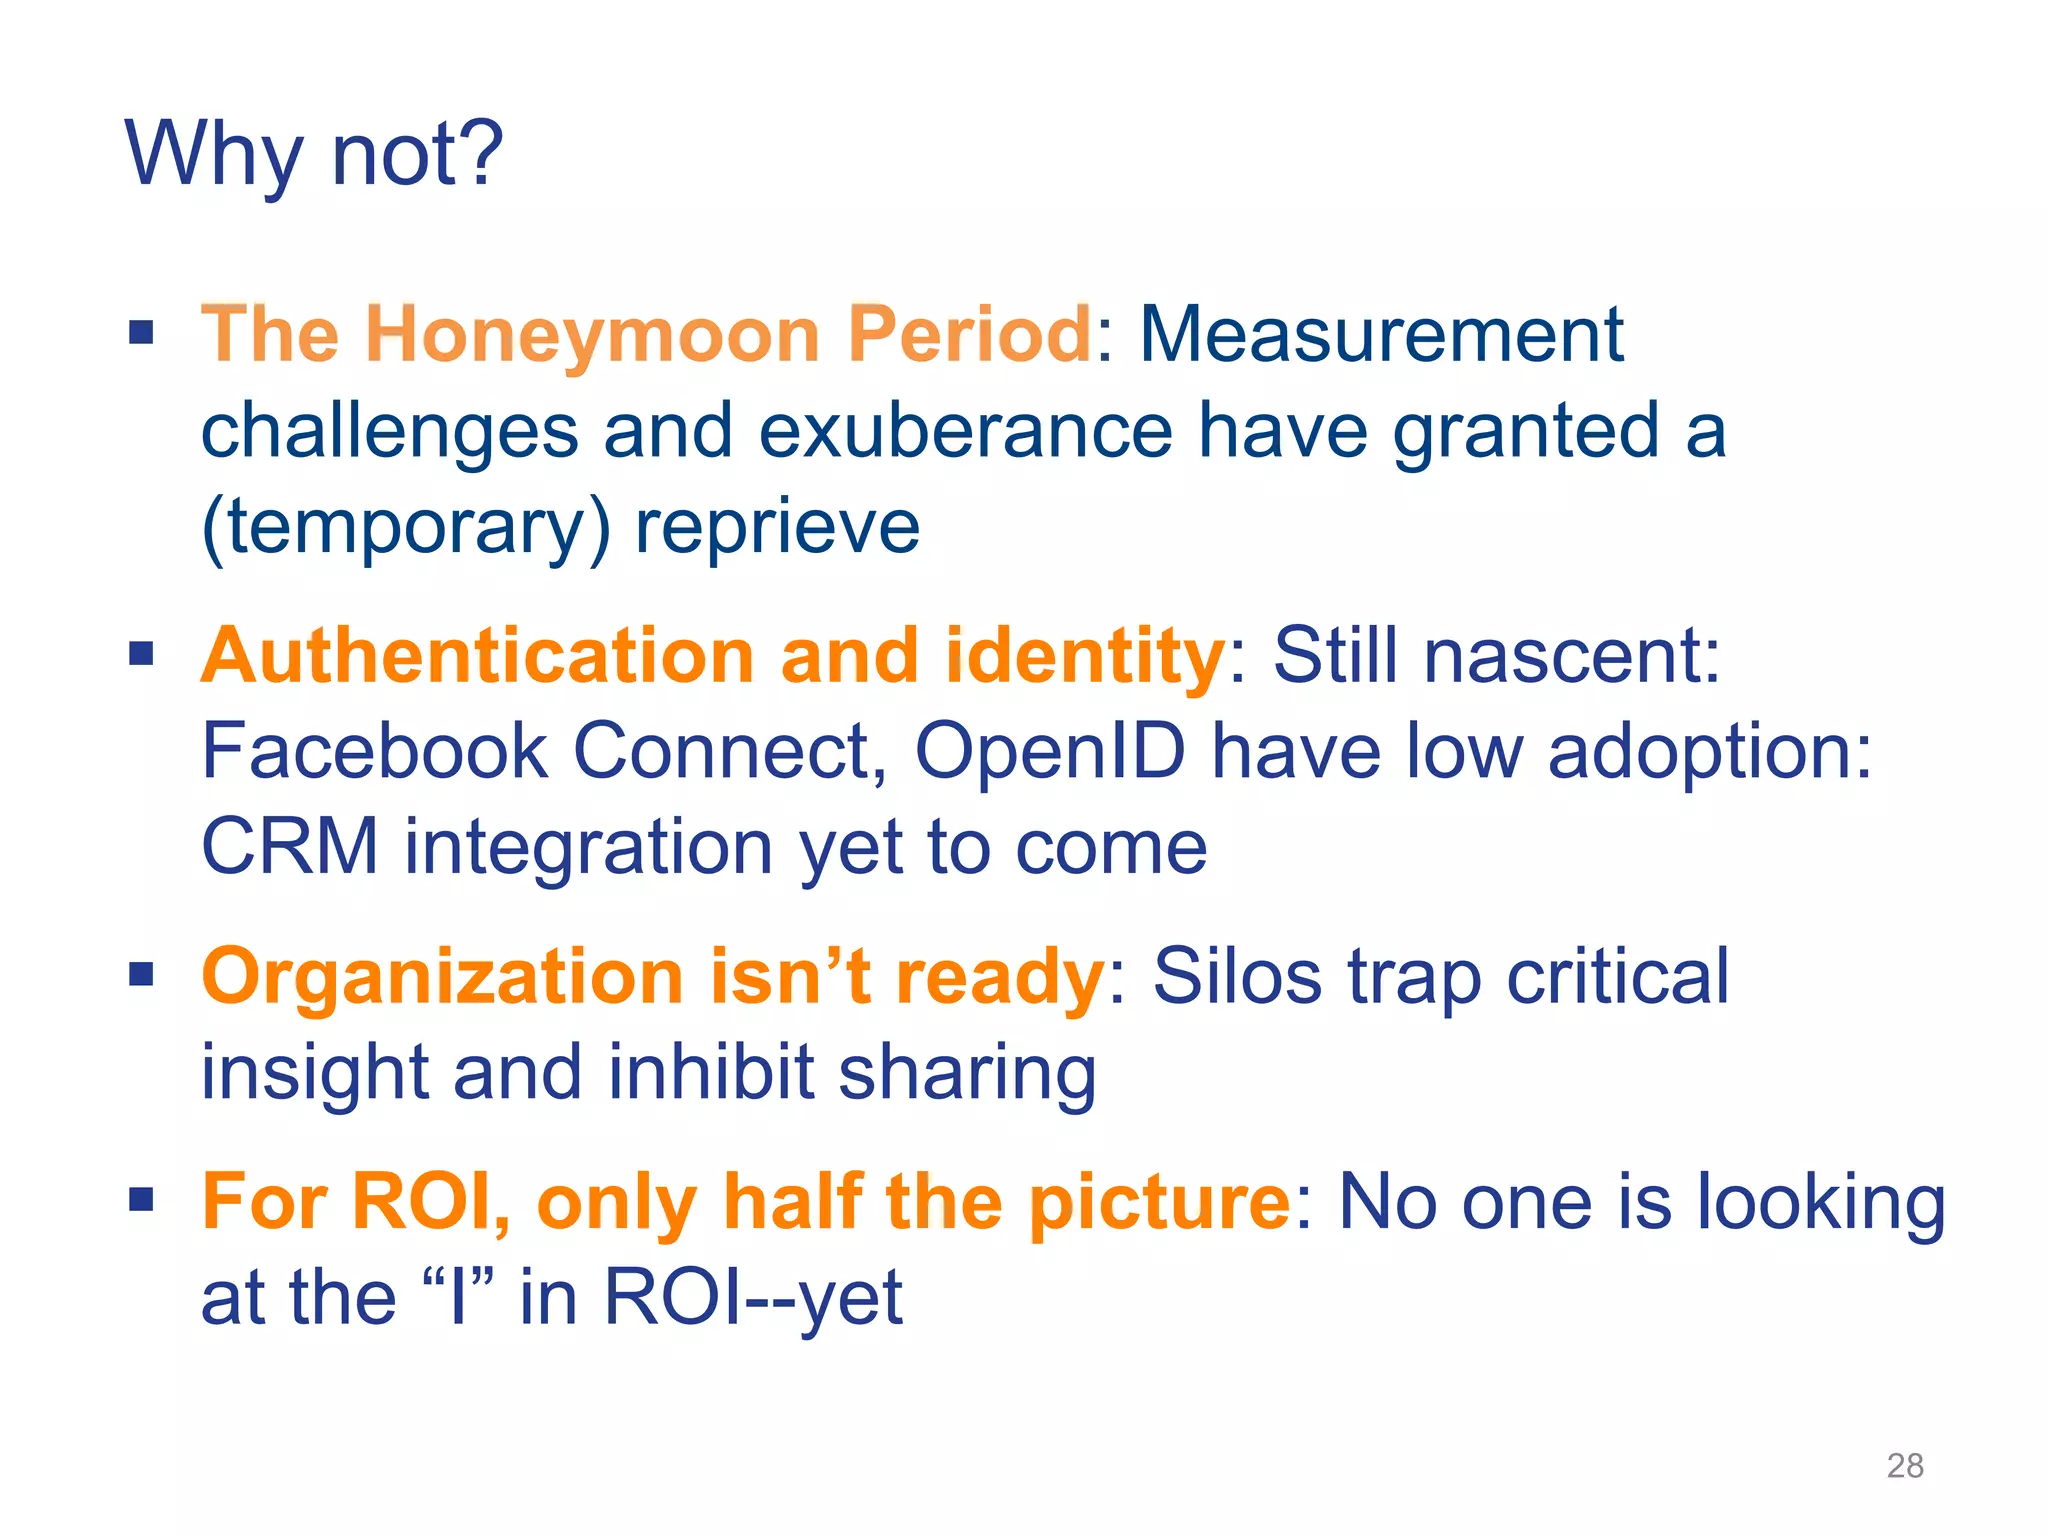
Why not?
 The Honeymoon Period: Measurement
  challenges and exuberance have granted a
  (temporary) reprieve
 Authentication and identity: Still nascent:
  Facebook Connect, OpenID have low adoption:
  CRM integration yet to come
 Organization isn’t ready: Silos trap critical
  insight and inhibit sharing
 For ROI, only half the picture: No one is looking
  at the ―I‖ in ROI--yet
                                                  28
29


What’s Next?
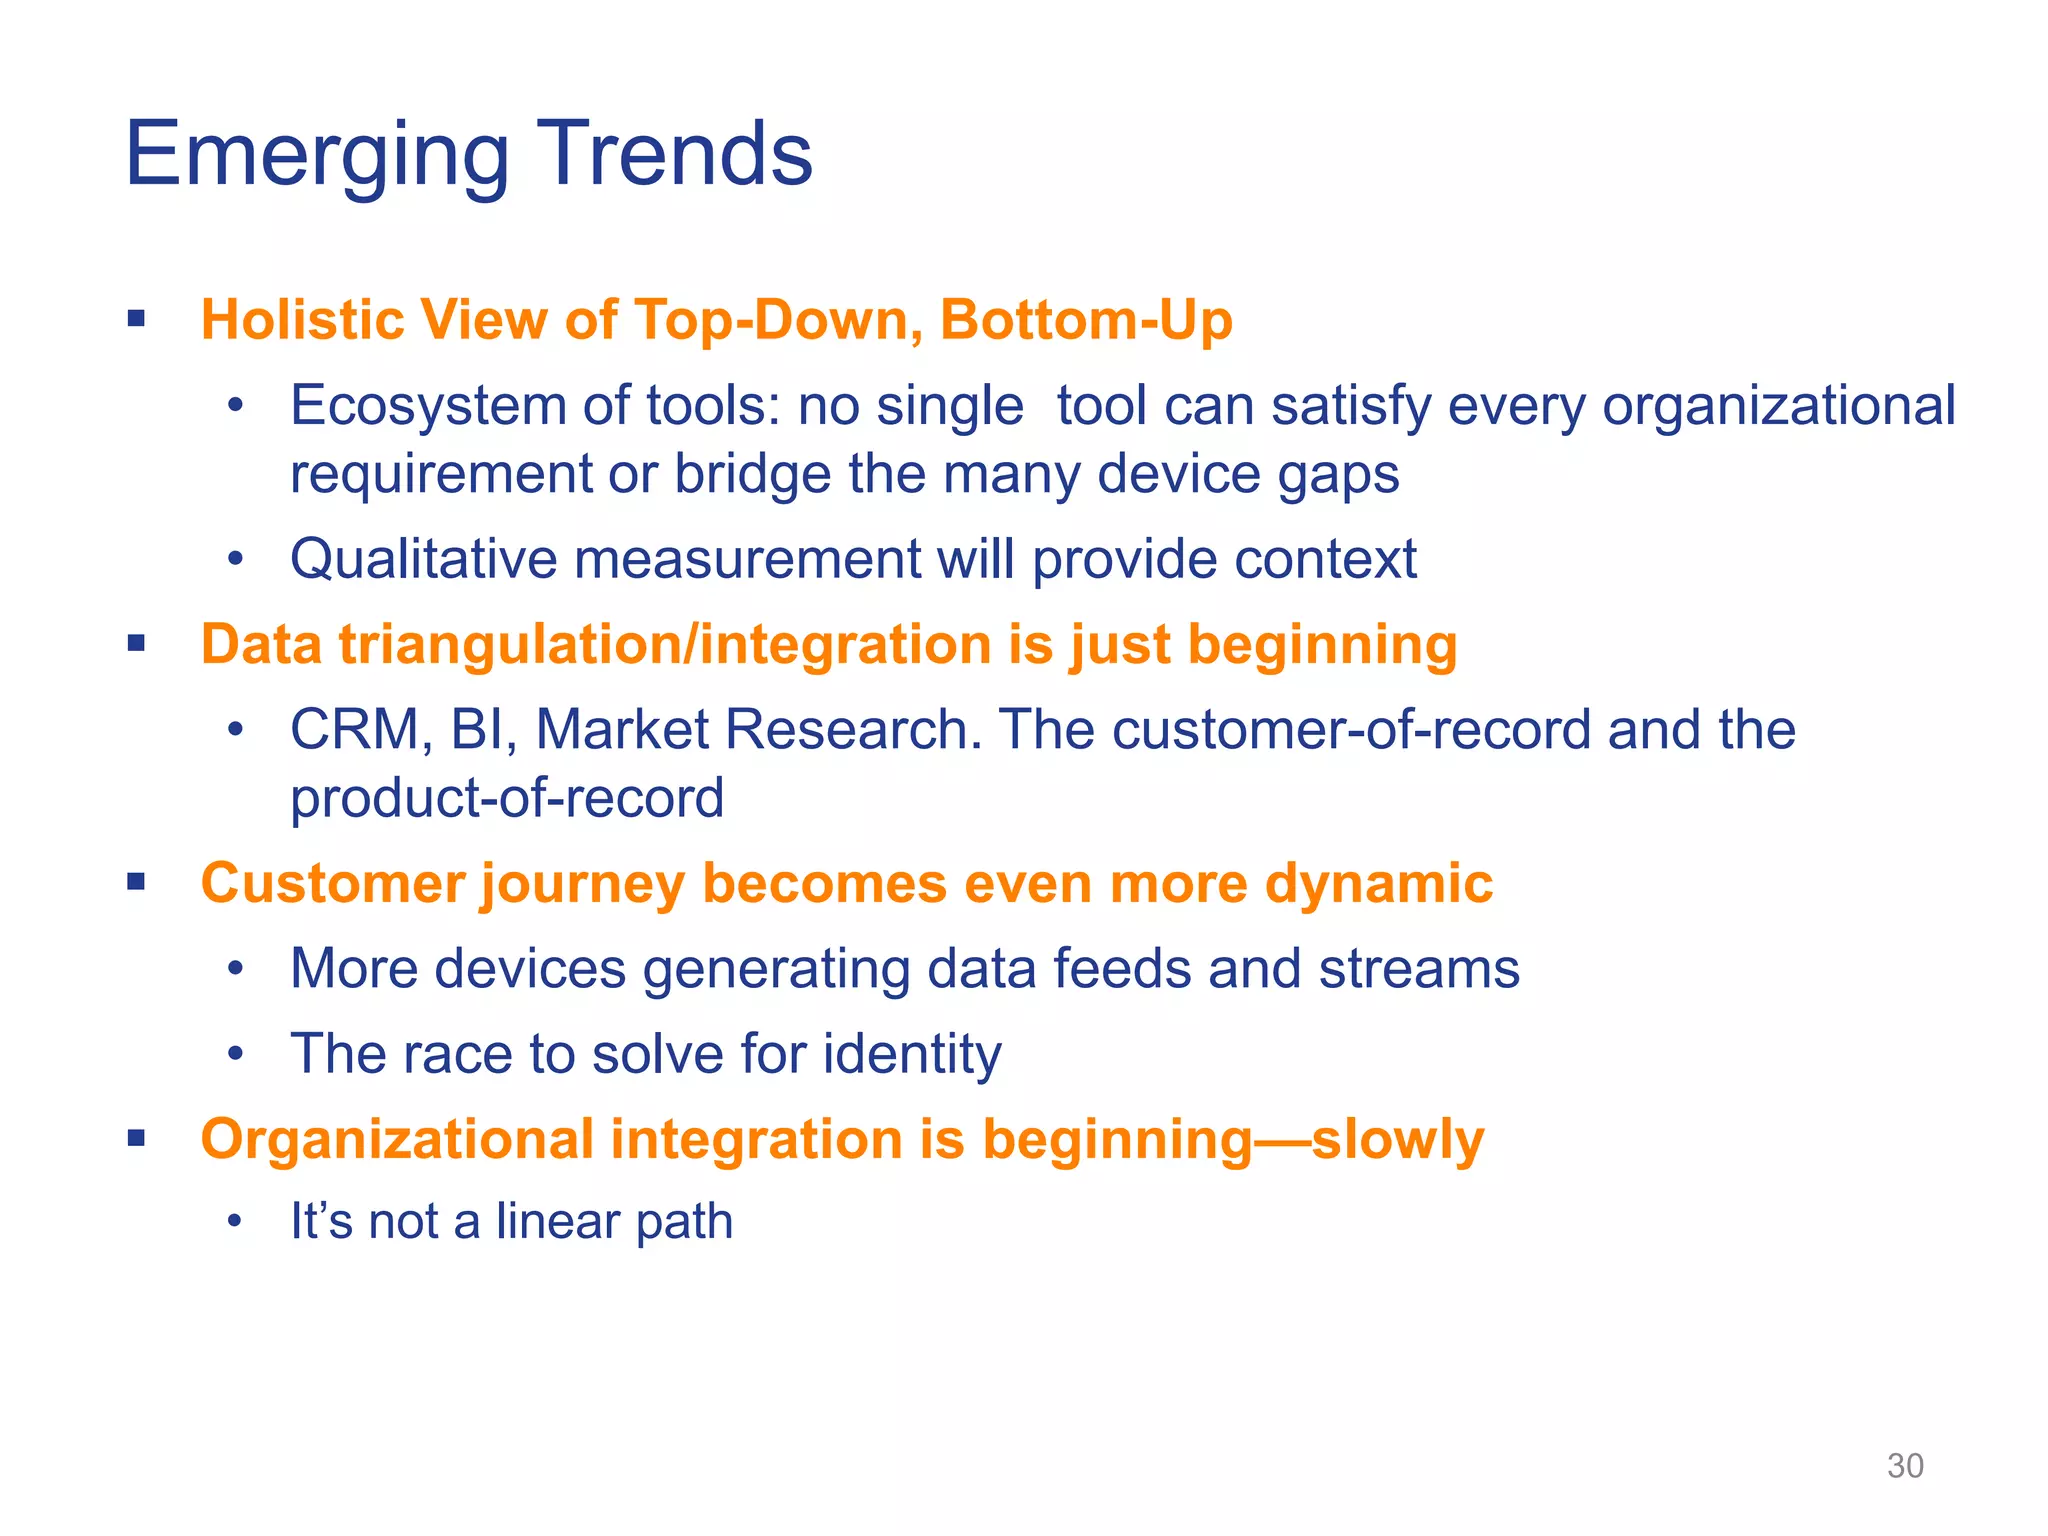
Emerging Trends
 Holistic View of Top-Down, Bottom-Up
   • Ecosystem of tools: no single tool can satisfy every organizational
     requirement or bridge the many device gaps
   • Qualitative measurement will provide context
 Data triangulation/integration is just beginning
   • CRM, BI, Market Research. The customer-of-record and the
     product-of-record
 Customer journey becomes even more dynamic
   • More devices generating data feeds and streams
   • The race to solve for identity
 Organizational integration is beginning—slowly
    • It‘s not a linear path


                                                                     30
―I feel like we‘re all data chemists at
this point, trying to put a bunch of stuff
  into our beakers to see if it works.‖
             − Ken Burbary
  Chief Digital Officer, Campbell Ewald


                                             31
Q&A
• Which business goals is most important for
  your company? What’s secondary? Tertiary?
  – Operational Efficiency
  – Marketing Optimization
  – Innovation
  – Revenue Generation
  – Brand Health
  – Customer Experience
Working with Data: Best
Practices in Analytics
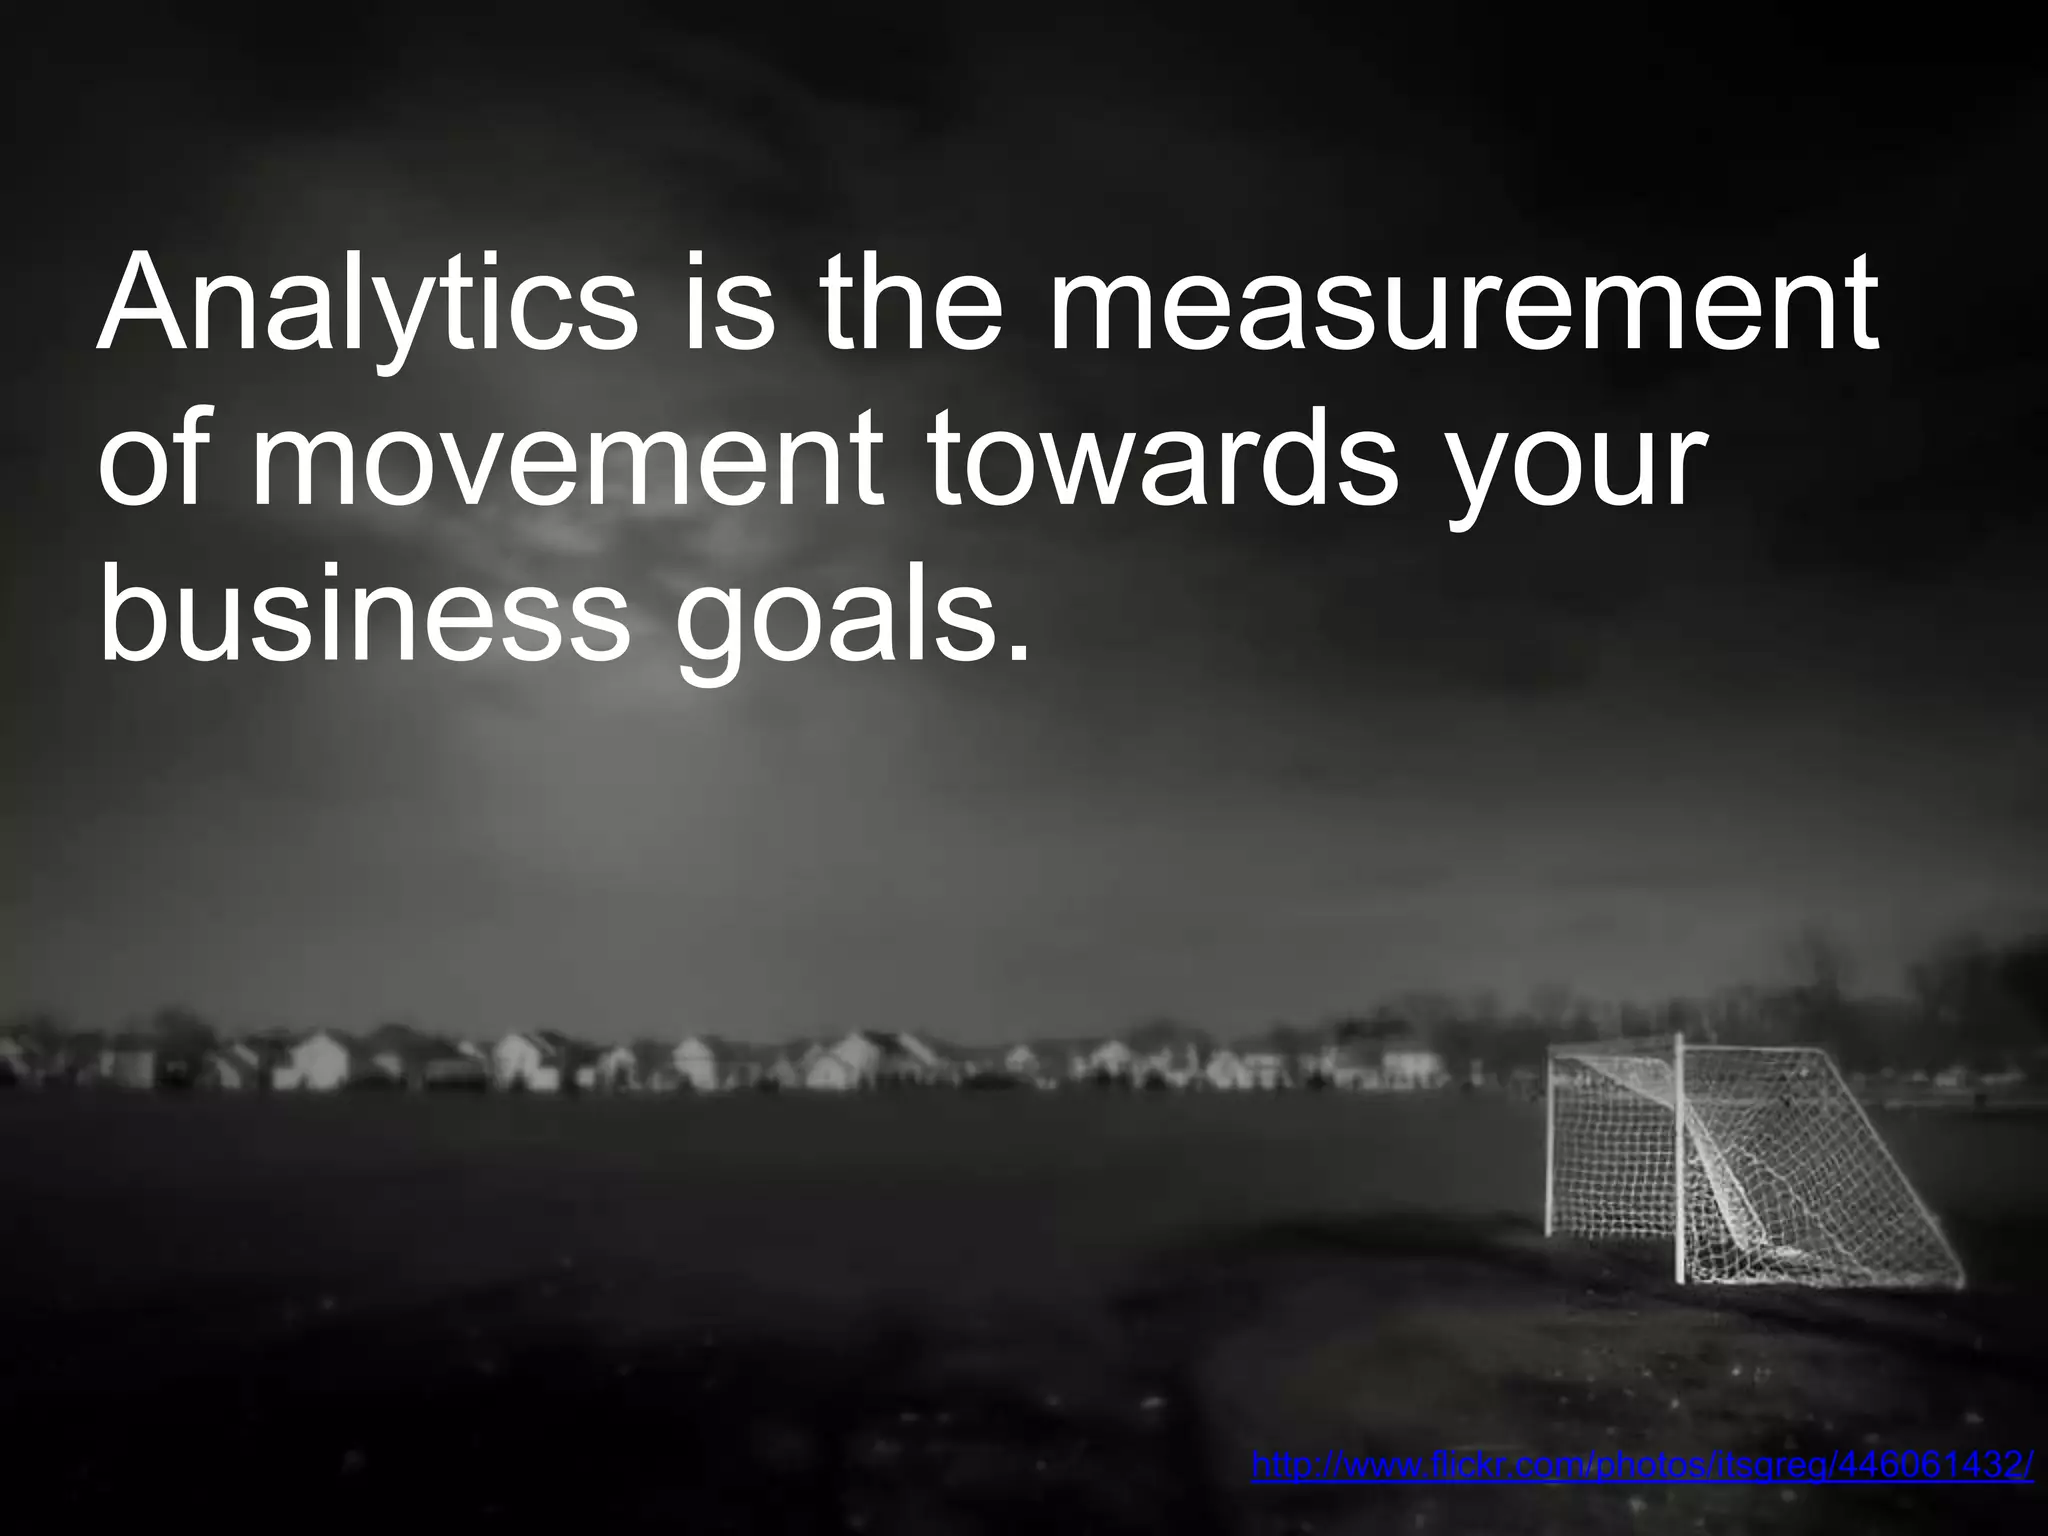
Analytics is the measurement
of movement towards your
business goals.


                  http://www.flickr.com/photos/itsgreg/446061432/
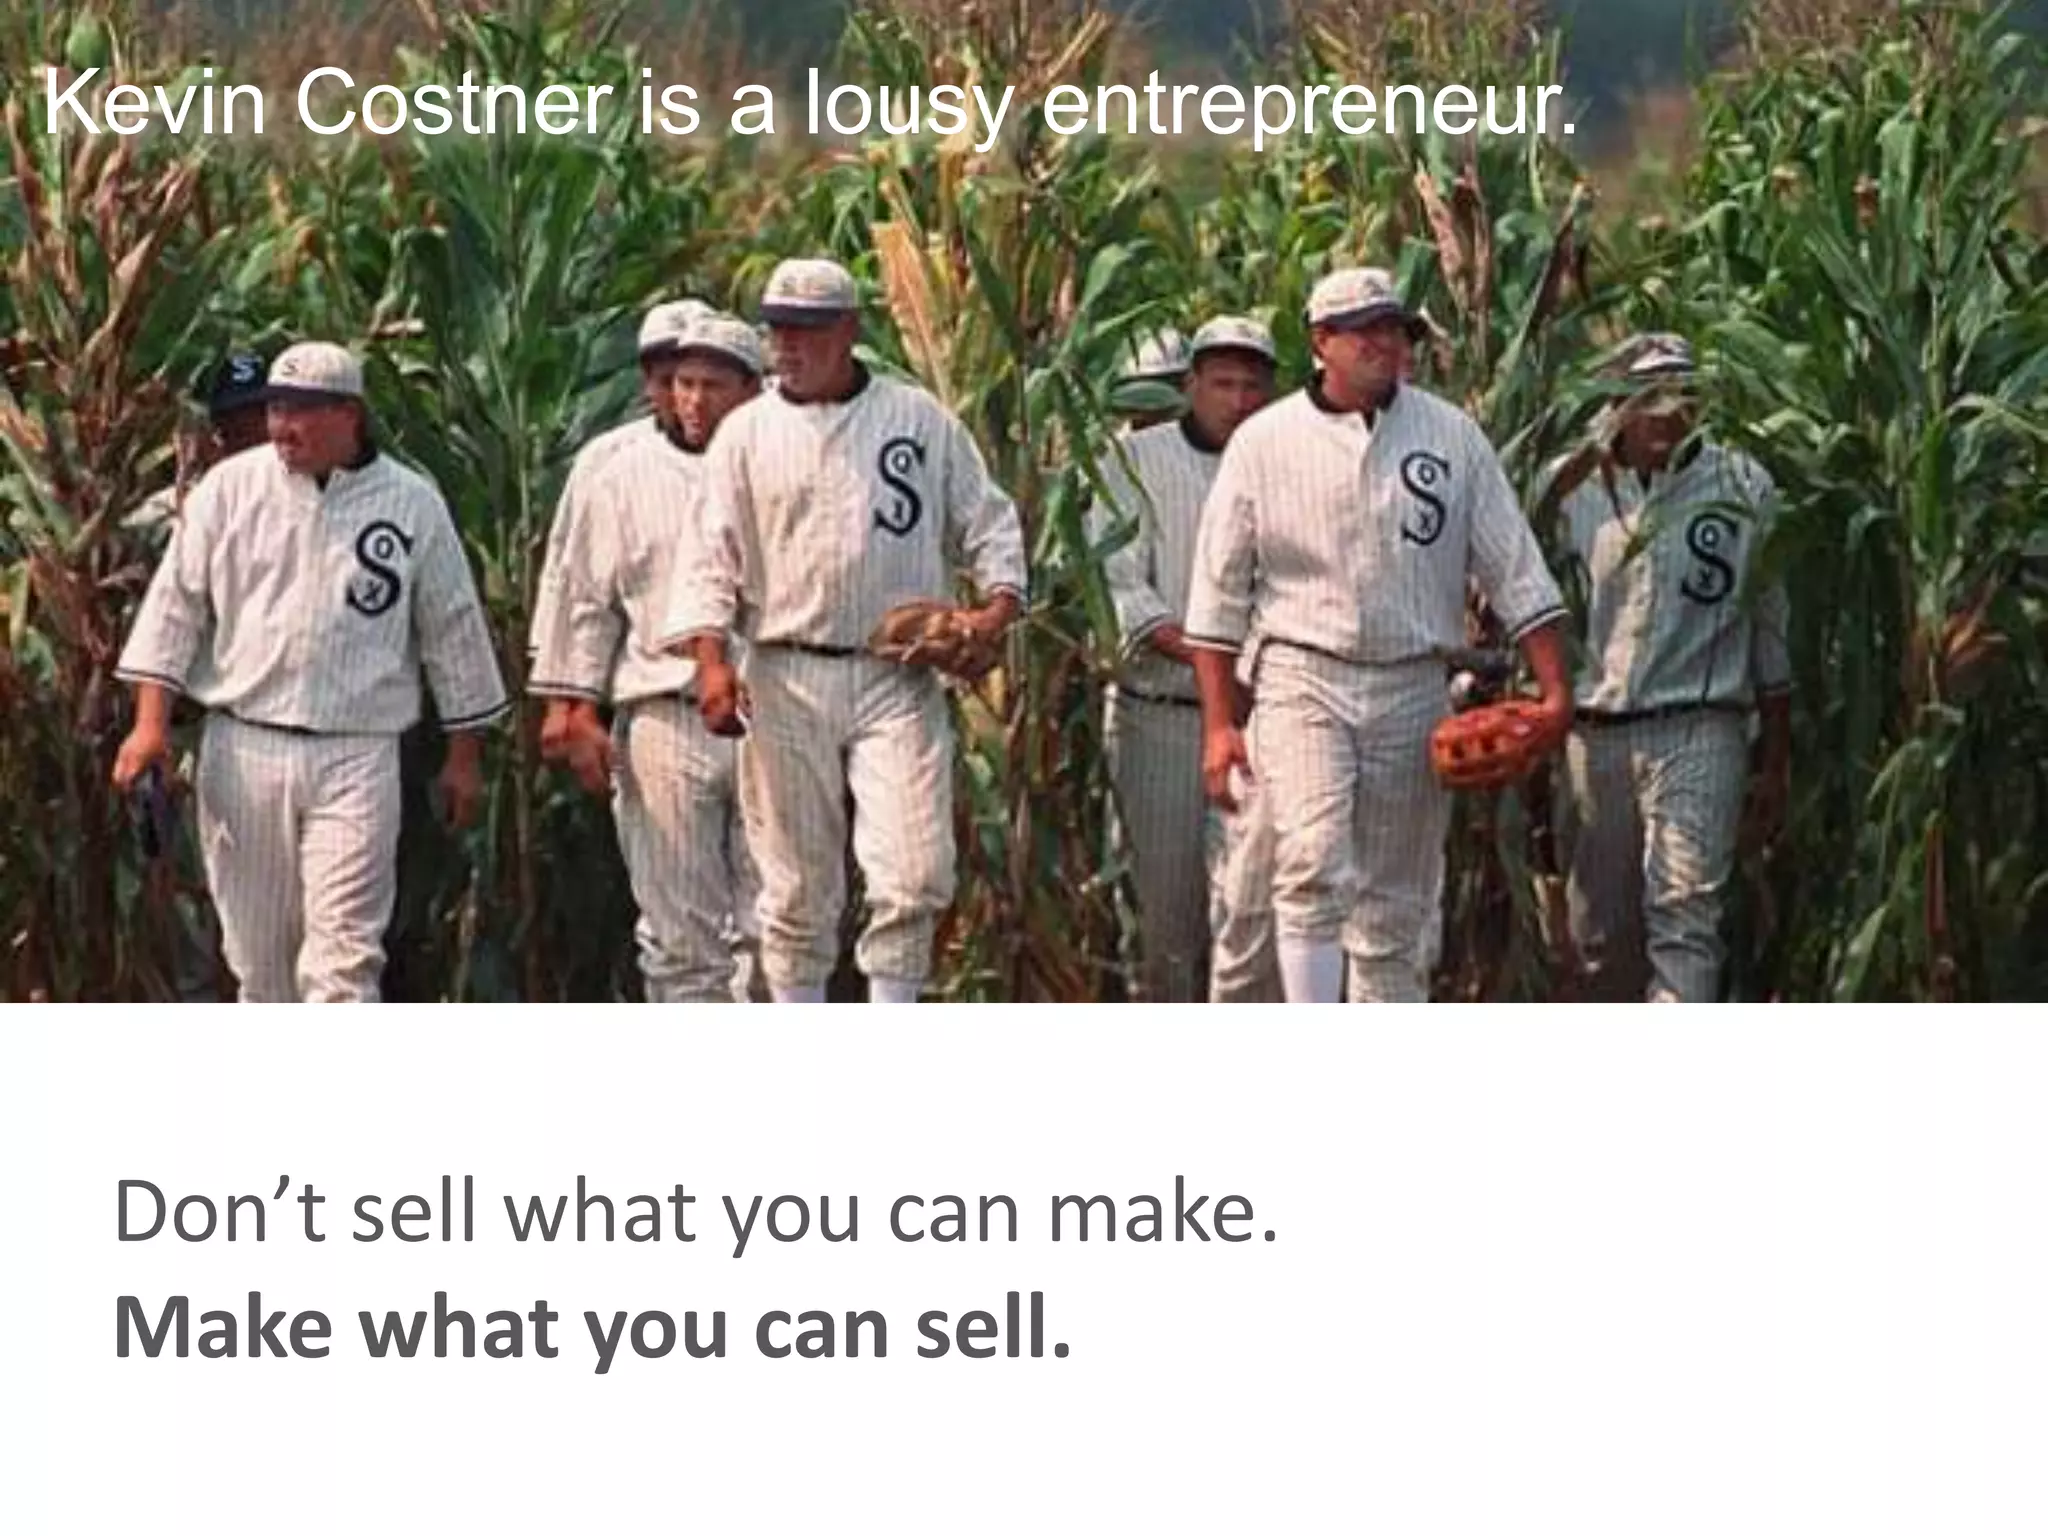
Kevin Costner is a lousy entrepreneur.


 Don’t sell what you can make.
 Make what you can sell.
In a startup, the purpose of
analytics is to iterate to a
product/market fit before
the money runs out.
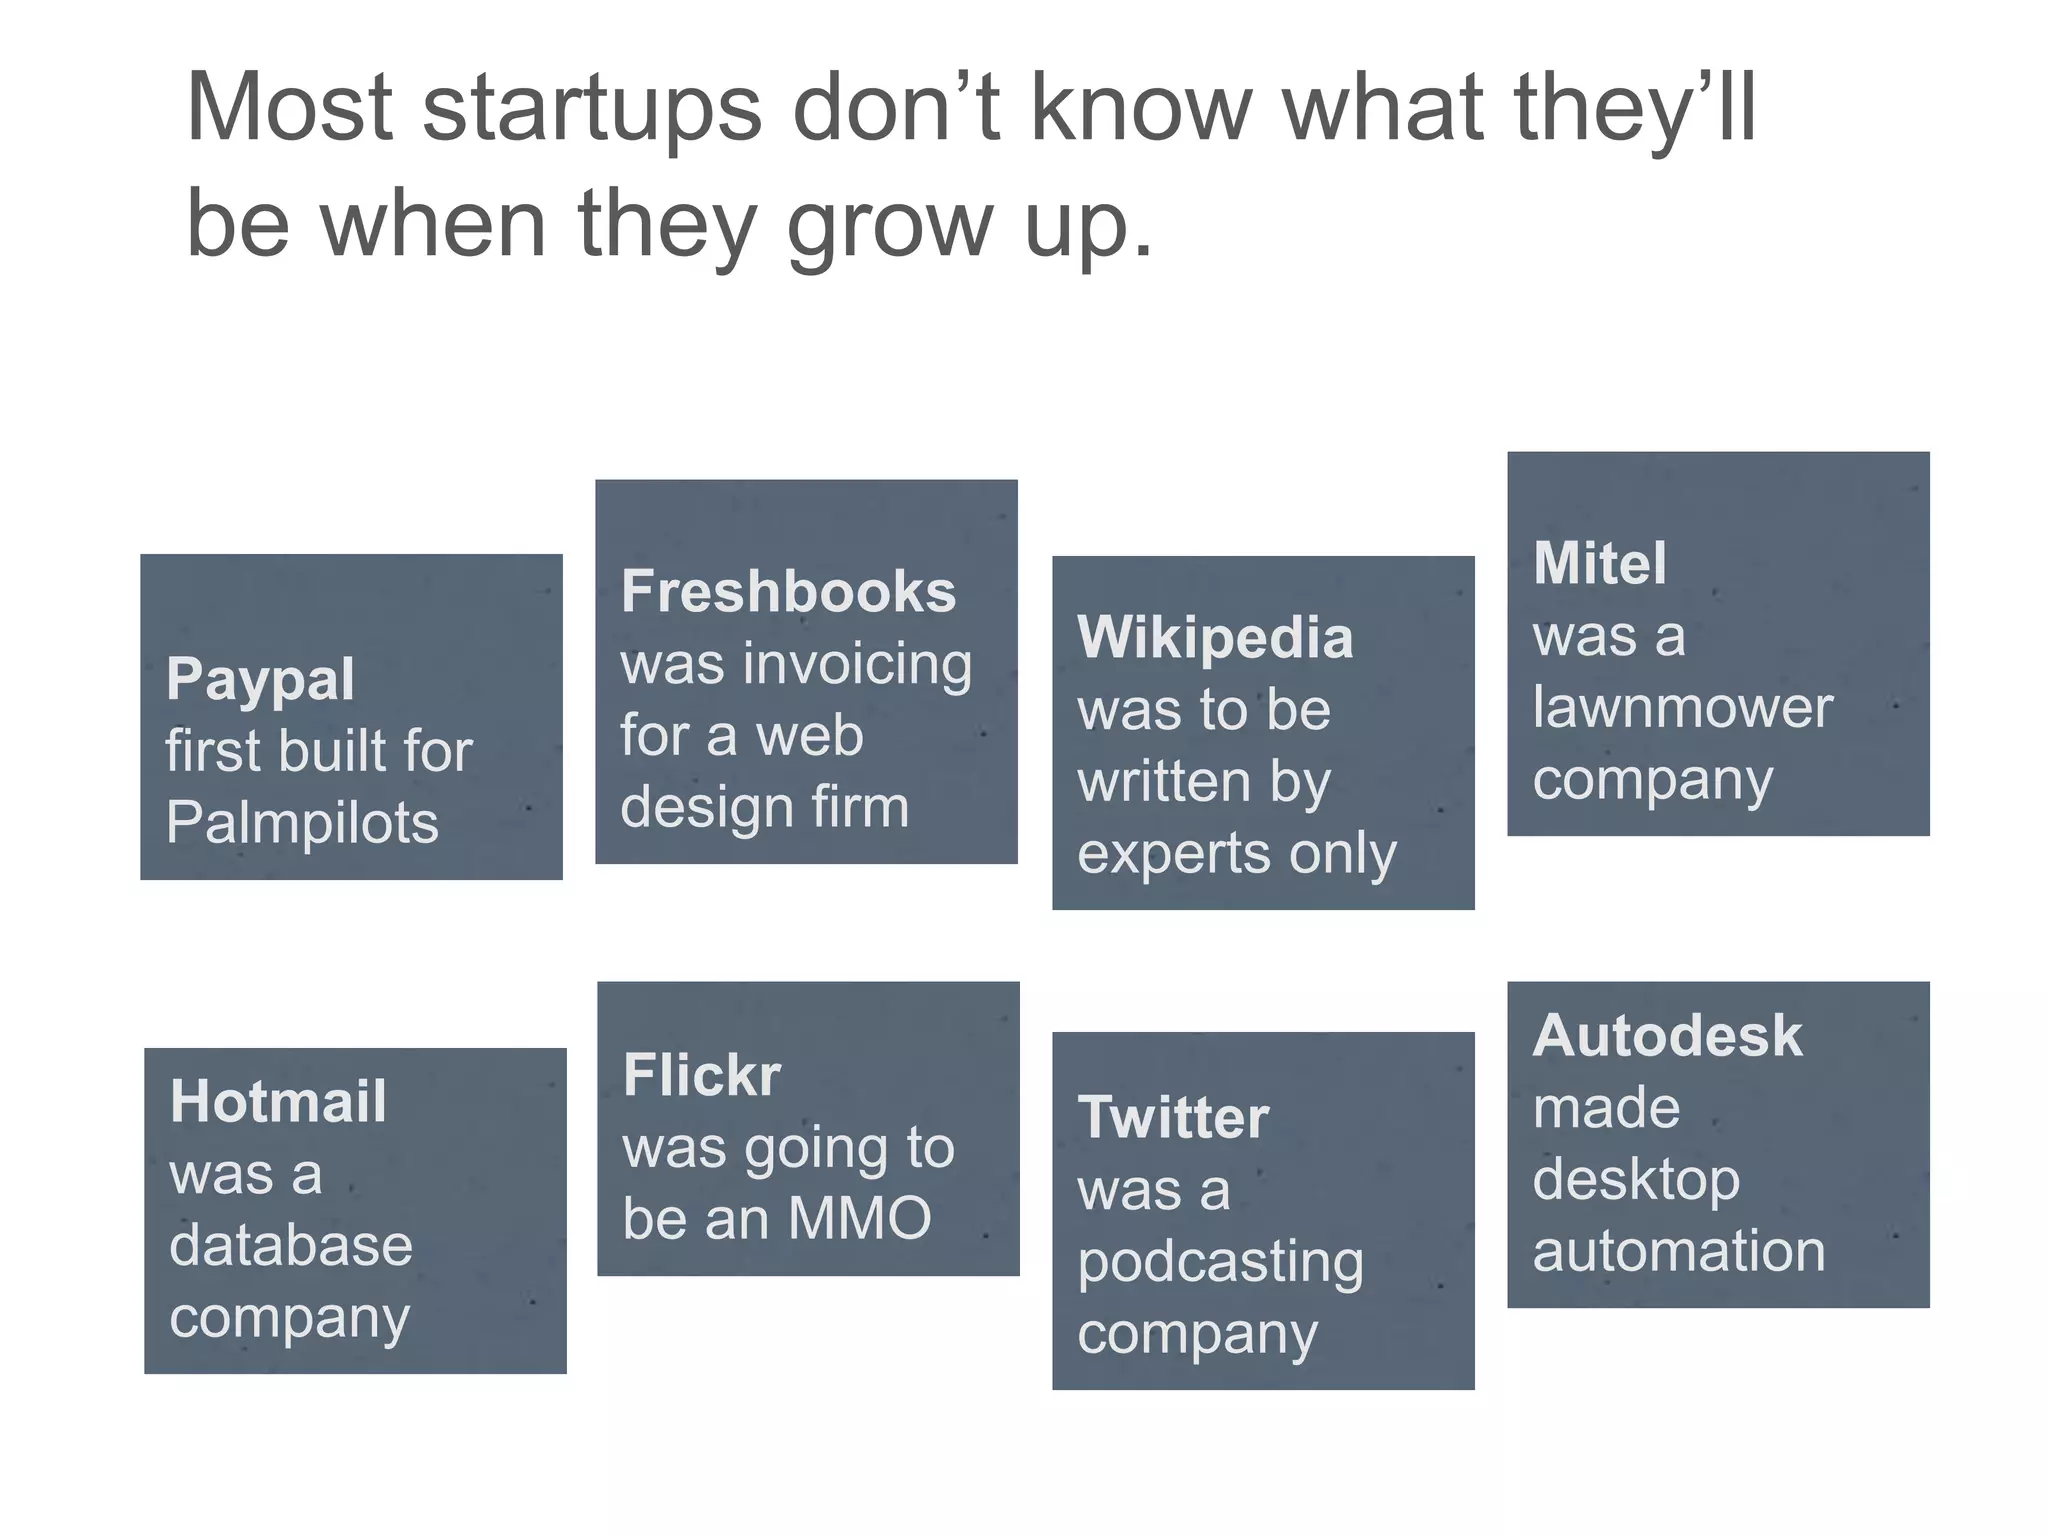
Most startups don‘t know what they‘ll
be when they grow up.


                  Freshbooks                     Mitel
                  was invoicing   Wikipedia      was a
Paypal                                           lawnmower
                  for a web       was to be
first built for                                  company
                  design firm     written by
Palmpilots
                                  experts only


                                                 Autodesk
Hotmail           Flickr
                                  Twitter        made
was a             was going to
                                  was a          desktop
database          be an MMO
                                  podcasting     automation
company                           company
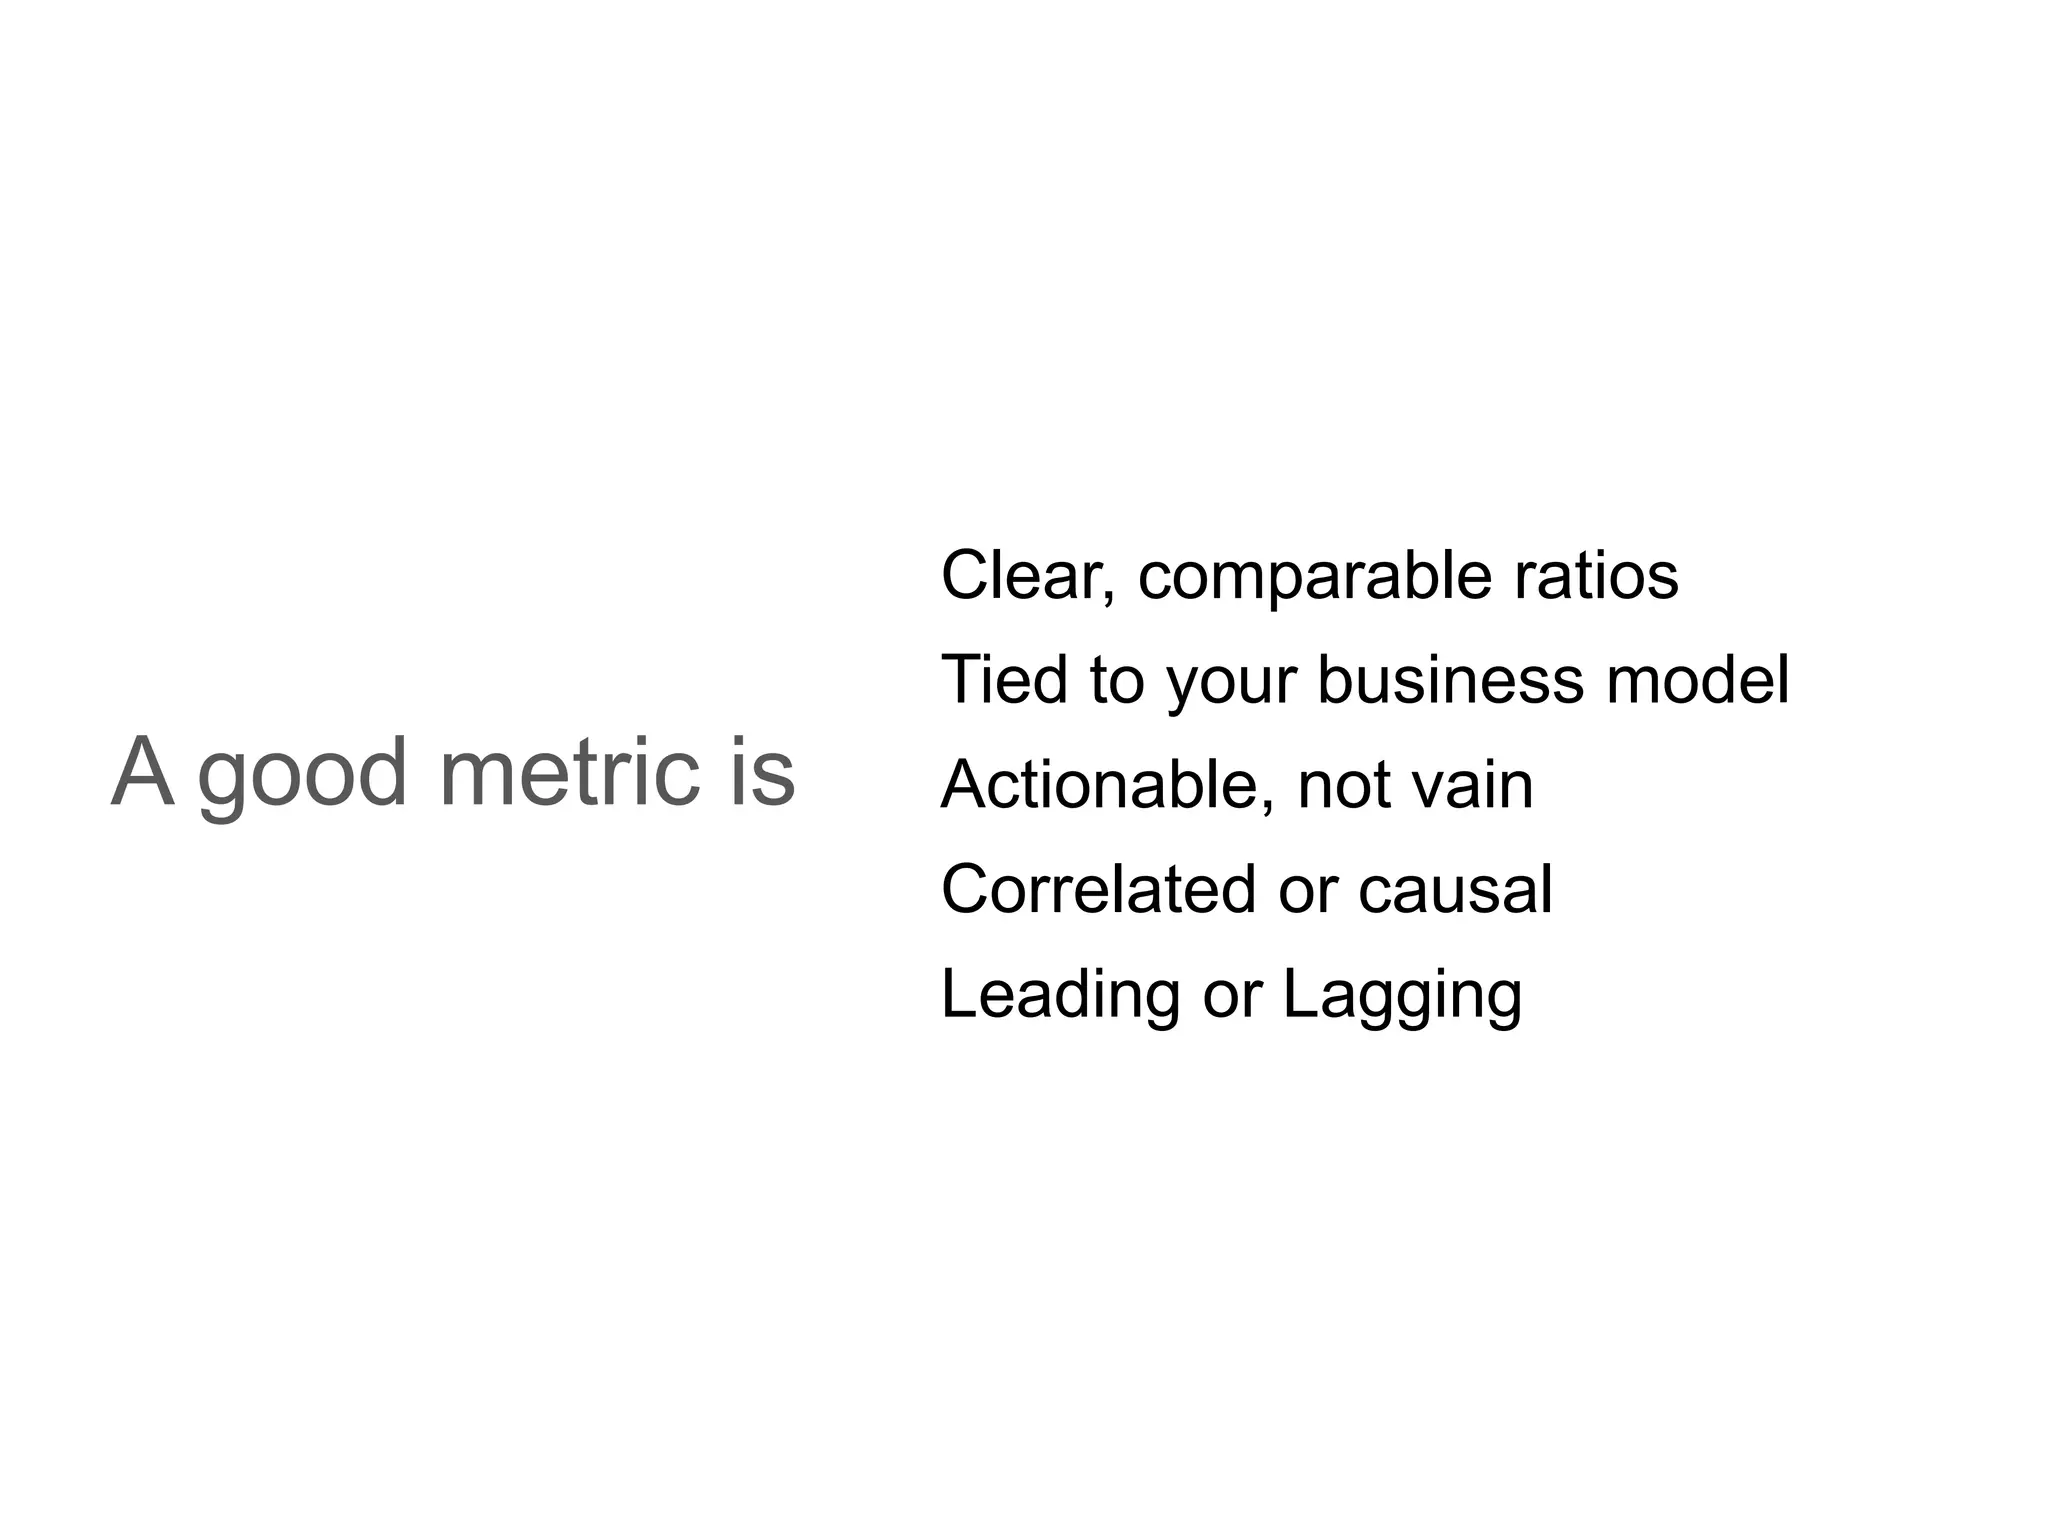
Clear, comparable ratios
                   Tied to your business model
A good metric is   Actionable, not vain
                   Correlated or causal
                   Leading or Lagging
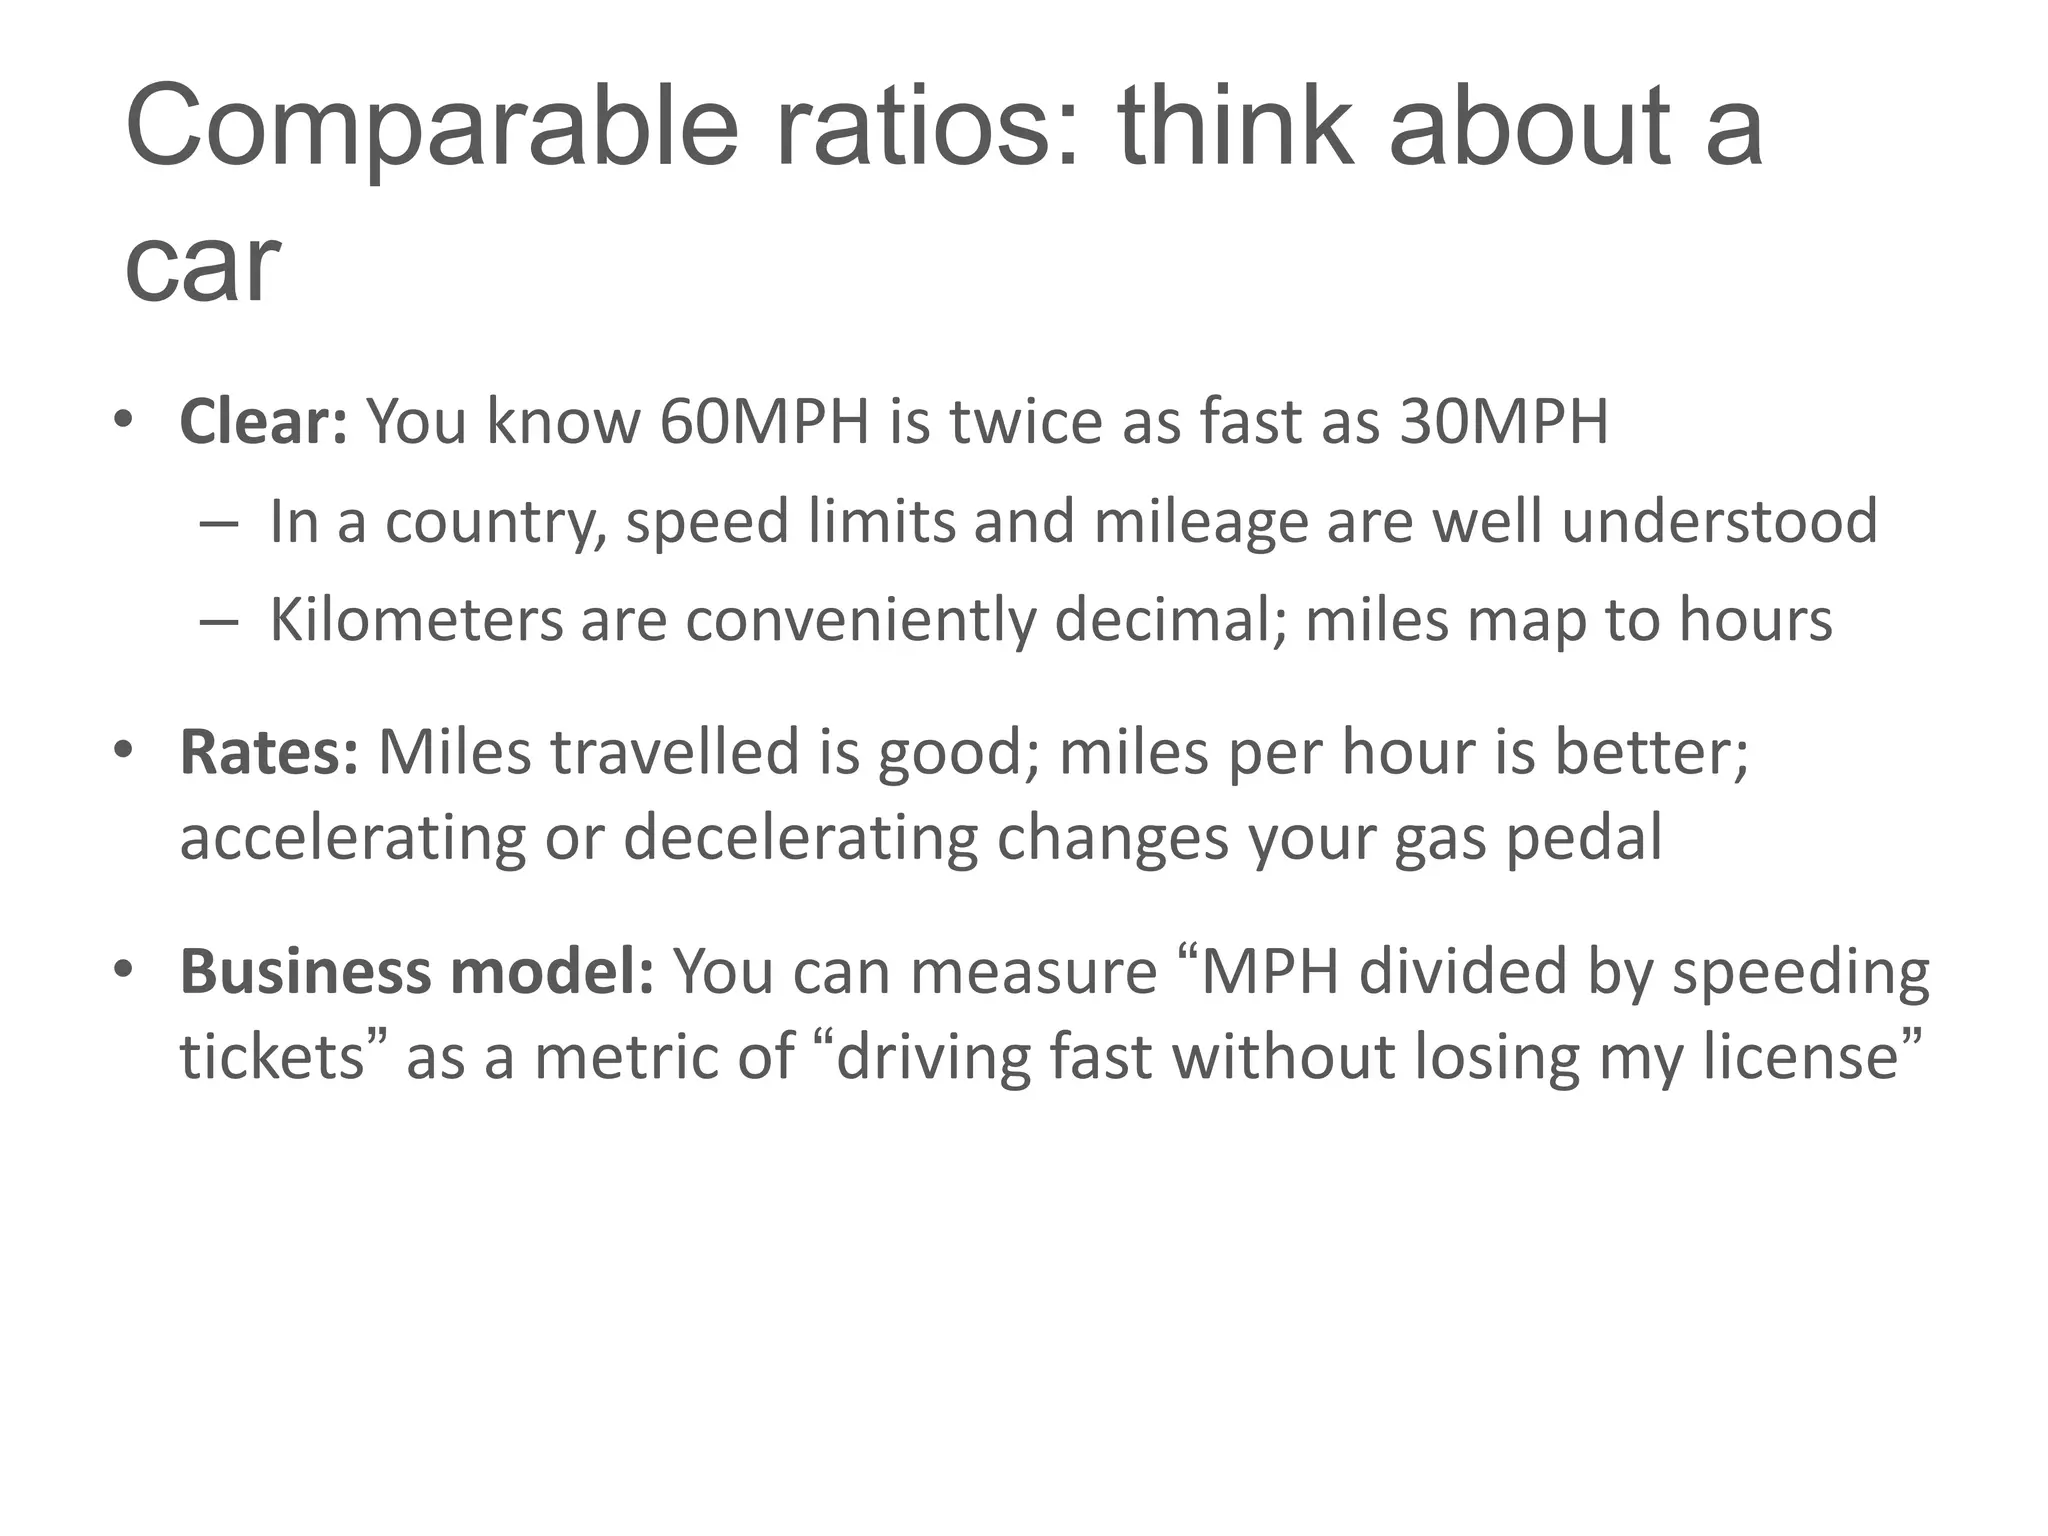
Comparable ratios: think about a
car
• Clear: You know 60MPH is twice as fast as 30MPH
   – In a country, speed limits and mileage are well understood
   – Kilometers are conveniently decimal; miles map to hours
• Rates: Miles travelled is good; miles per hour is better;
  accelerating or decelerating changes your gas pedal
• Business model: You can measure ―MPH divided by speeding
  tickets‖ as a metric of ―driving fast without losing my license‖
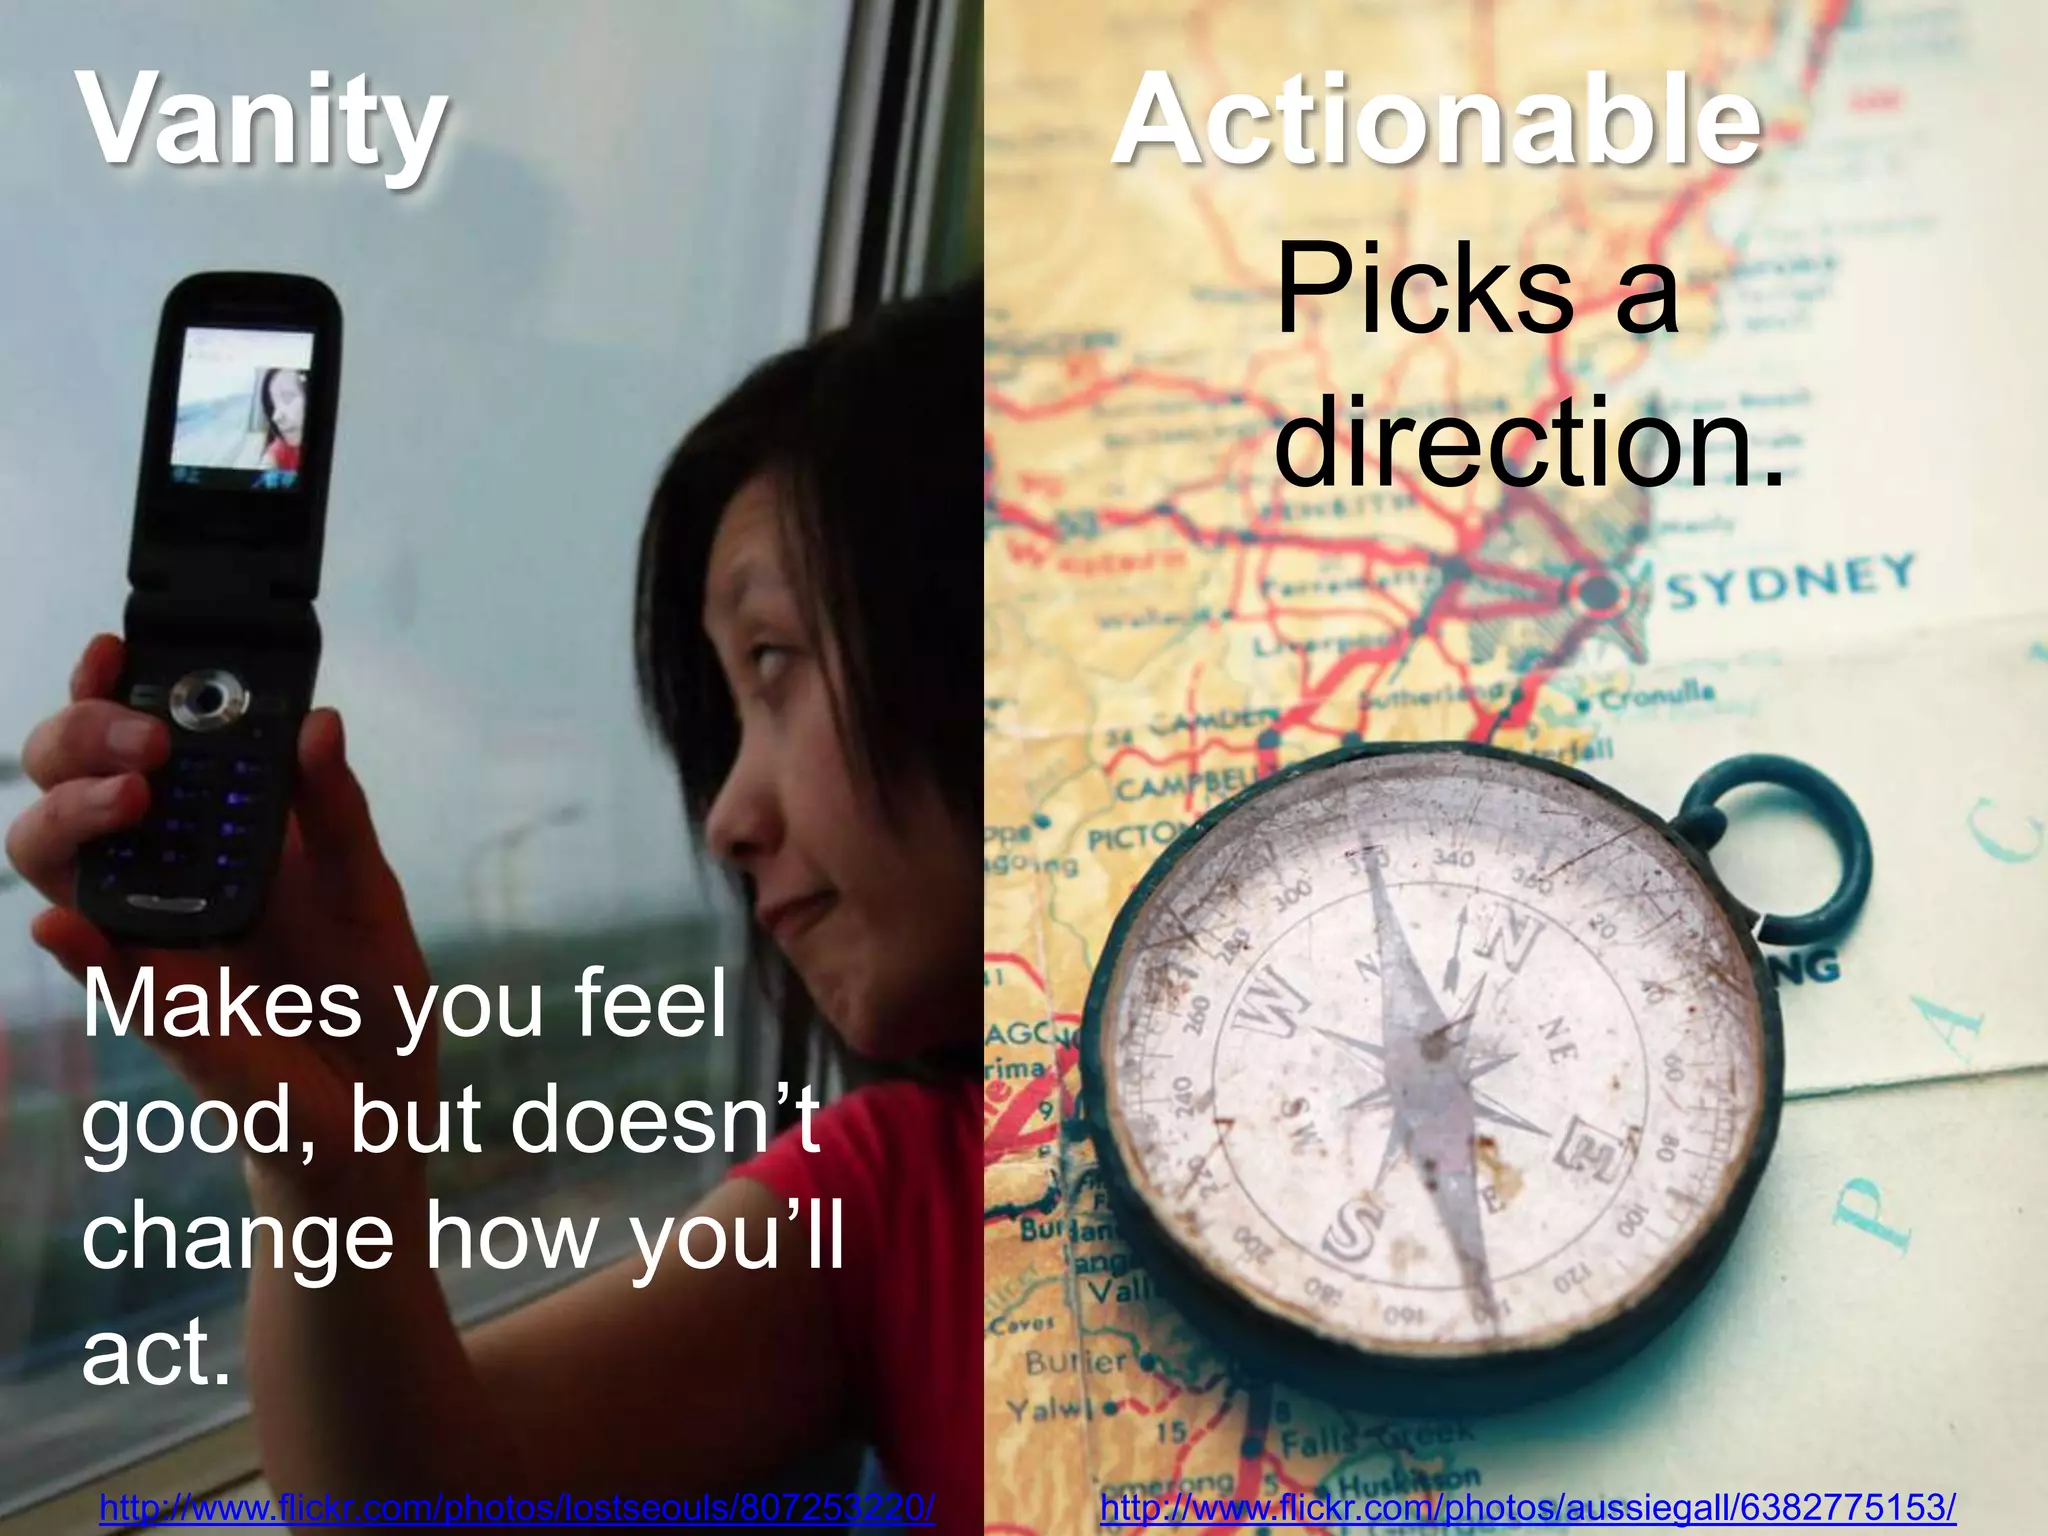
Vanity                                               Actionable
                                                       Picks a
                                                       direction.


Makes you feel
good, but doesn‘t
change how you‘ll
act.
http://www.flickr.com/photos/lostseouls/807253220/   http://www.flickr.com/photos/aussiegall/6382775153/
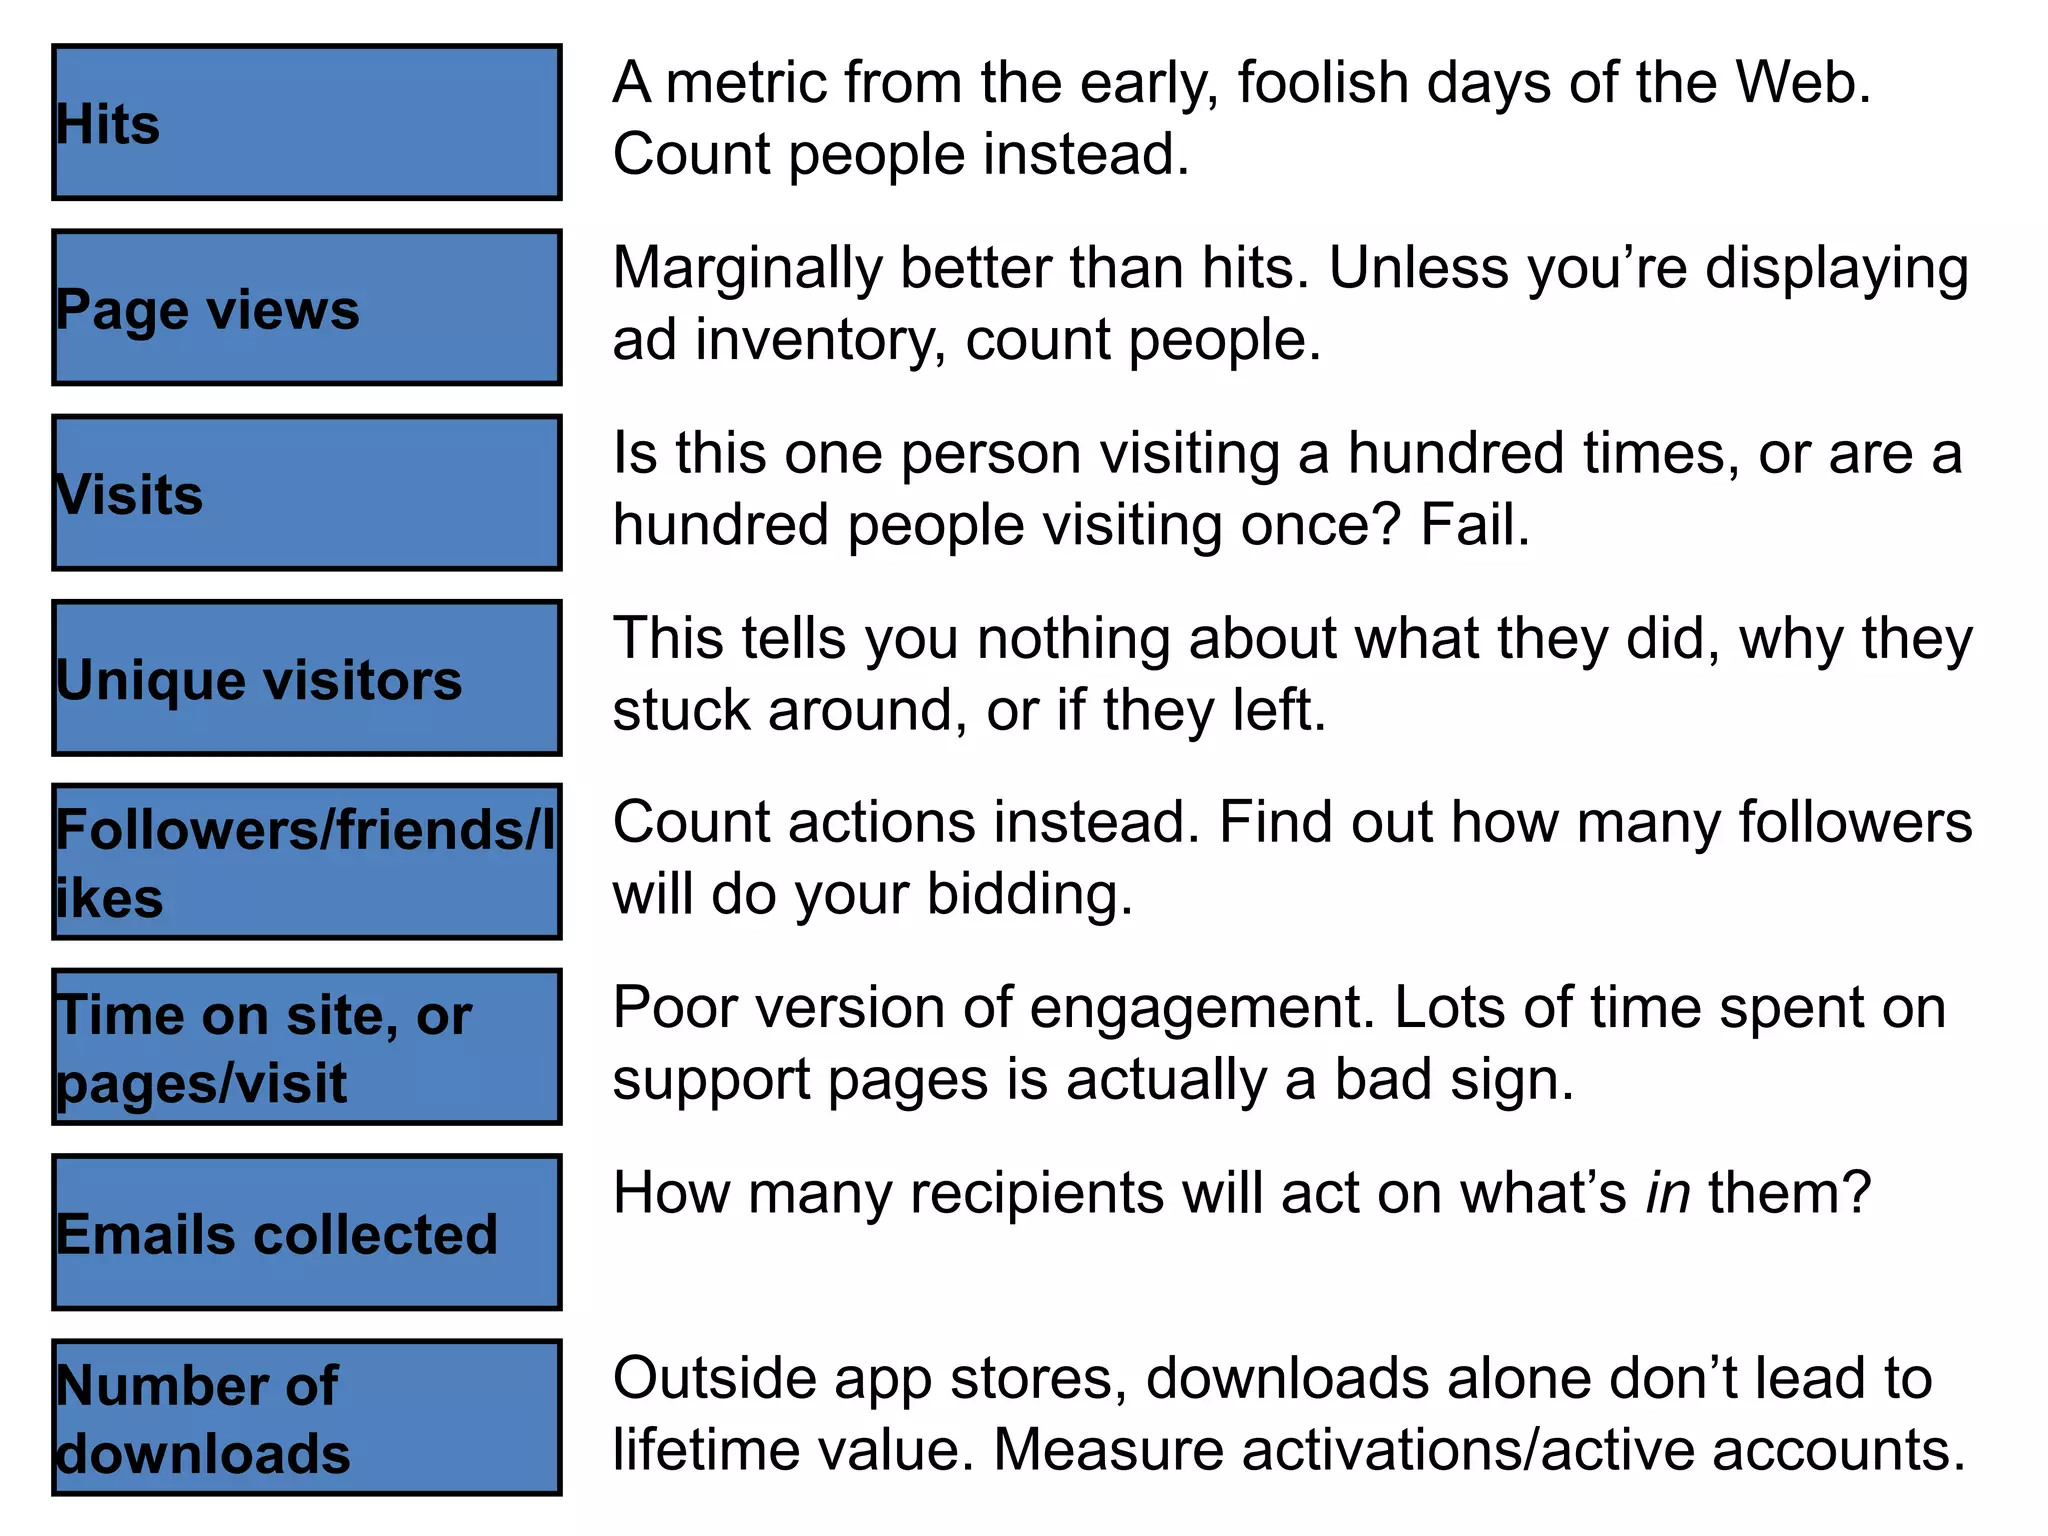
A metric from the early, foolish days of the Web.
Hits
                    Count people instead.
                    Marginally better than hits. Unless you‘re displaying
Page views
                    ad inventory, count people.
                    Is this one person visiting a hundred times, or are a
Visits
                    hundred people visiting once? Fail.
                    This tells you nothing about what they did, why they
Unique visitors
                    stuck around, or if they left.
Followers/friends/l Count actions instead. Find out how many followers
ikes                will do your bidding.

Time on site, or    Poor version of engagement. Lots of time spent on
pages/visit         support pages is actually a bad sign.
                    How many recipients will act on what‘s in them?
Emails collected

Number of           Outside app stores, downloads alone don‘t lead to
downloads           lifetime value. Measure activations/active accounts.
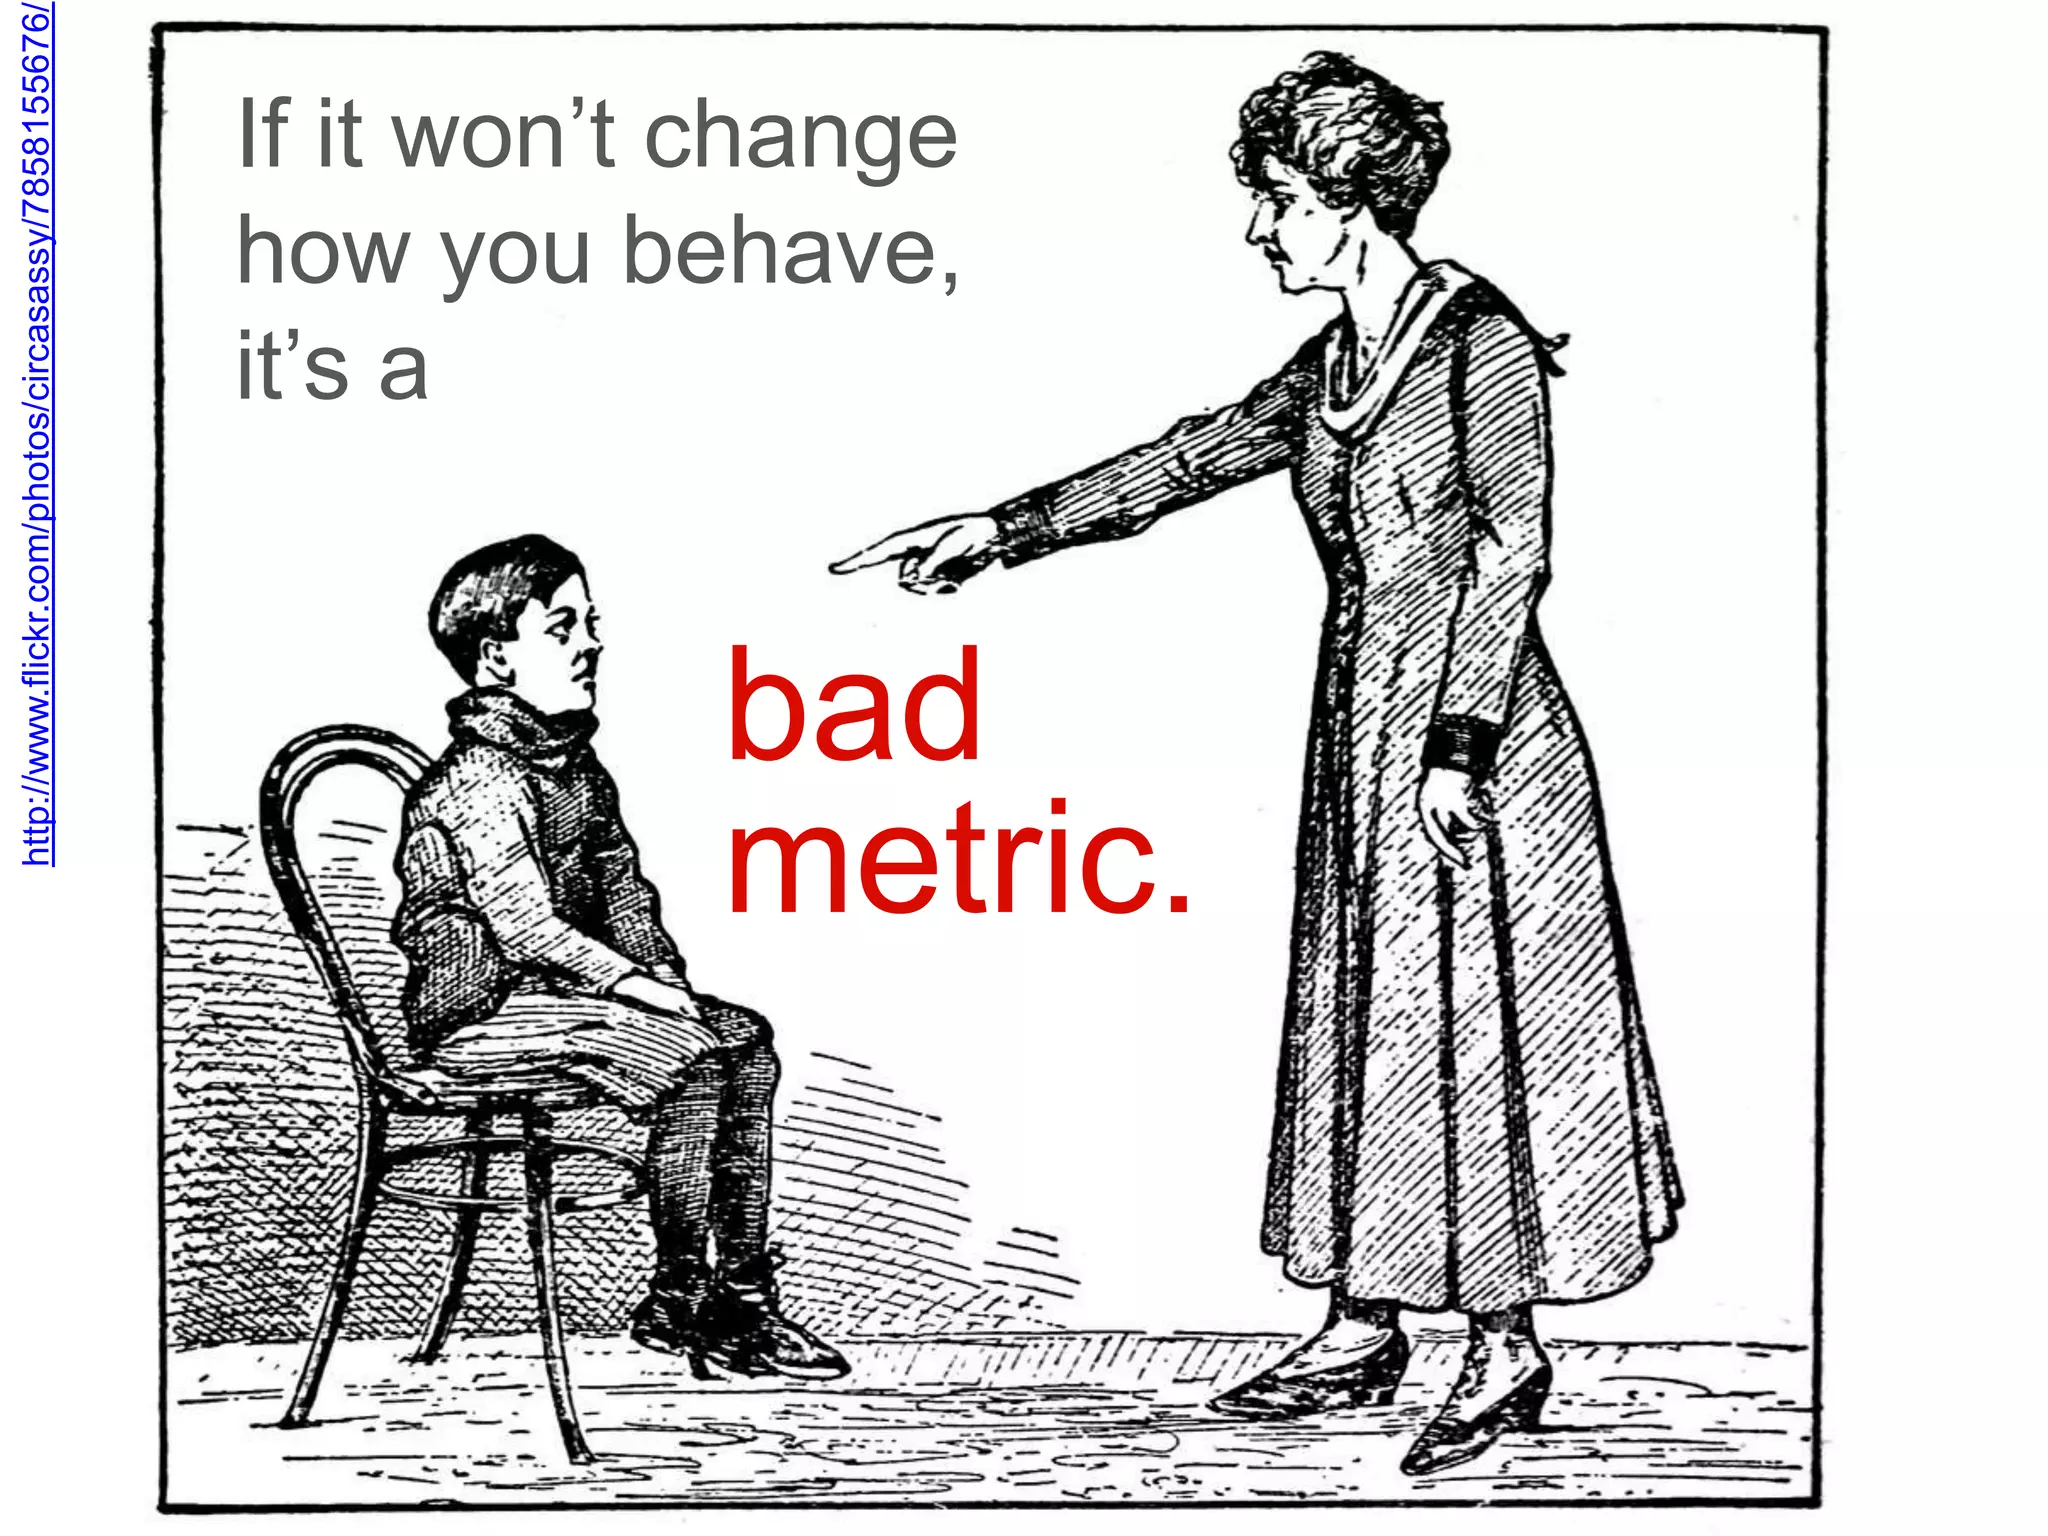
http://www.flickr.com/photos/circasassy/7858155676/


                           it‘s a
                           If it won‘t change
                           how you behave,


bad
metric.
2-sided market model:
AirBnB and photography
• Stage: Revenue
• Model: 2-sided marketplace

• Rental-by-owner marketplace that allows
  property owners to list and market their
  houses. Offers a variety of related services as
  well.
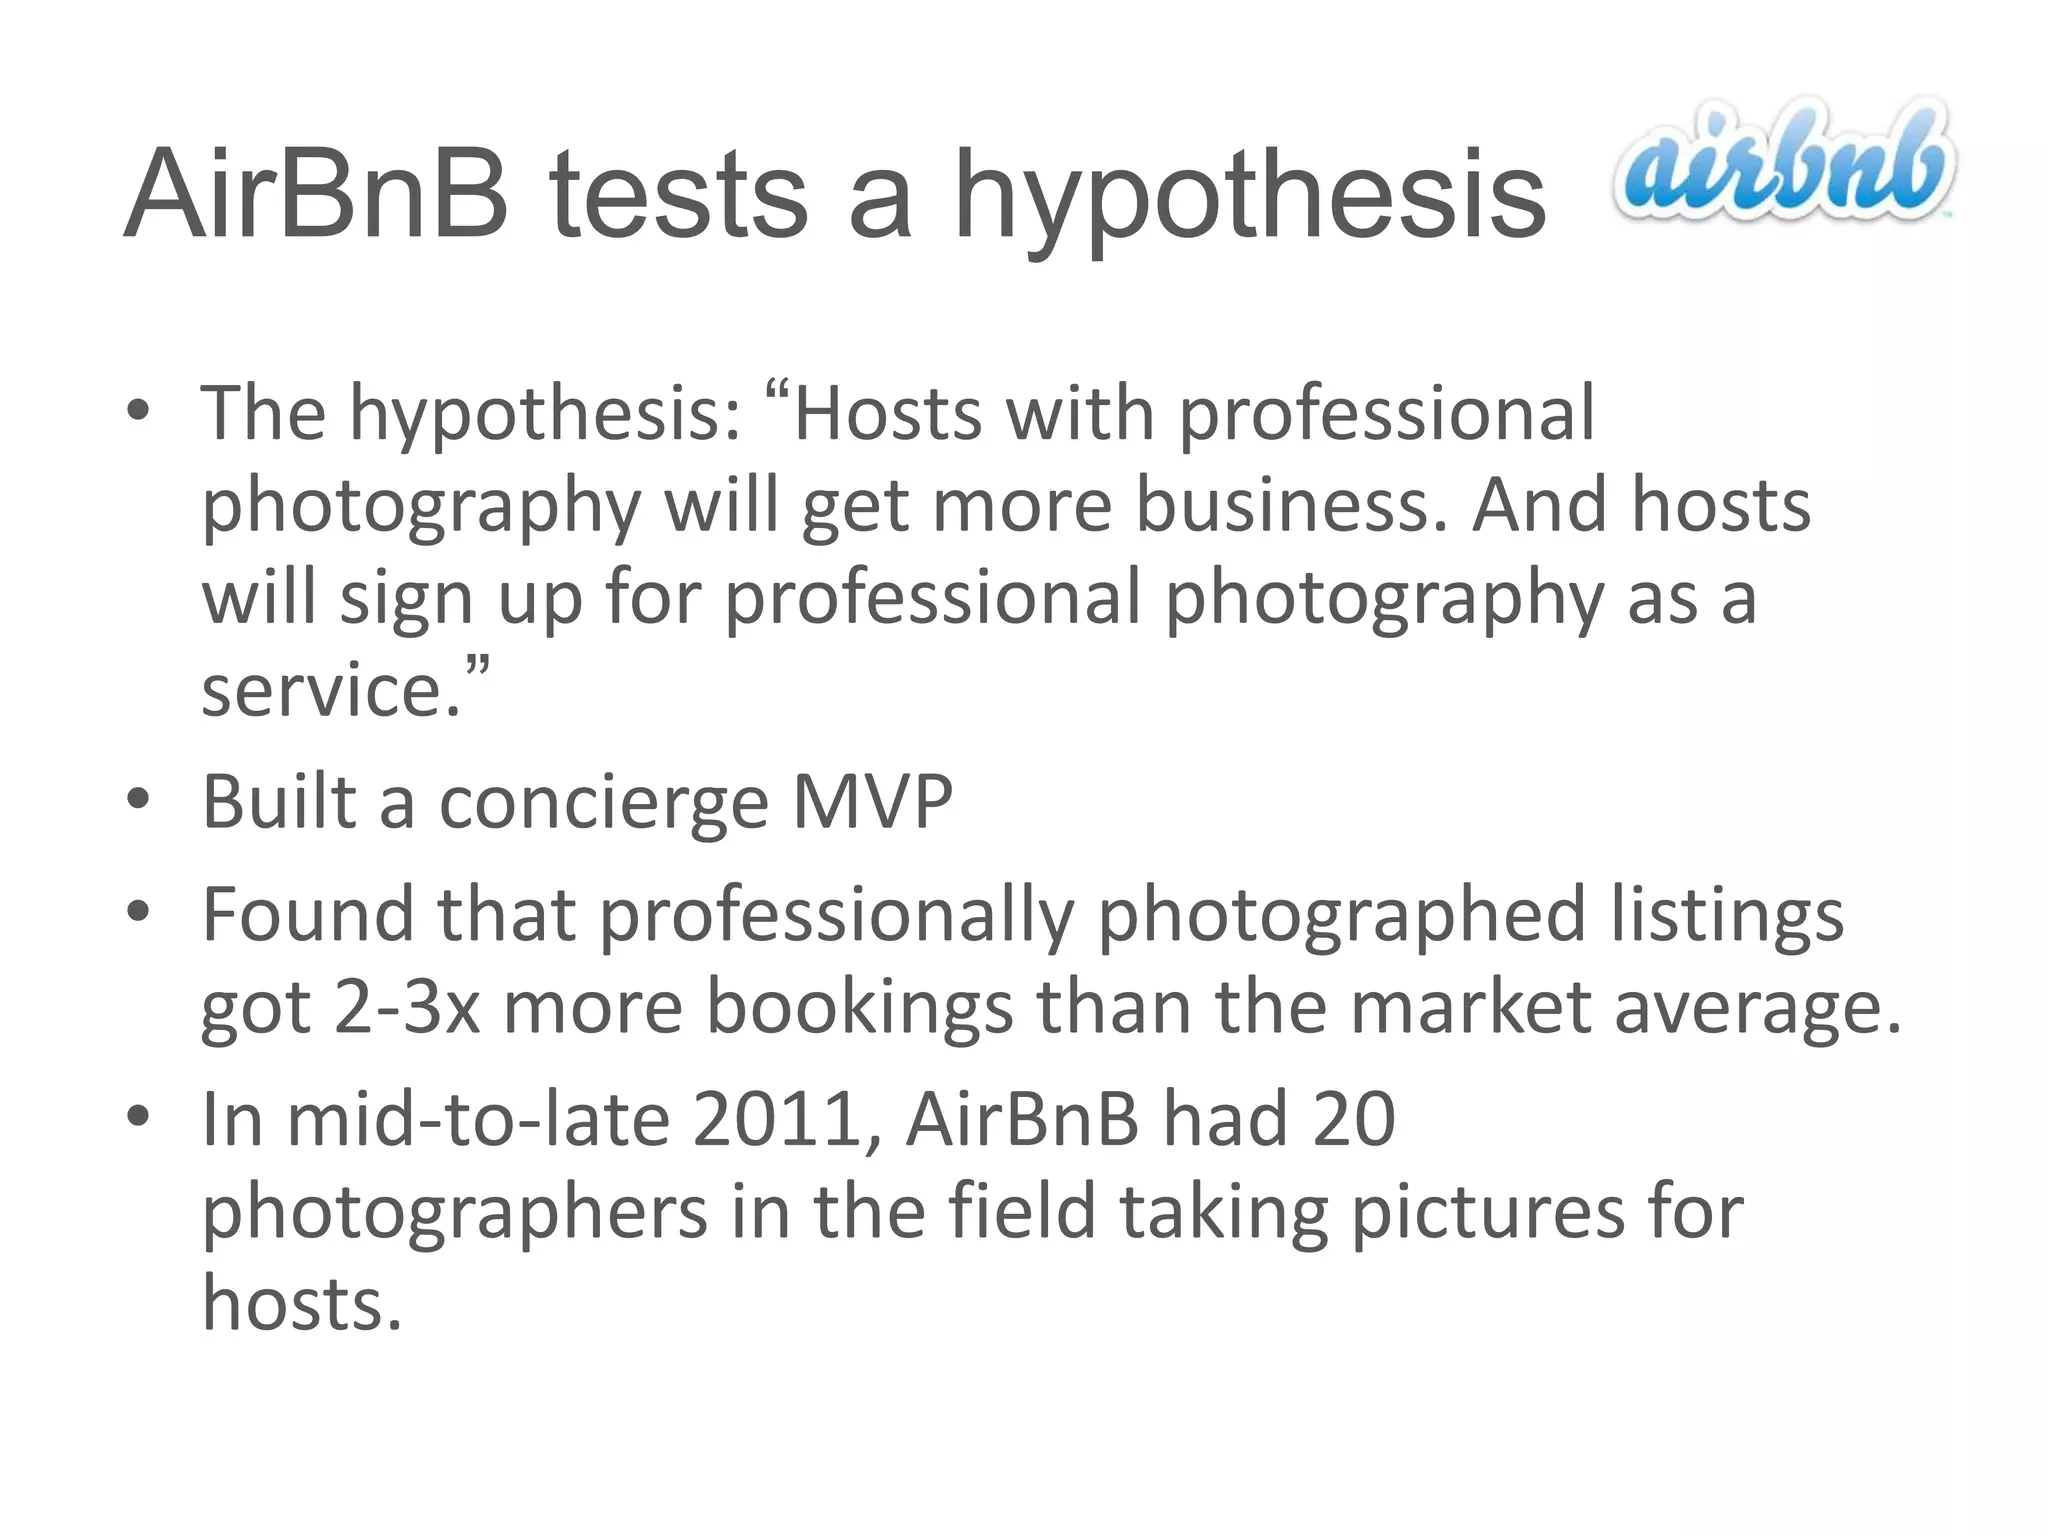
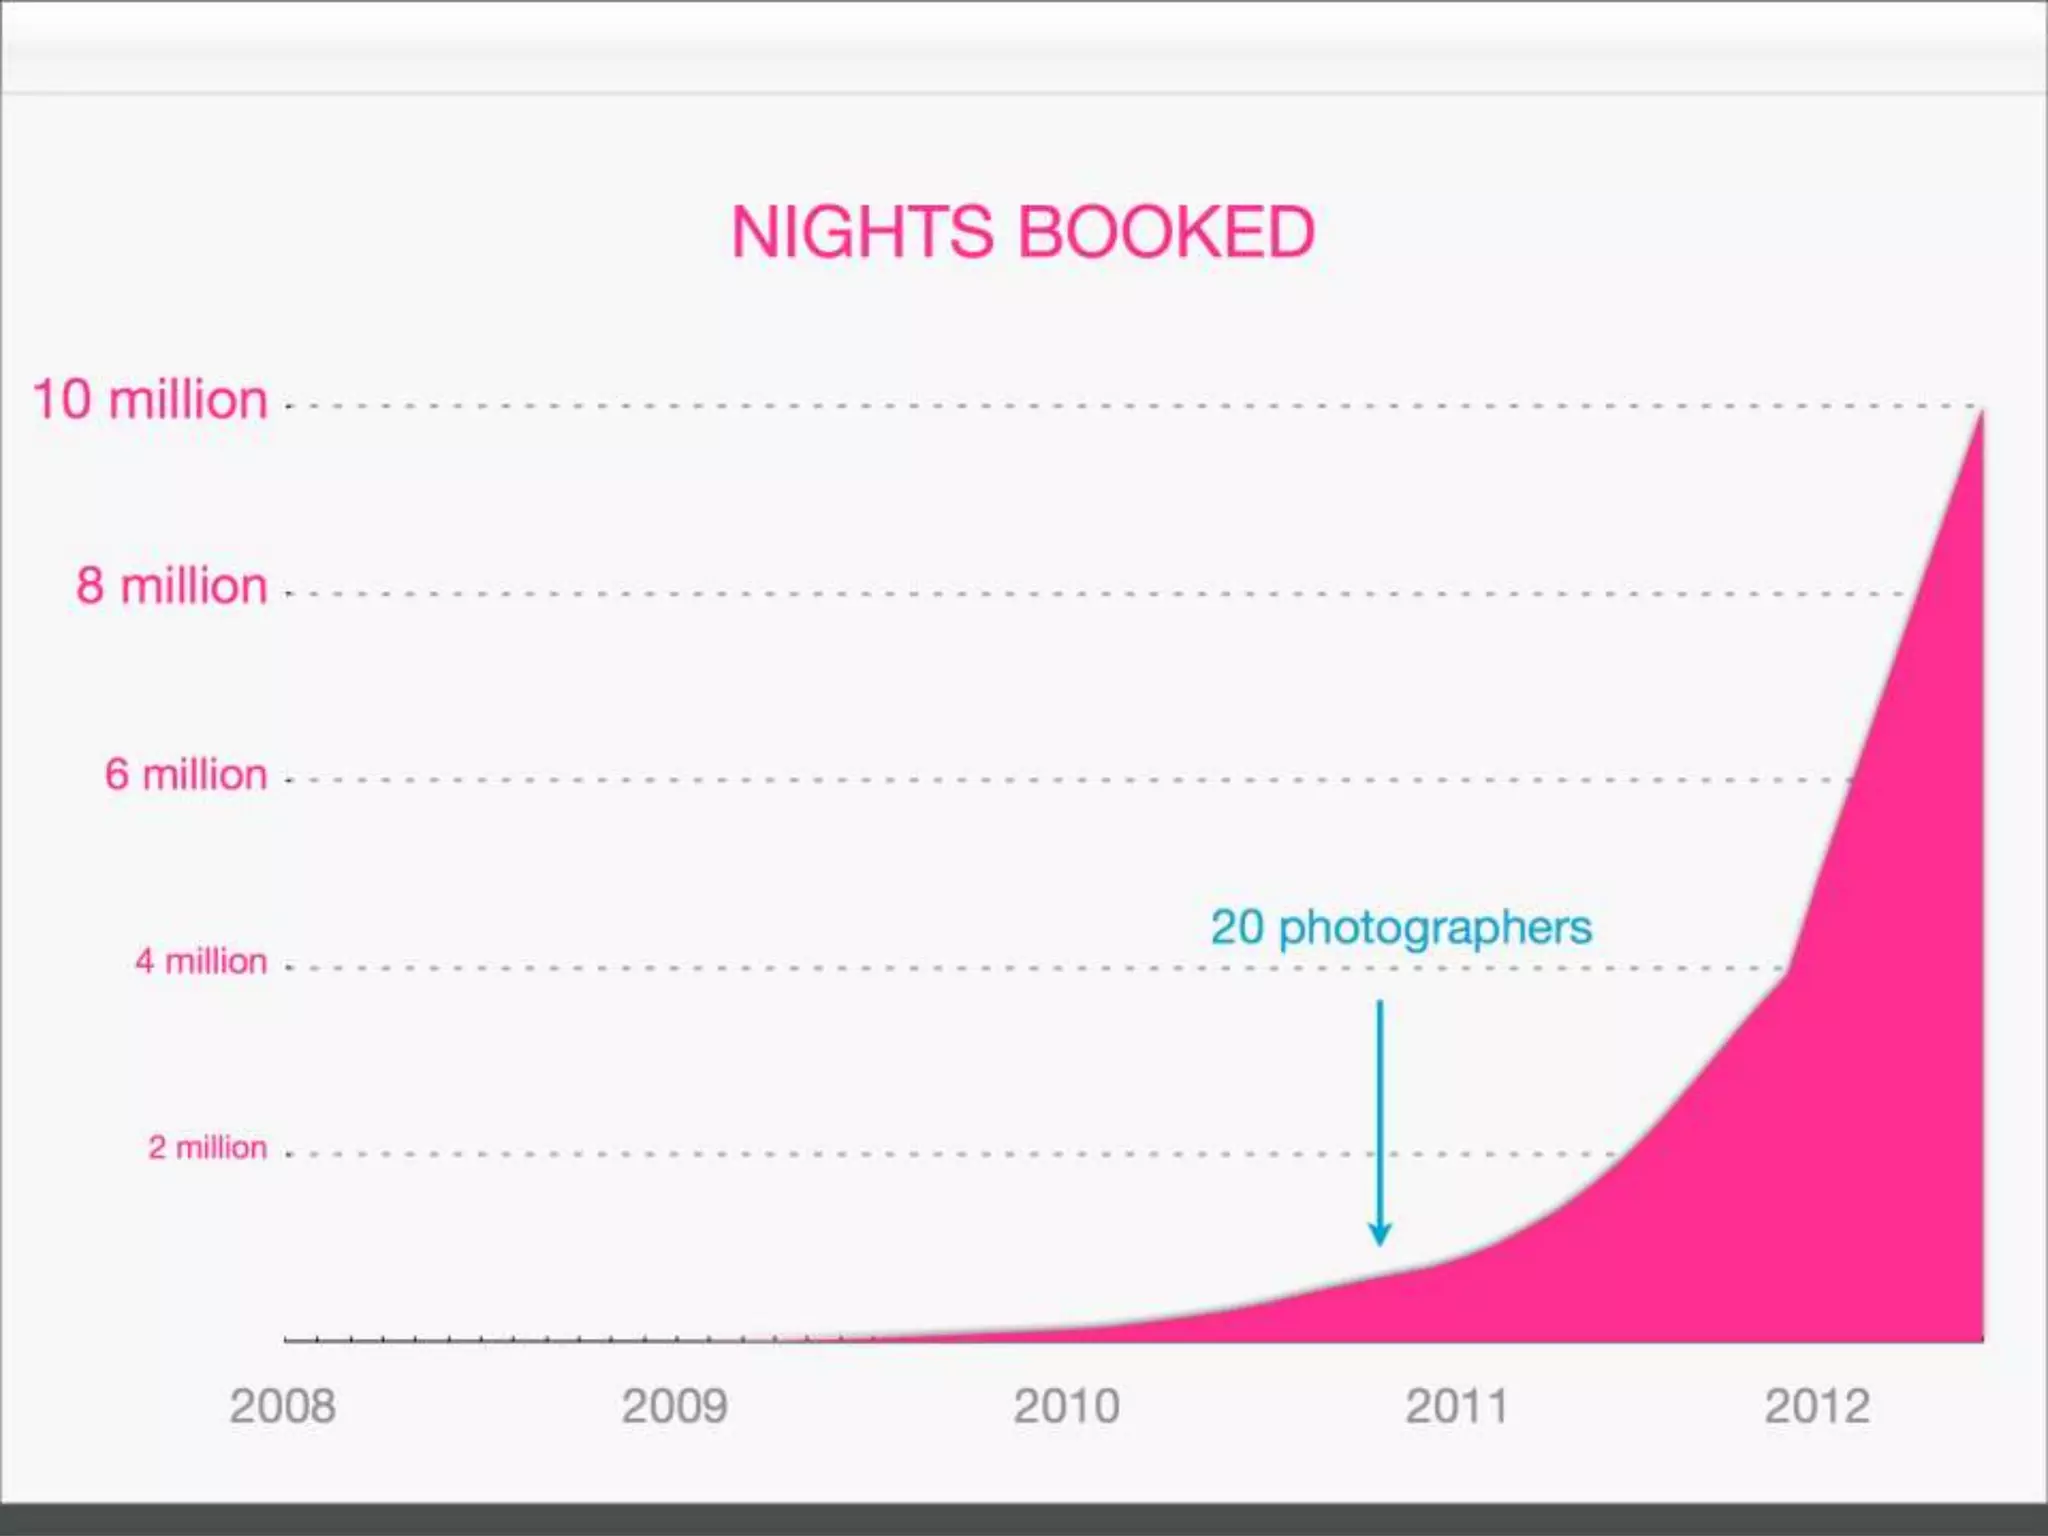
AirBnB tests a hypothesis
• The hypothesis: ―Hosts with professional
  photography will get more business. And hosts
  will sign up for professional photography as a
  service.‖
• Built a concierge MVP
• Found that professionally photographed listings
  got 2-3x more bookings than the market average.
• In mid-to-late 2011, AirBnB had 20
  photographers in the field taking pictures for
  hosts.
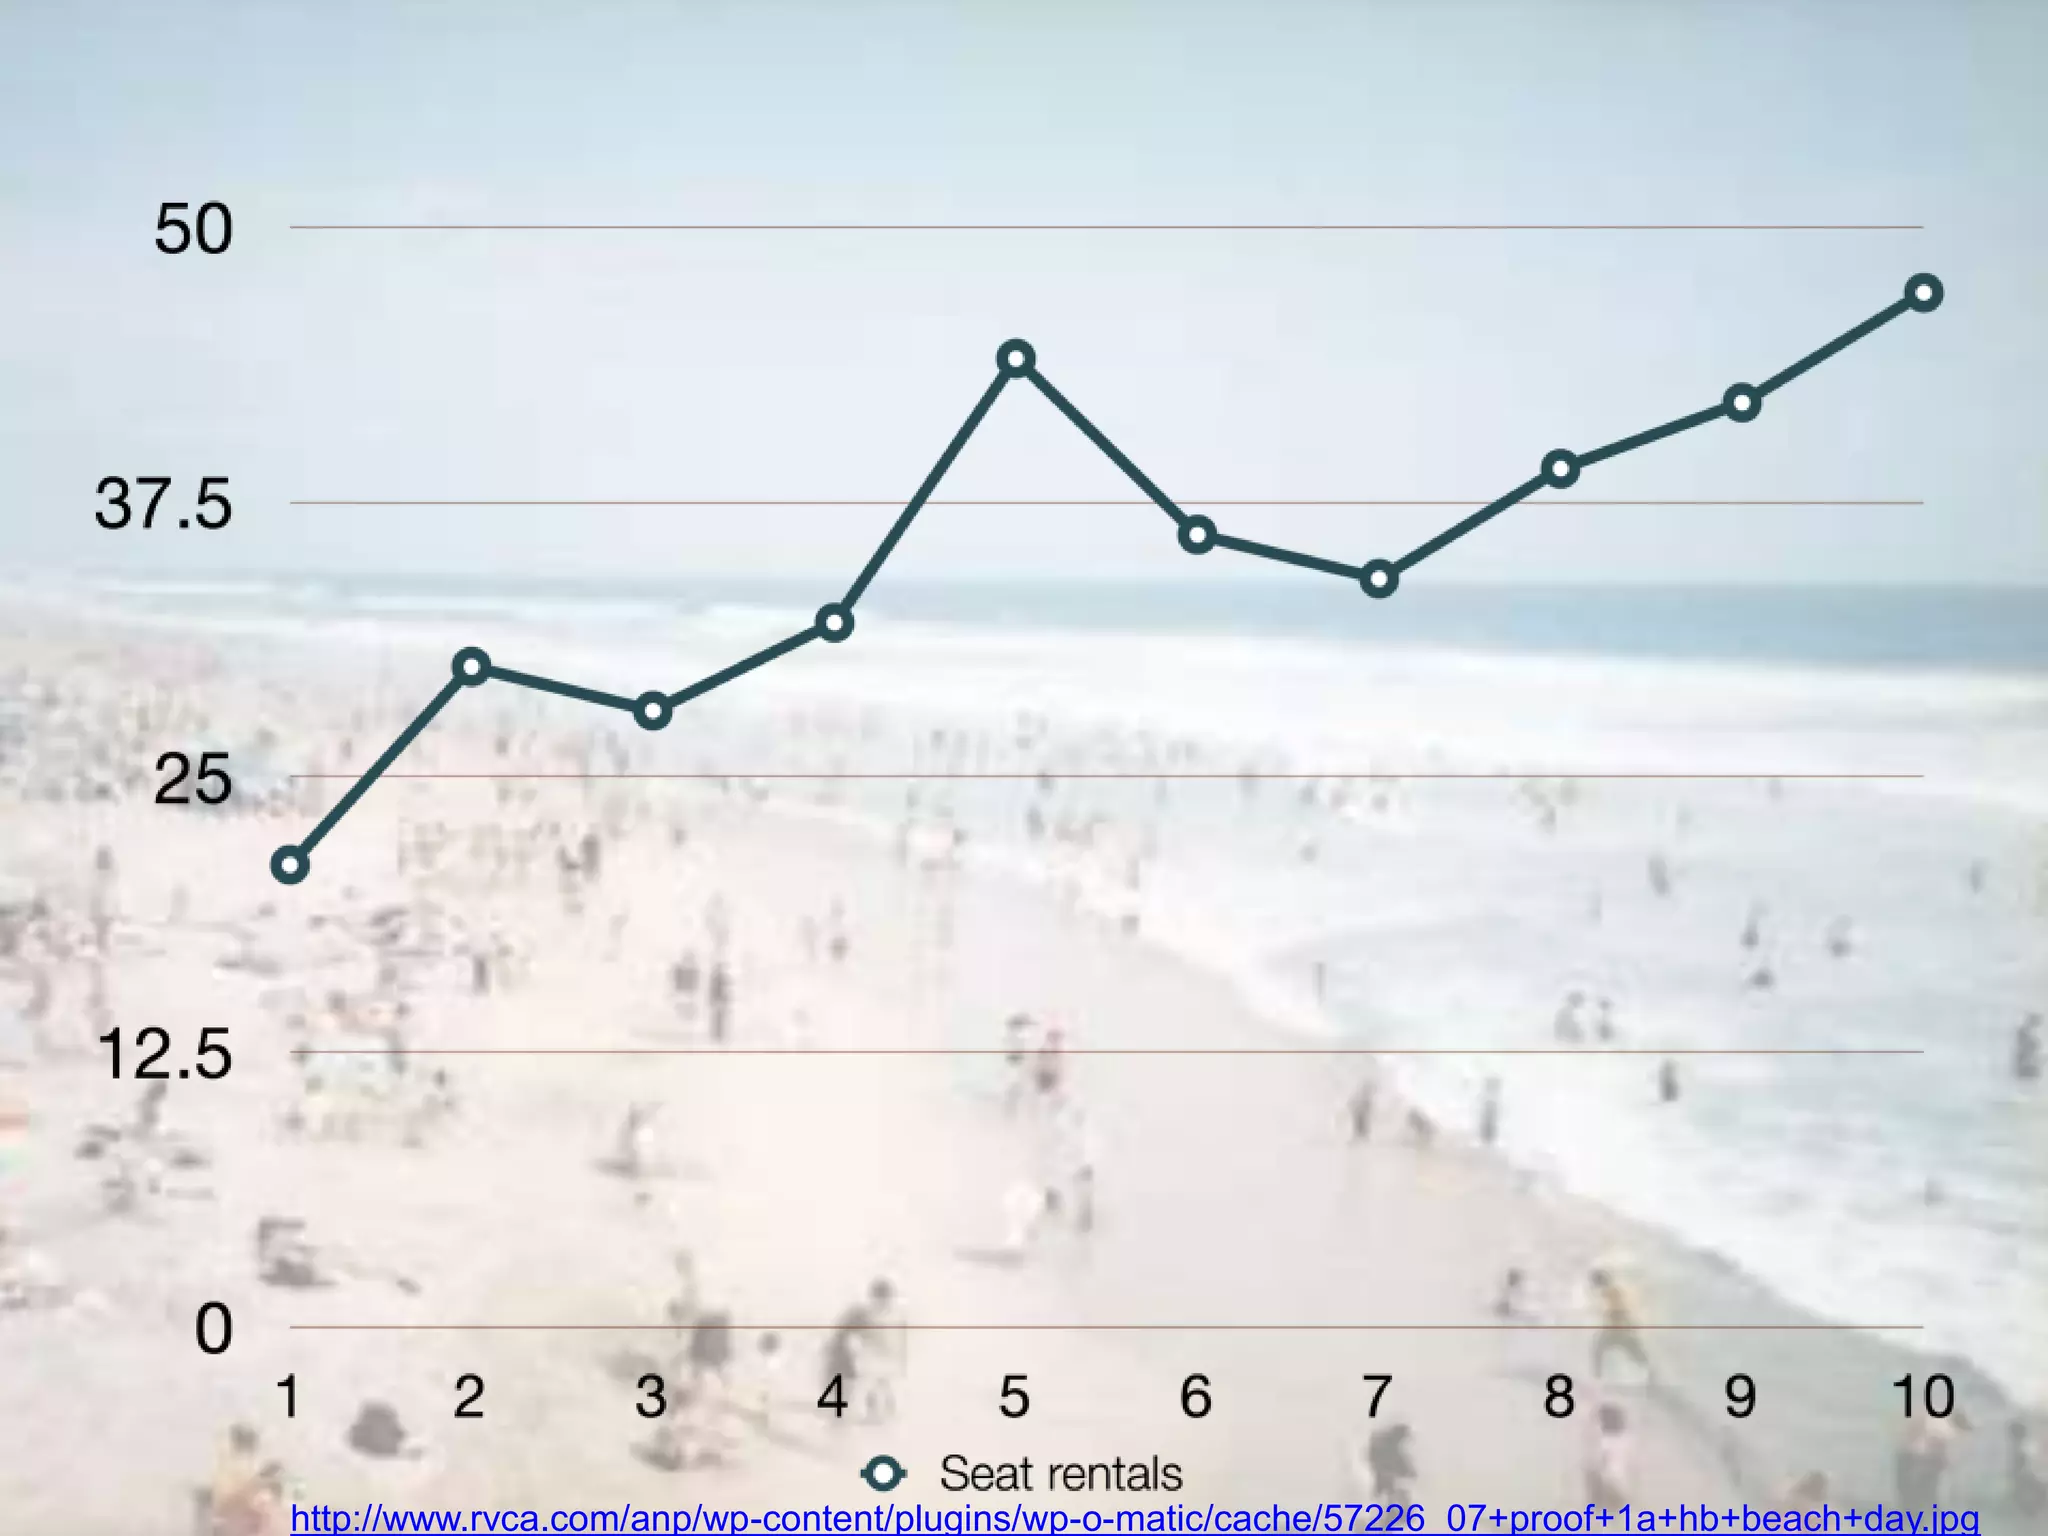
A few words on causality.


              http://www.flickr.com/photos/roryfinneren/65729247
http://www.rvca.com/anp/wp-content/plugins/wp-o-matic/cache/57226_07+proof+1a+hb+beach+day.jpg
http://www.imdb.com/media/rm3768753408/tt0073195
http://www.flickr.com/photos/kapungo/2287237966
http://www.flickr.com/photos/25159787@N07/3766111564
http://www.flickr.com/photos/wheressteve/3284532080
http://www.flickr.com/photos/wtlphotos/1086968783
http://www.flickr.com/photos/stuttermonkey/57096884
http://www.flickr.com/photos/germanuncut77/3785152581
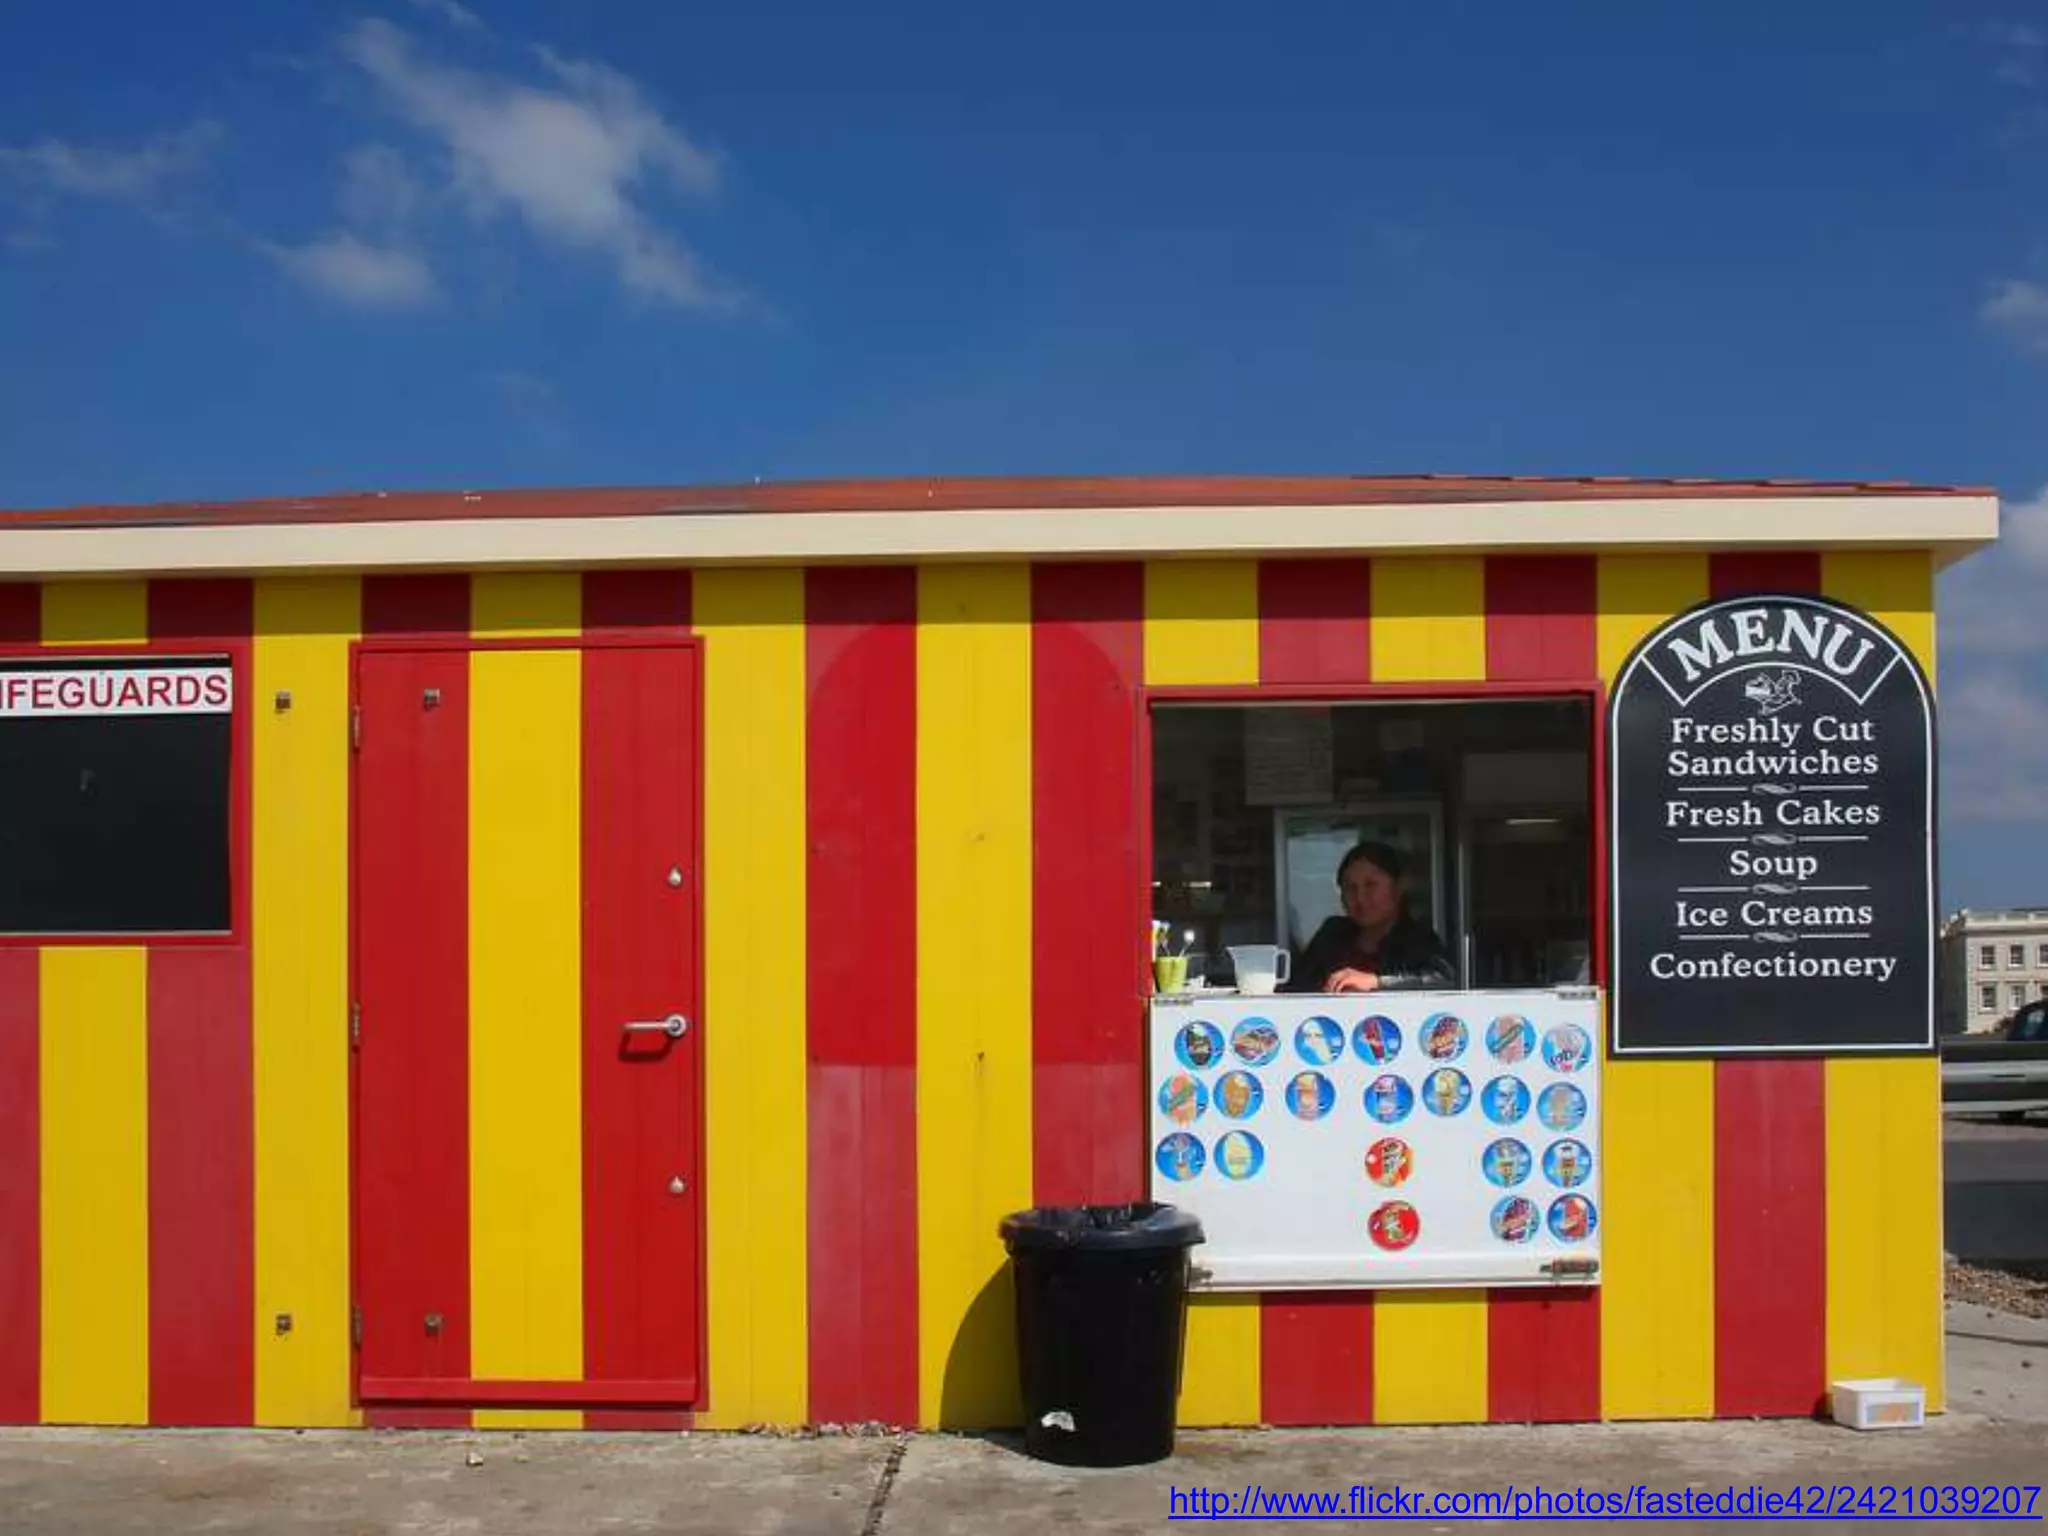
http://www.flickr.com/photos/fasteddie42/2421039207
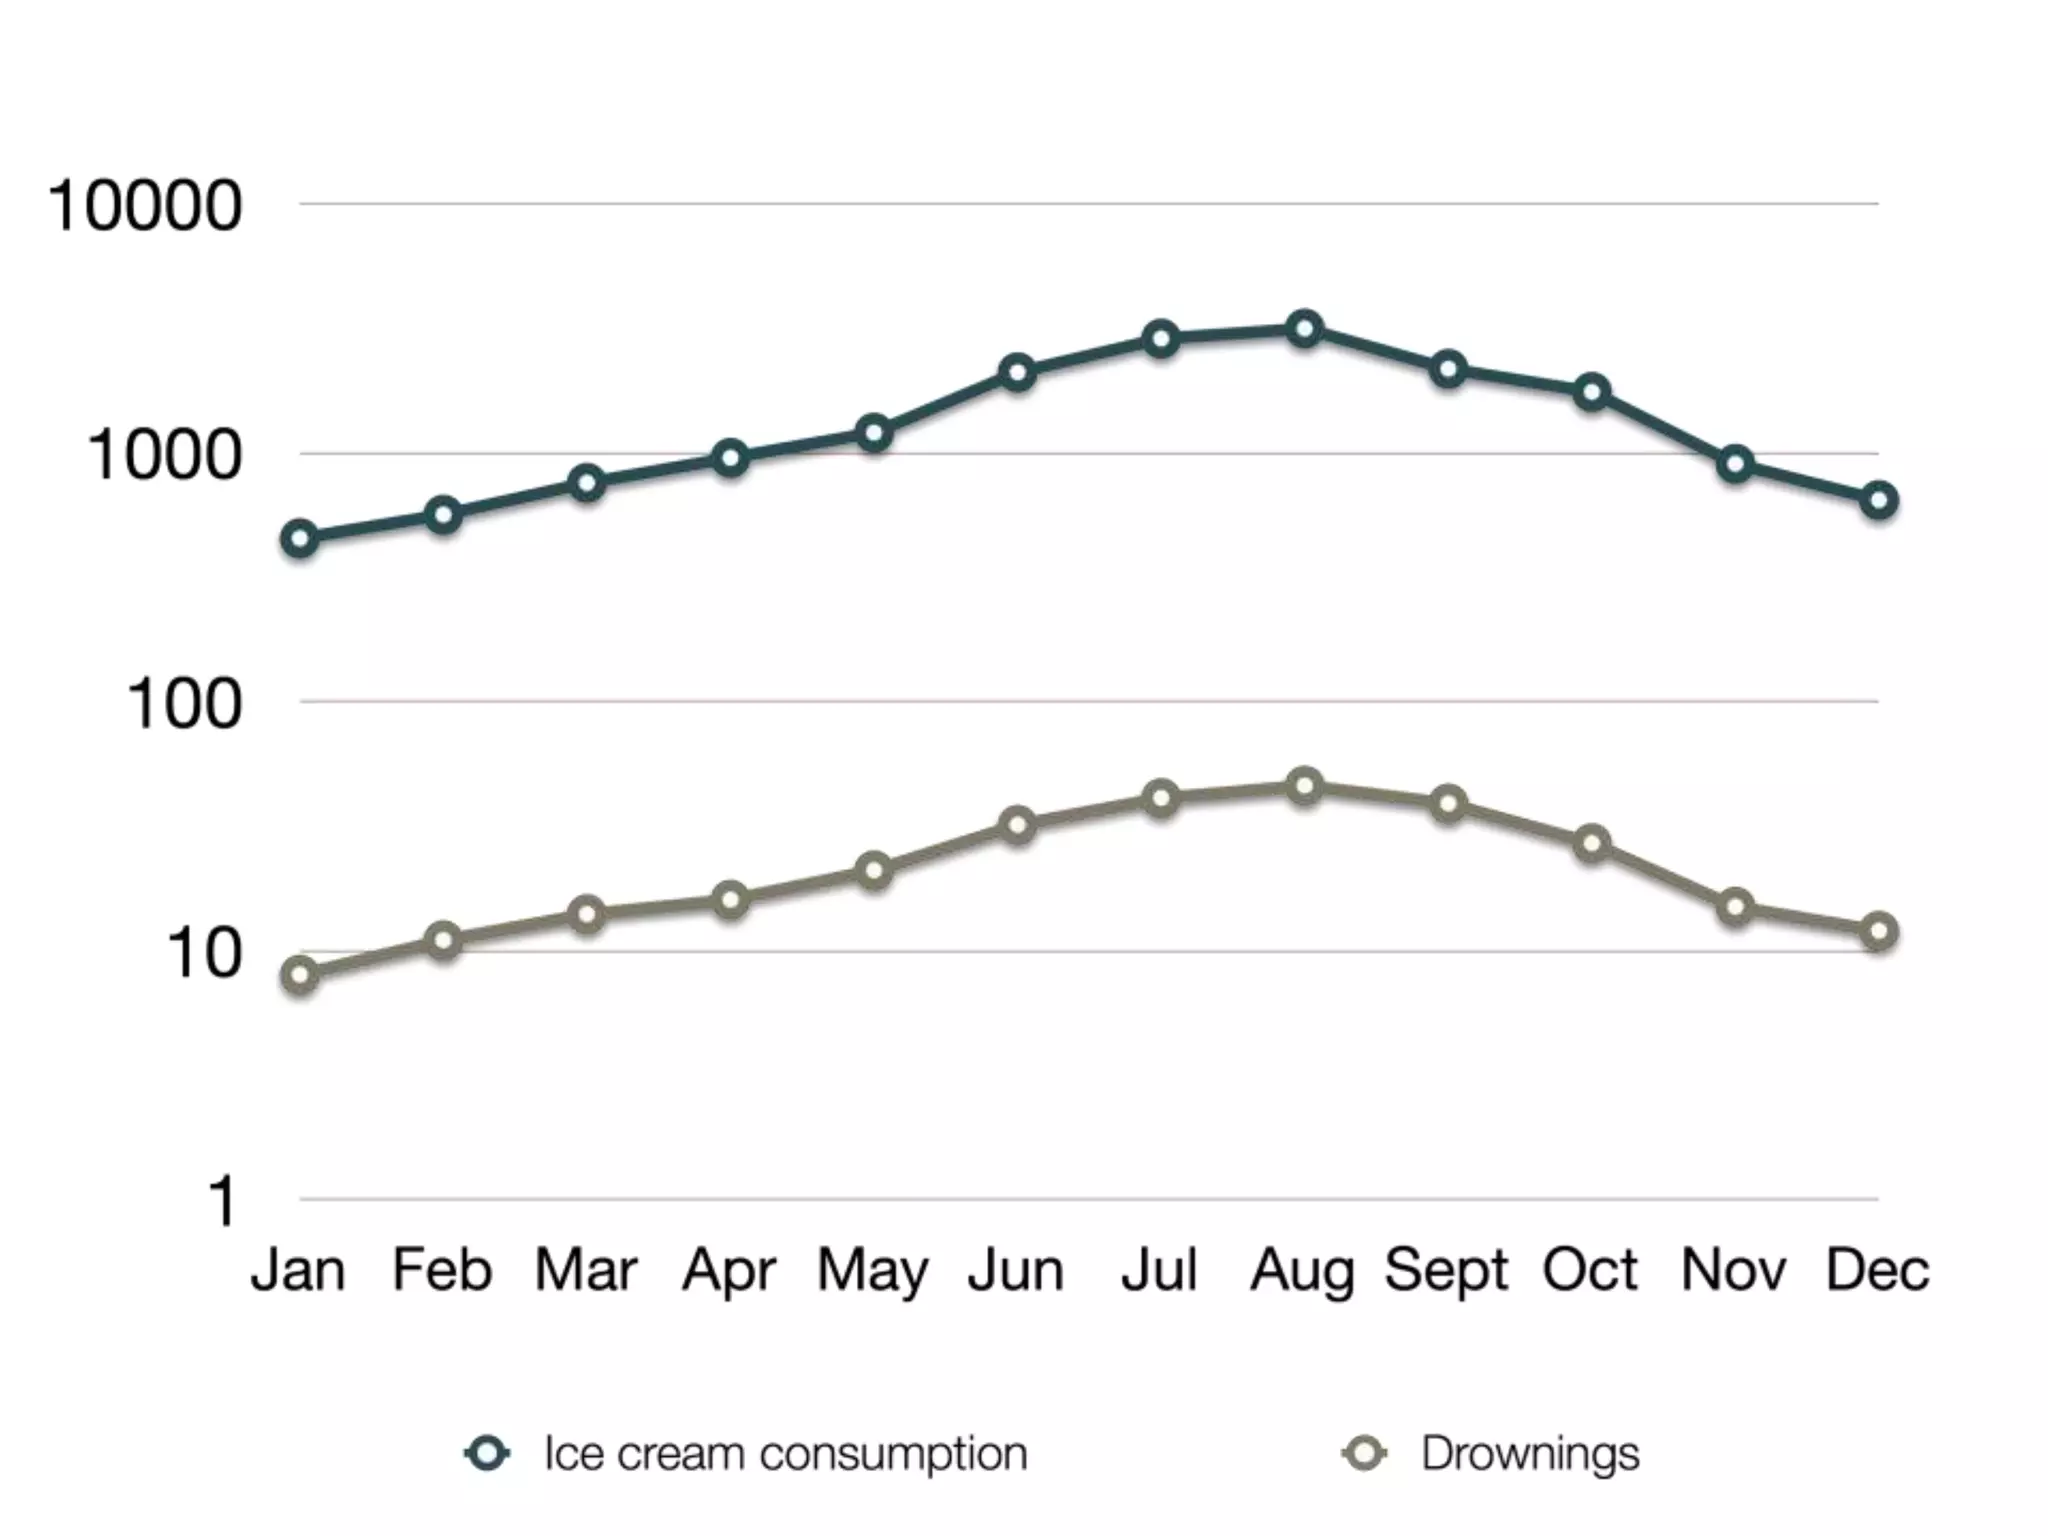
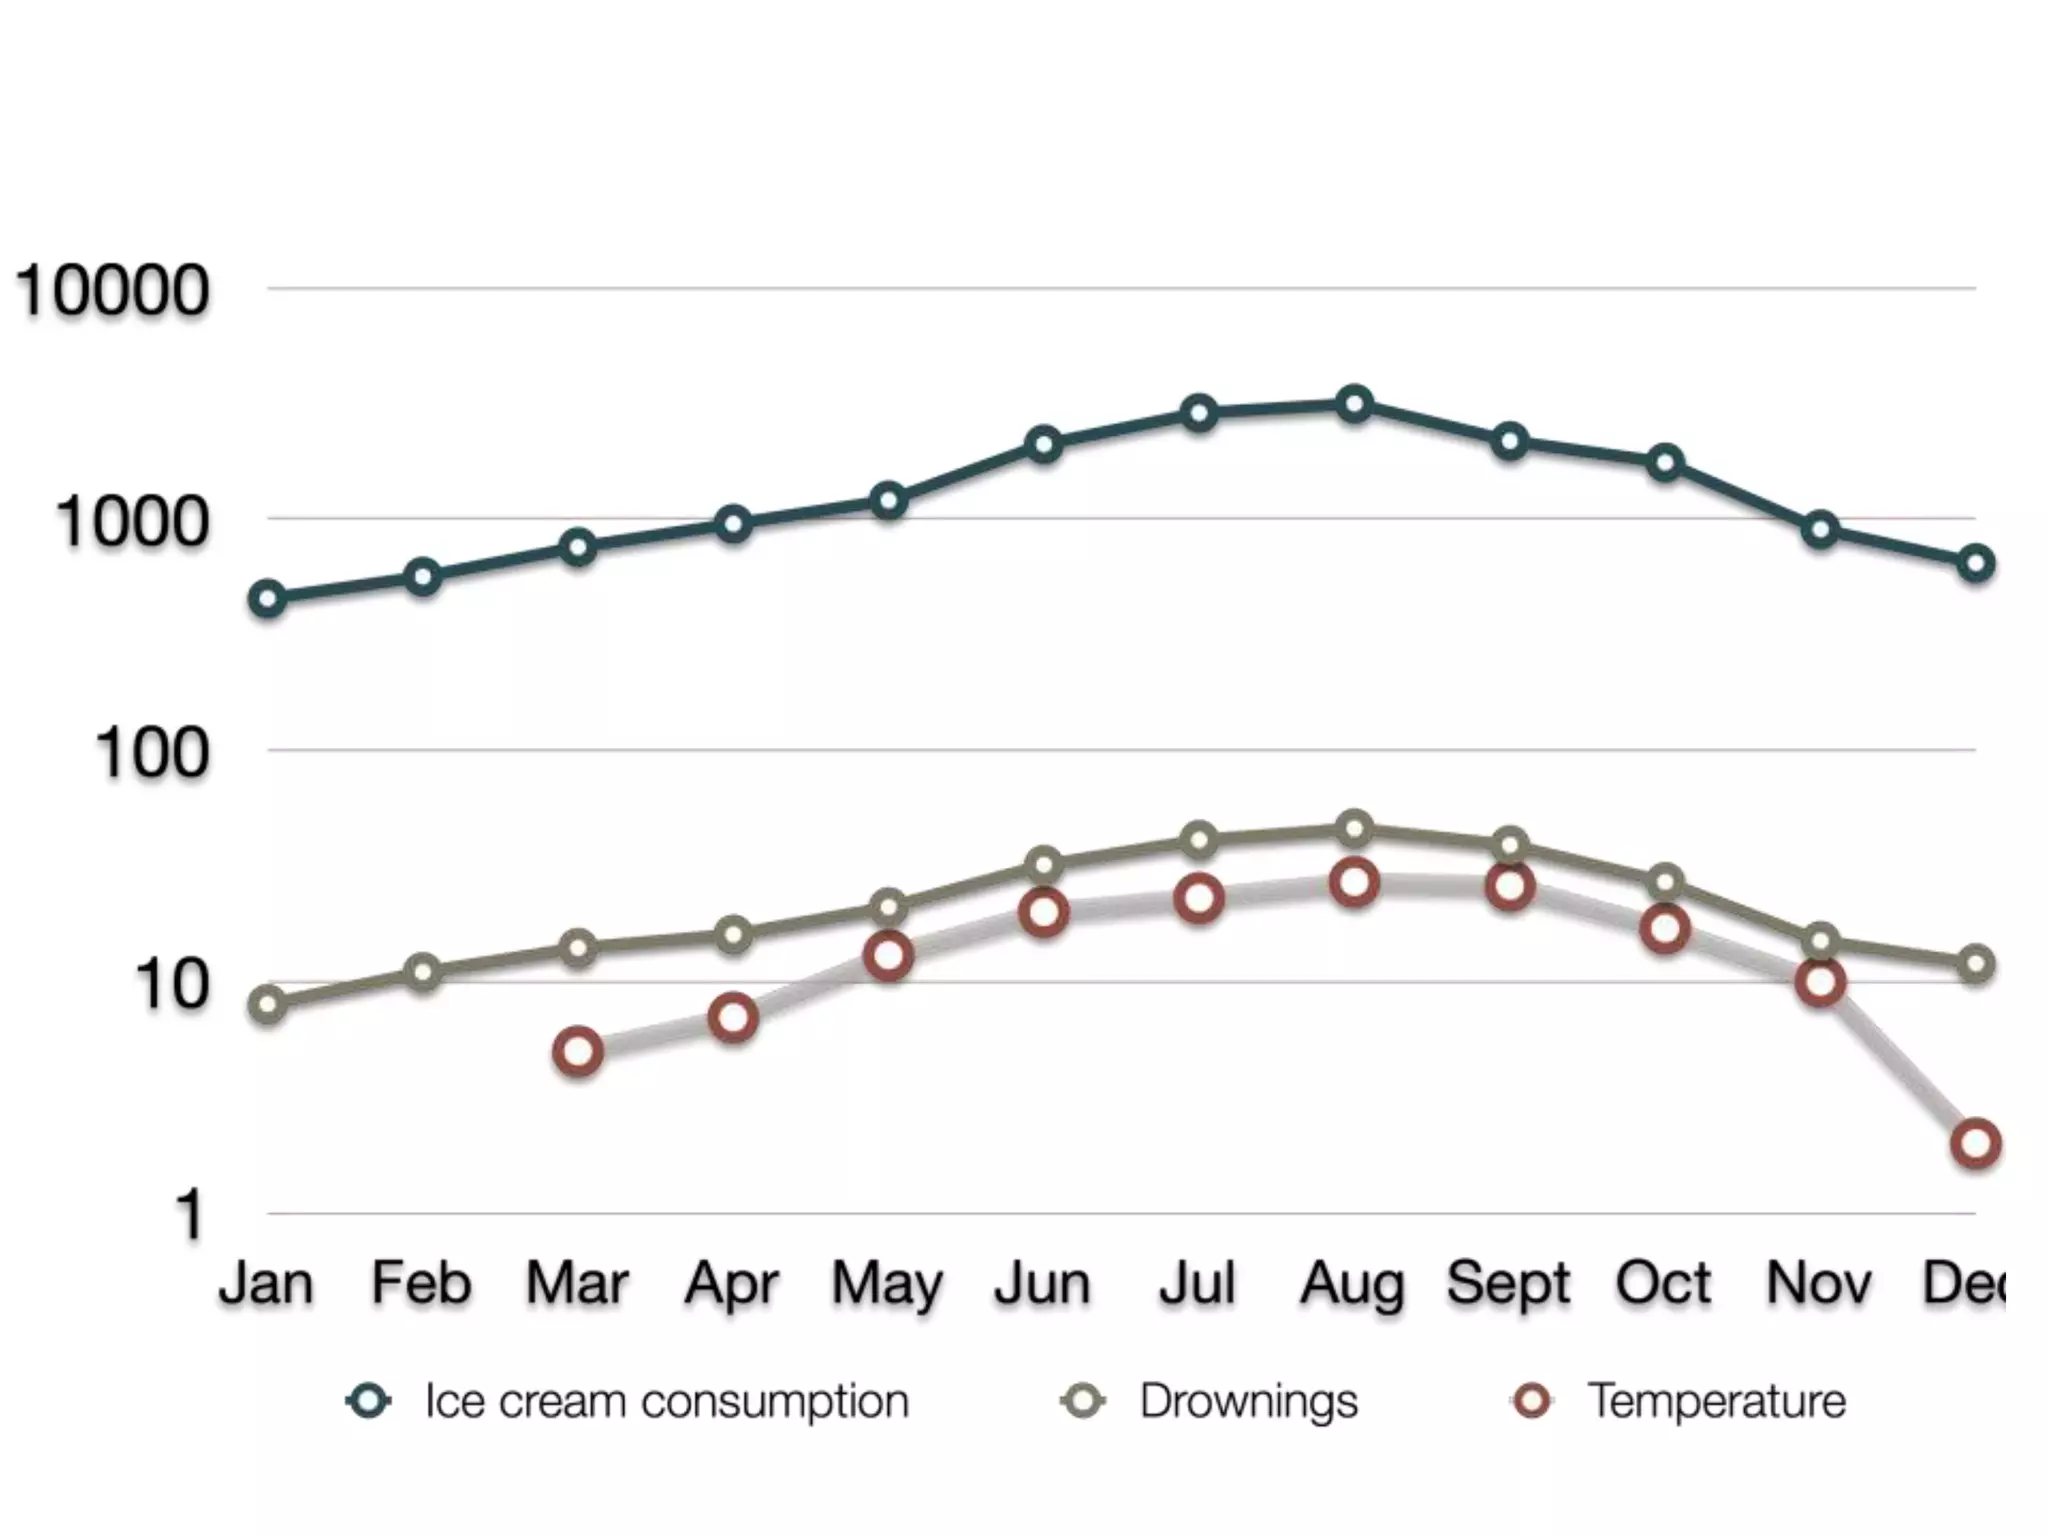
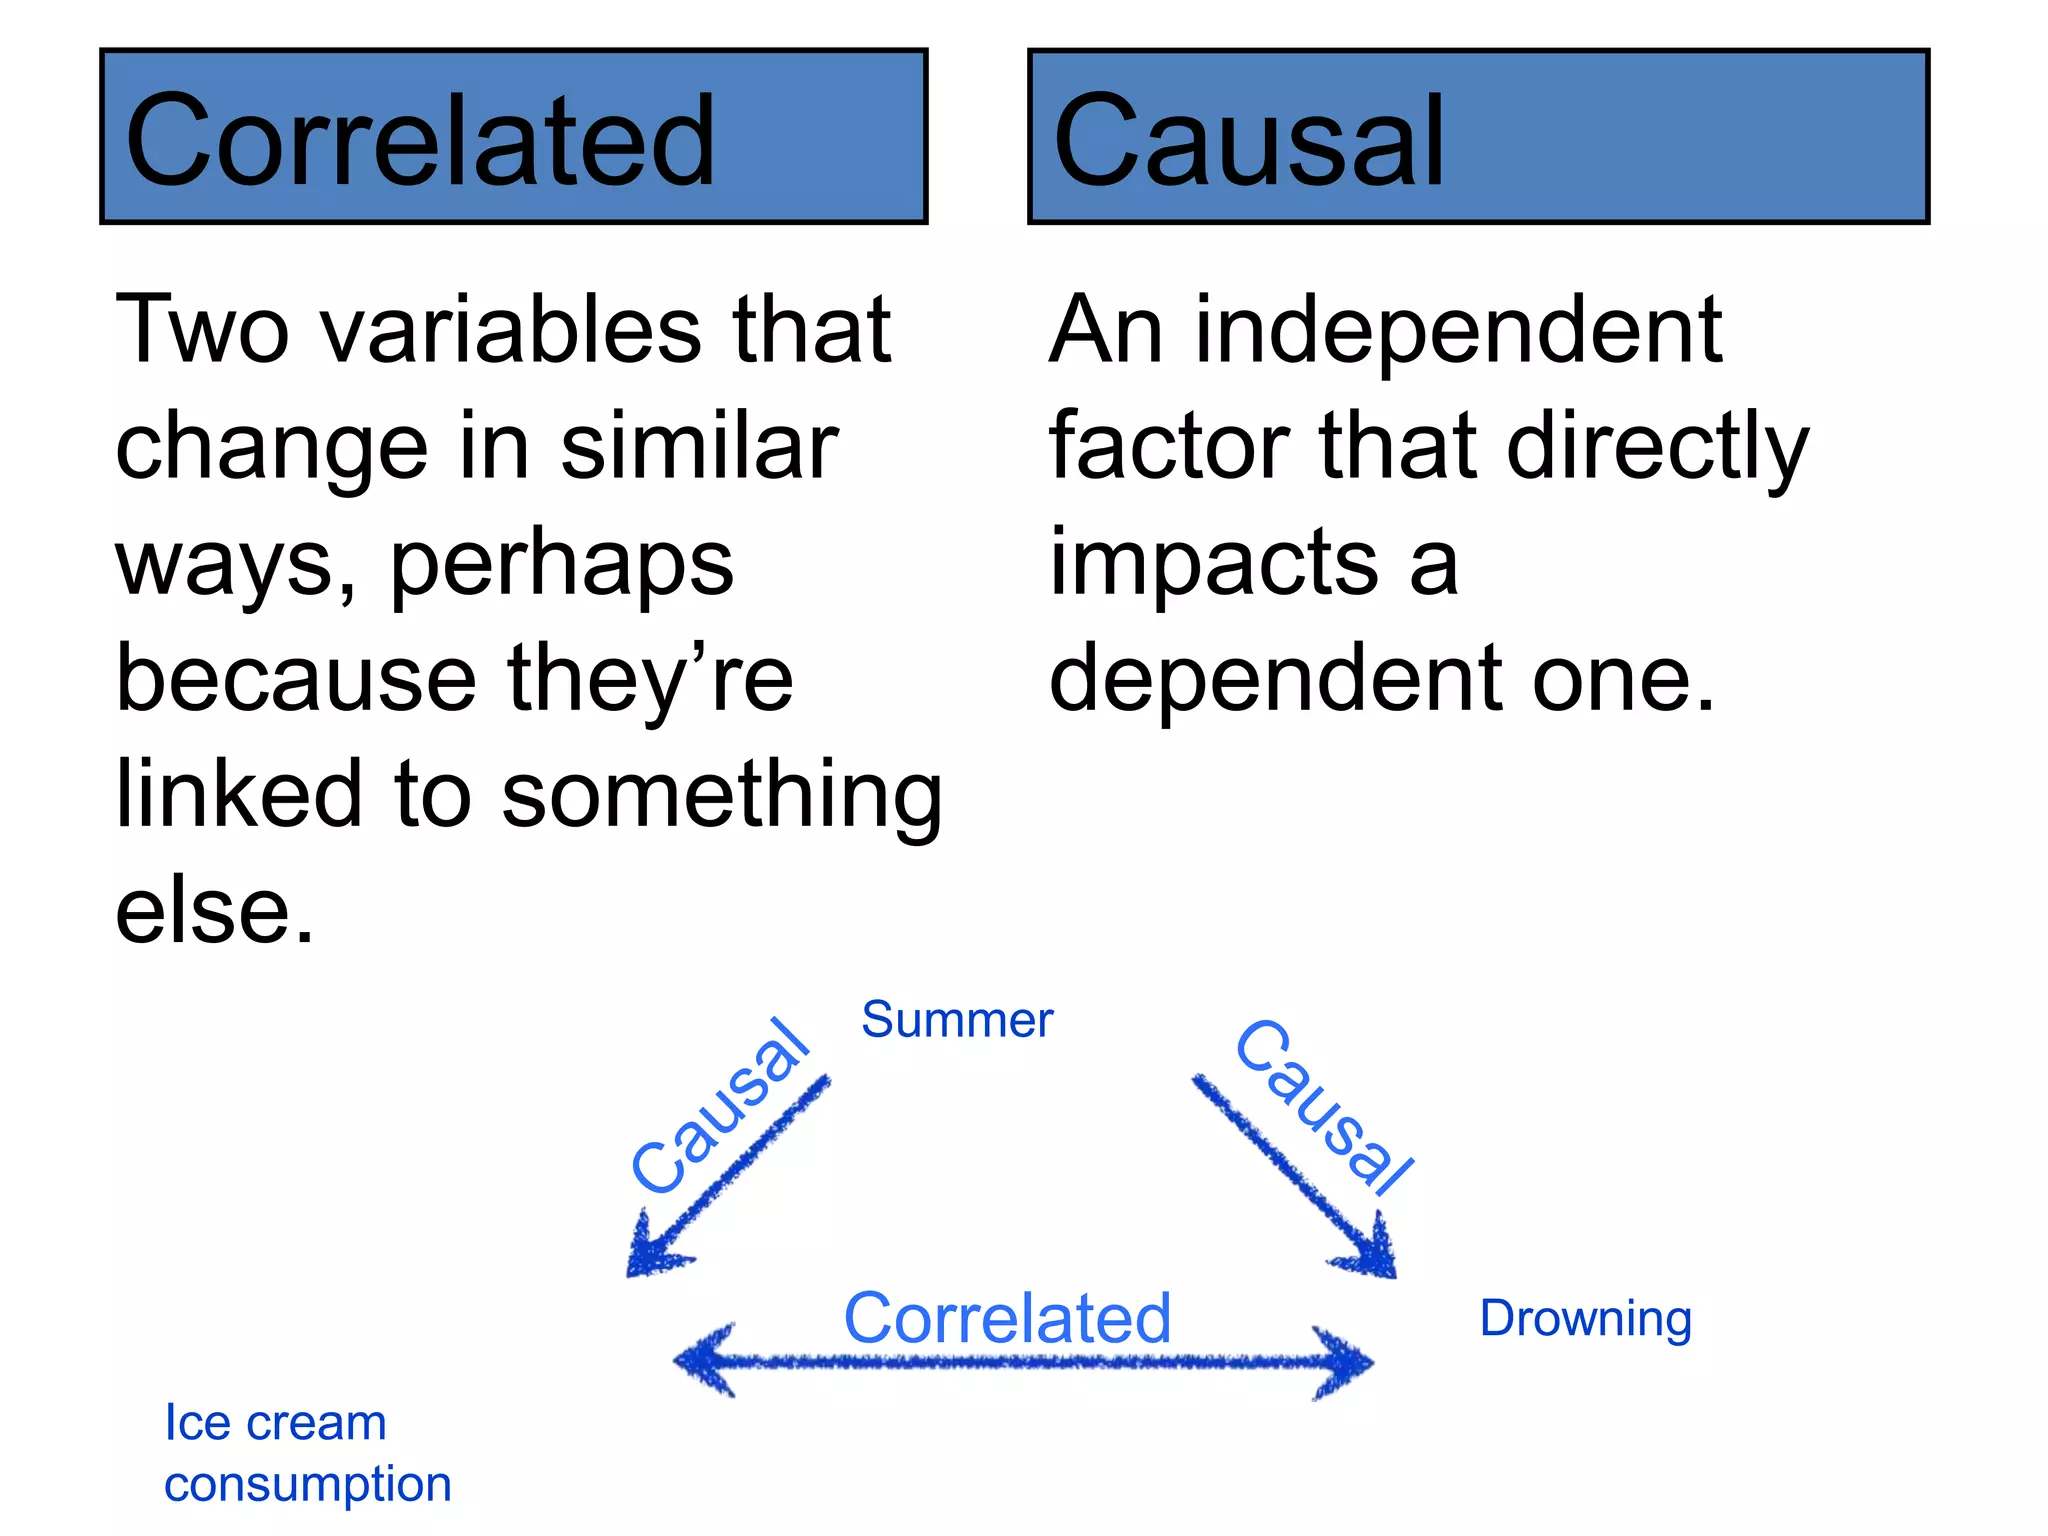
Correlated            Causal
Two variables that    An independent
change in similar     factor that directly
ways, perhaps         impacts a
because they‘re       dependent one.
linked to something
else.
                 Summer


                Correlated       Drowning

 Ice cream
 consumption
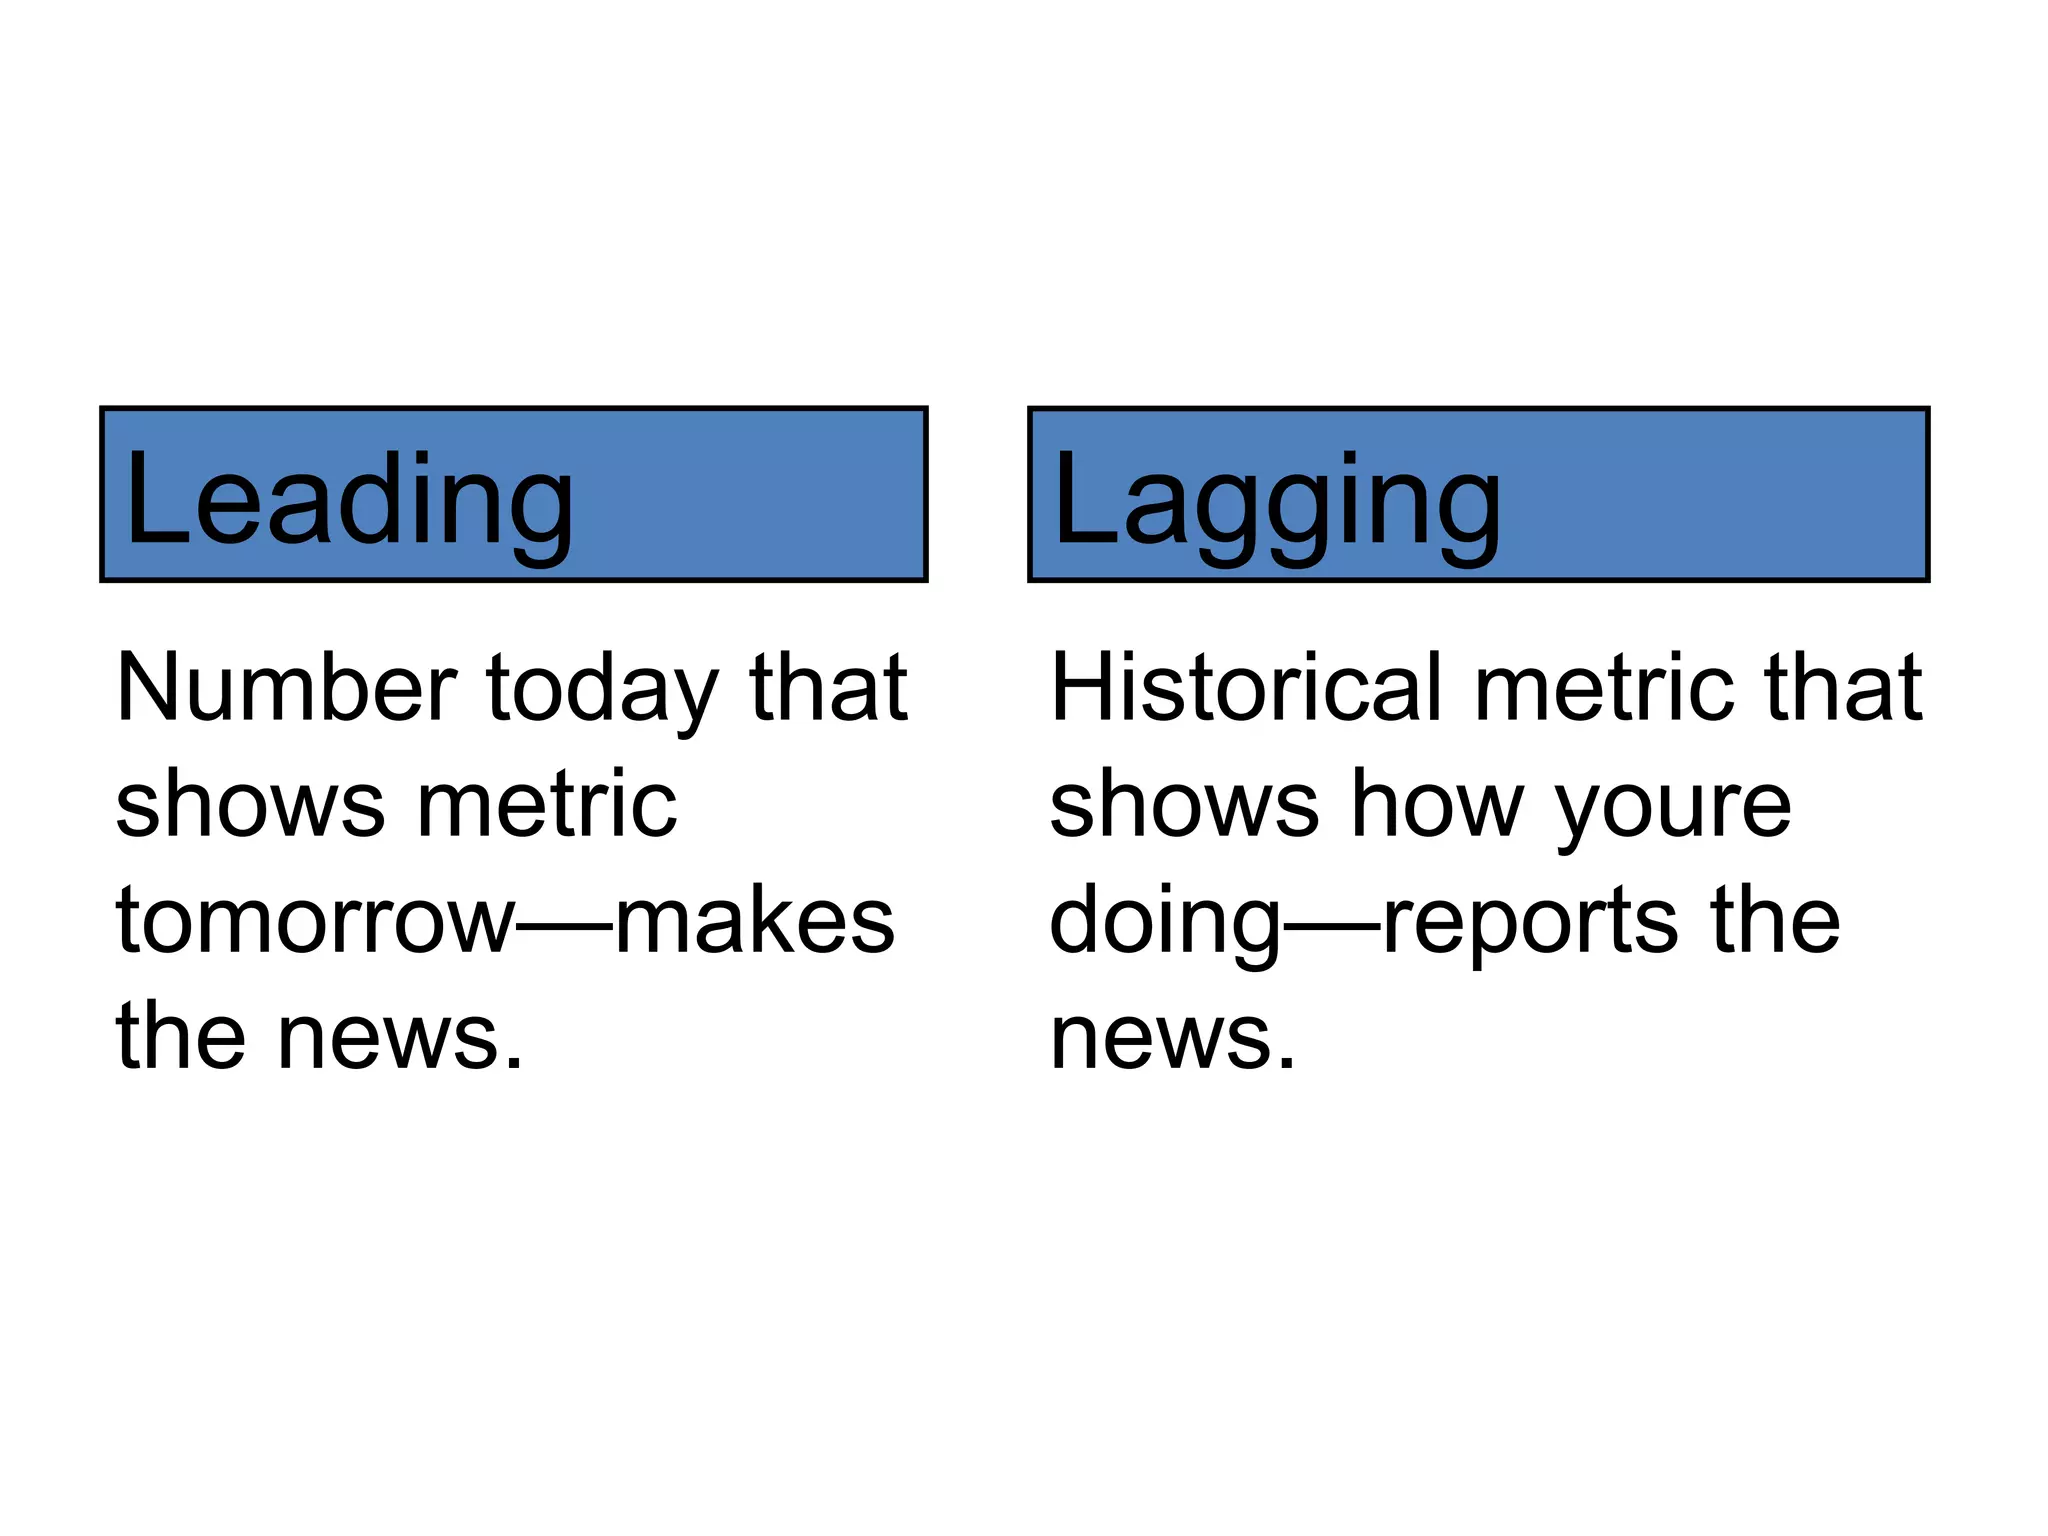
Leading             Lagging
Number today that   Historical metric that
shows metric        shows how youre
tomorrow—makes      doing—reports the
the news.           news.
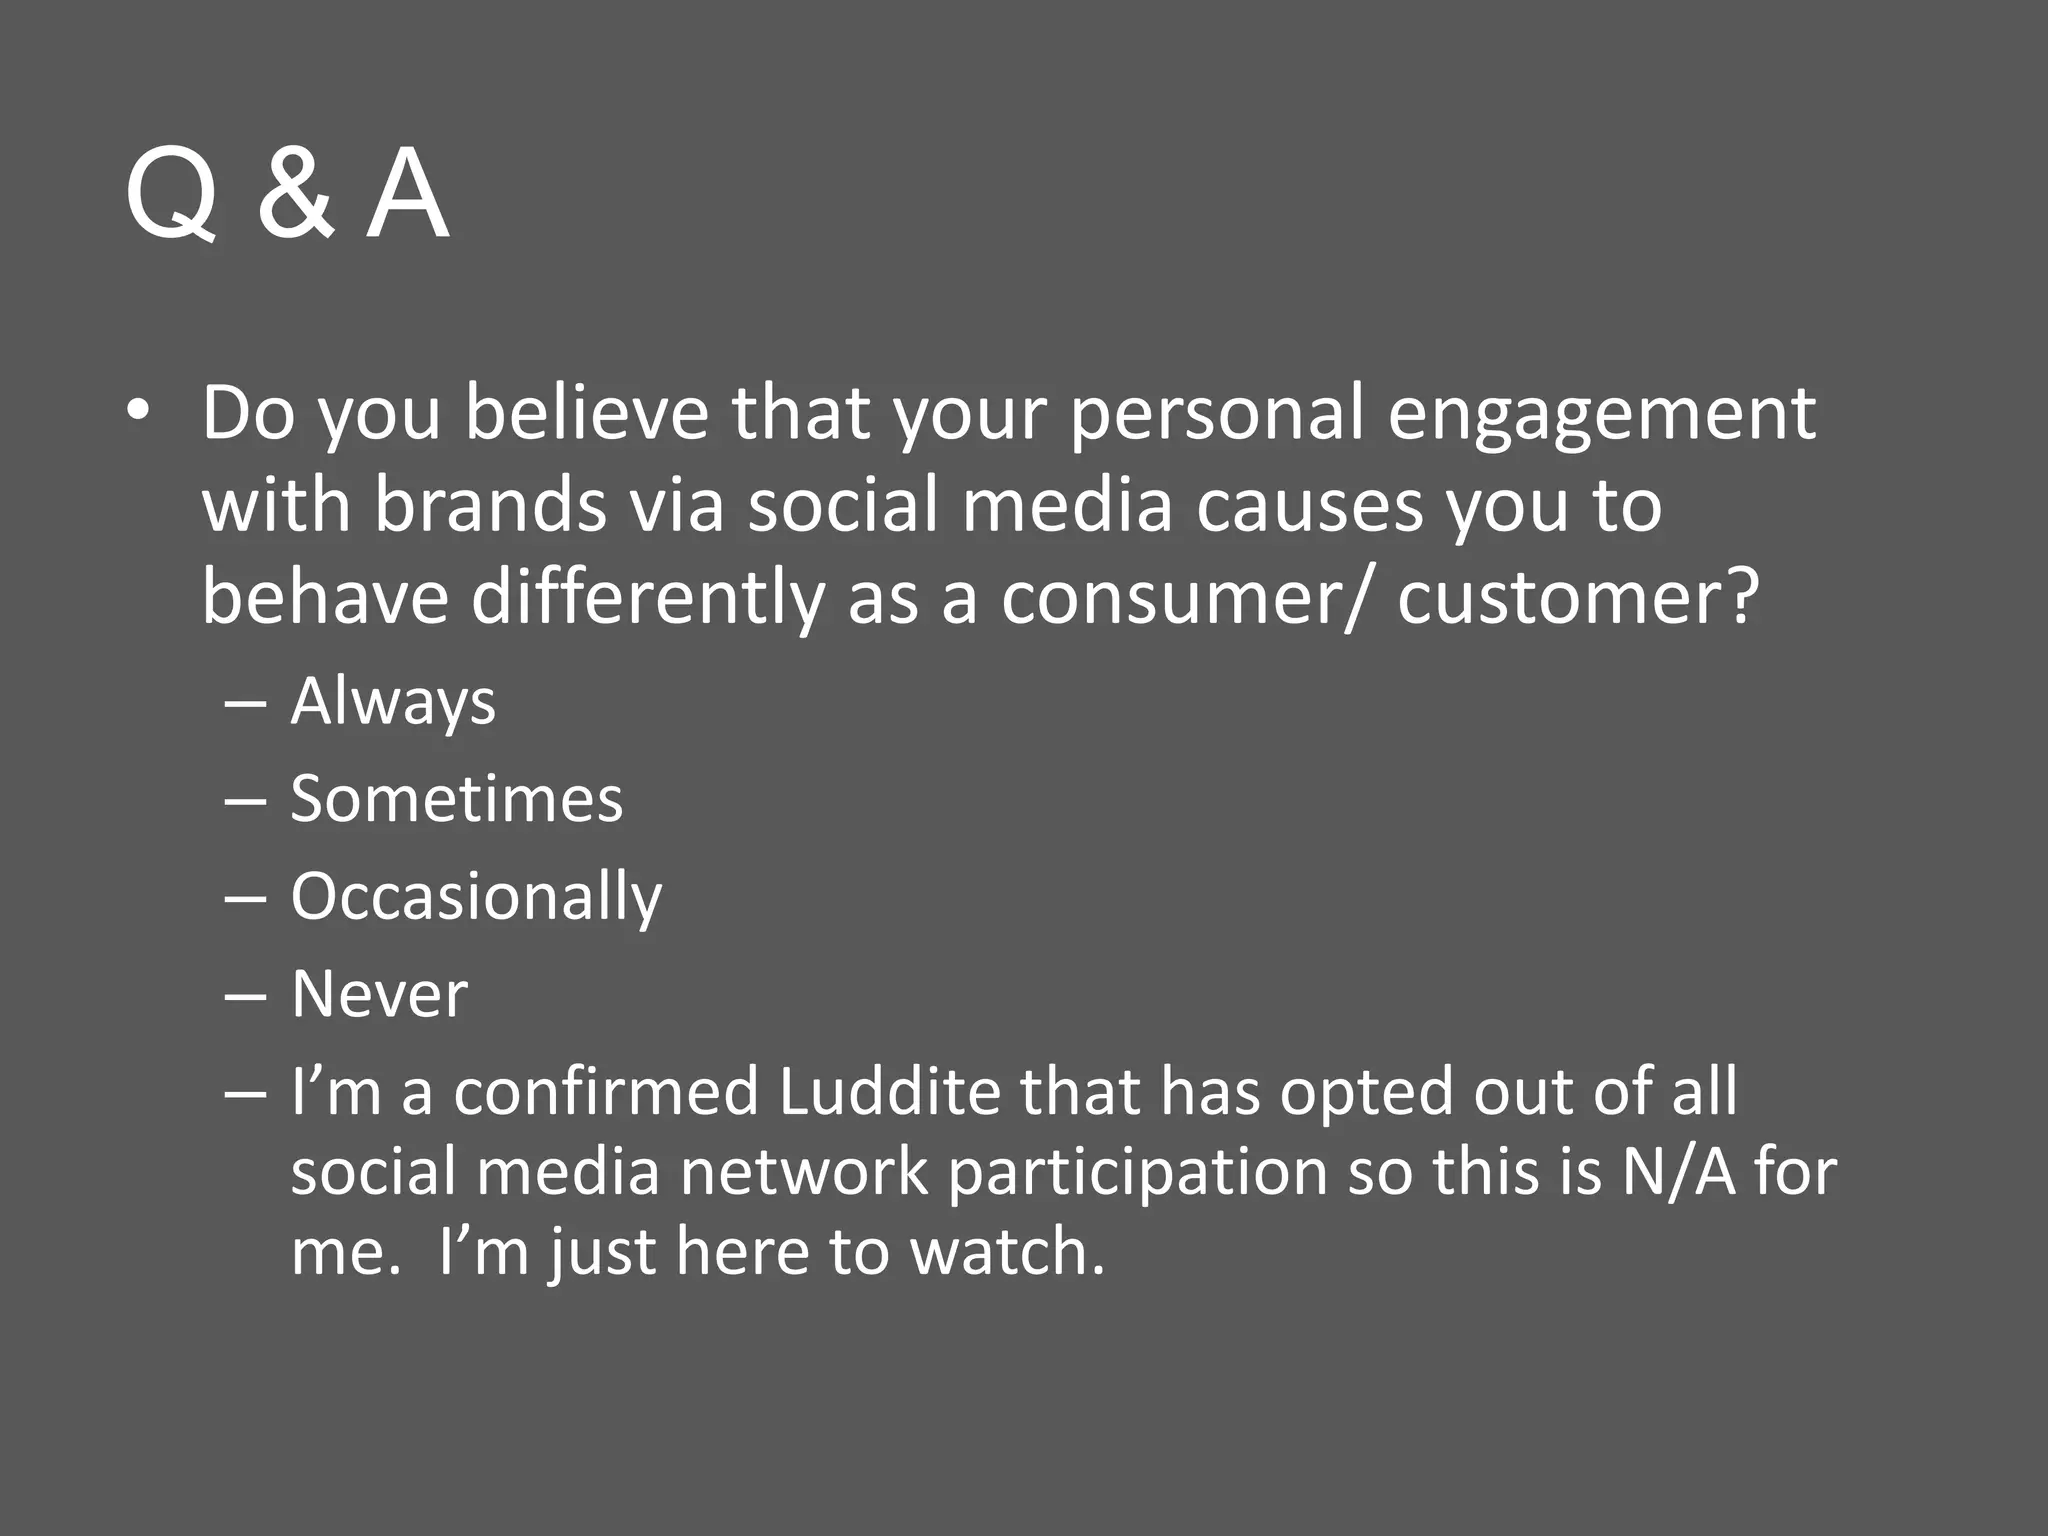
Q&A
• Do you believe that your personal engagement
  with brands via social media causes you to
  behave differently as a consumer/ customer?
  –   Always
  –   Sometimes
  –   Occasionally
  –   Never
  –   I’m a confirmed Luddite that has opted out of all
      social media network participation so this is N/A for
      me. I’m just here to watch.
Q&A
• Do you believe that consumer/ customer
  engagement with your brand(s) via social
  media causes new behaviors or is social media
  engagement with your brand(s) correlated to
  other phenomena?
  – Causative
  – Correlative
  – Both. Depends on the situation
  – Neither
Social Media Monitoring:
Metrics & Tools
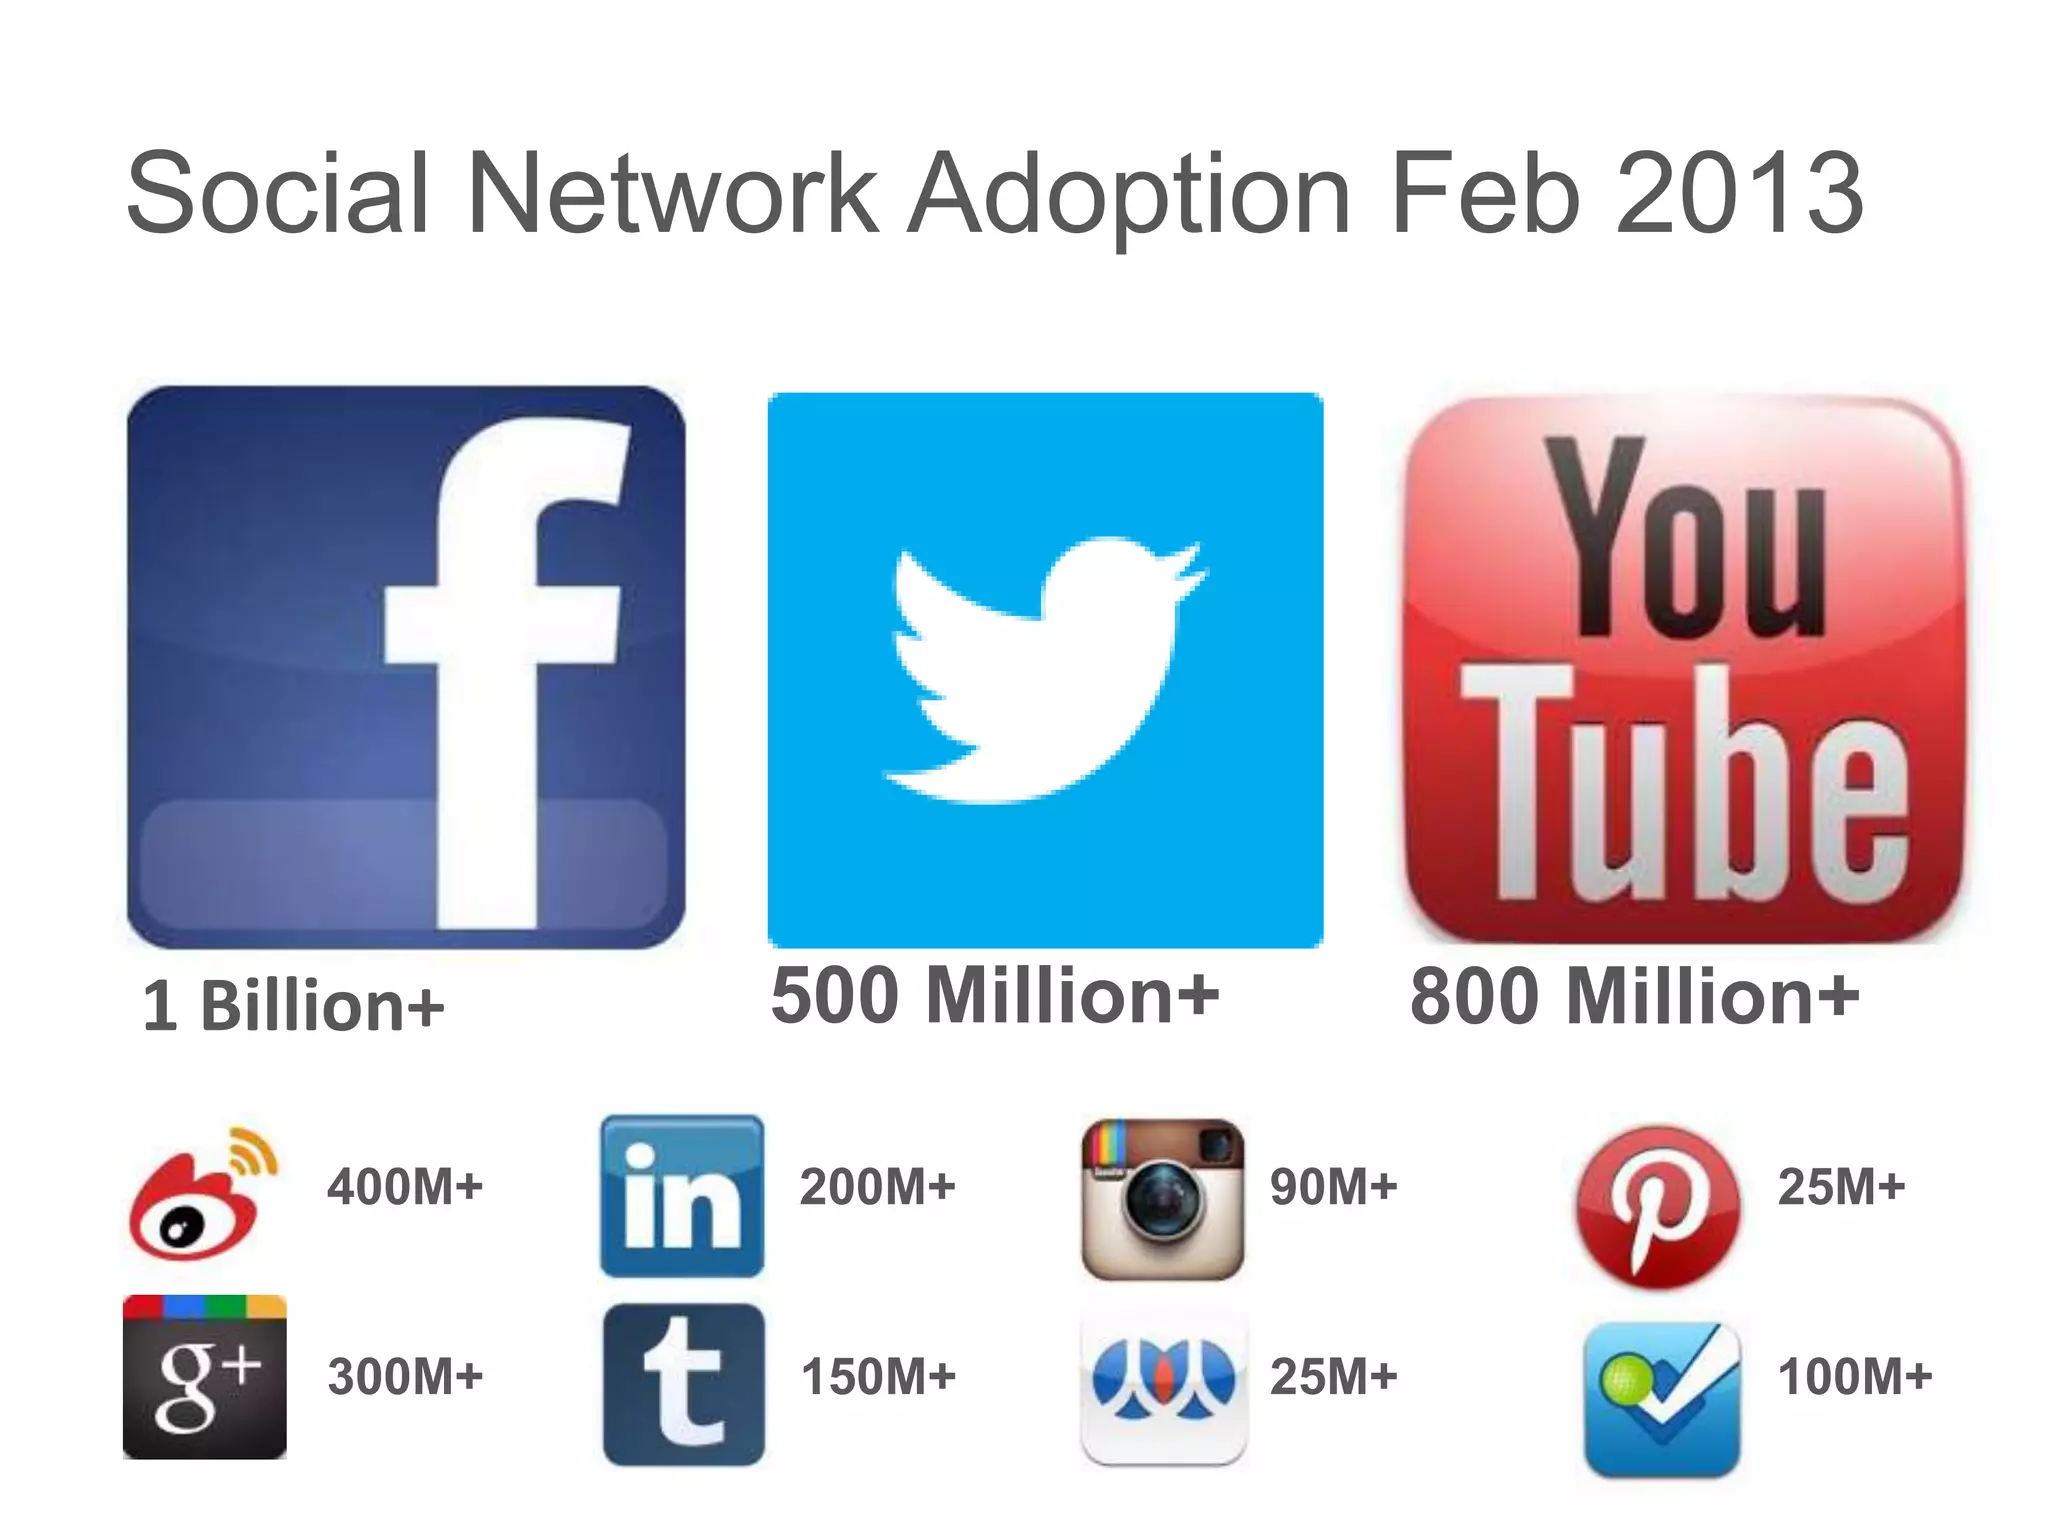
Social Network Adoption Feb 2013


1 Billion+    500 Million+          800 Million+

      400M+   200M+          90M+            25M+


      300M+   150M+          25M+            100M+
Social Media Monitoring: Collection
of and insight into UGC
•   Mentions by network/ media type
•   Volume trends over time
•   Semantic analysis/ themes
•   Sentiment analysis
•   Limited geo data
•   Limited demo data
•   Limited influencer data
•   Some traditional media monitoring capabilities
•   Slicing & Dicing capabilities
Partial List of Social Media
Monitoring Applications
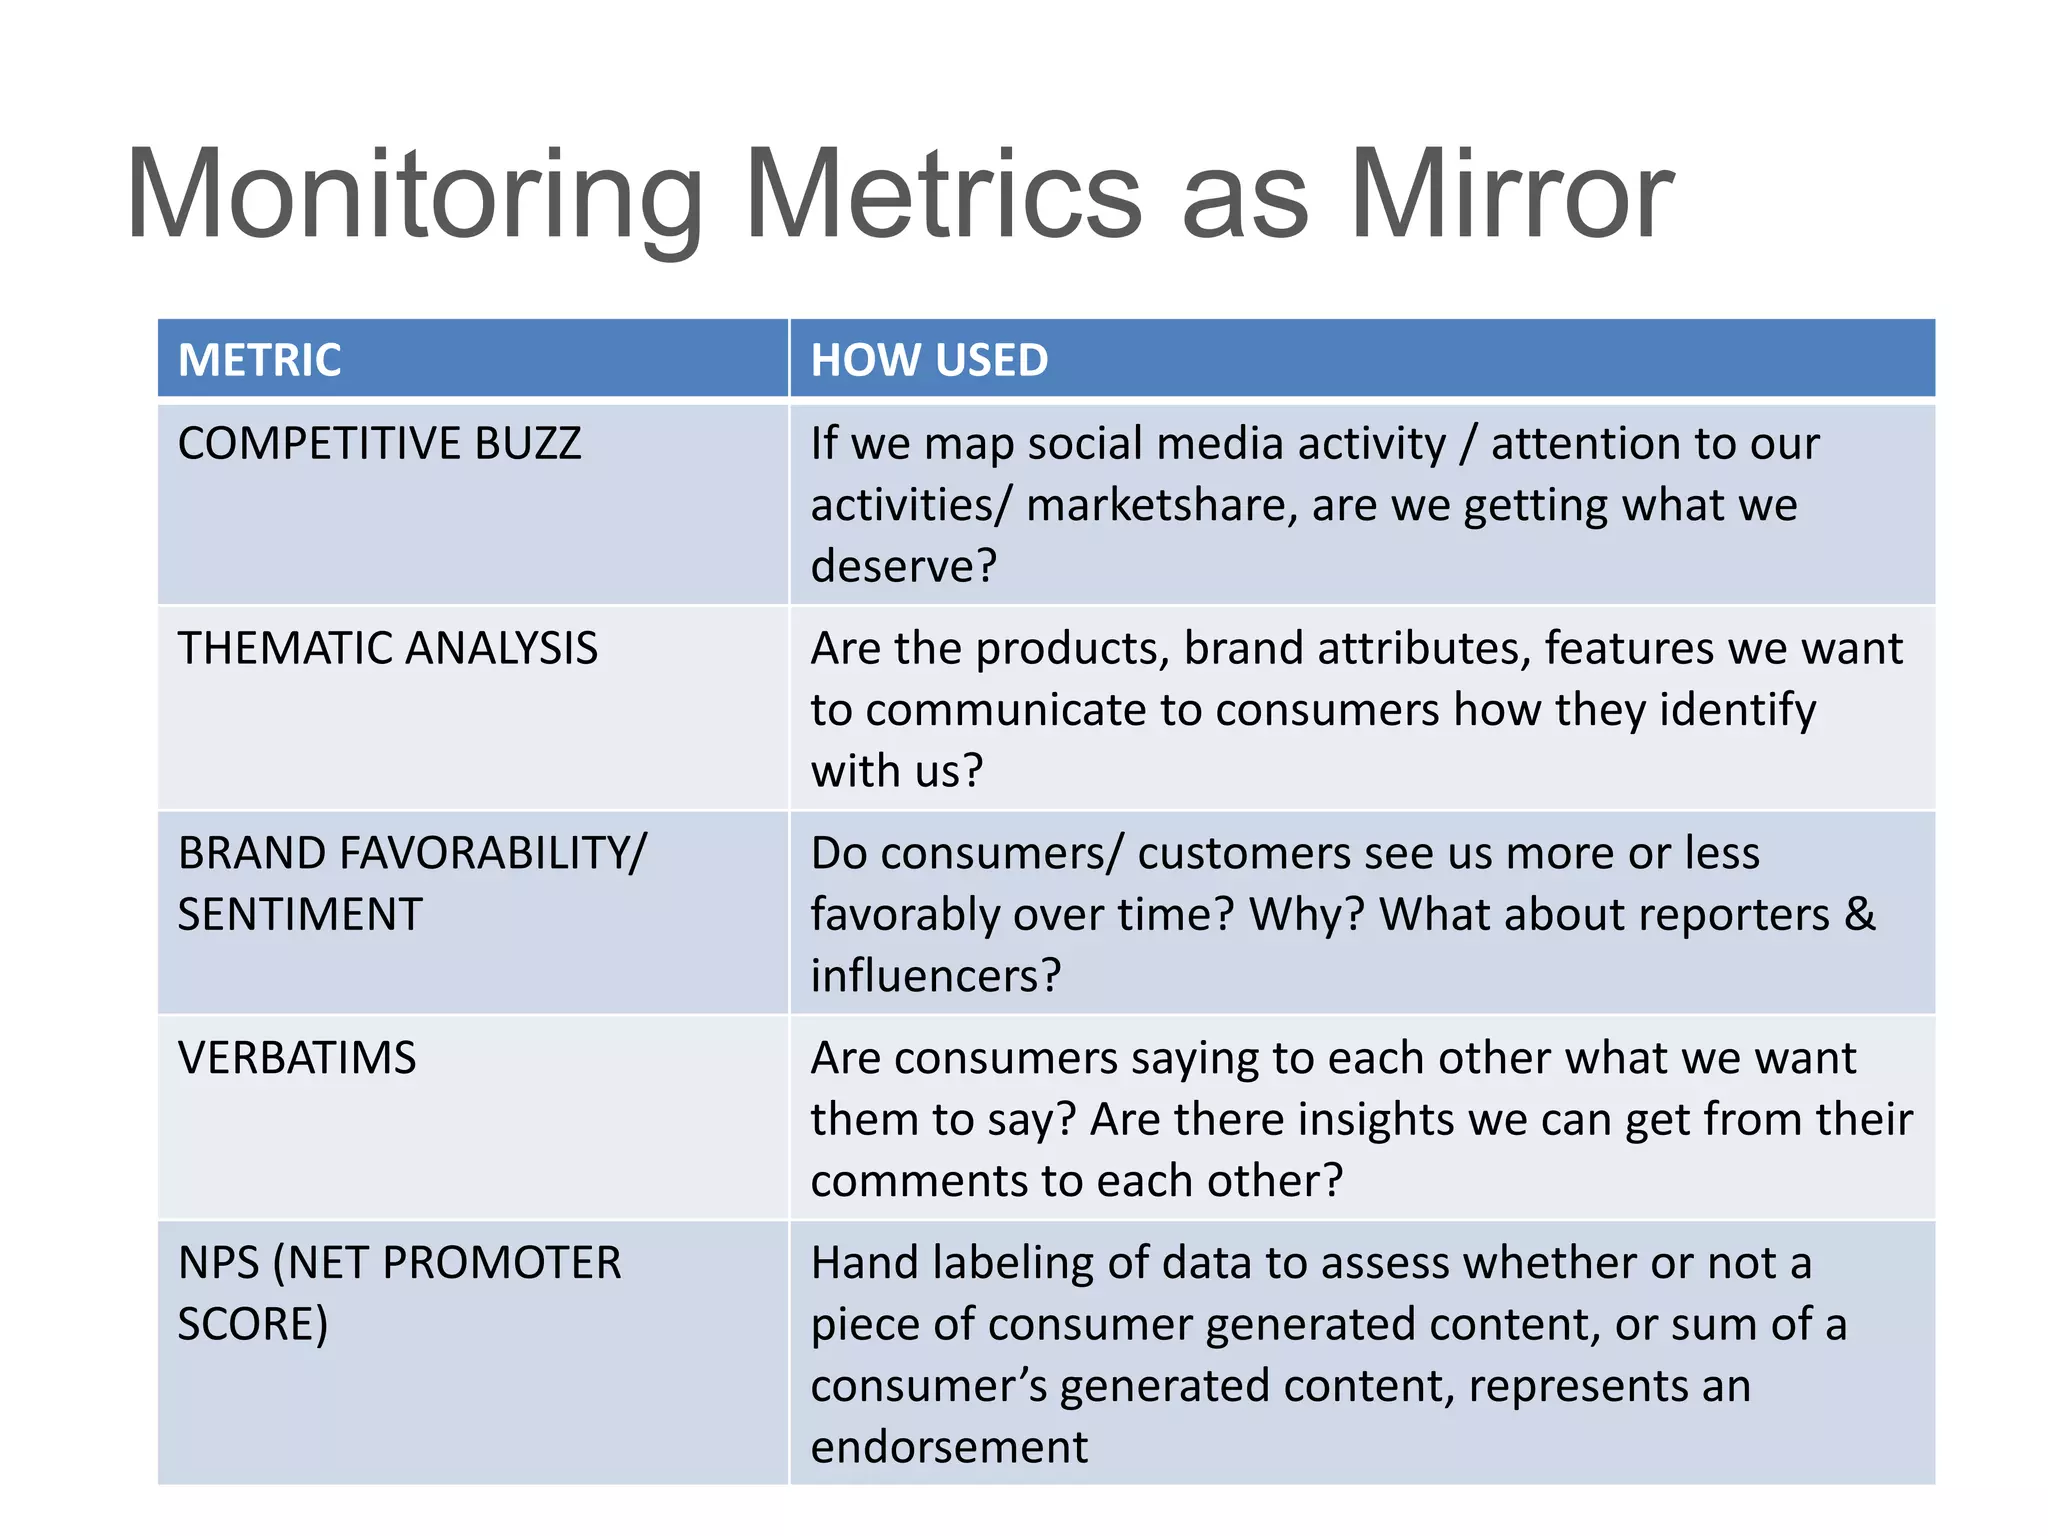
Monitoring Metrics as Mirror
METRIC                HOW USED
COMPETITIVE BUZZ      If we map social media activity / attention to our
                      activities/ marketshare, are we getting what we
                      deserve?
THEMATIC ANALYSIS     Are the products, brand attributes, features we want
                      to communicate to consumers how they identify
                      with us?
BRAND FAVORABILITY/   Do consumers/ customers see us more or less
SENTIMENT             favorably over time? Why? What about reporters &
                      influencers?
VERBATIMS             Are consumers saying to each other what we want
                      them to say? Are there insights we can get from their
                      comments to each other?
NPS (NET PROMOTER     Hand labeling of data to assess whether or not a
SCORE)                piece of consumer generated content, or sum of a
                      consumer’s generated content, represents an
                      endorsement
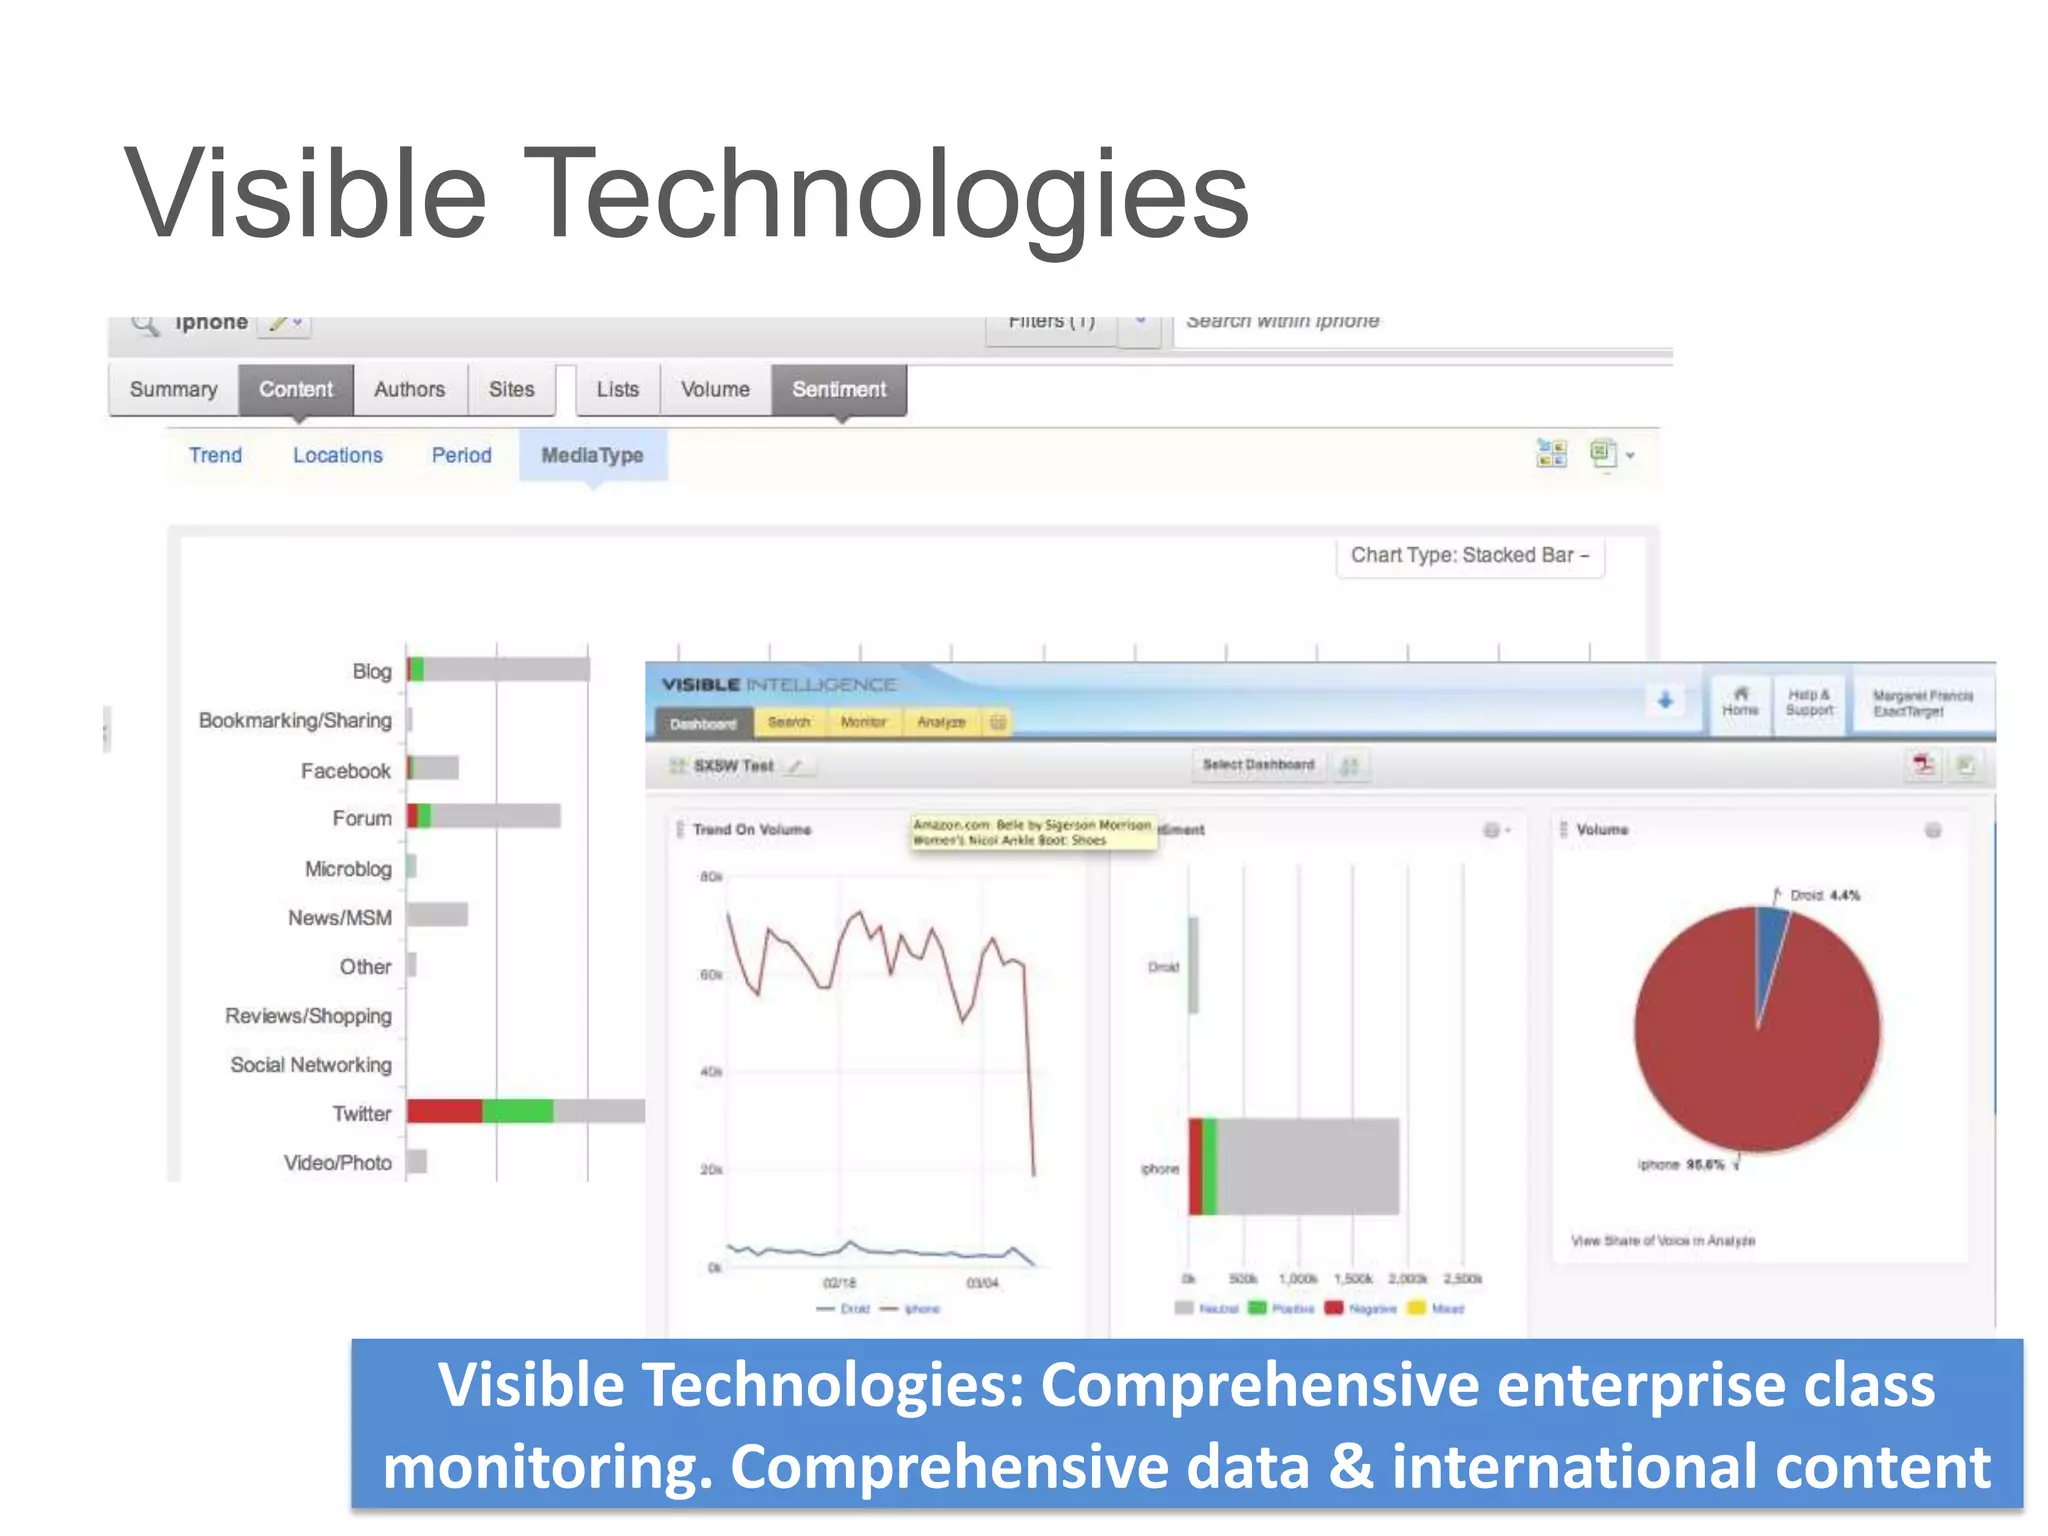
Visible Technologies


     Visible Technologies: Comprehensive enterprise class
    monitoring. Comprehensive data & international content
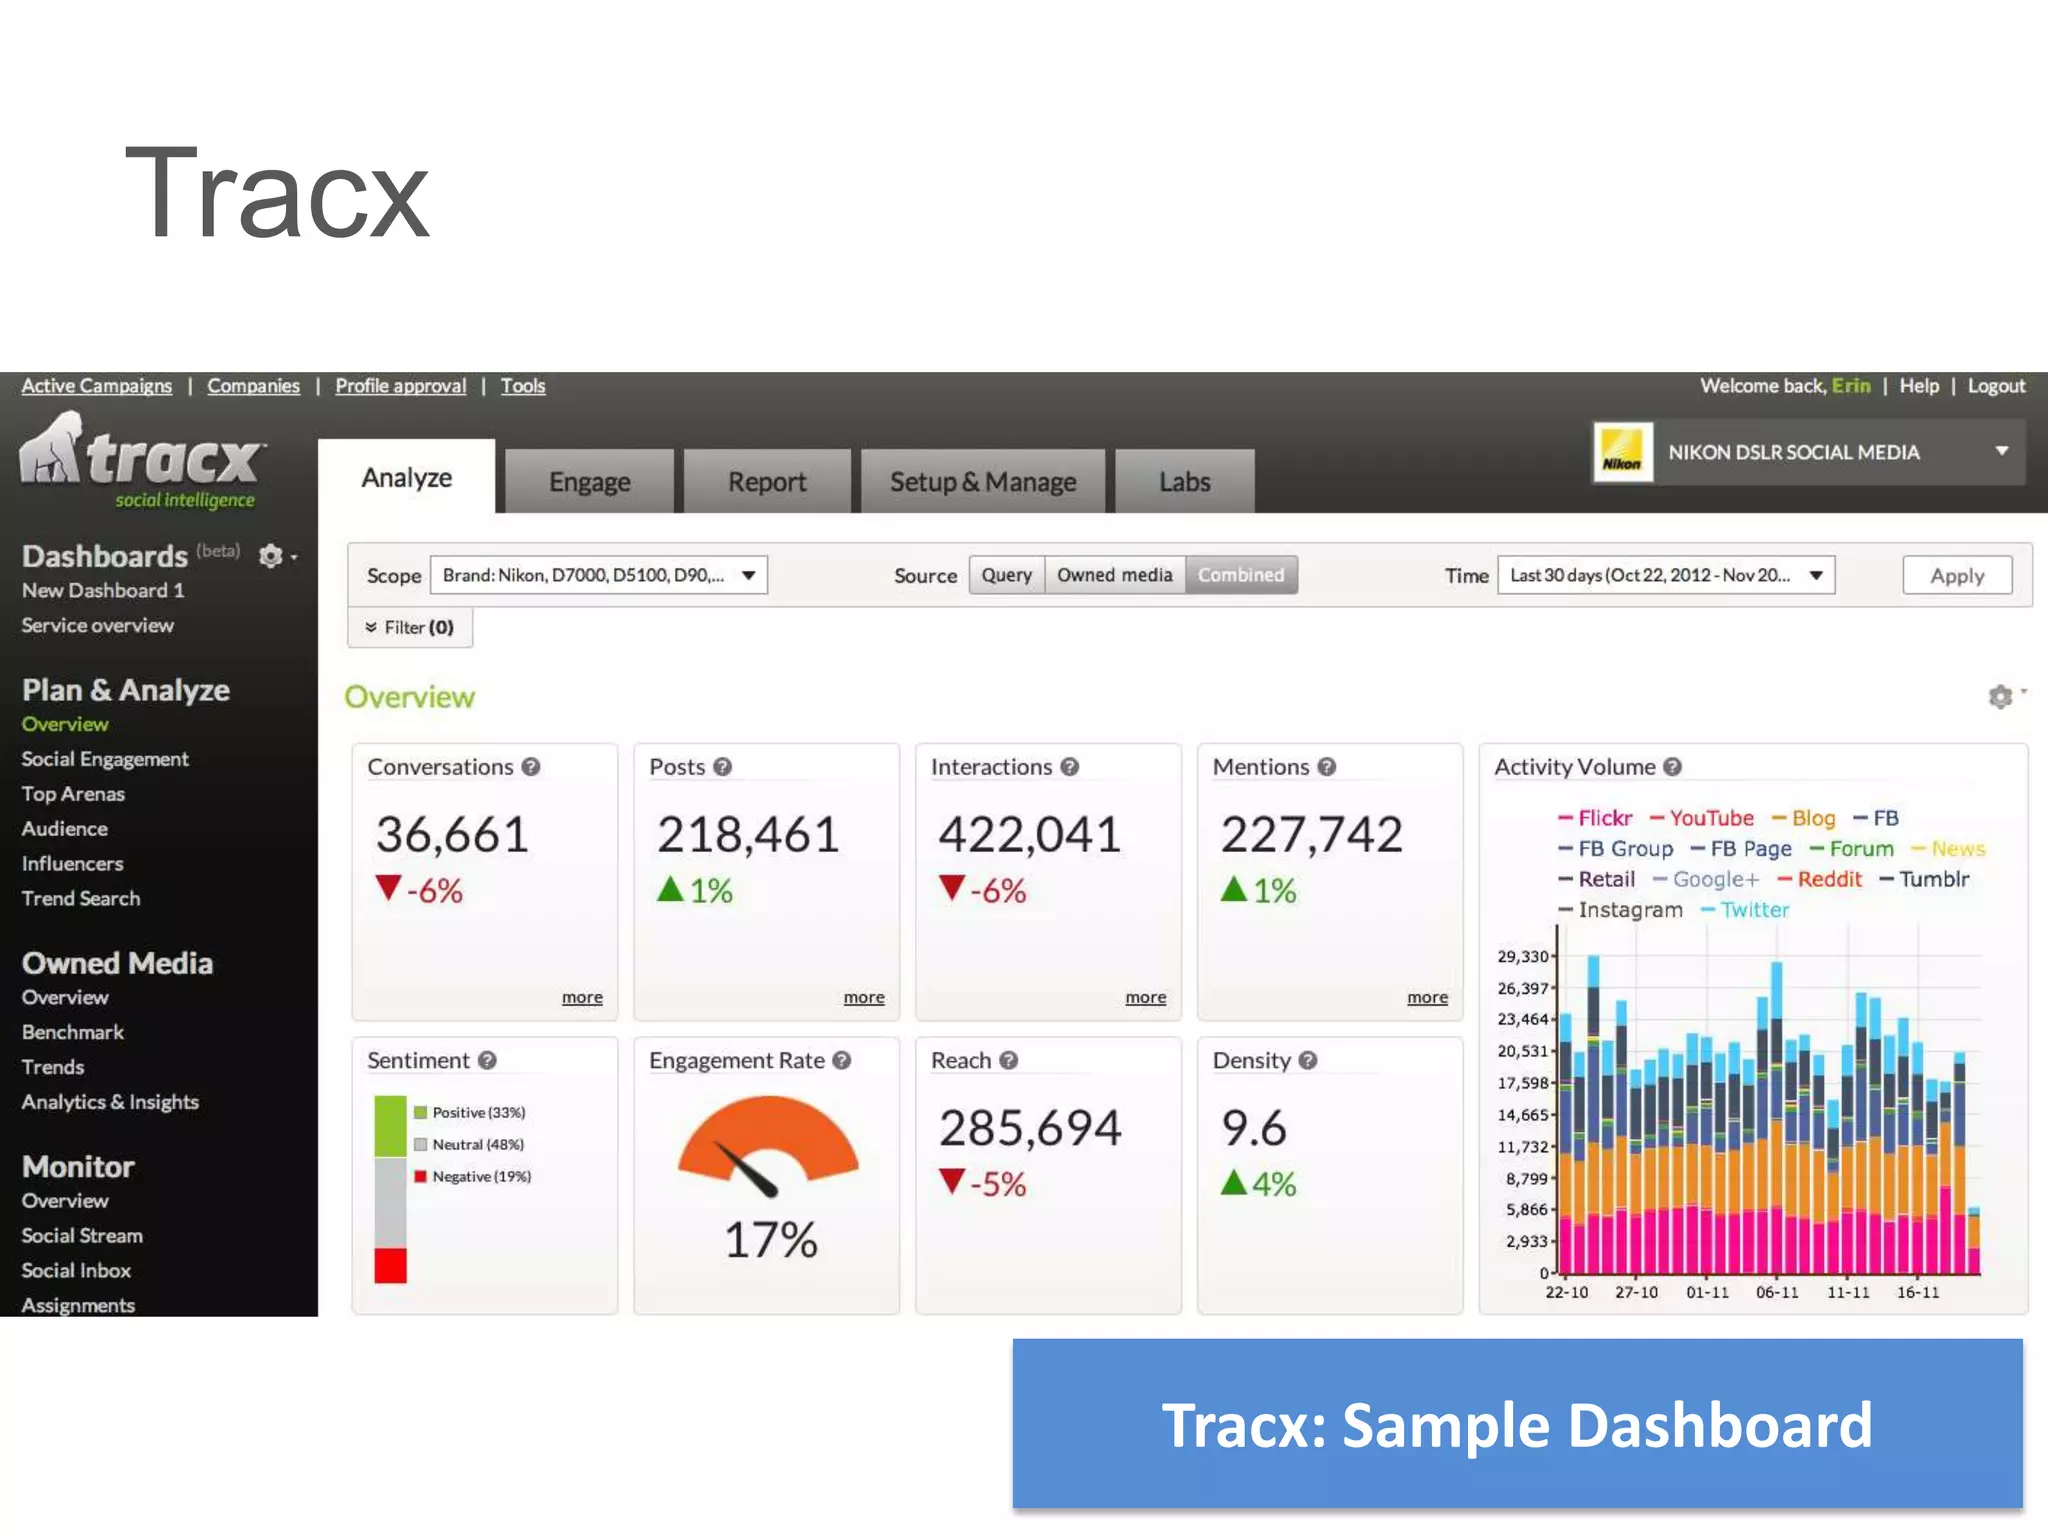
Tracx


        Tracx: Sample Dashboard
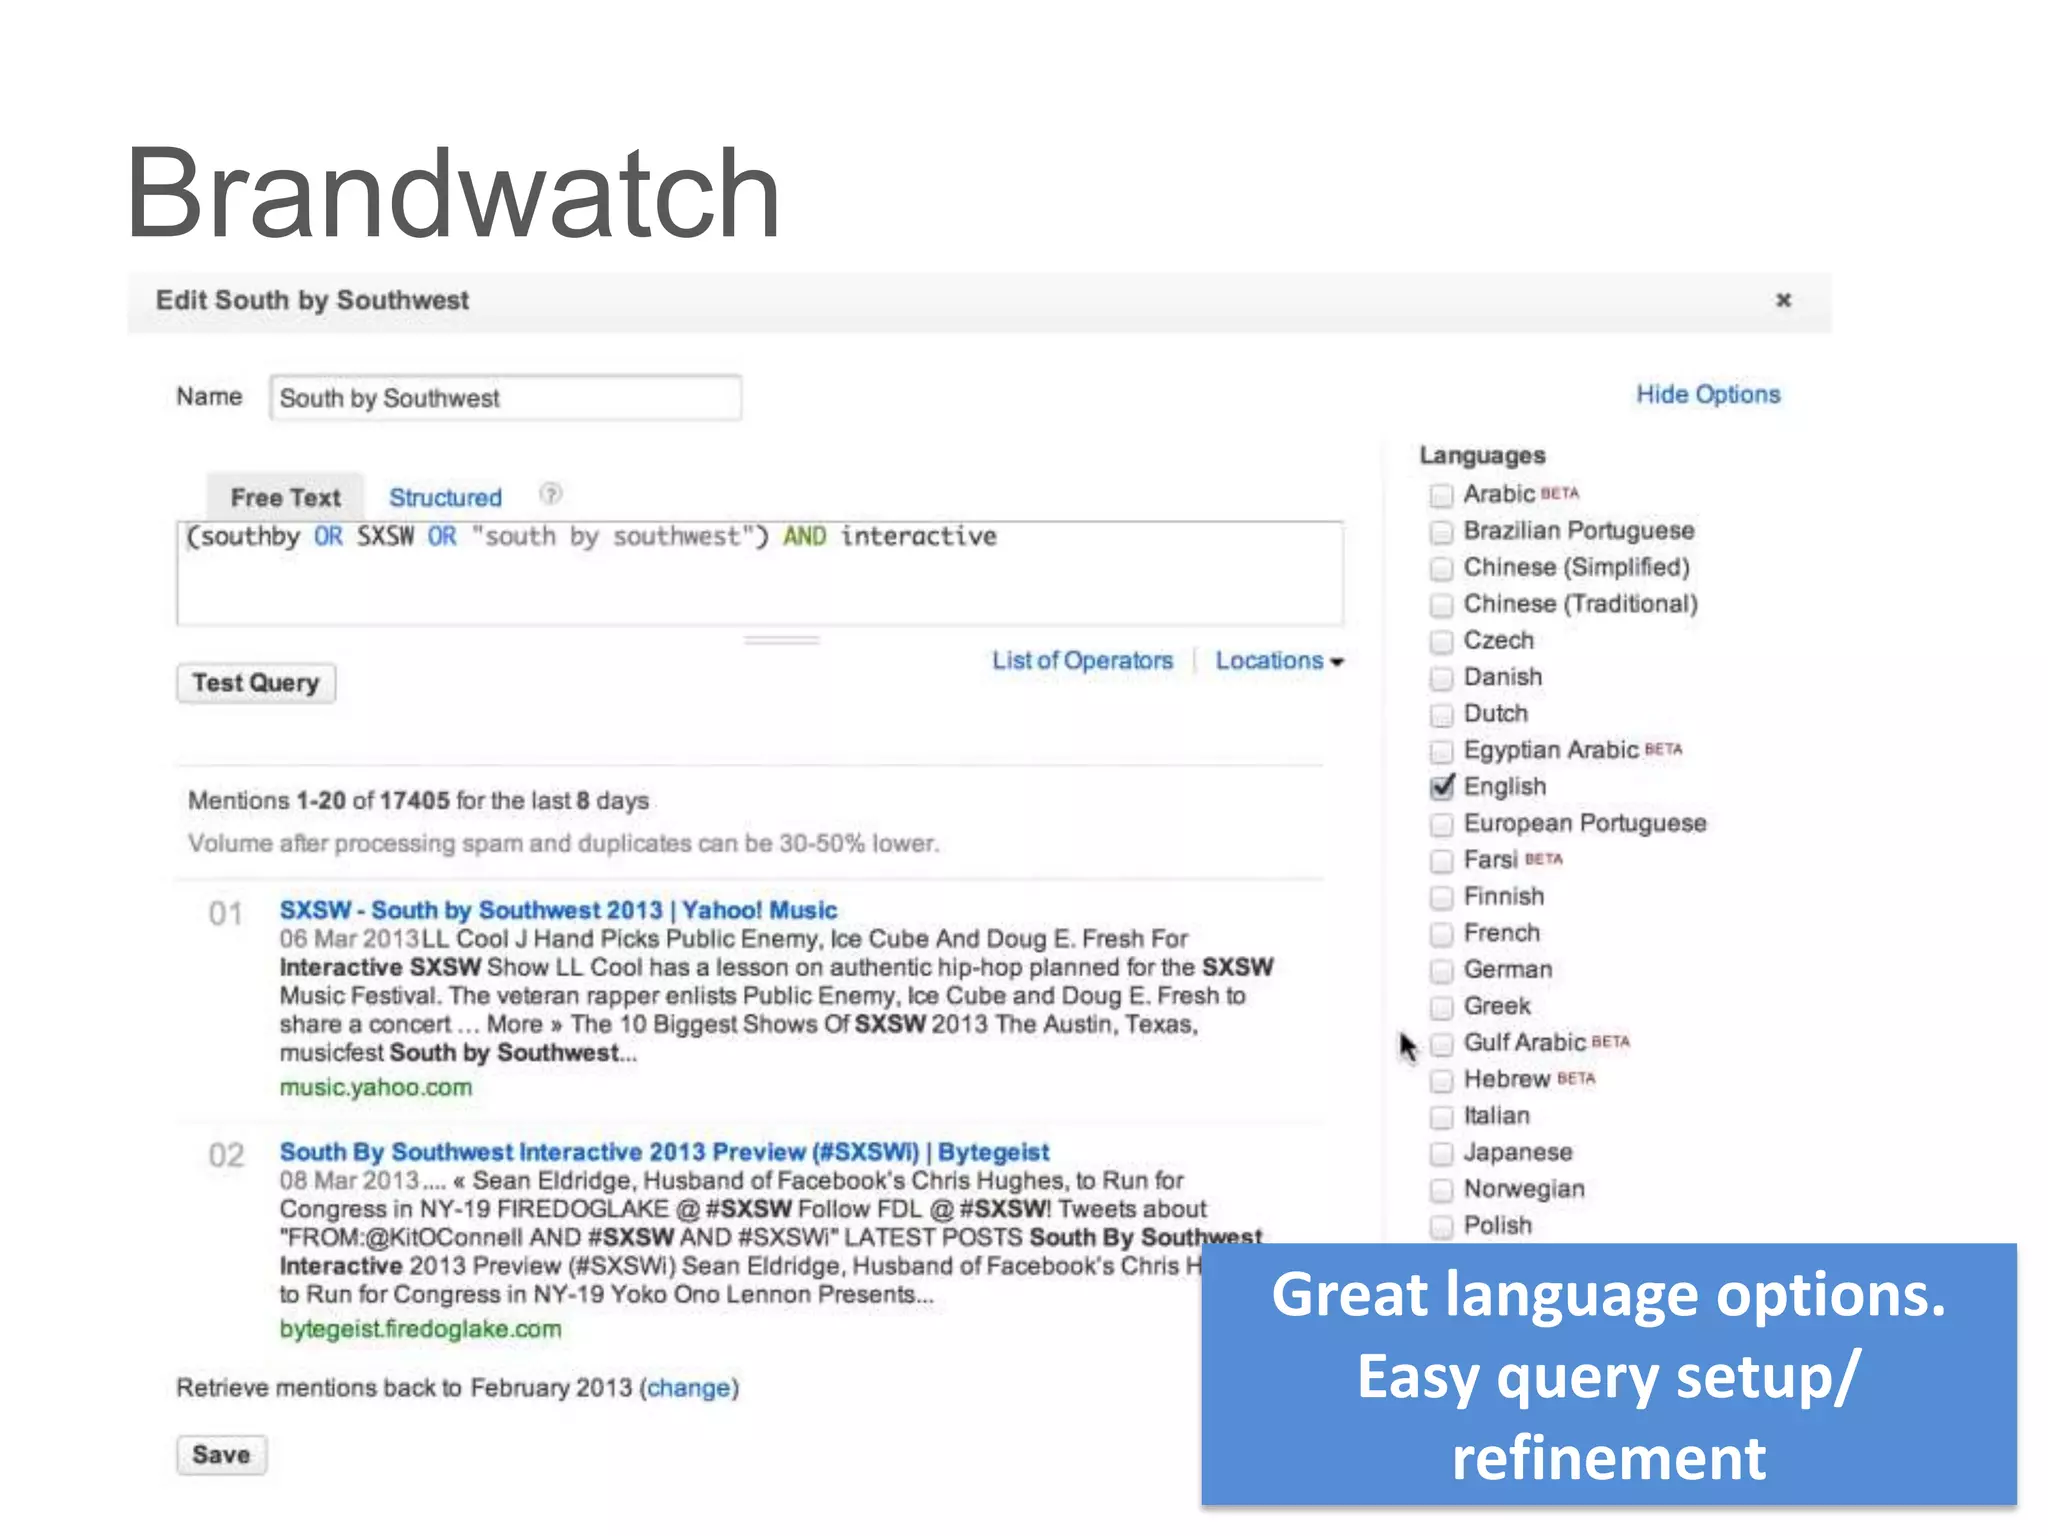
Brandwatch


             Great language options.
                Easy query setup/
                   refinement
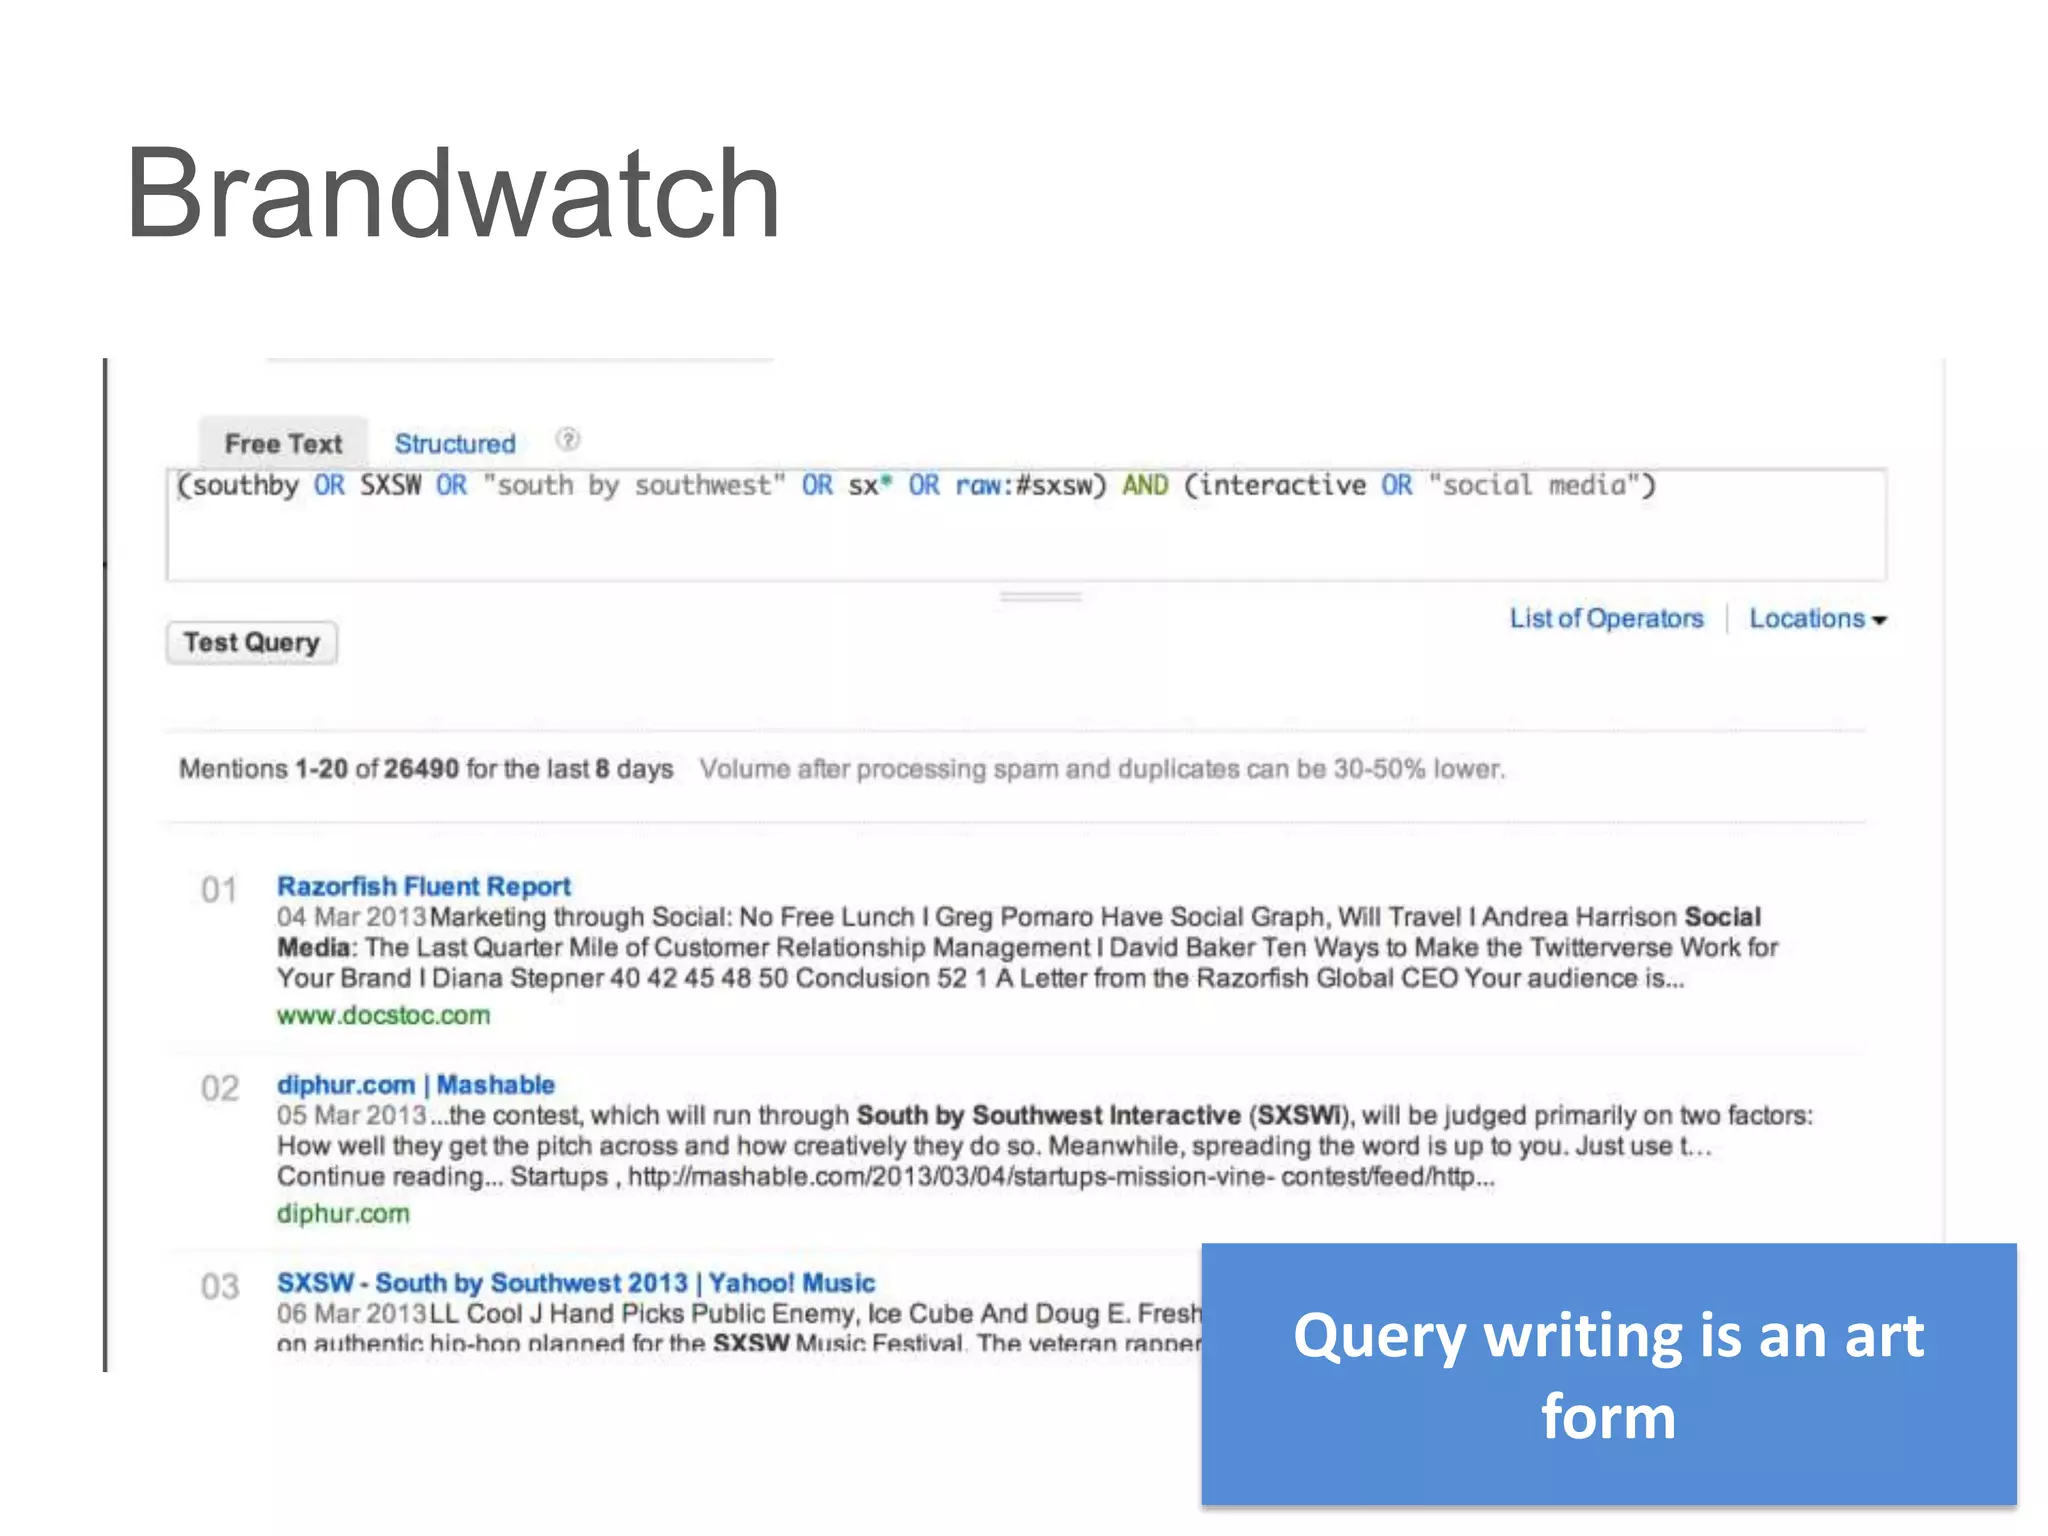
Brandwatch


             Query writing is an art
                    form
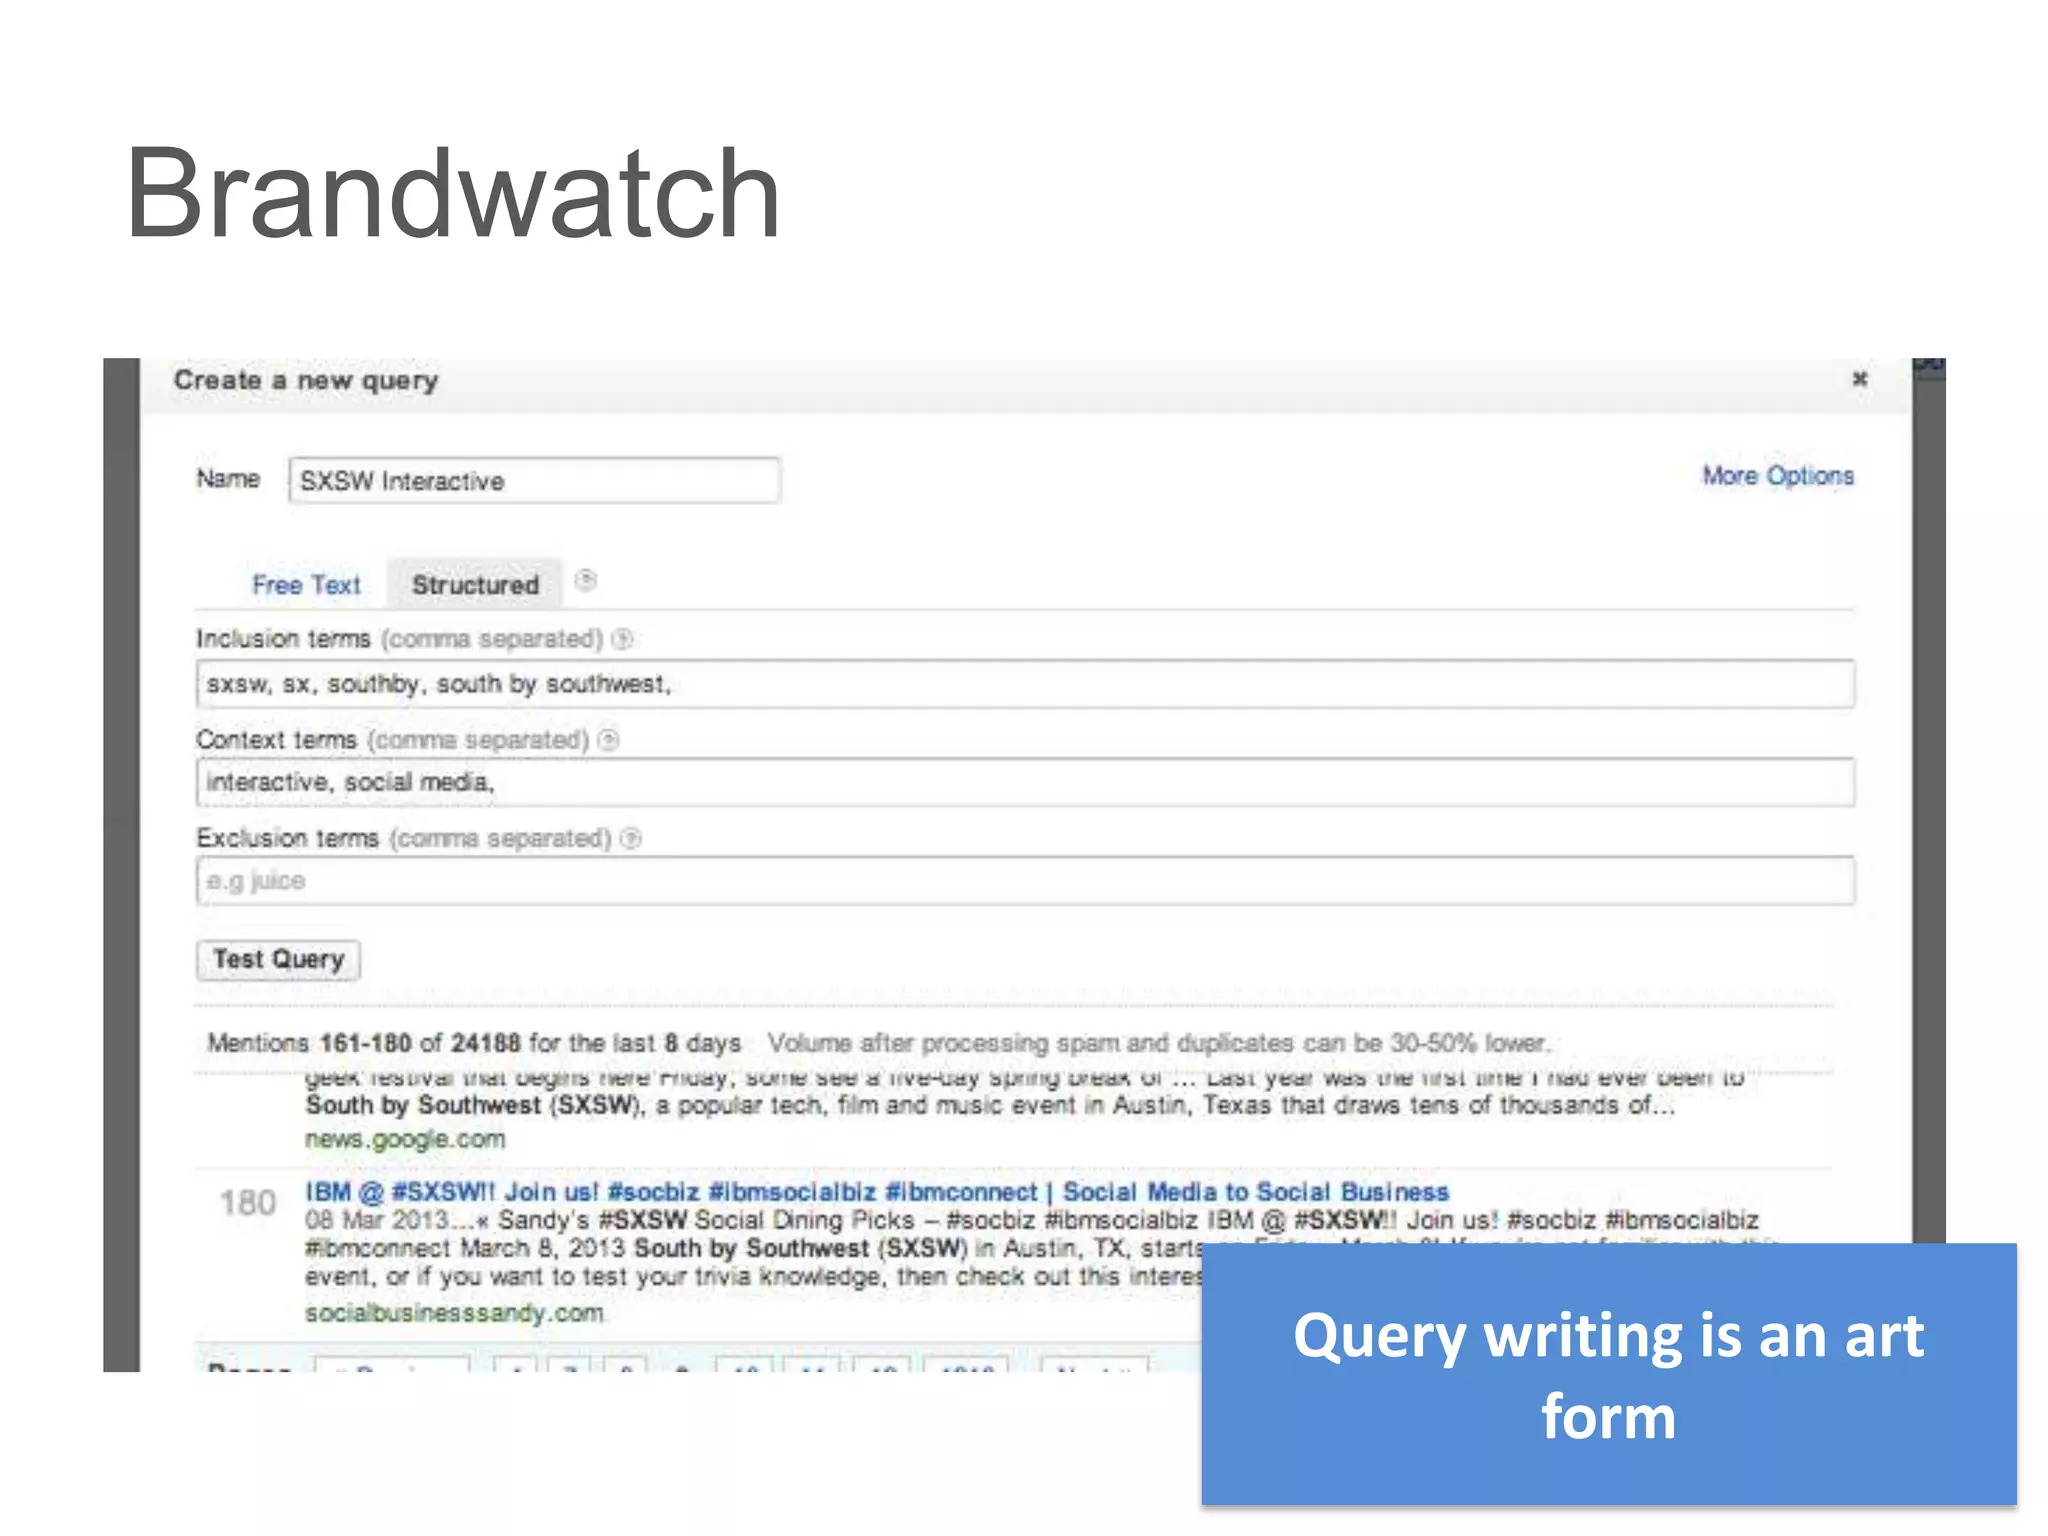
Brandwatch


             Query writing is an art
                    form
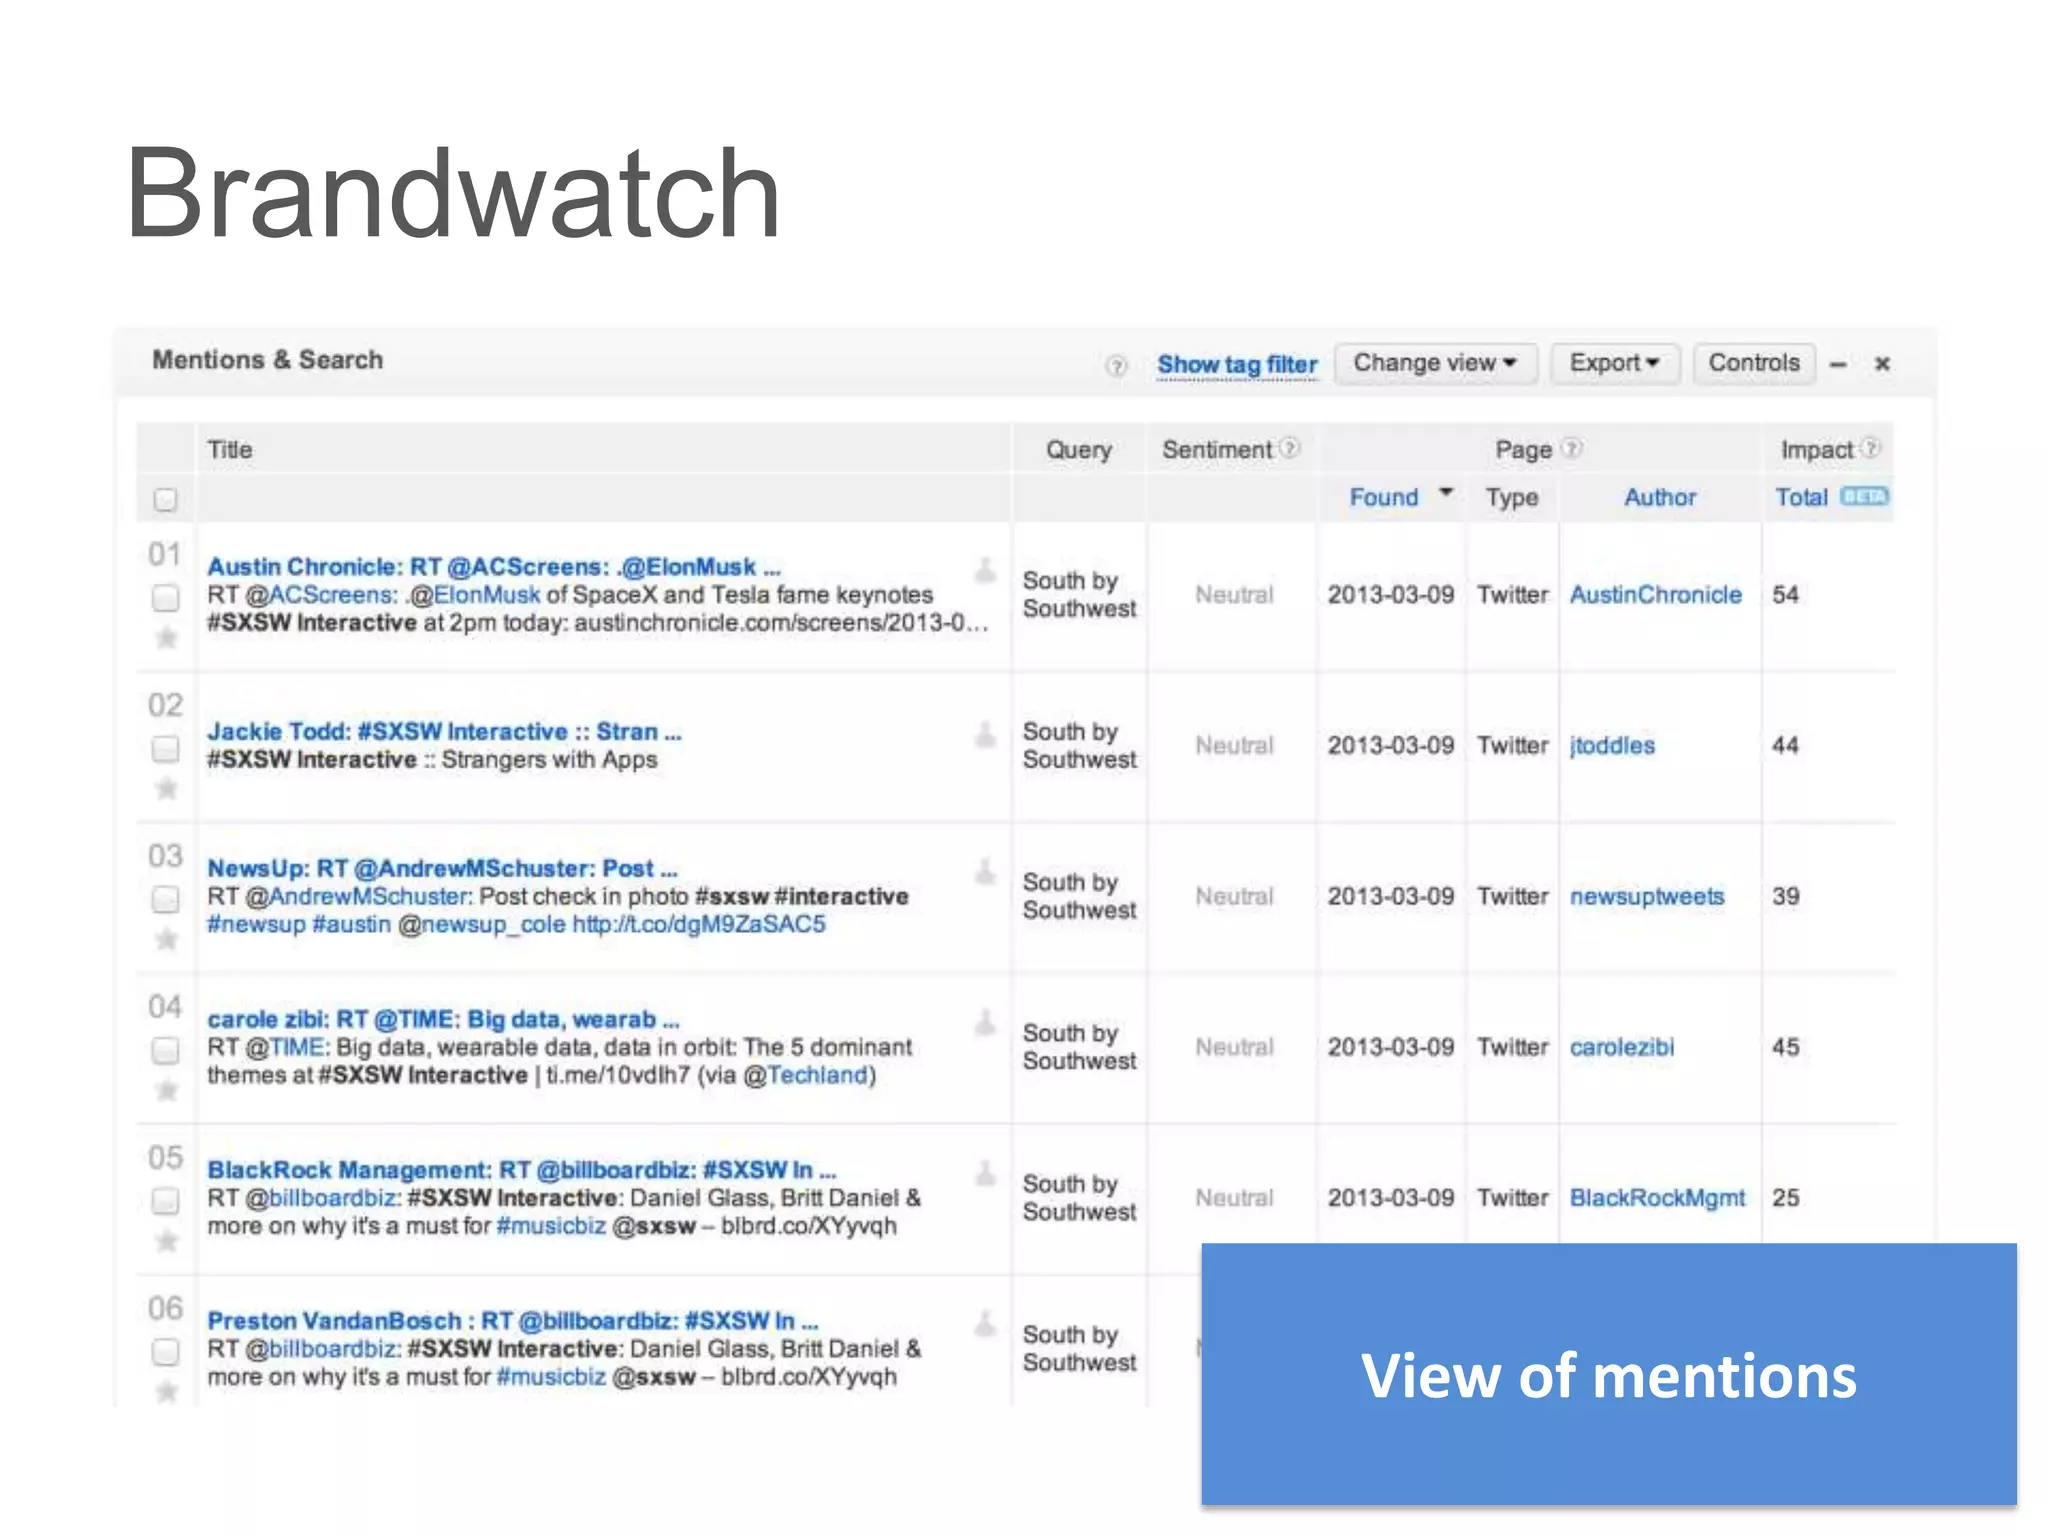
Brandwatch


             View of mentions
Brandwatch


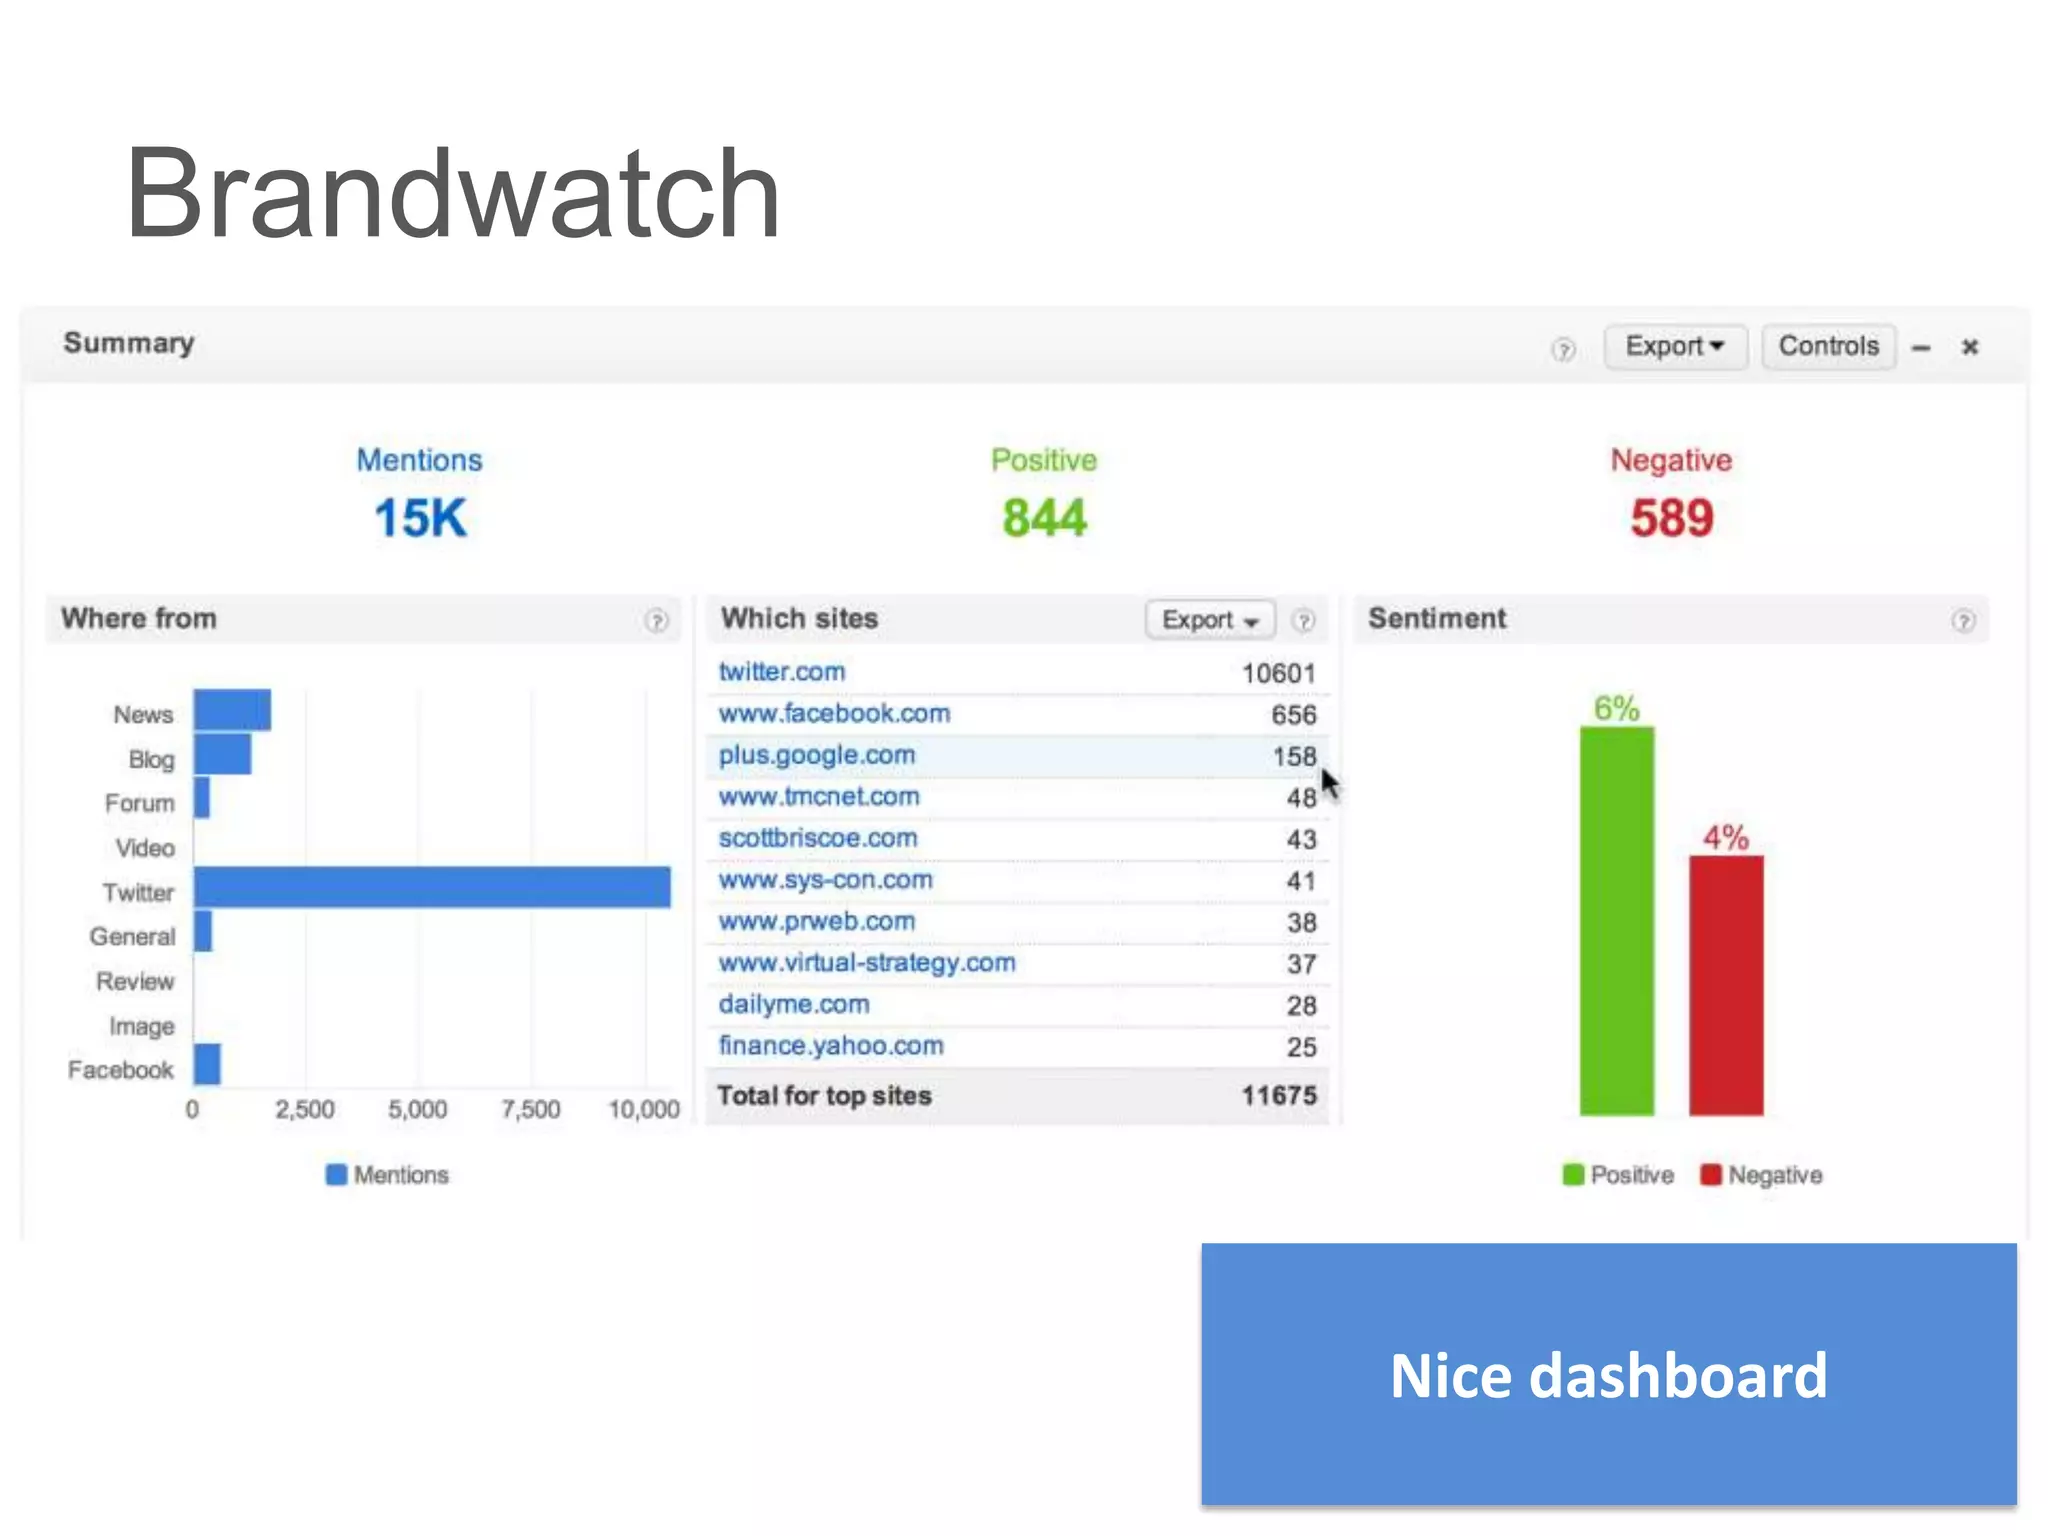
             Nice dashboard
Brandwatch


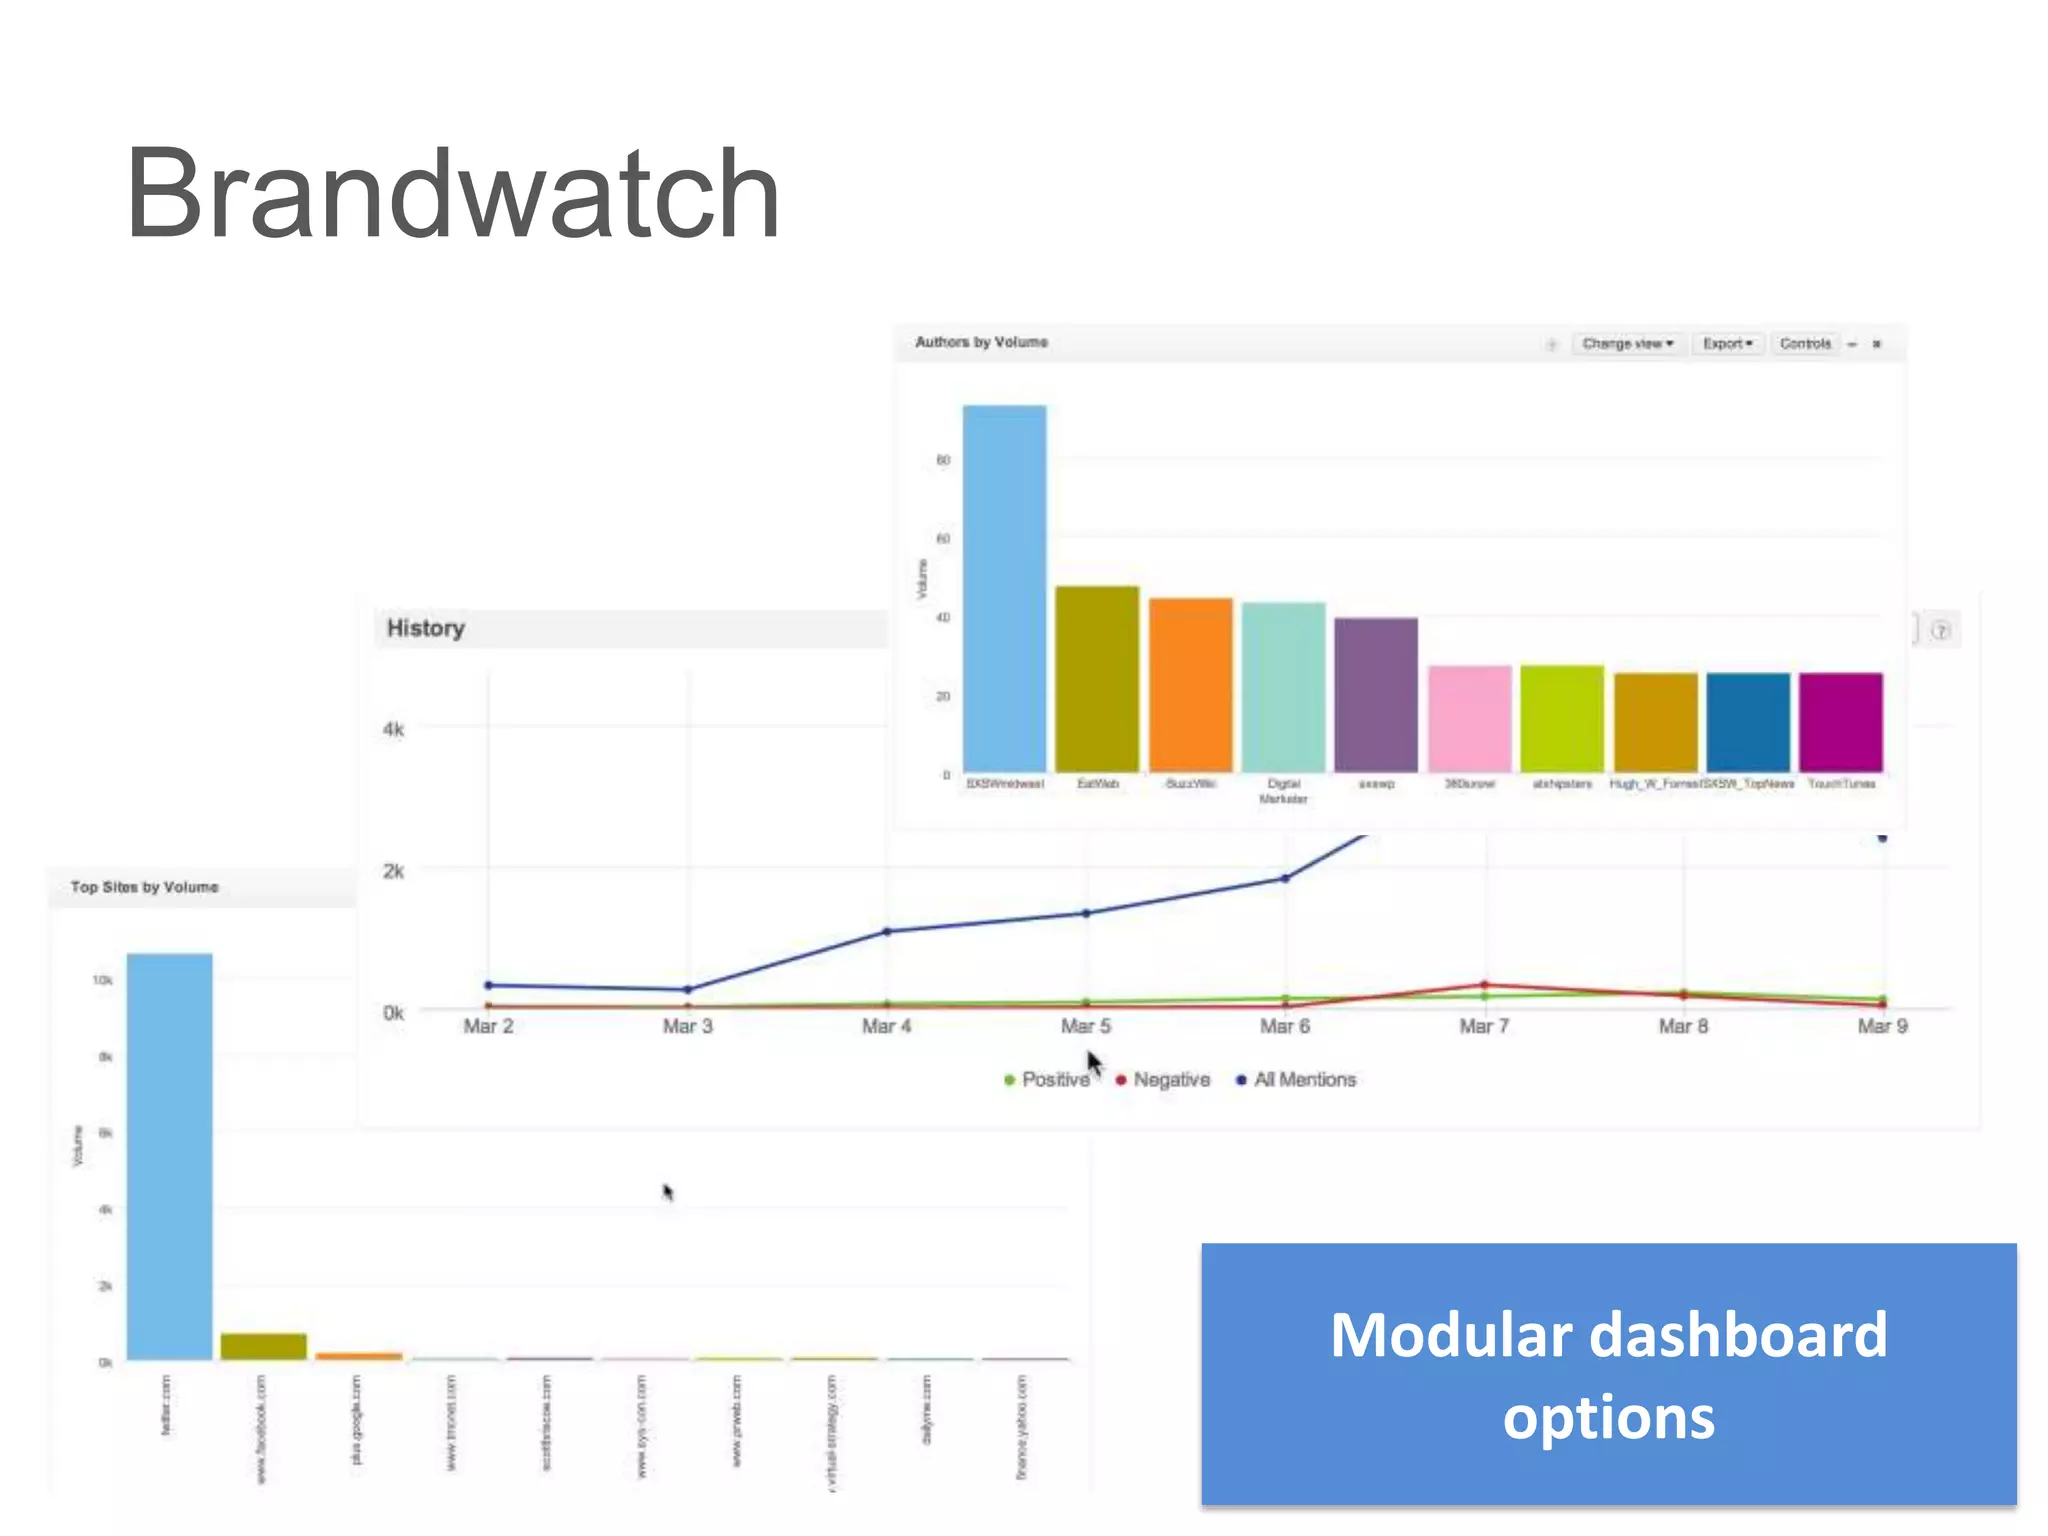
             Modular dashboard
                 options
Brandwatch


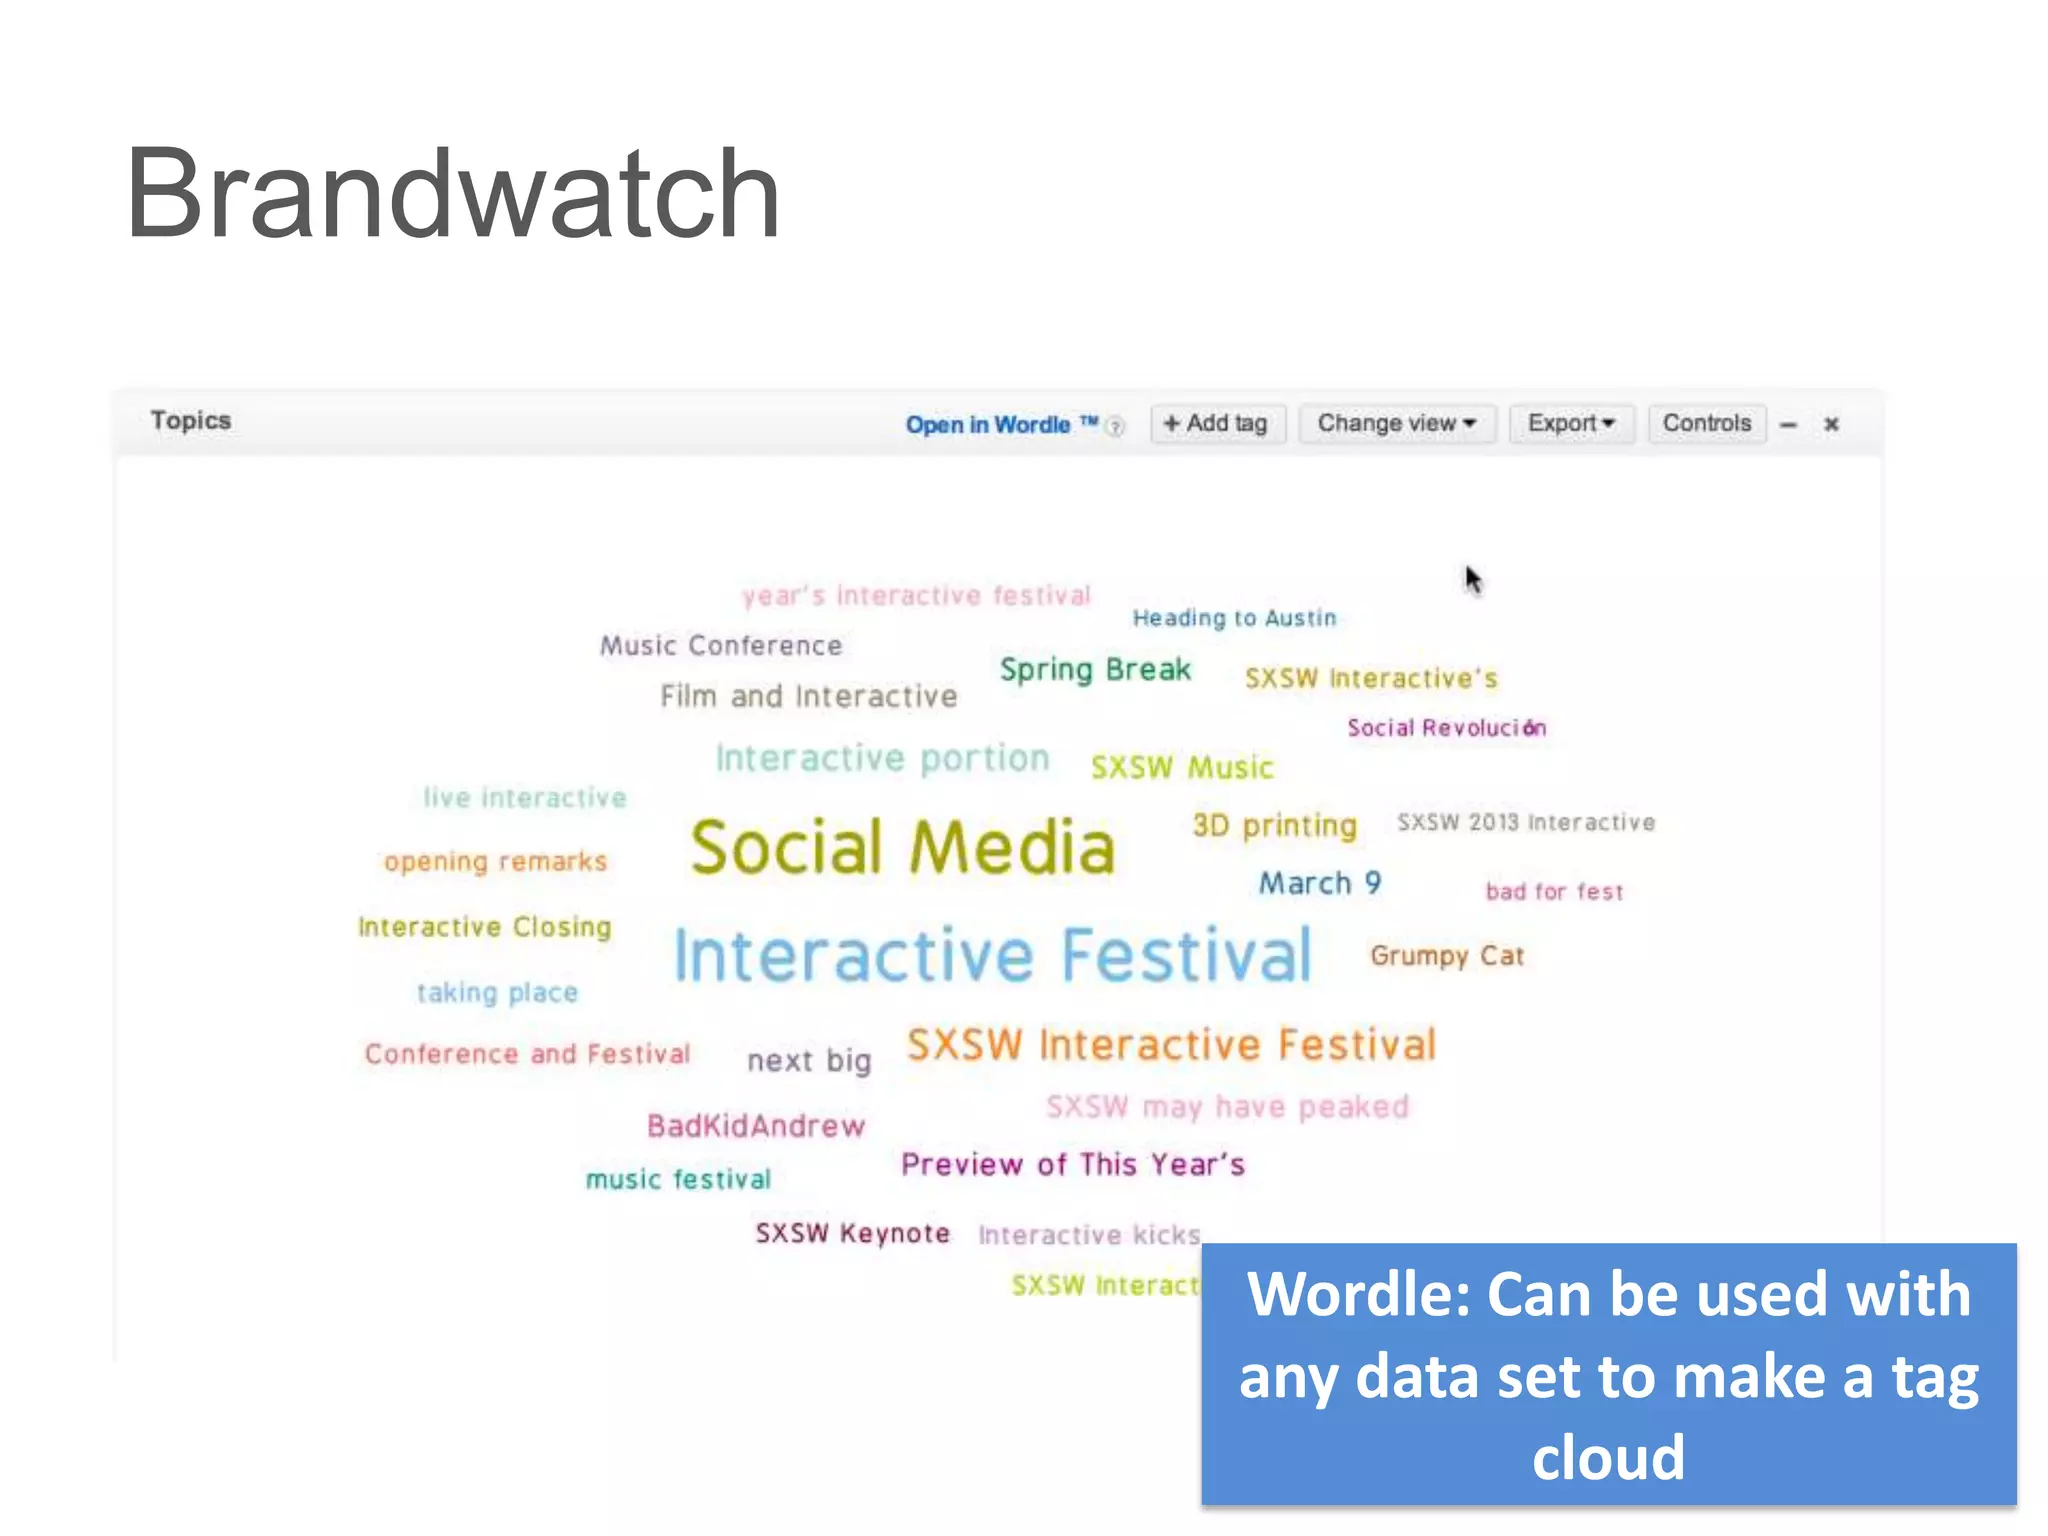
             Wordle: Can be used with
             any data set to make a tag
                       cloud
Brandwatch


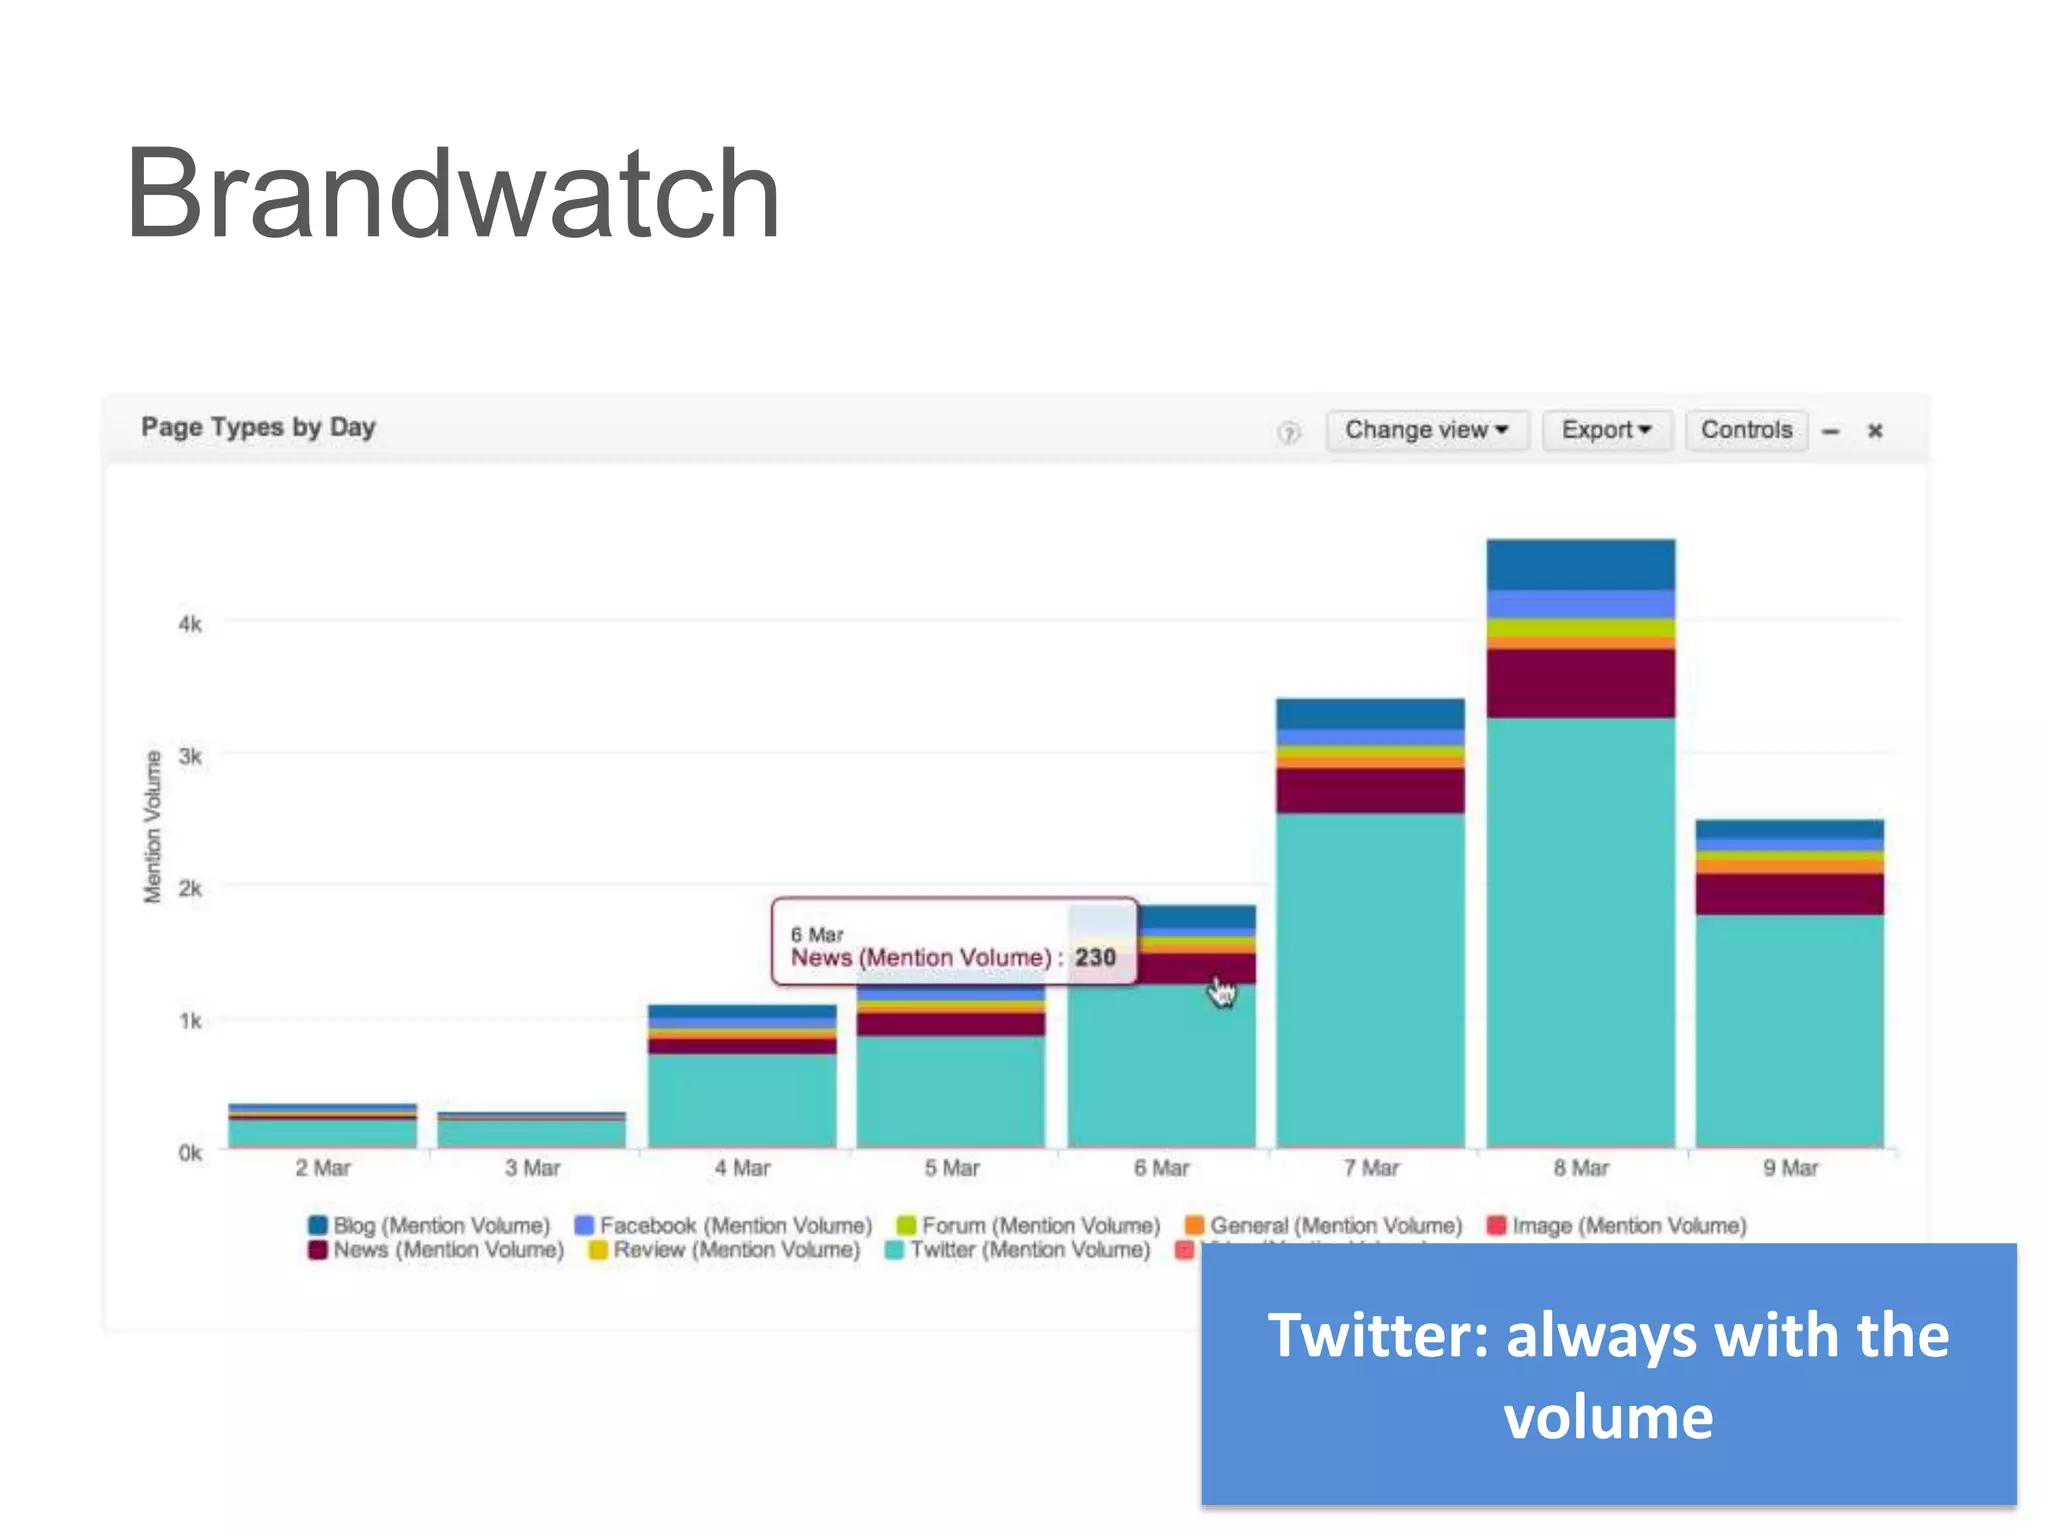
             Twitter: always with the
                      volume
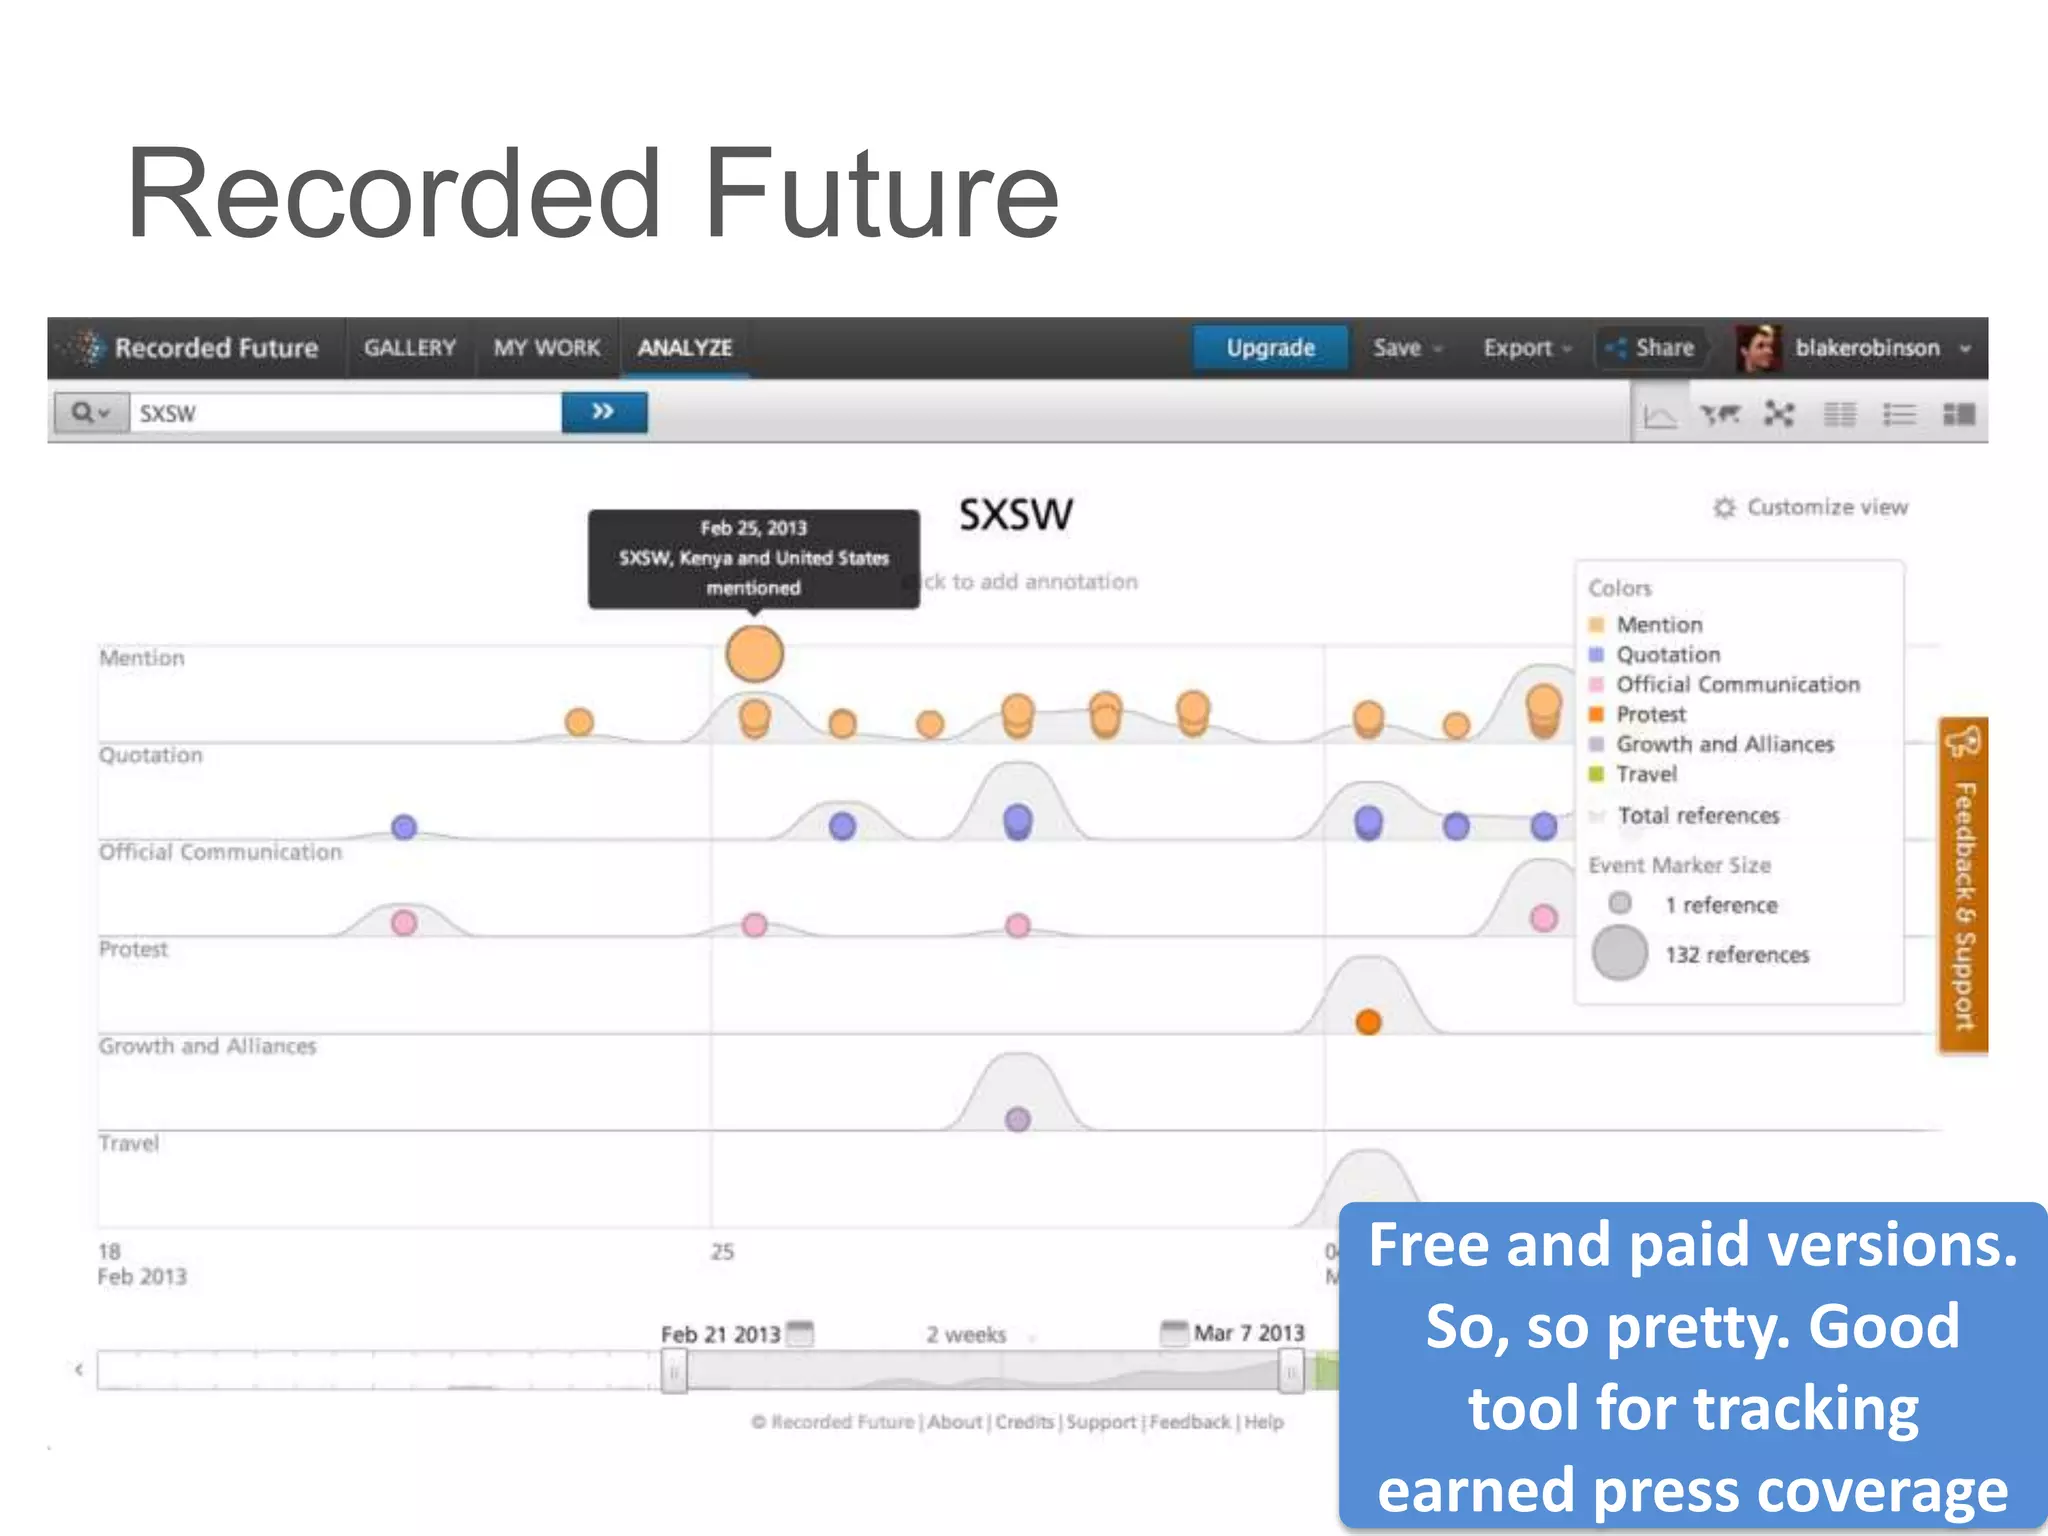
Recorded Future


                  Free and paid versions.
                    So, so pretty. Good
                     tool for tracking
                  earned press coverage
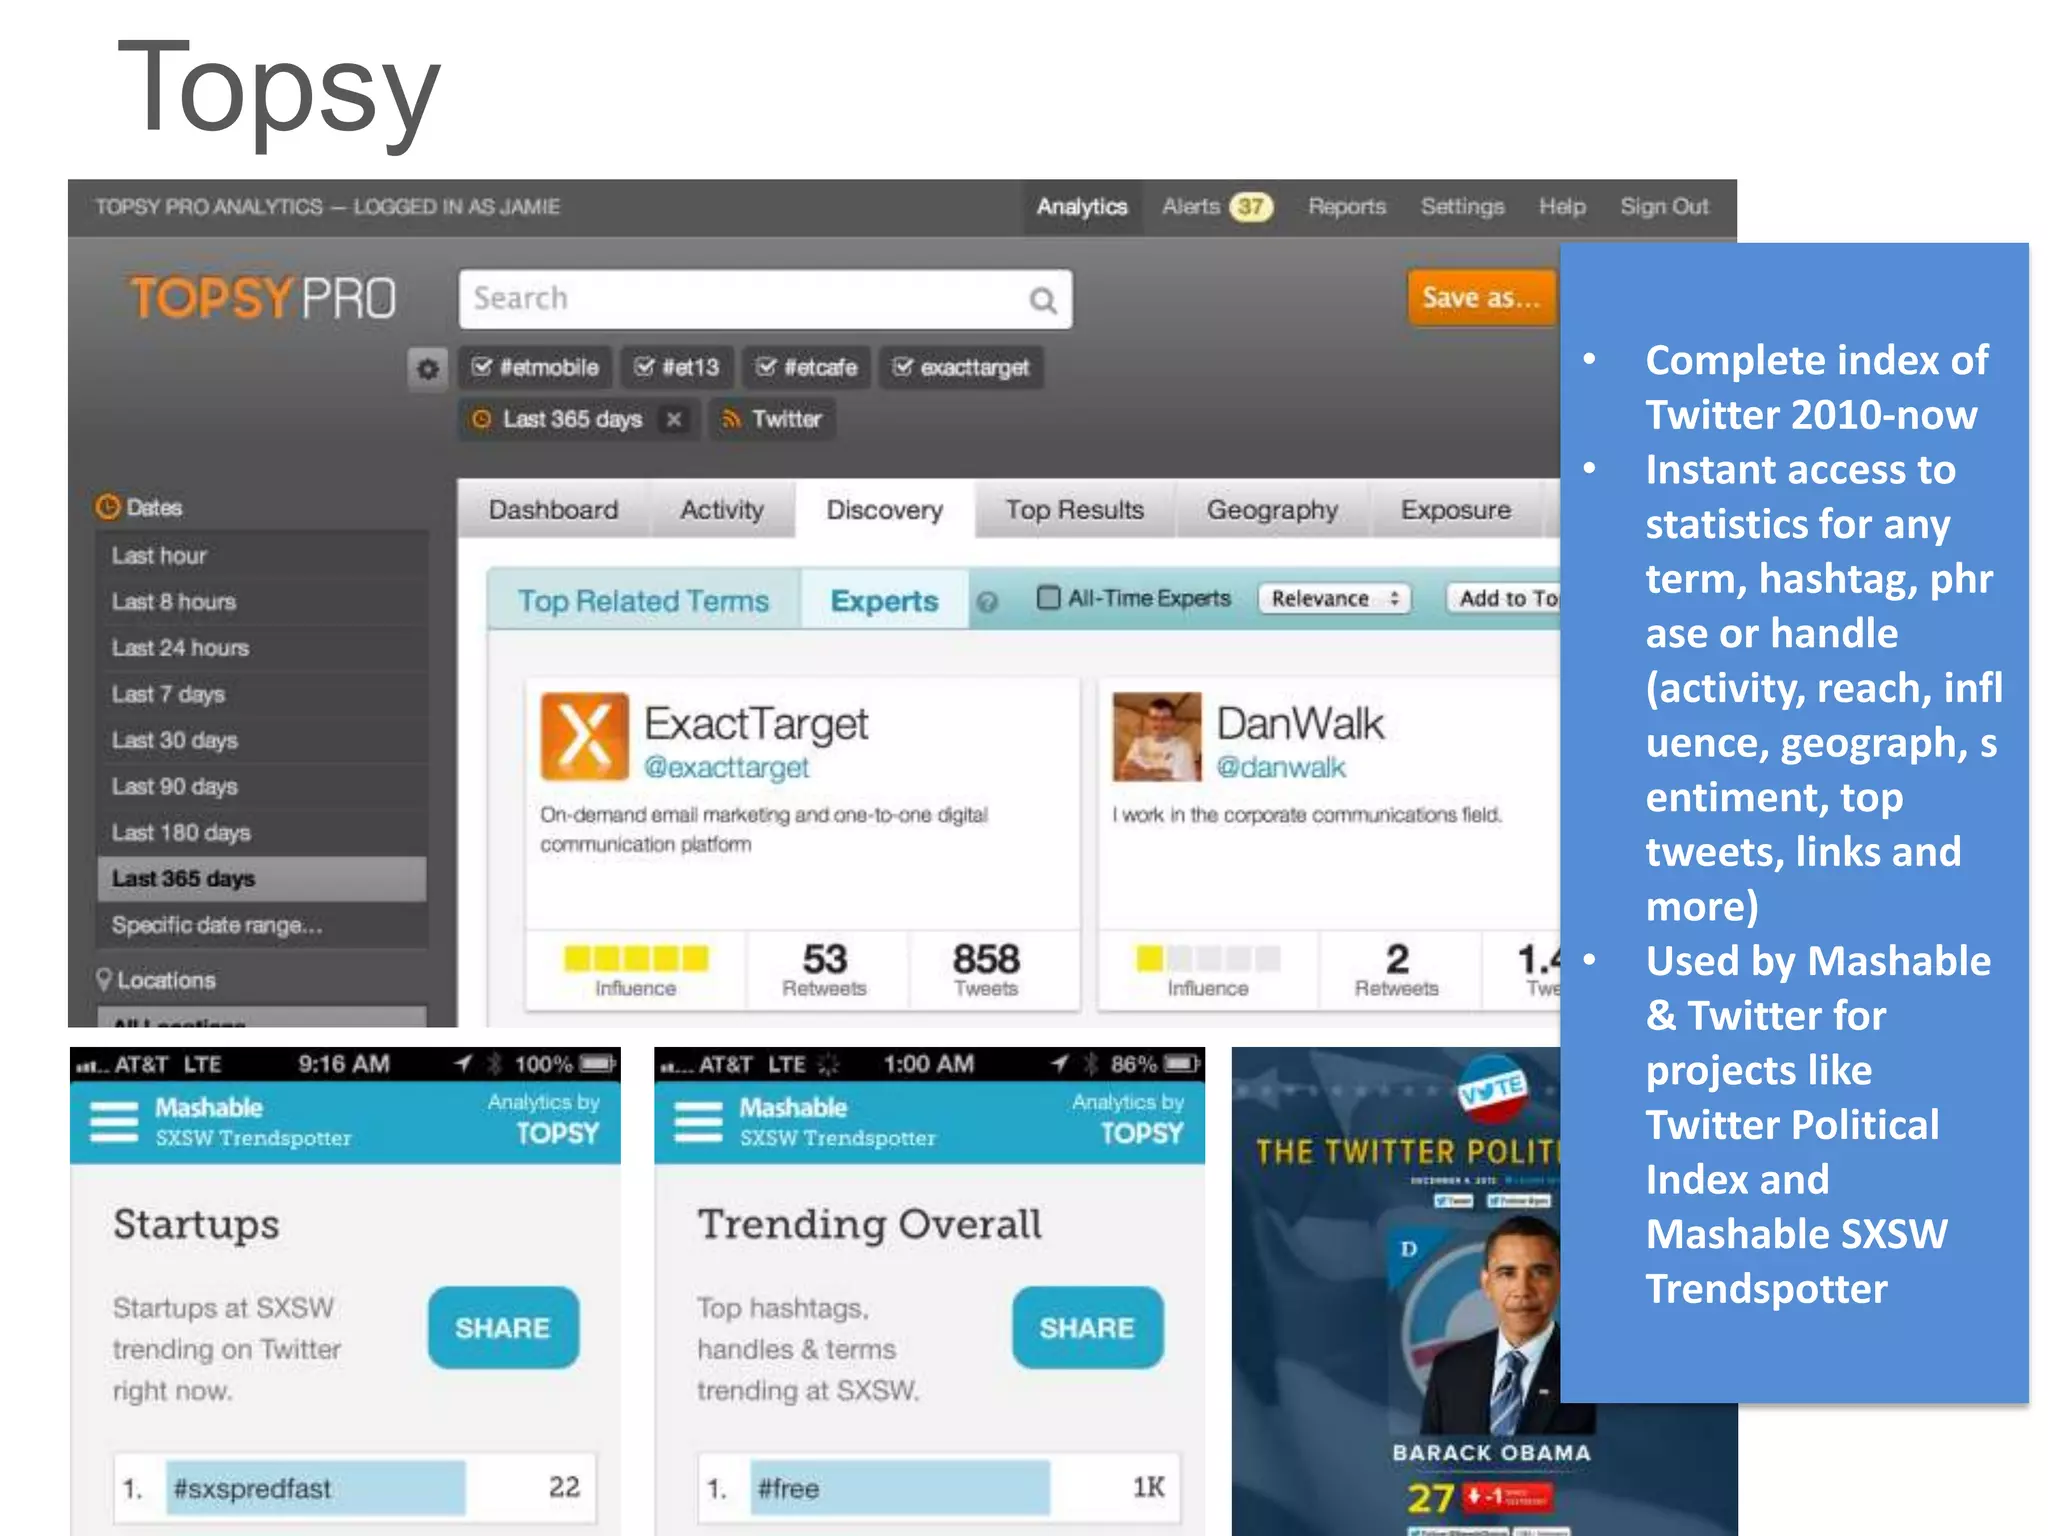
Topsy
        •   Complete index of
            Twitter 2010-now
        •   Instant access to
            statistics for any
            term, hashtag, phr
            ase or handle
            (activity, reach, infl
            uence, geograph, s
            entiment, top
            tweets, links and
            more)
        •   Used by Mashable
            & Twitter for
            projects like
            Twitter Political
            Index and
            Mashable SXSW
            Trendspotter
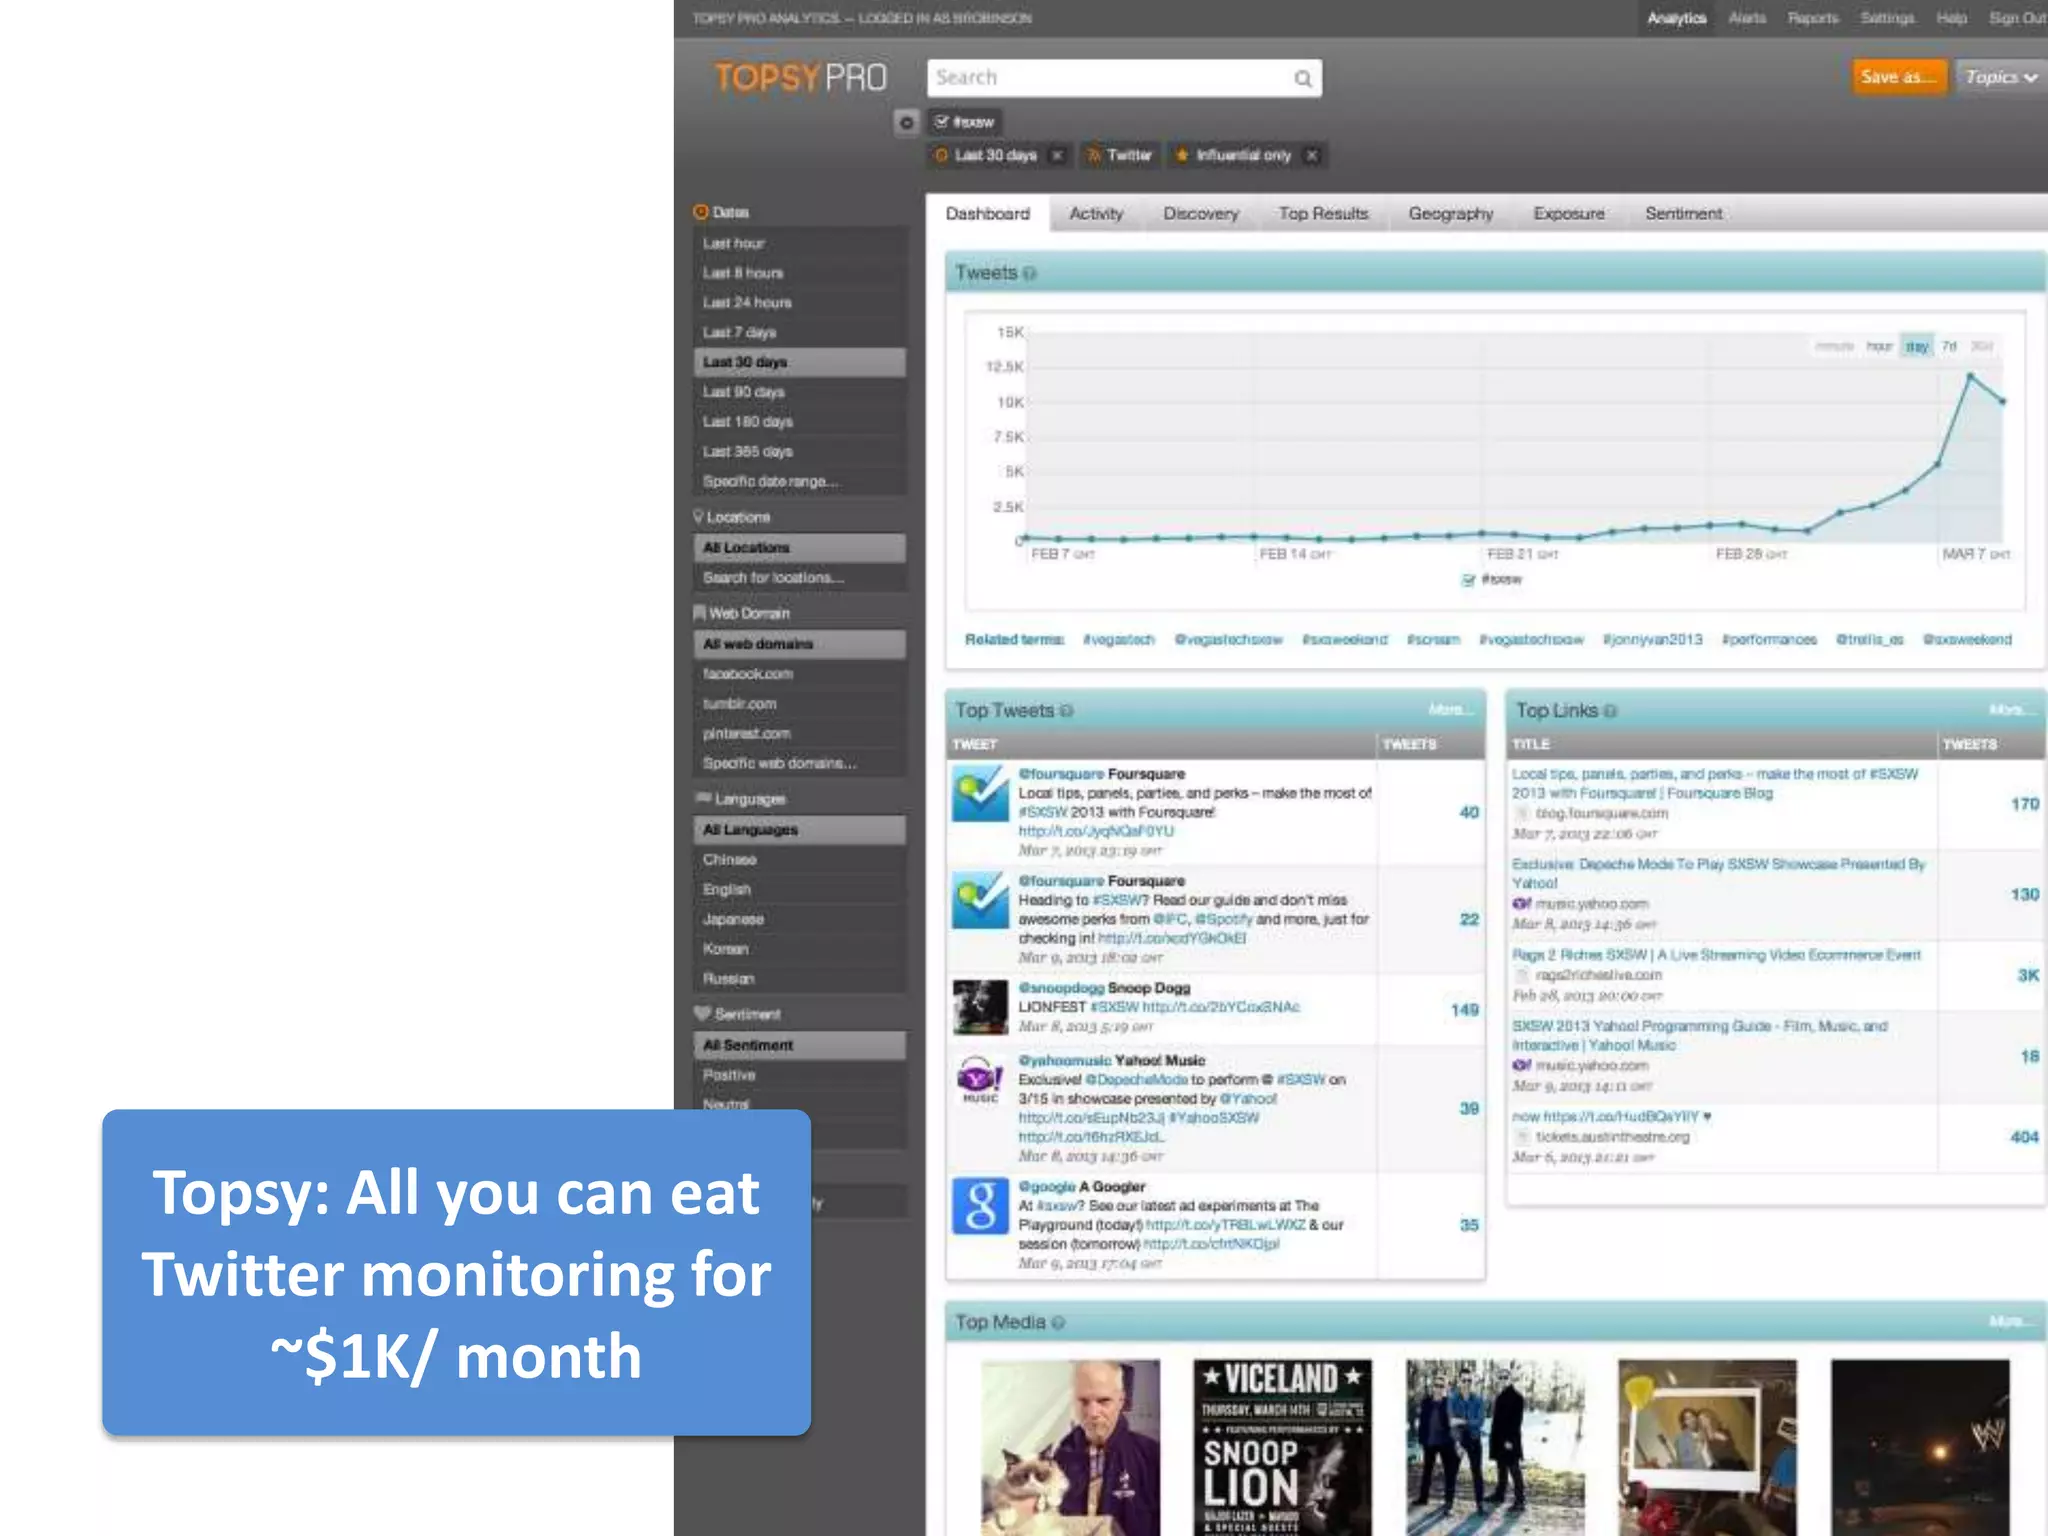
Topsy: All you can eat
Twitter monitoring for
    ~$1K/ month
Social Media Marketing:
Choosing Social Networks
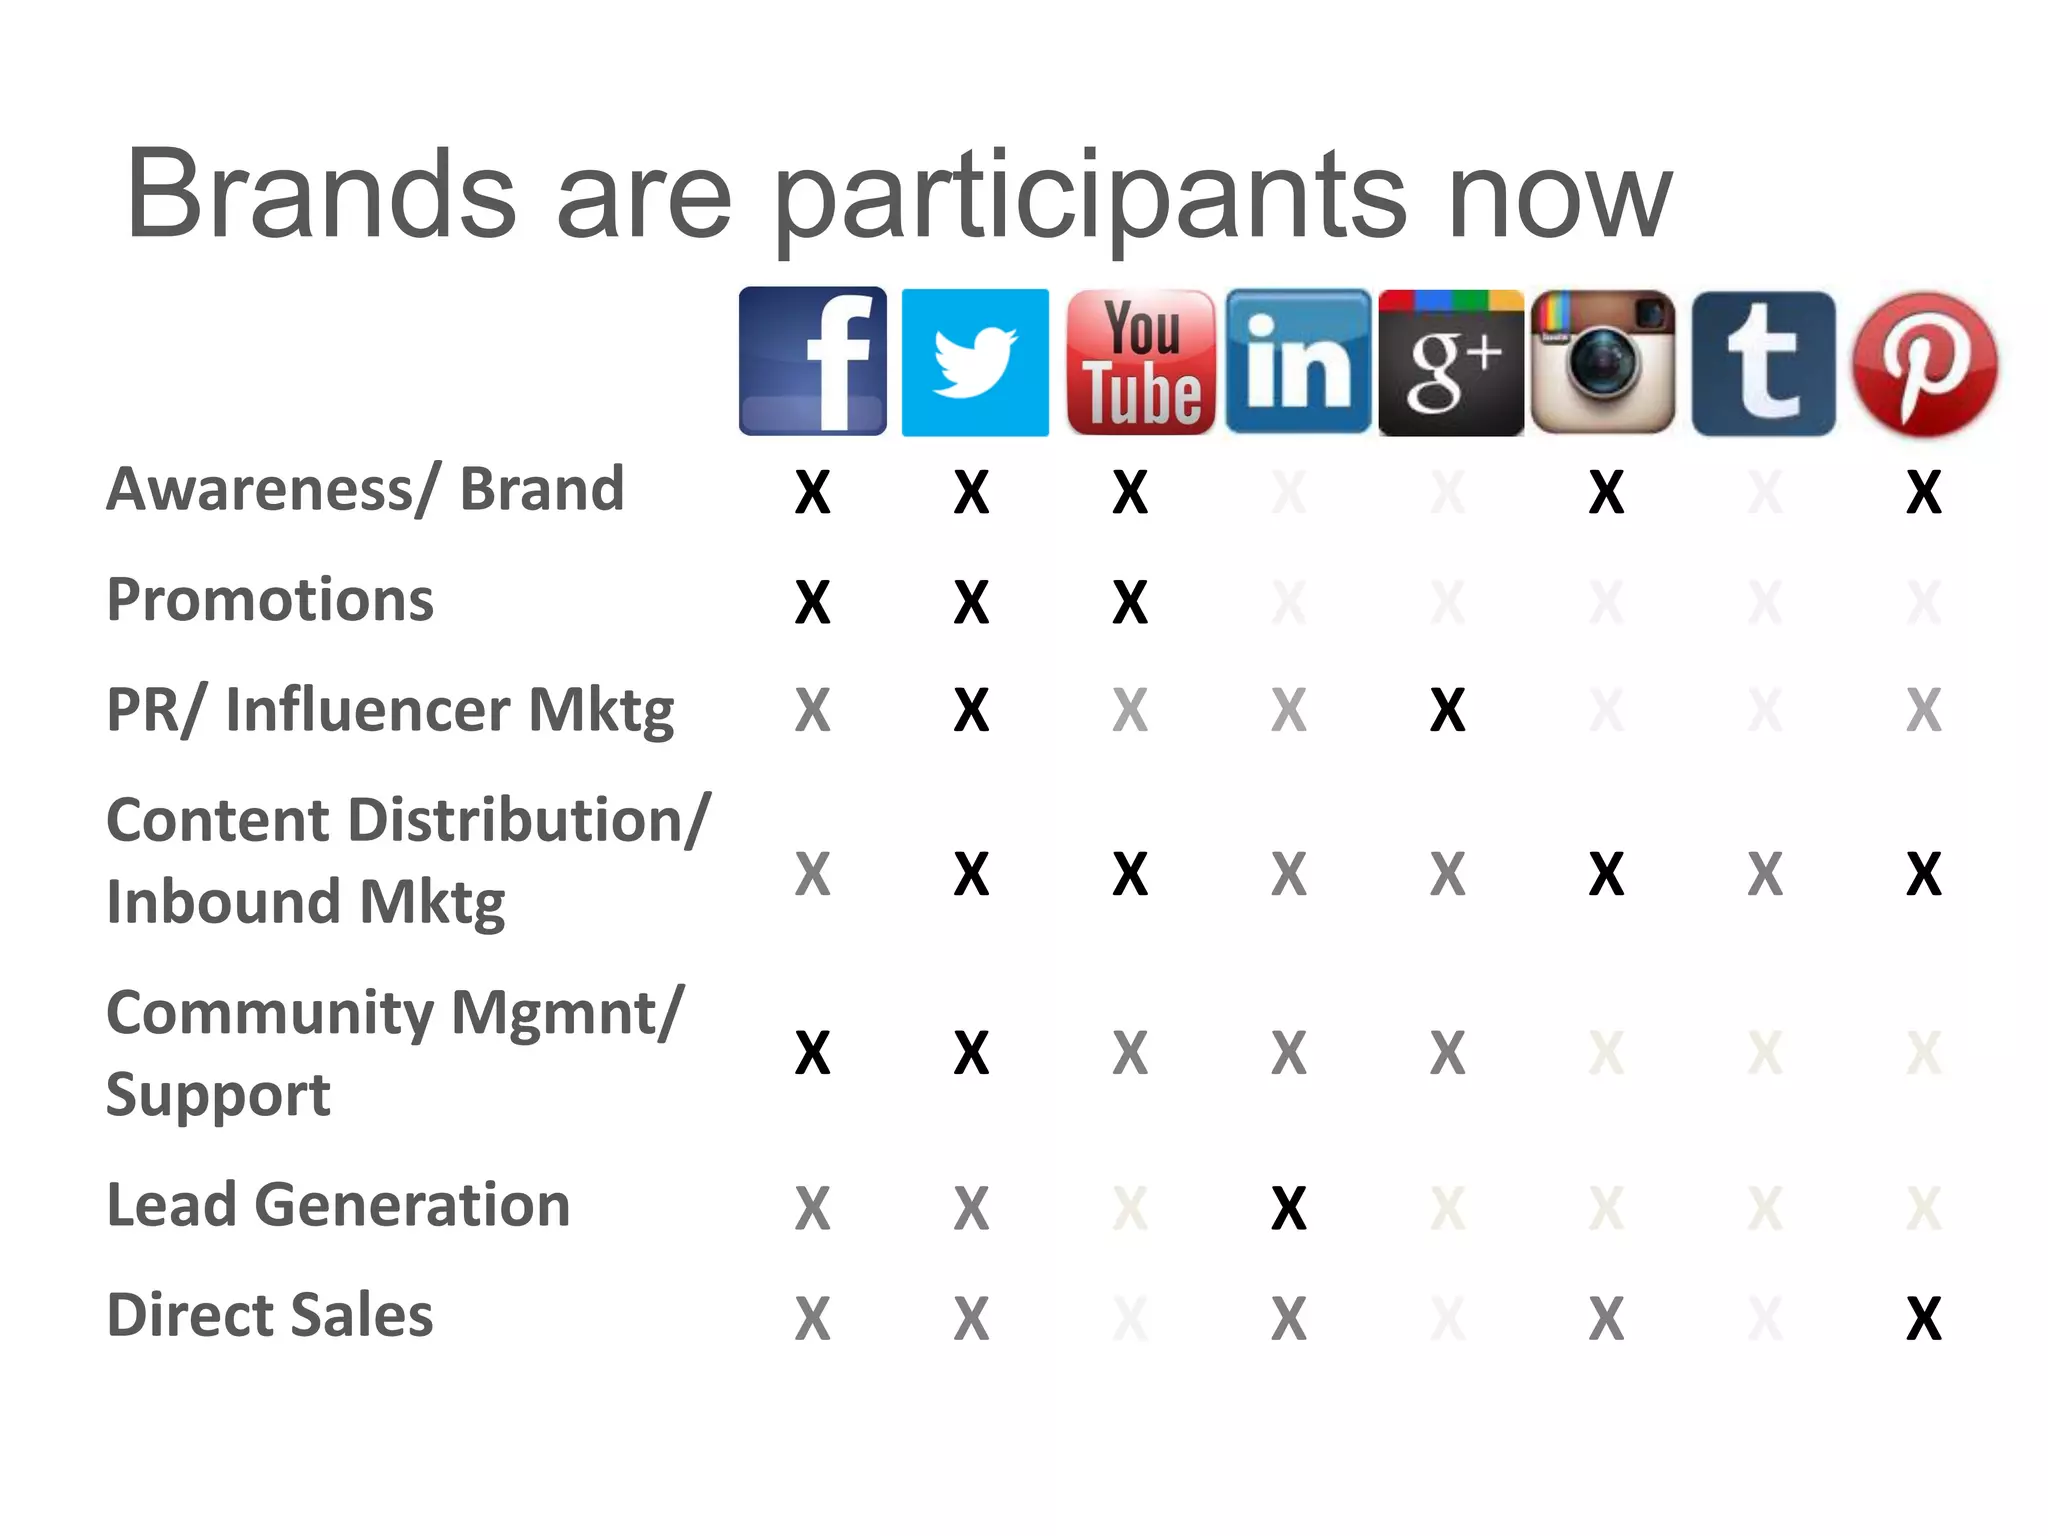
Brands are participants now

Awareness/ Brand        X   X   X   X   X   X   X   X
Promotions              X   X   X   X   X   X   X   X
PR/ Influencer Mktg     X   X   X   X   X   X   X   X
Content Distribution/
Inbound Mktg            X   X   X   X   X   X   X   X

Community Mgmnt/
                        X   X   X   X   X   X   X   X
Support
Lead Generation         X   X   X   X   X   X   X   X
Direct Sales            X   X   X   X   X   X   X   X
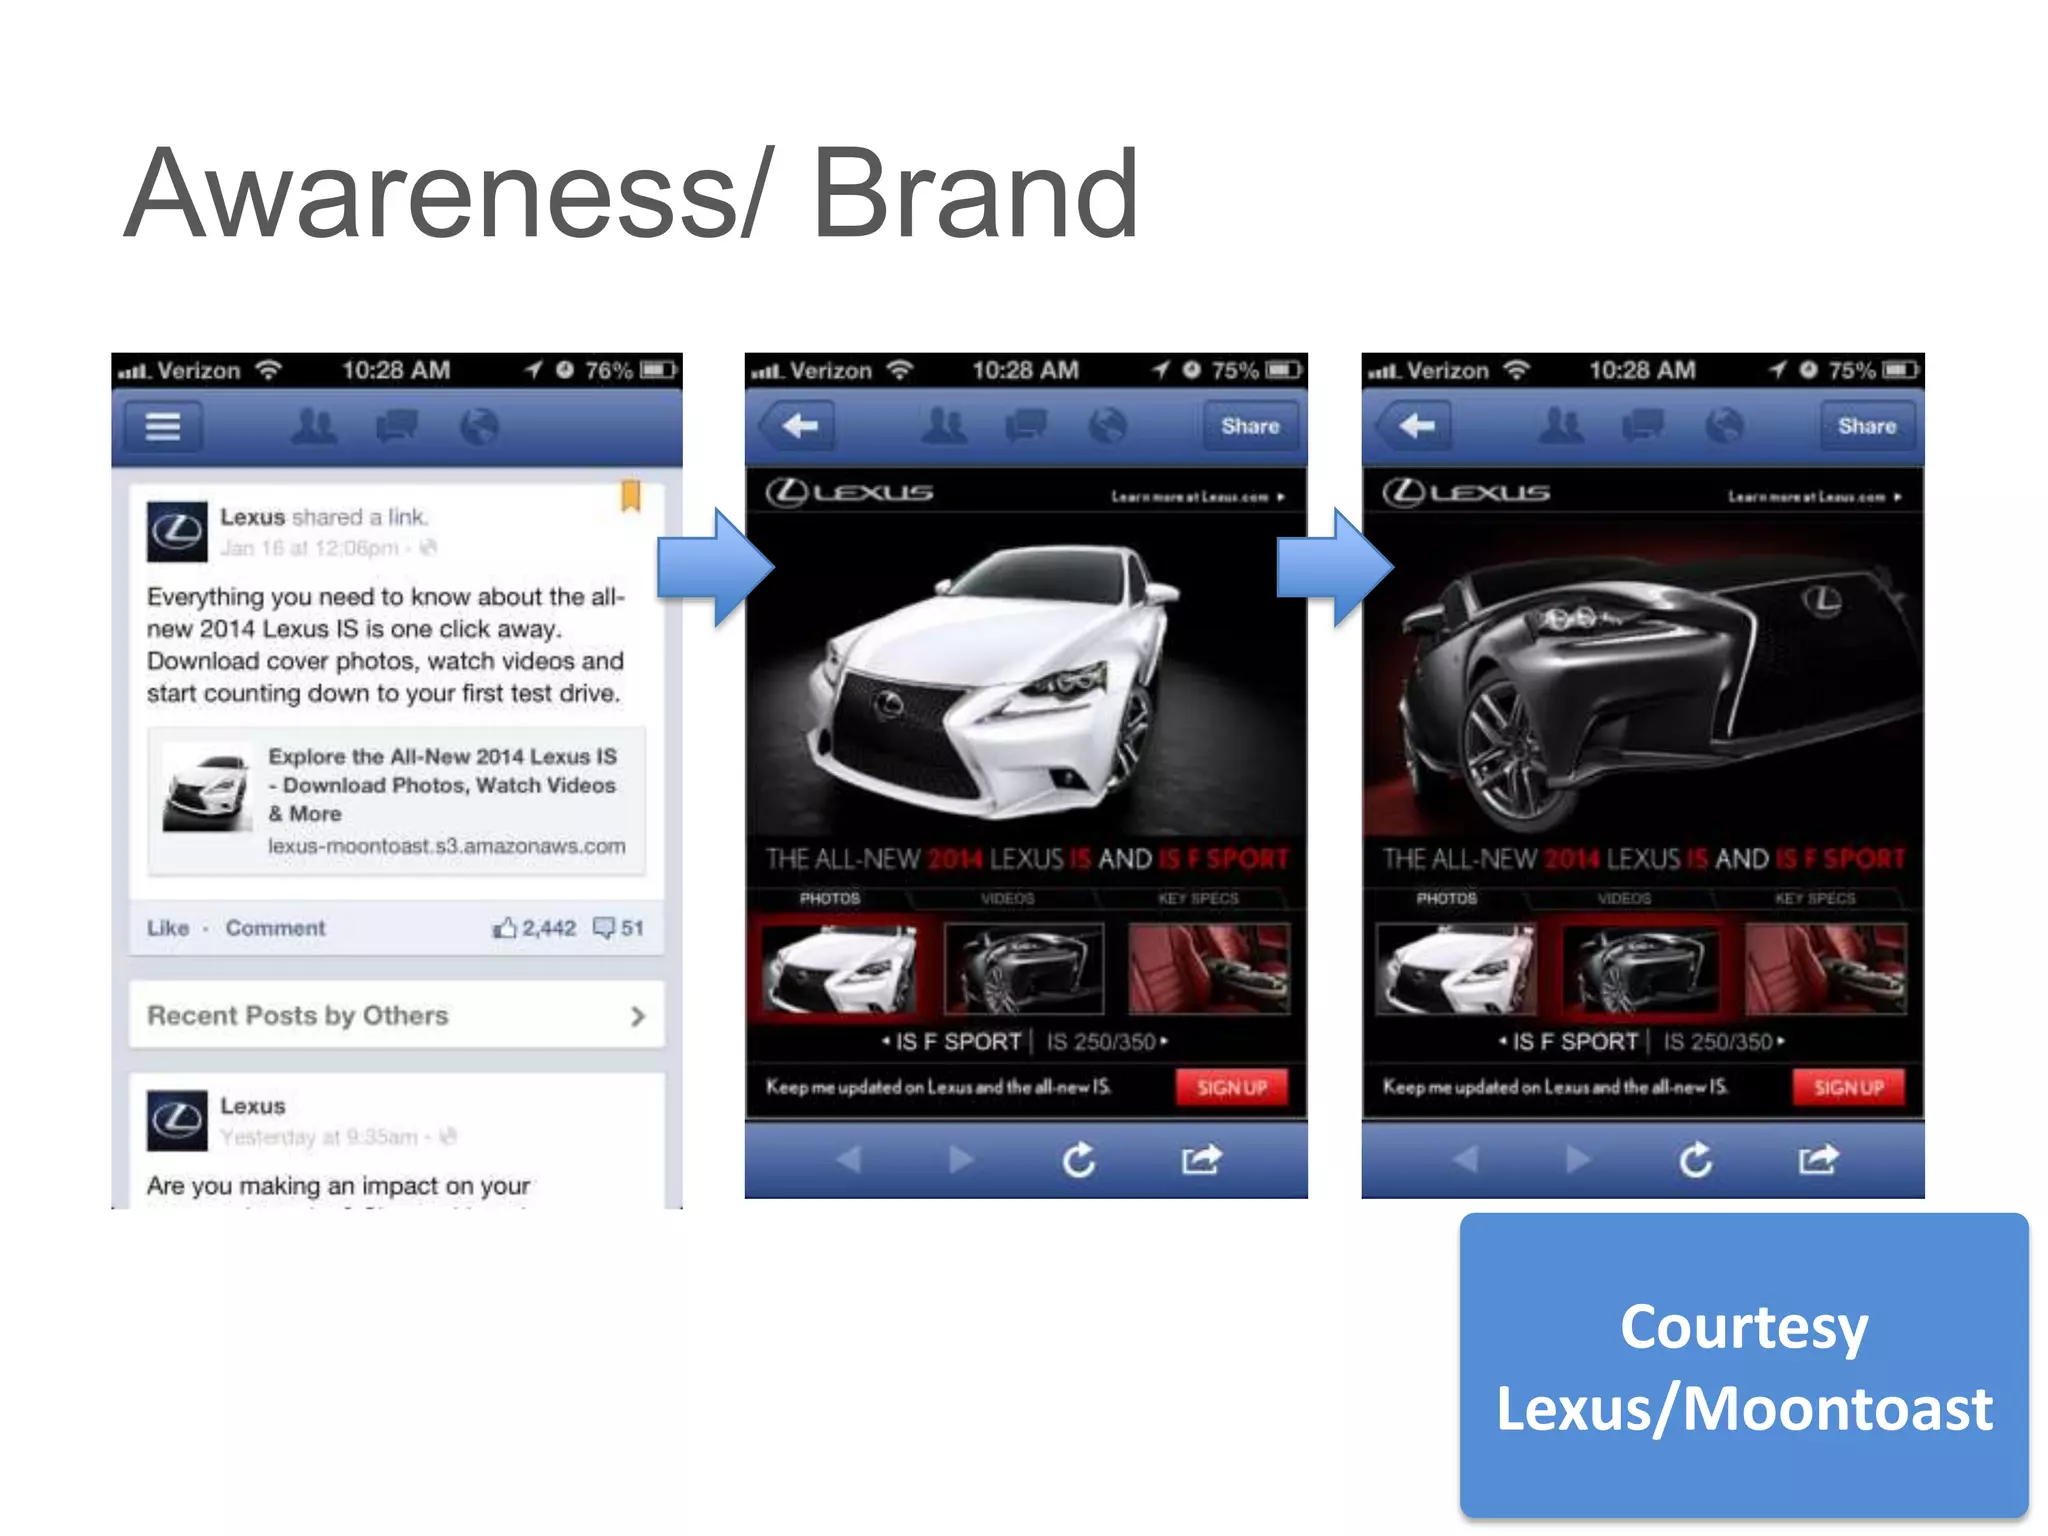
Awareness/ Brand


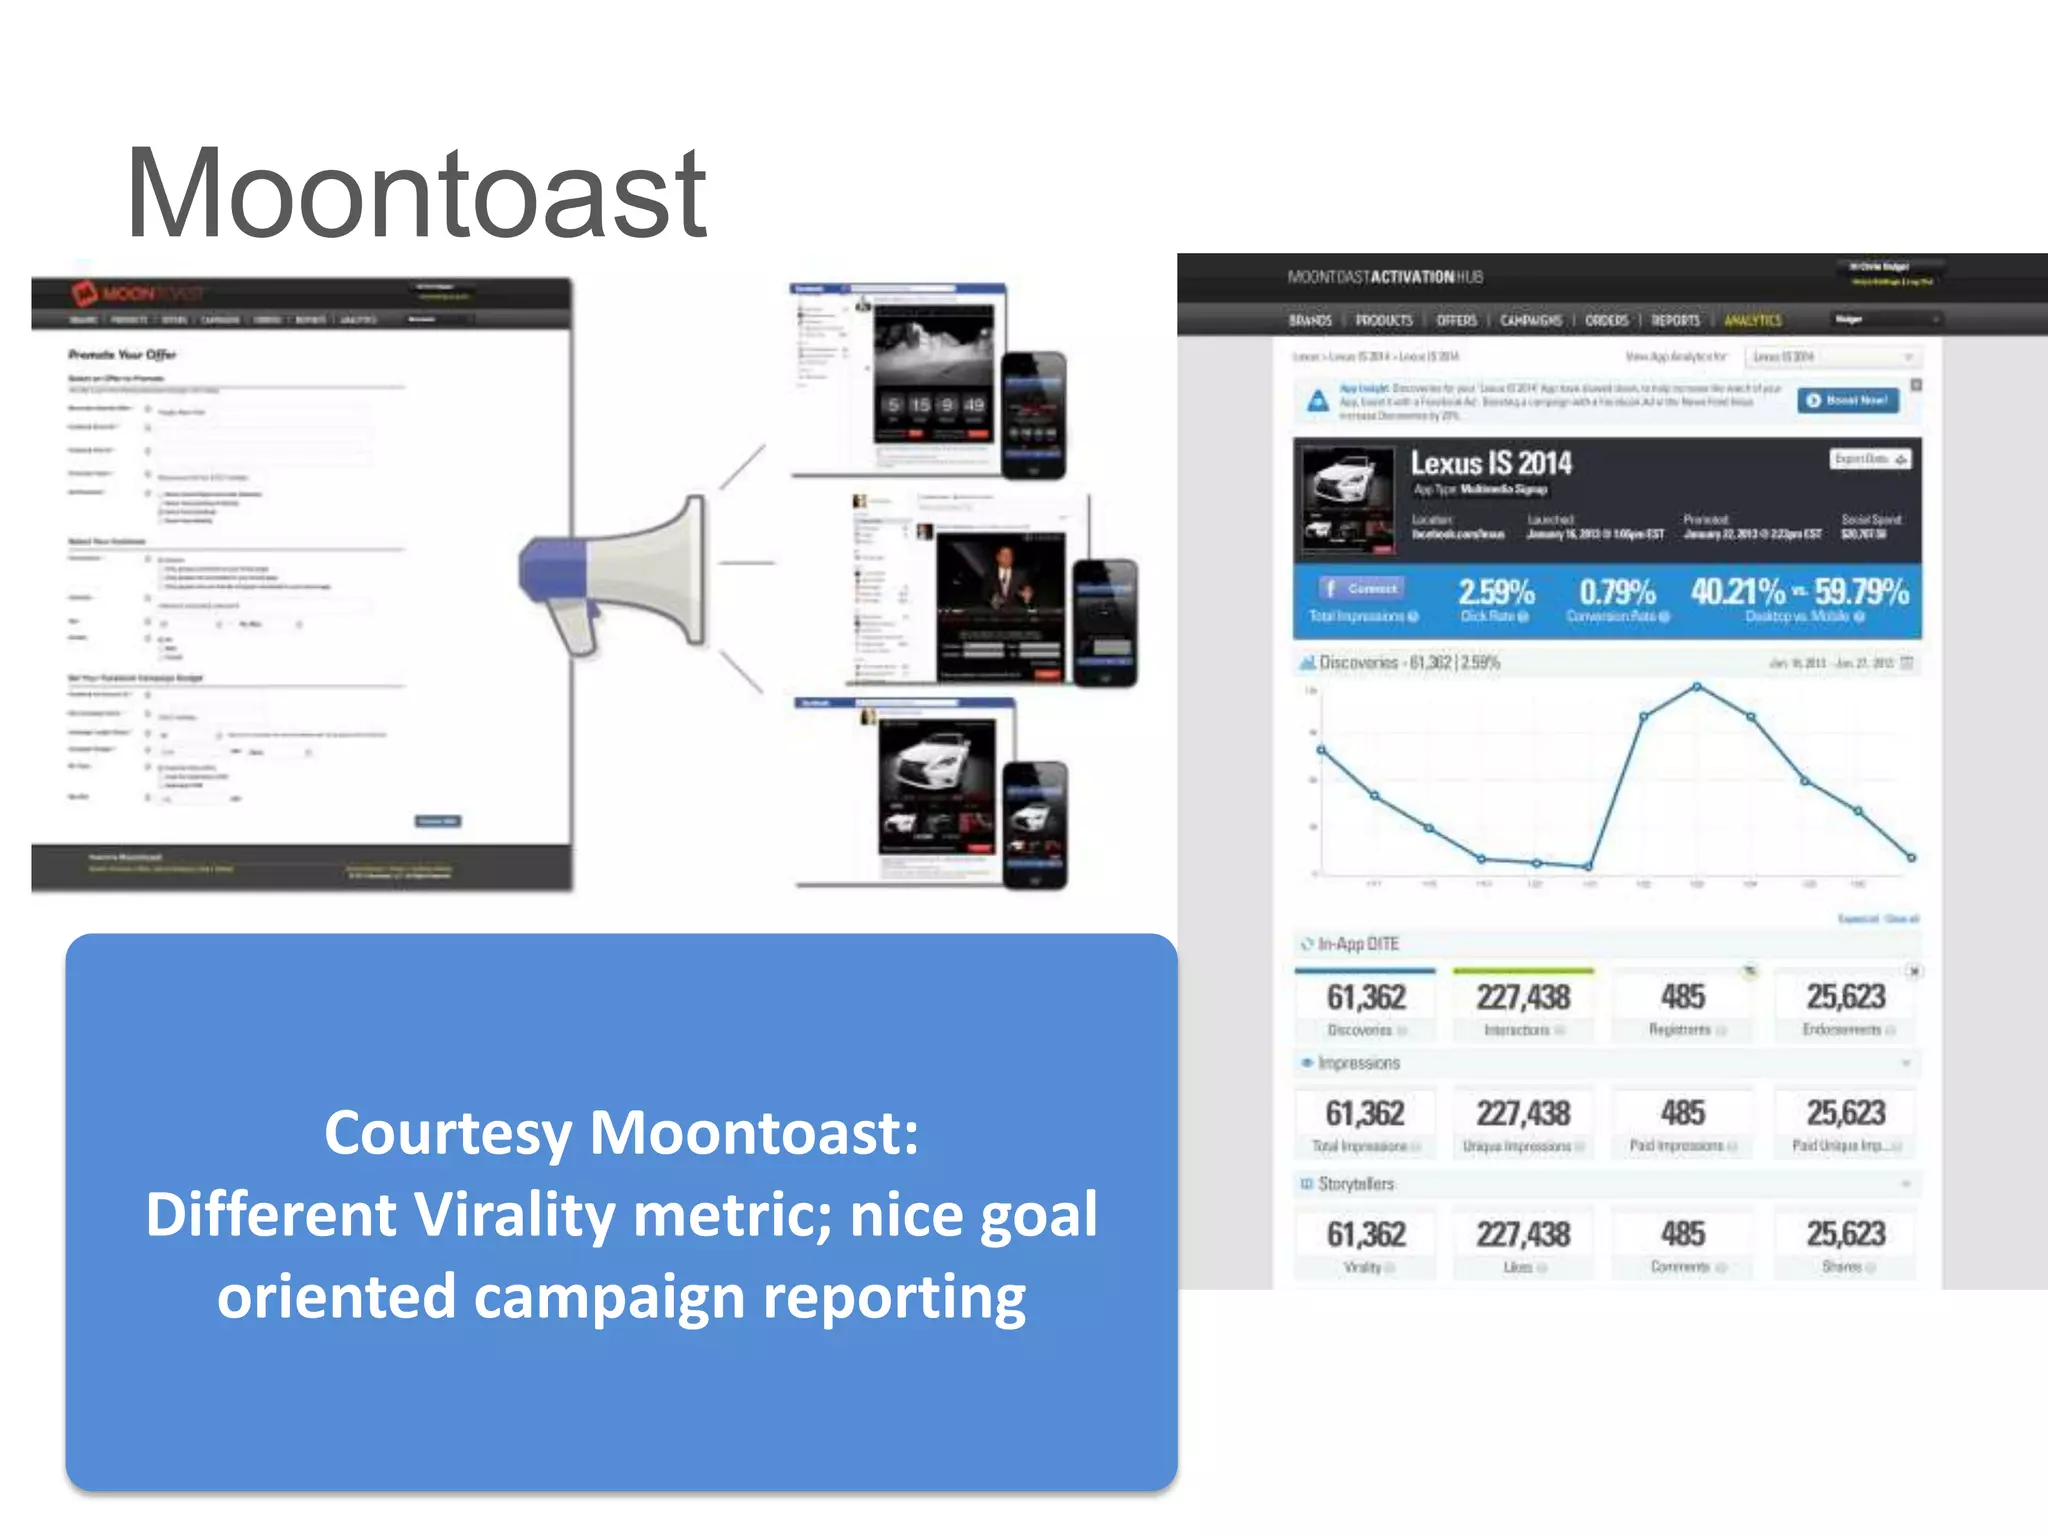
                       Courtesy
                   Lexus/Moontoast
Promotion


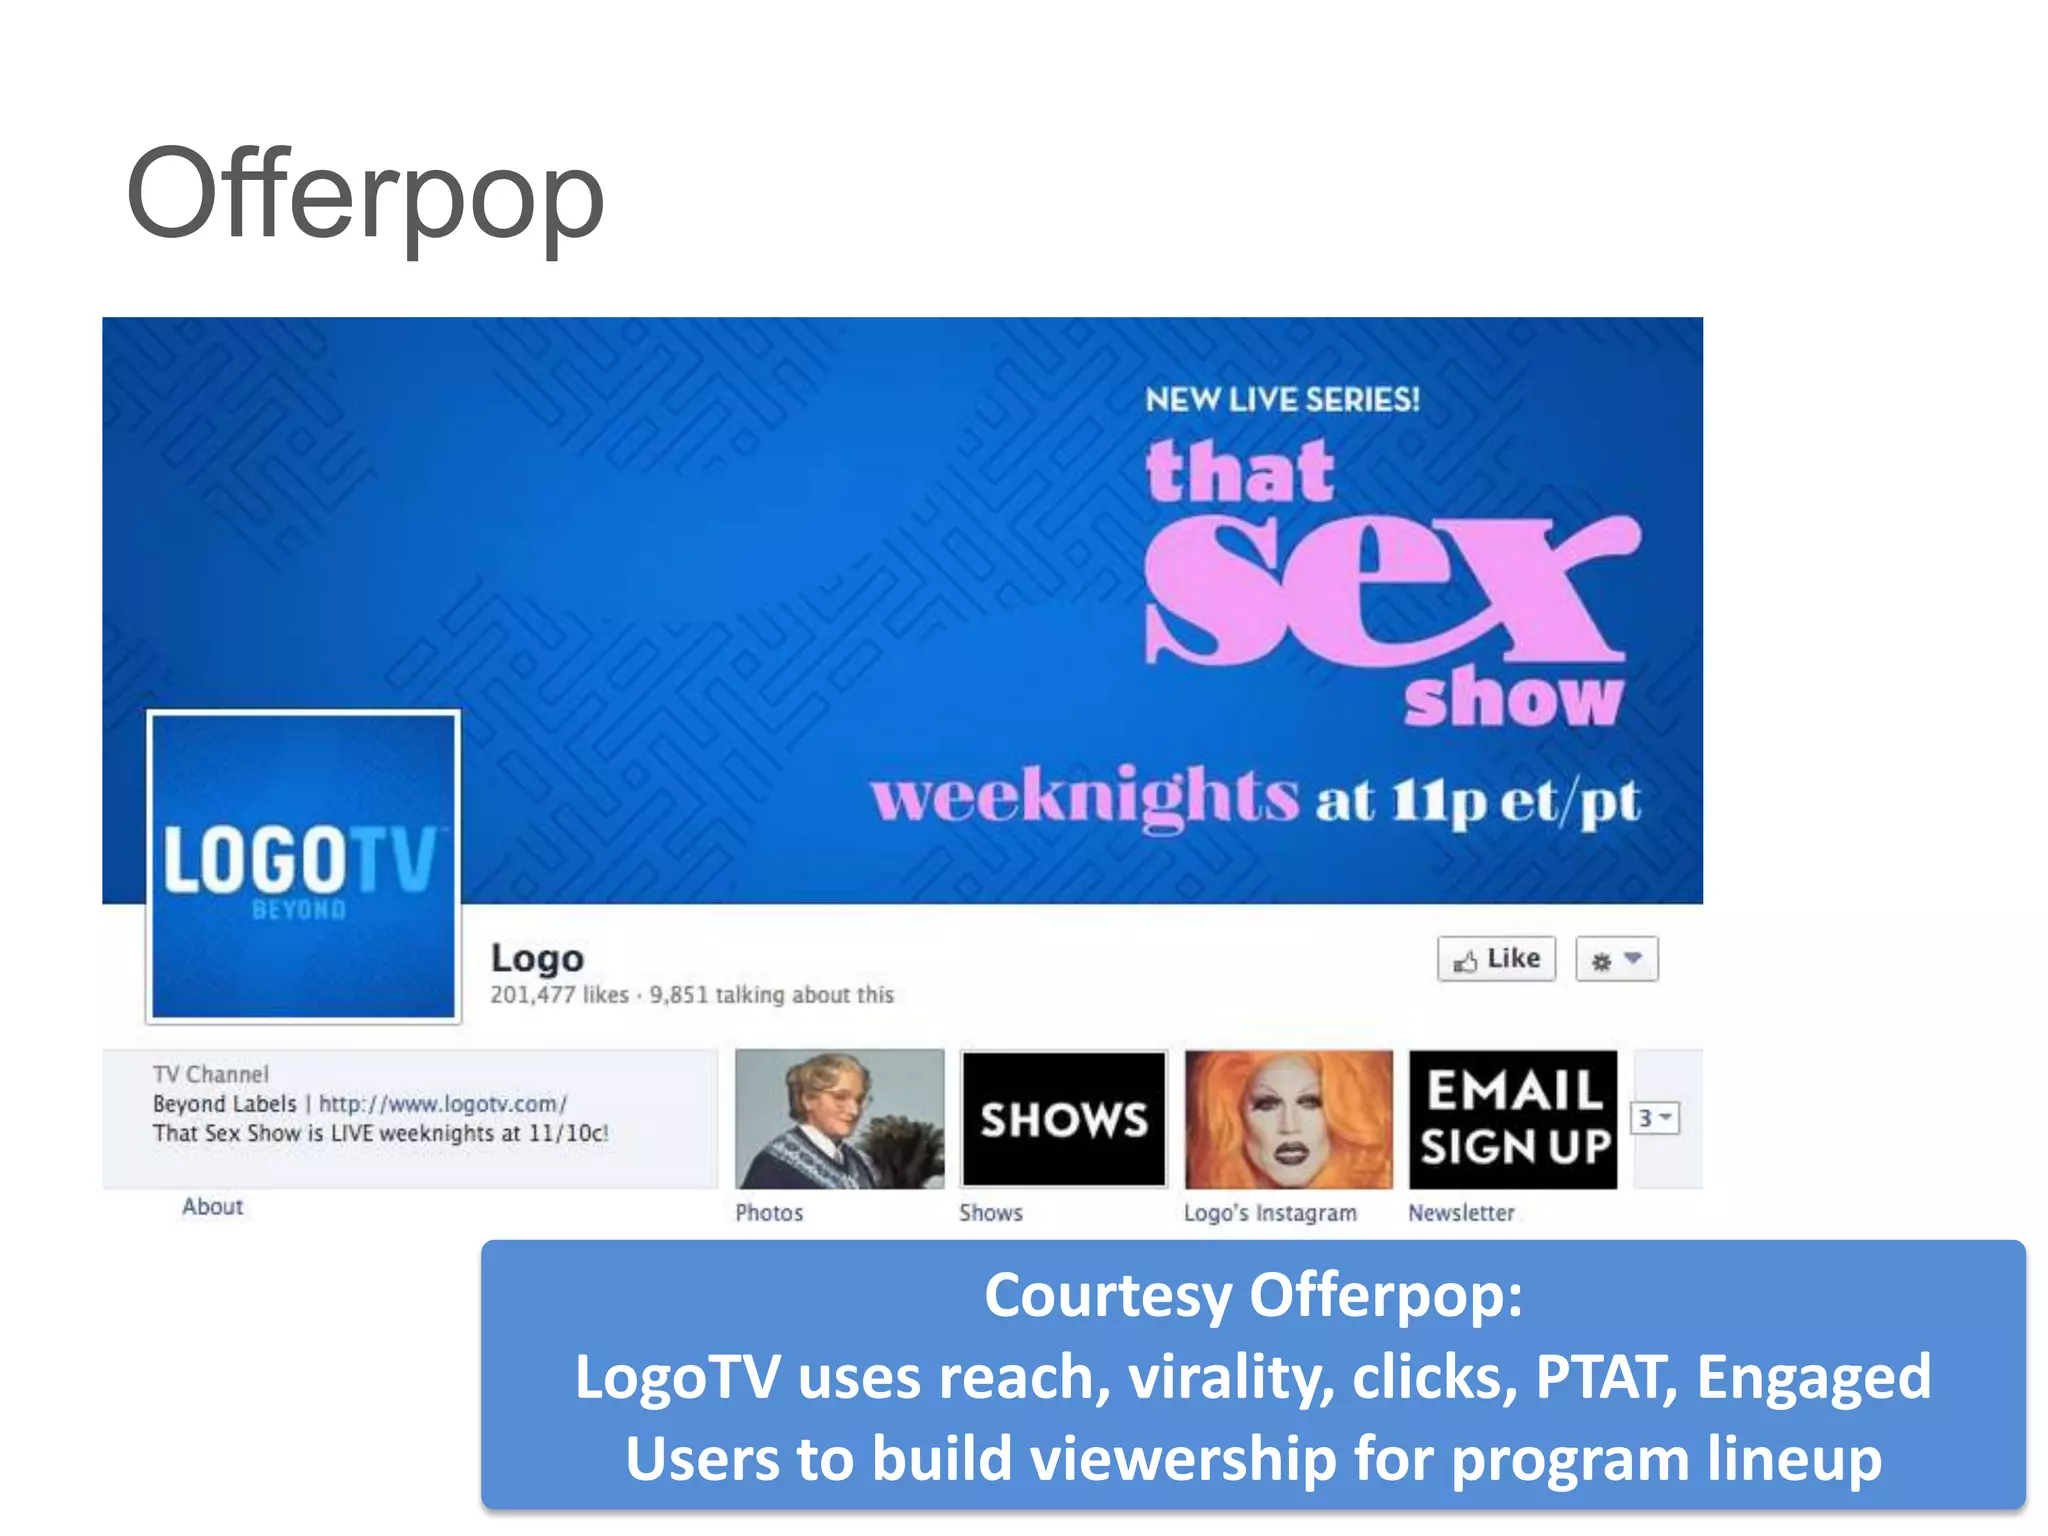
            Courtesy Nexxus/
               Offerpop

              Moved 101,000
            samples in 48 hours
               46% view-to-
              conversion rate
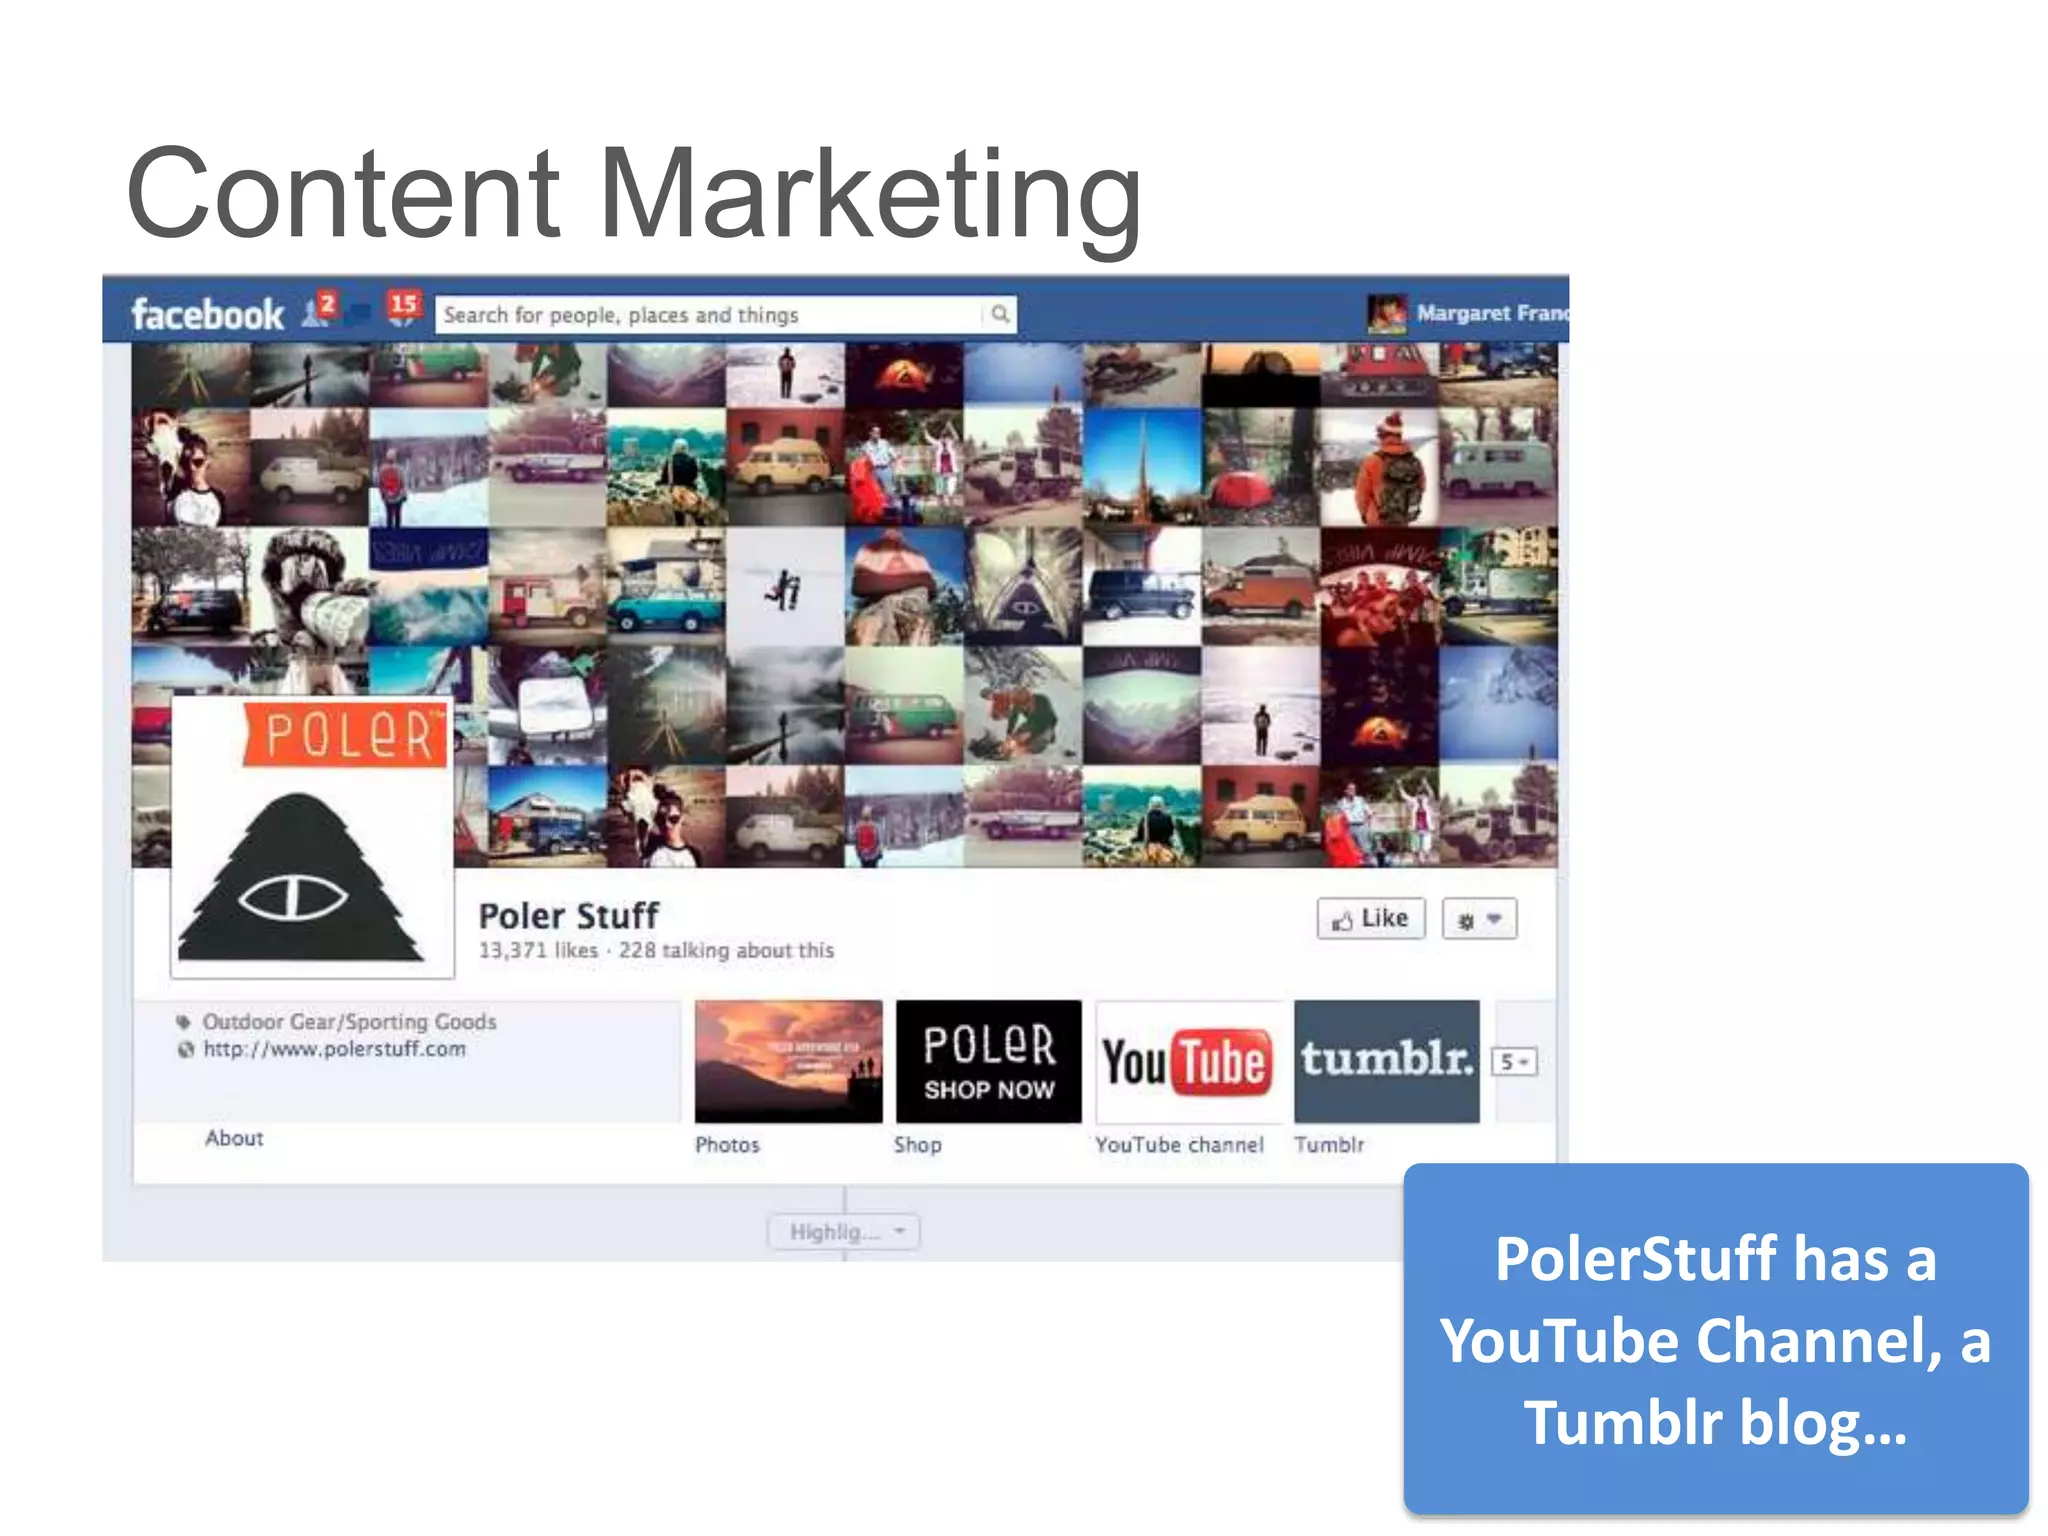
Content Marketing


                      PolerStuff has a
                    YouTube Channel, a
                       Tumblr blog…
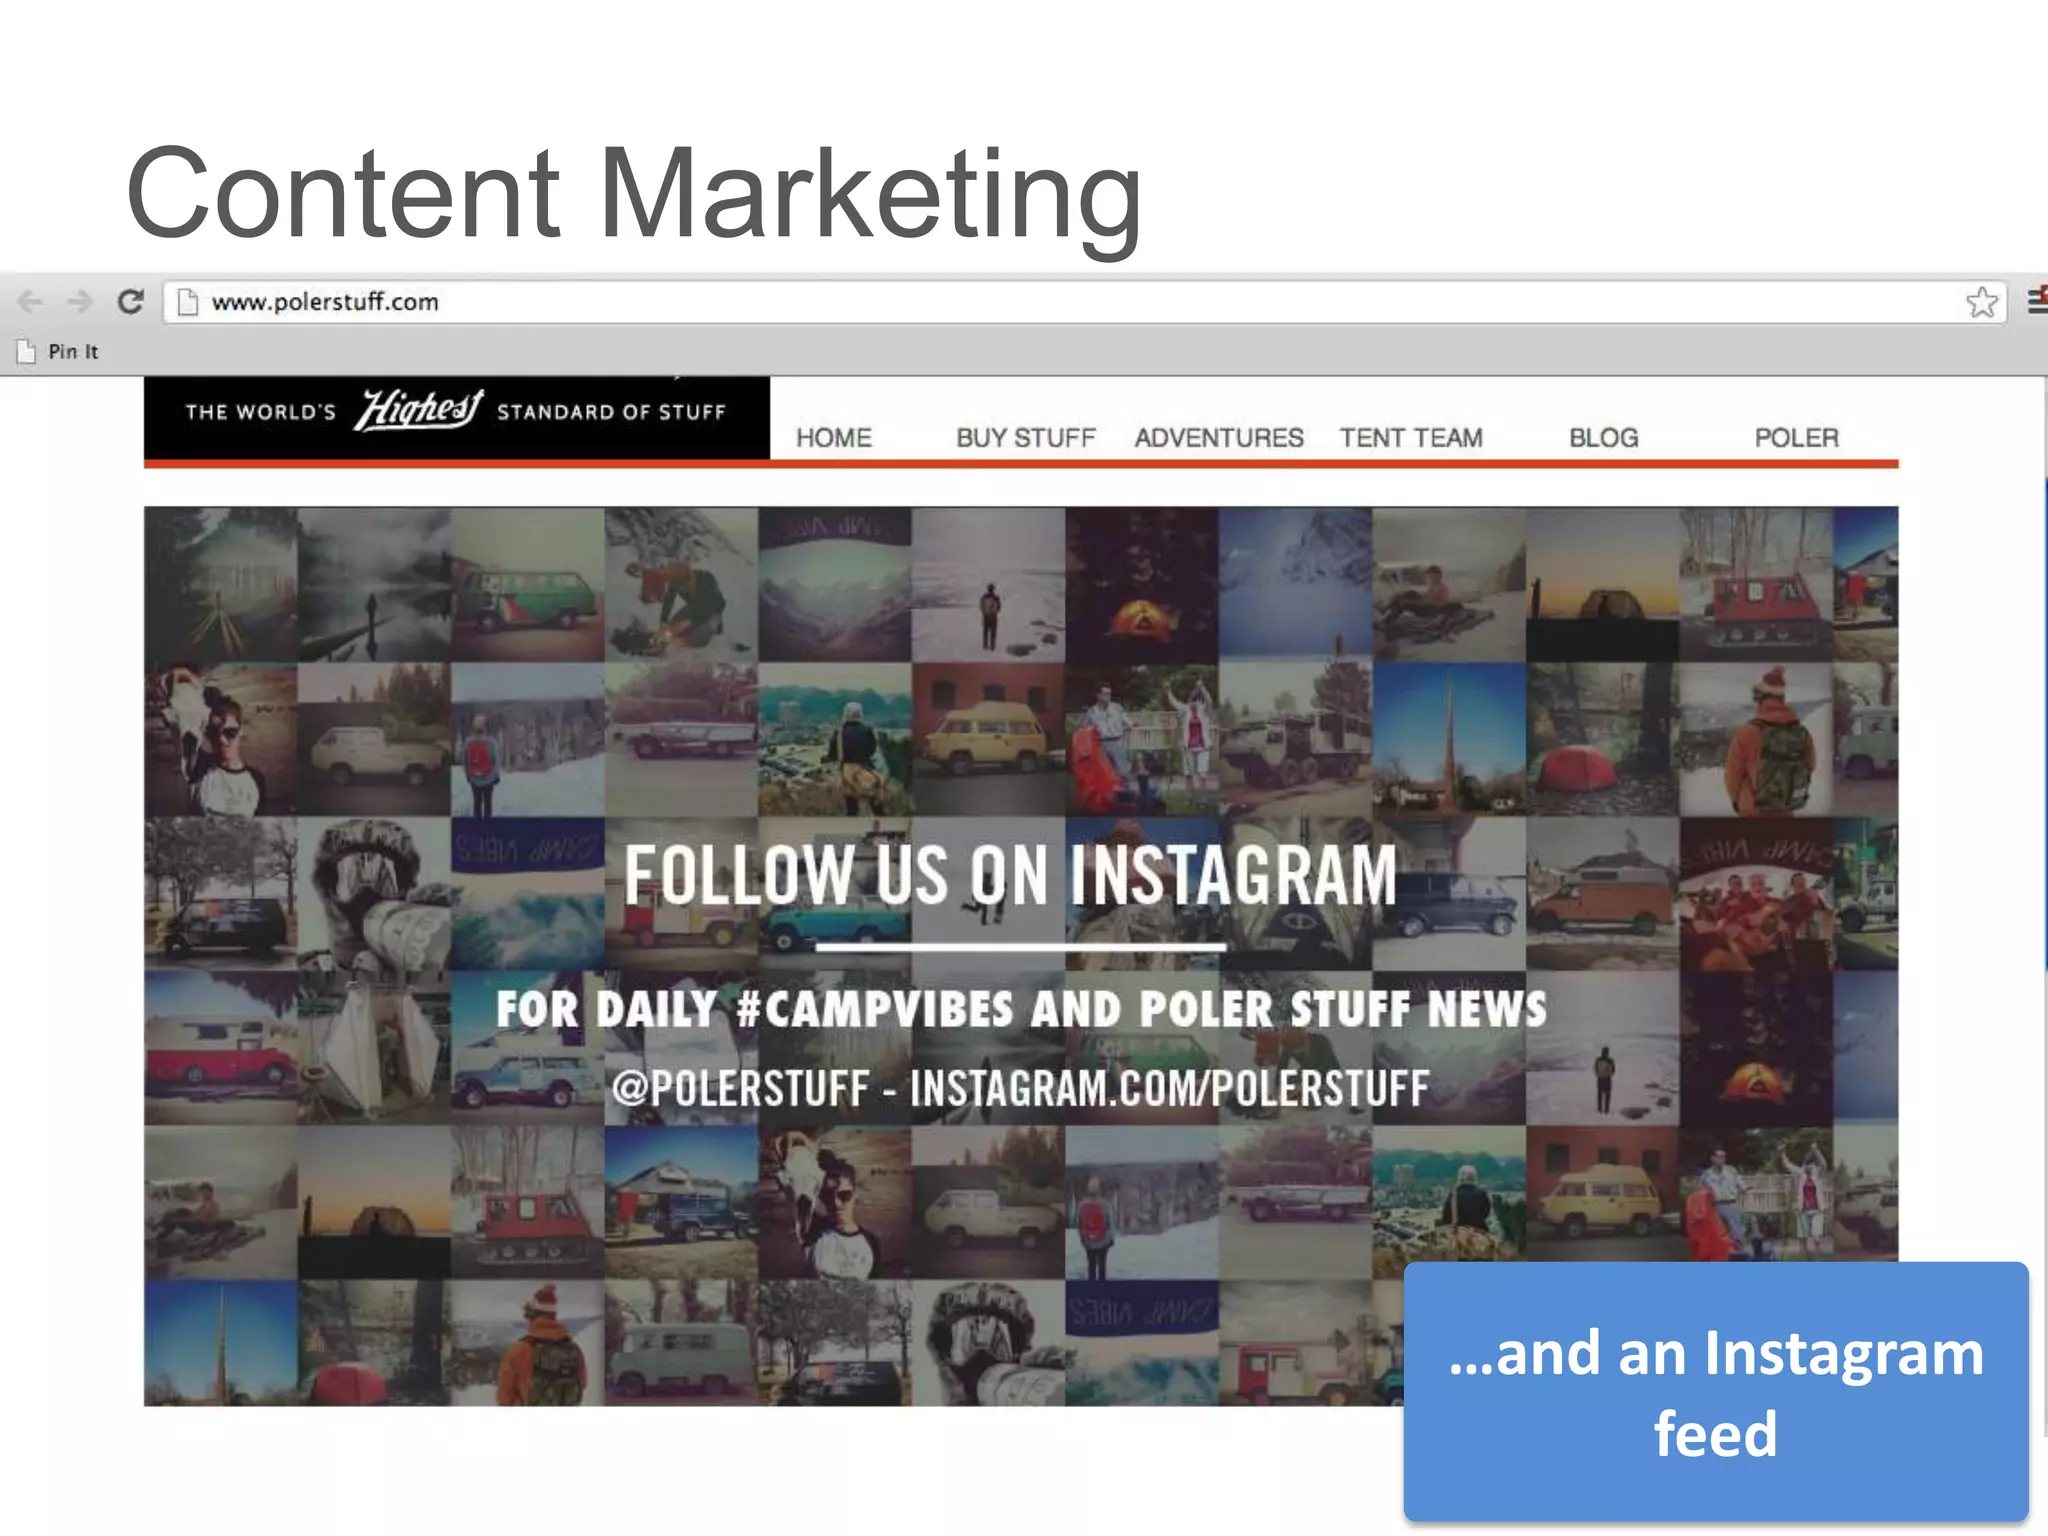
Content Marketing


                    …and an Instagram
                          feed
Content Marketing


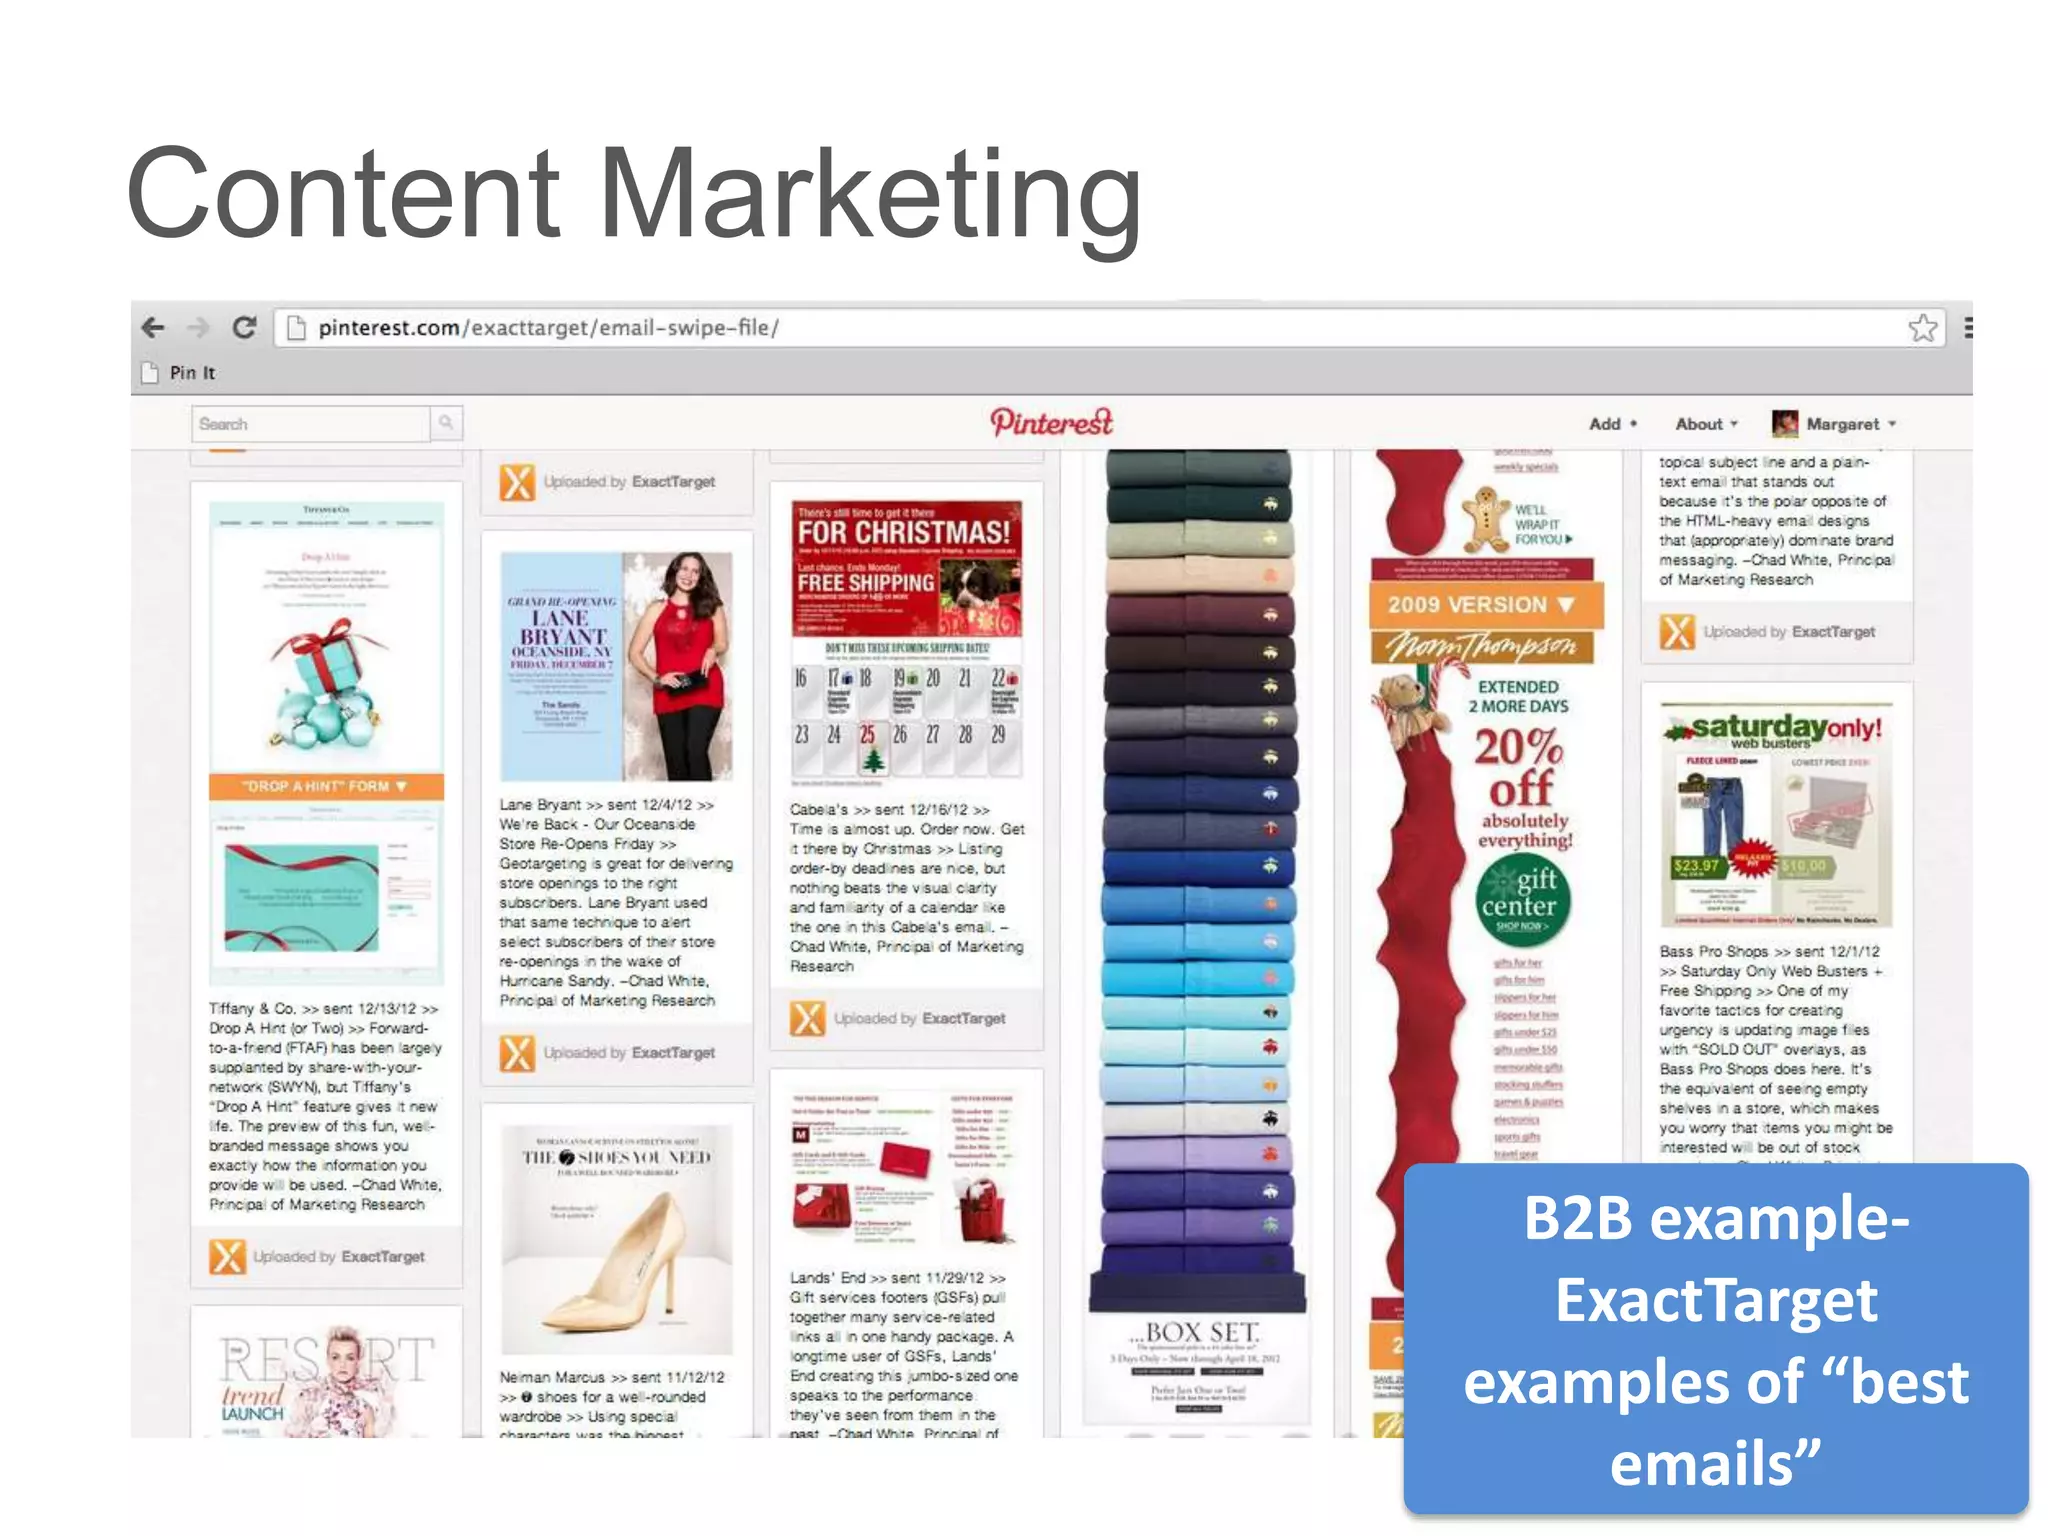
                      B2B example-
                       ExactTarget
                    examples of “best
                         emails”
Community Management


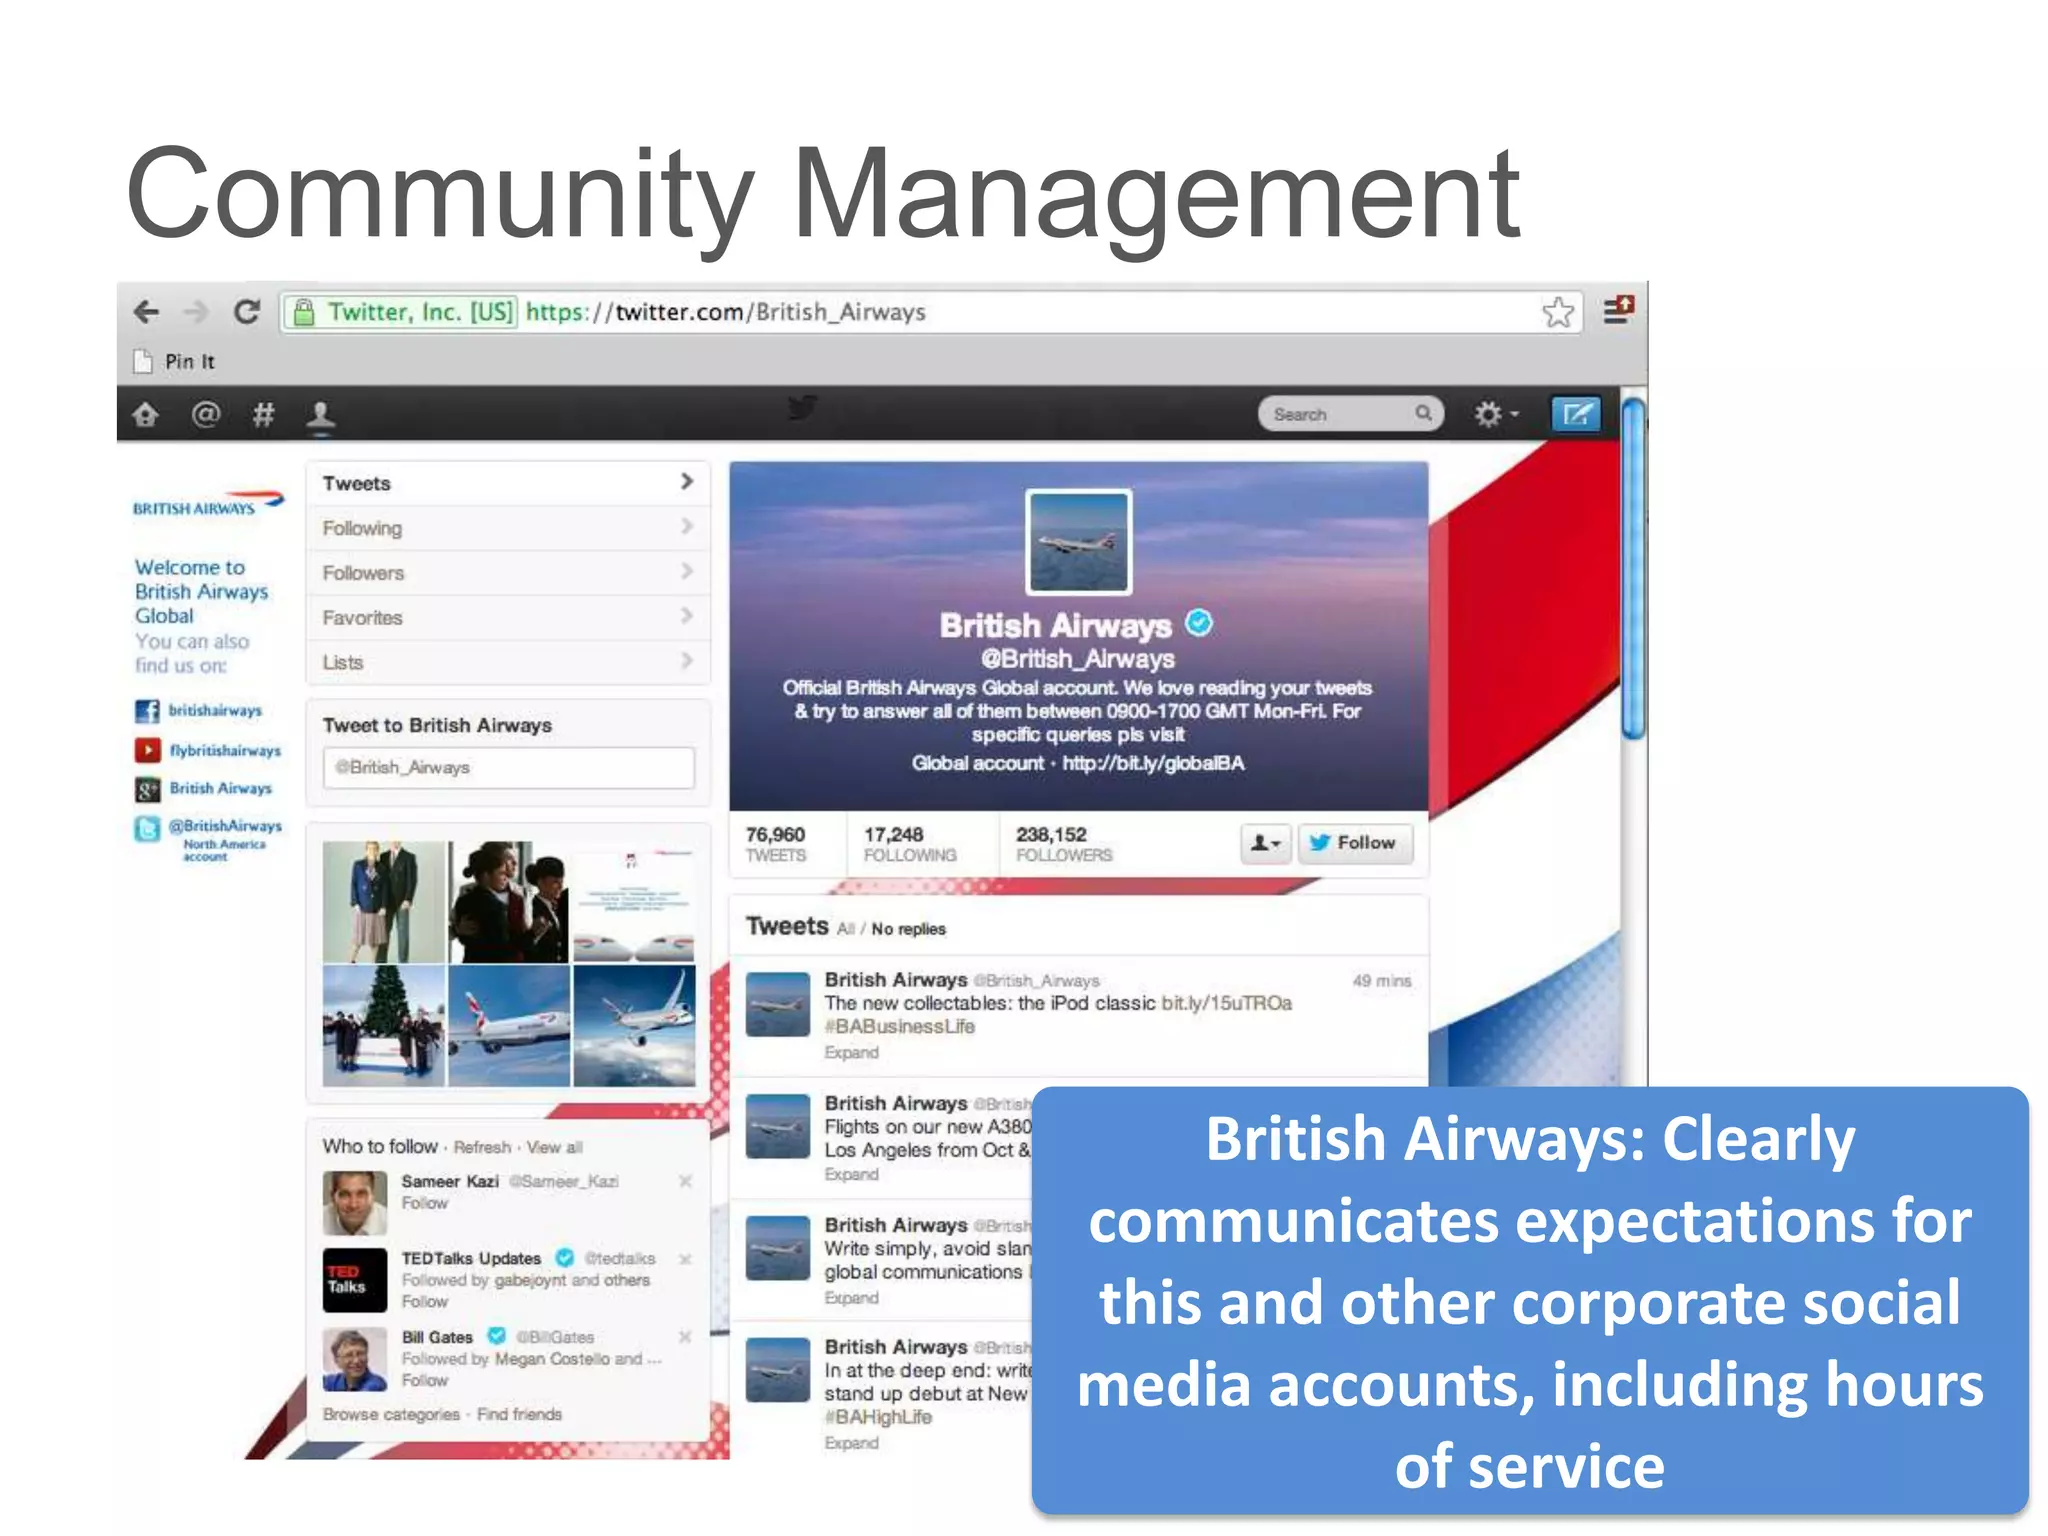
                 British Airways: Clearly
             communicates expectations for
             this and other corporate social
             media accounts, including hours
                        of service
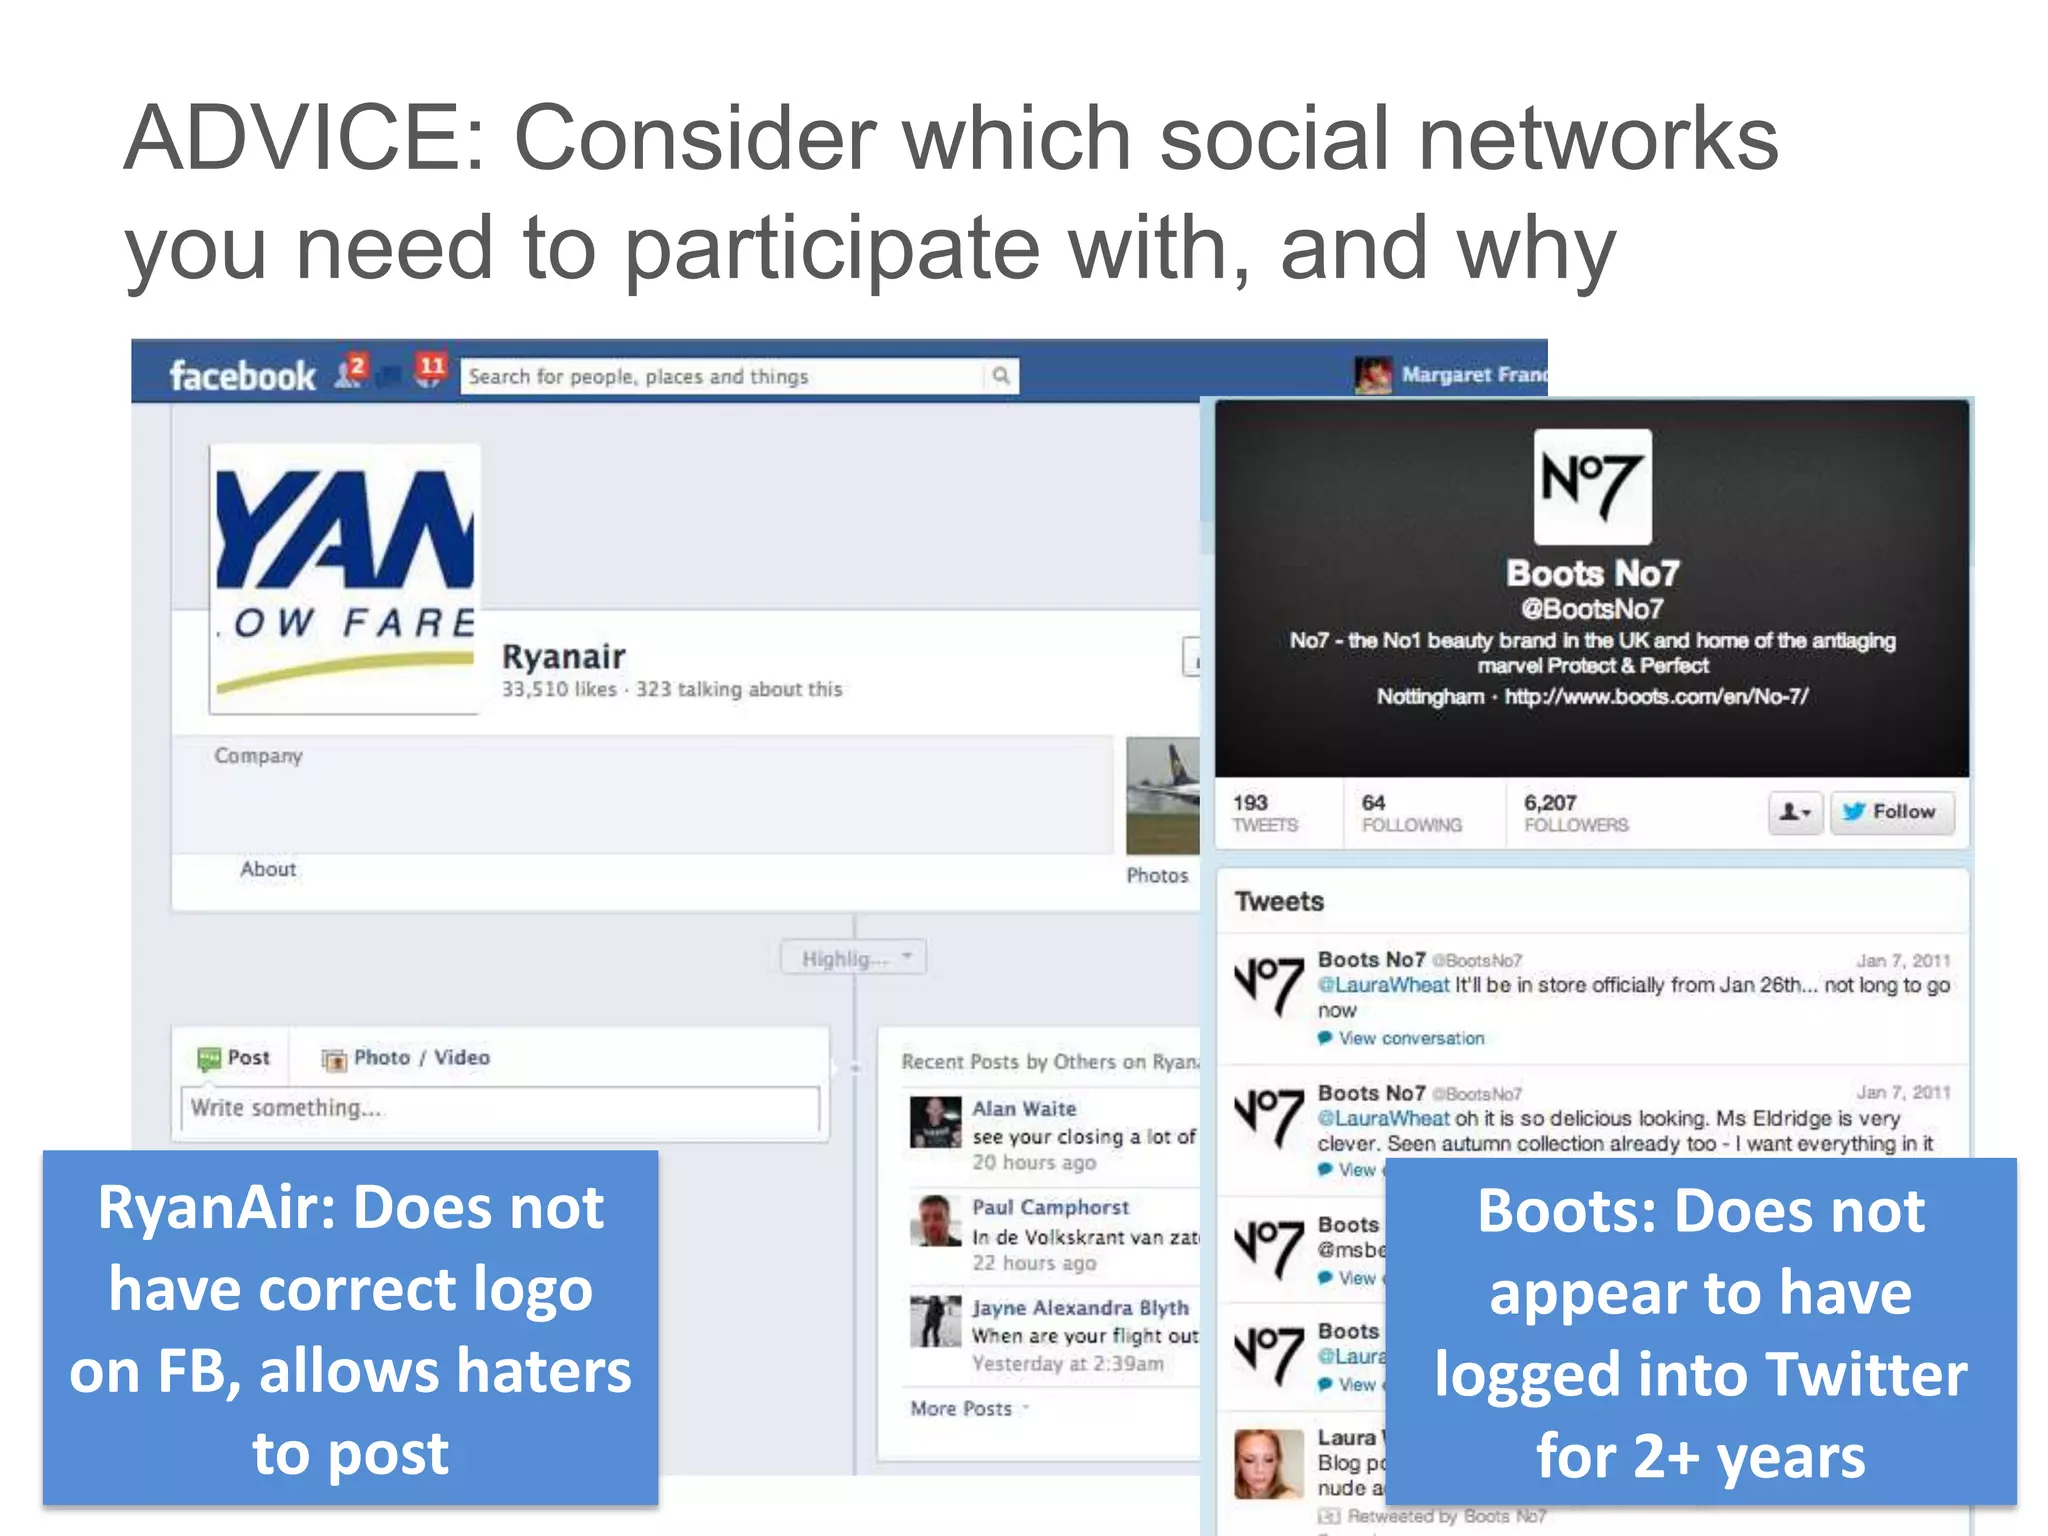
ADVICE: Consider which social networks
 you need to participate with, and why


 RyanAir: Does not               Boots: Does not
 have correct logo               appear to have
on FB, allows haters           logged into Twitter
       to post                     for 2+ years
Q&A
• Which social networks does your company…
  – Currently monitor
  – Currently market/ communicate on
  – Plan to expand to over 2013 and beyond
Social Media Networks:
Metrics & Tools
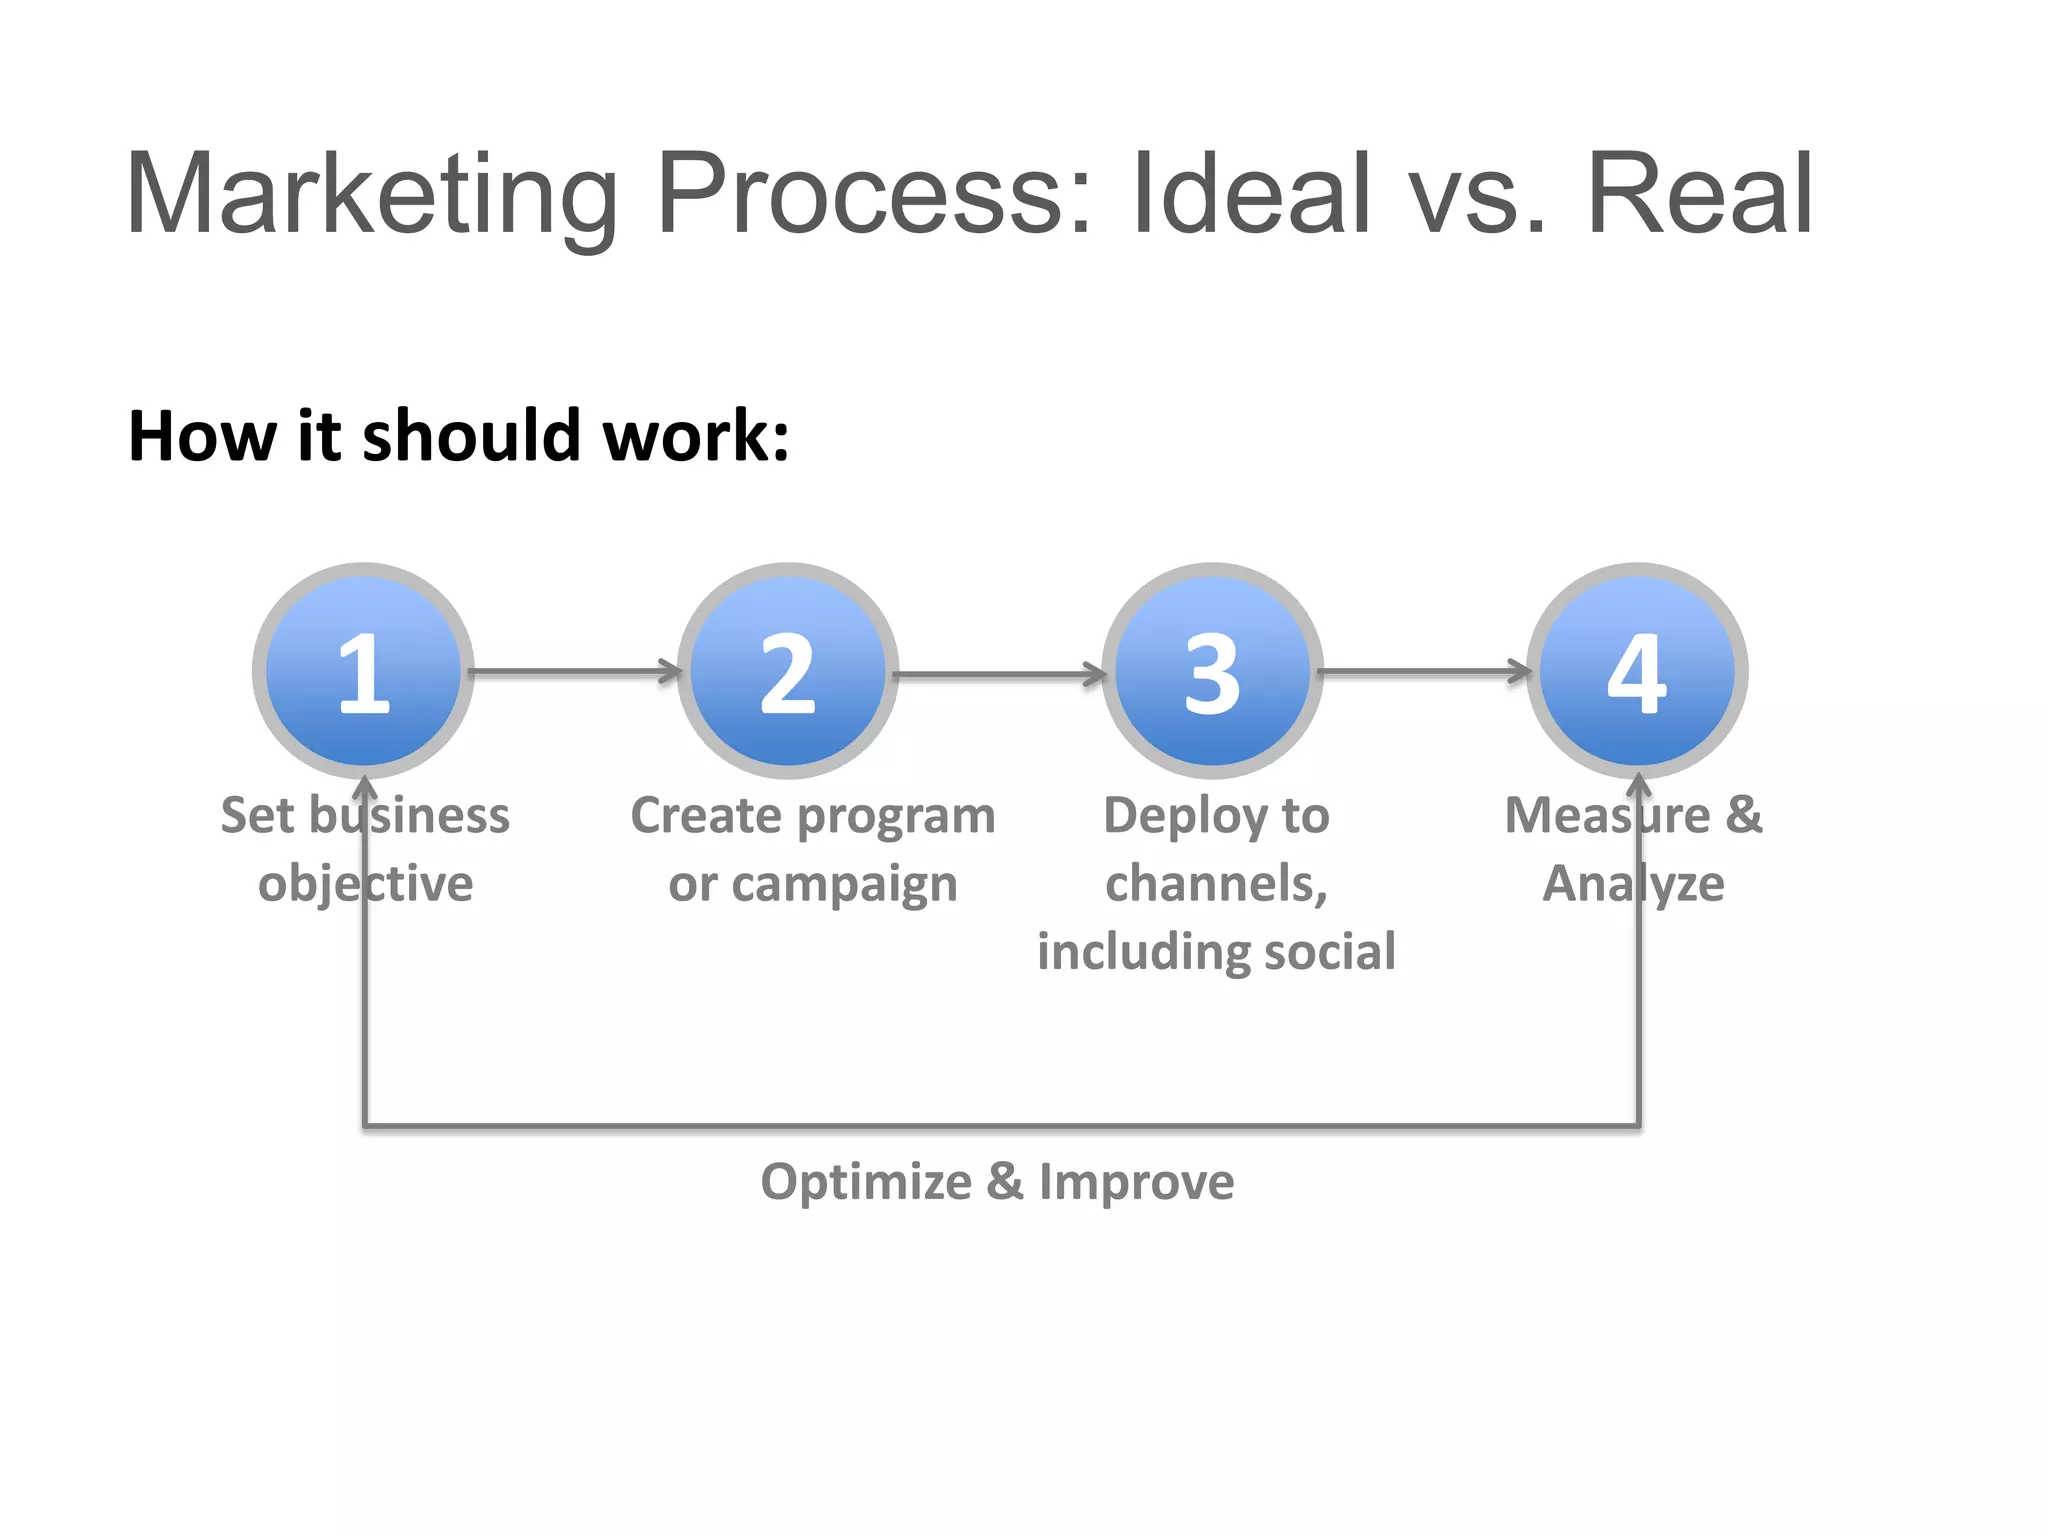
Marketing Process: Ideal vs. Real

How it should work:


      1              2                  3               4
  Set business   Create program      Deploy to       Measure &
   objective      or campaign        channels,        Analyze
                                  including social


                     Optimize & Improve
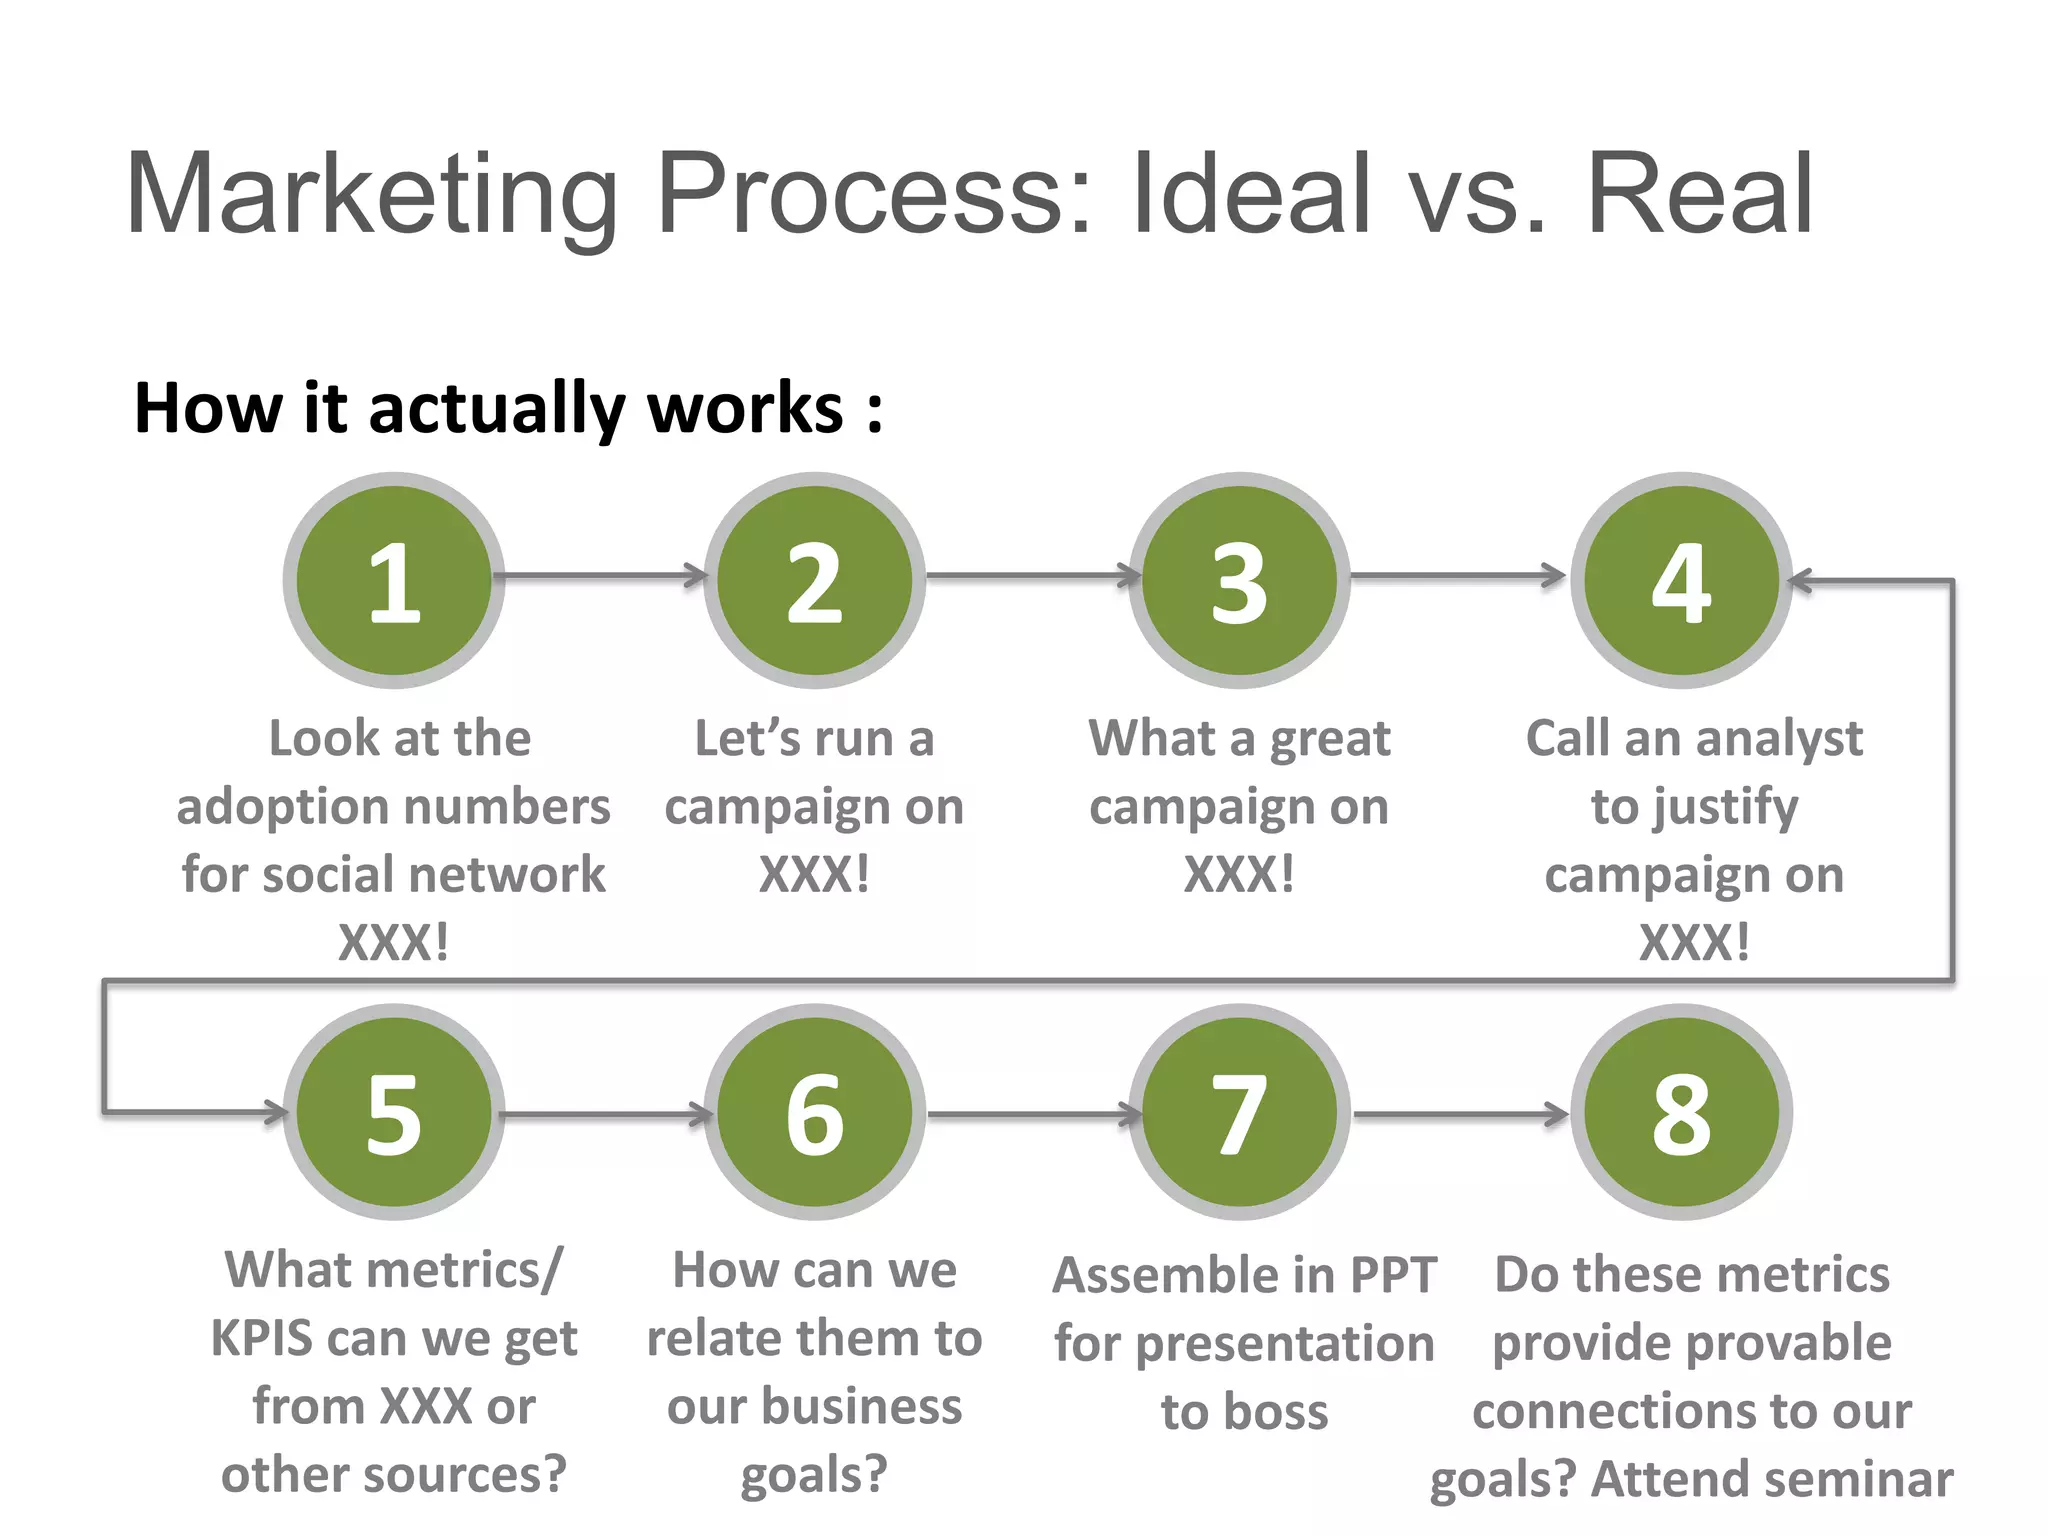
Marketing Process: Ideal vs. Real
How it actually works :

        1                2                 3                 4
     Look at the    Let’s run a       What a great      Call an analyst
 adoption numbers campaign on         campaign on          to justify
 for social network    XXX!              XXX!            campaign on
        XXX!                                                  XXX!


        5                6                 7                 8
  What metrics/      How can we      Assemble in PPT Do these metrics
  KPIS can we get   relate them to   for presentation provide provable
   from XXX or       our business         to boss      connections to our
  other sources?        goals?                       goals? Attend seminar
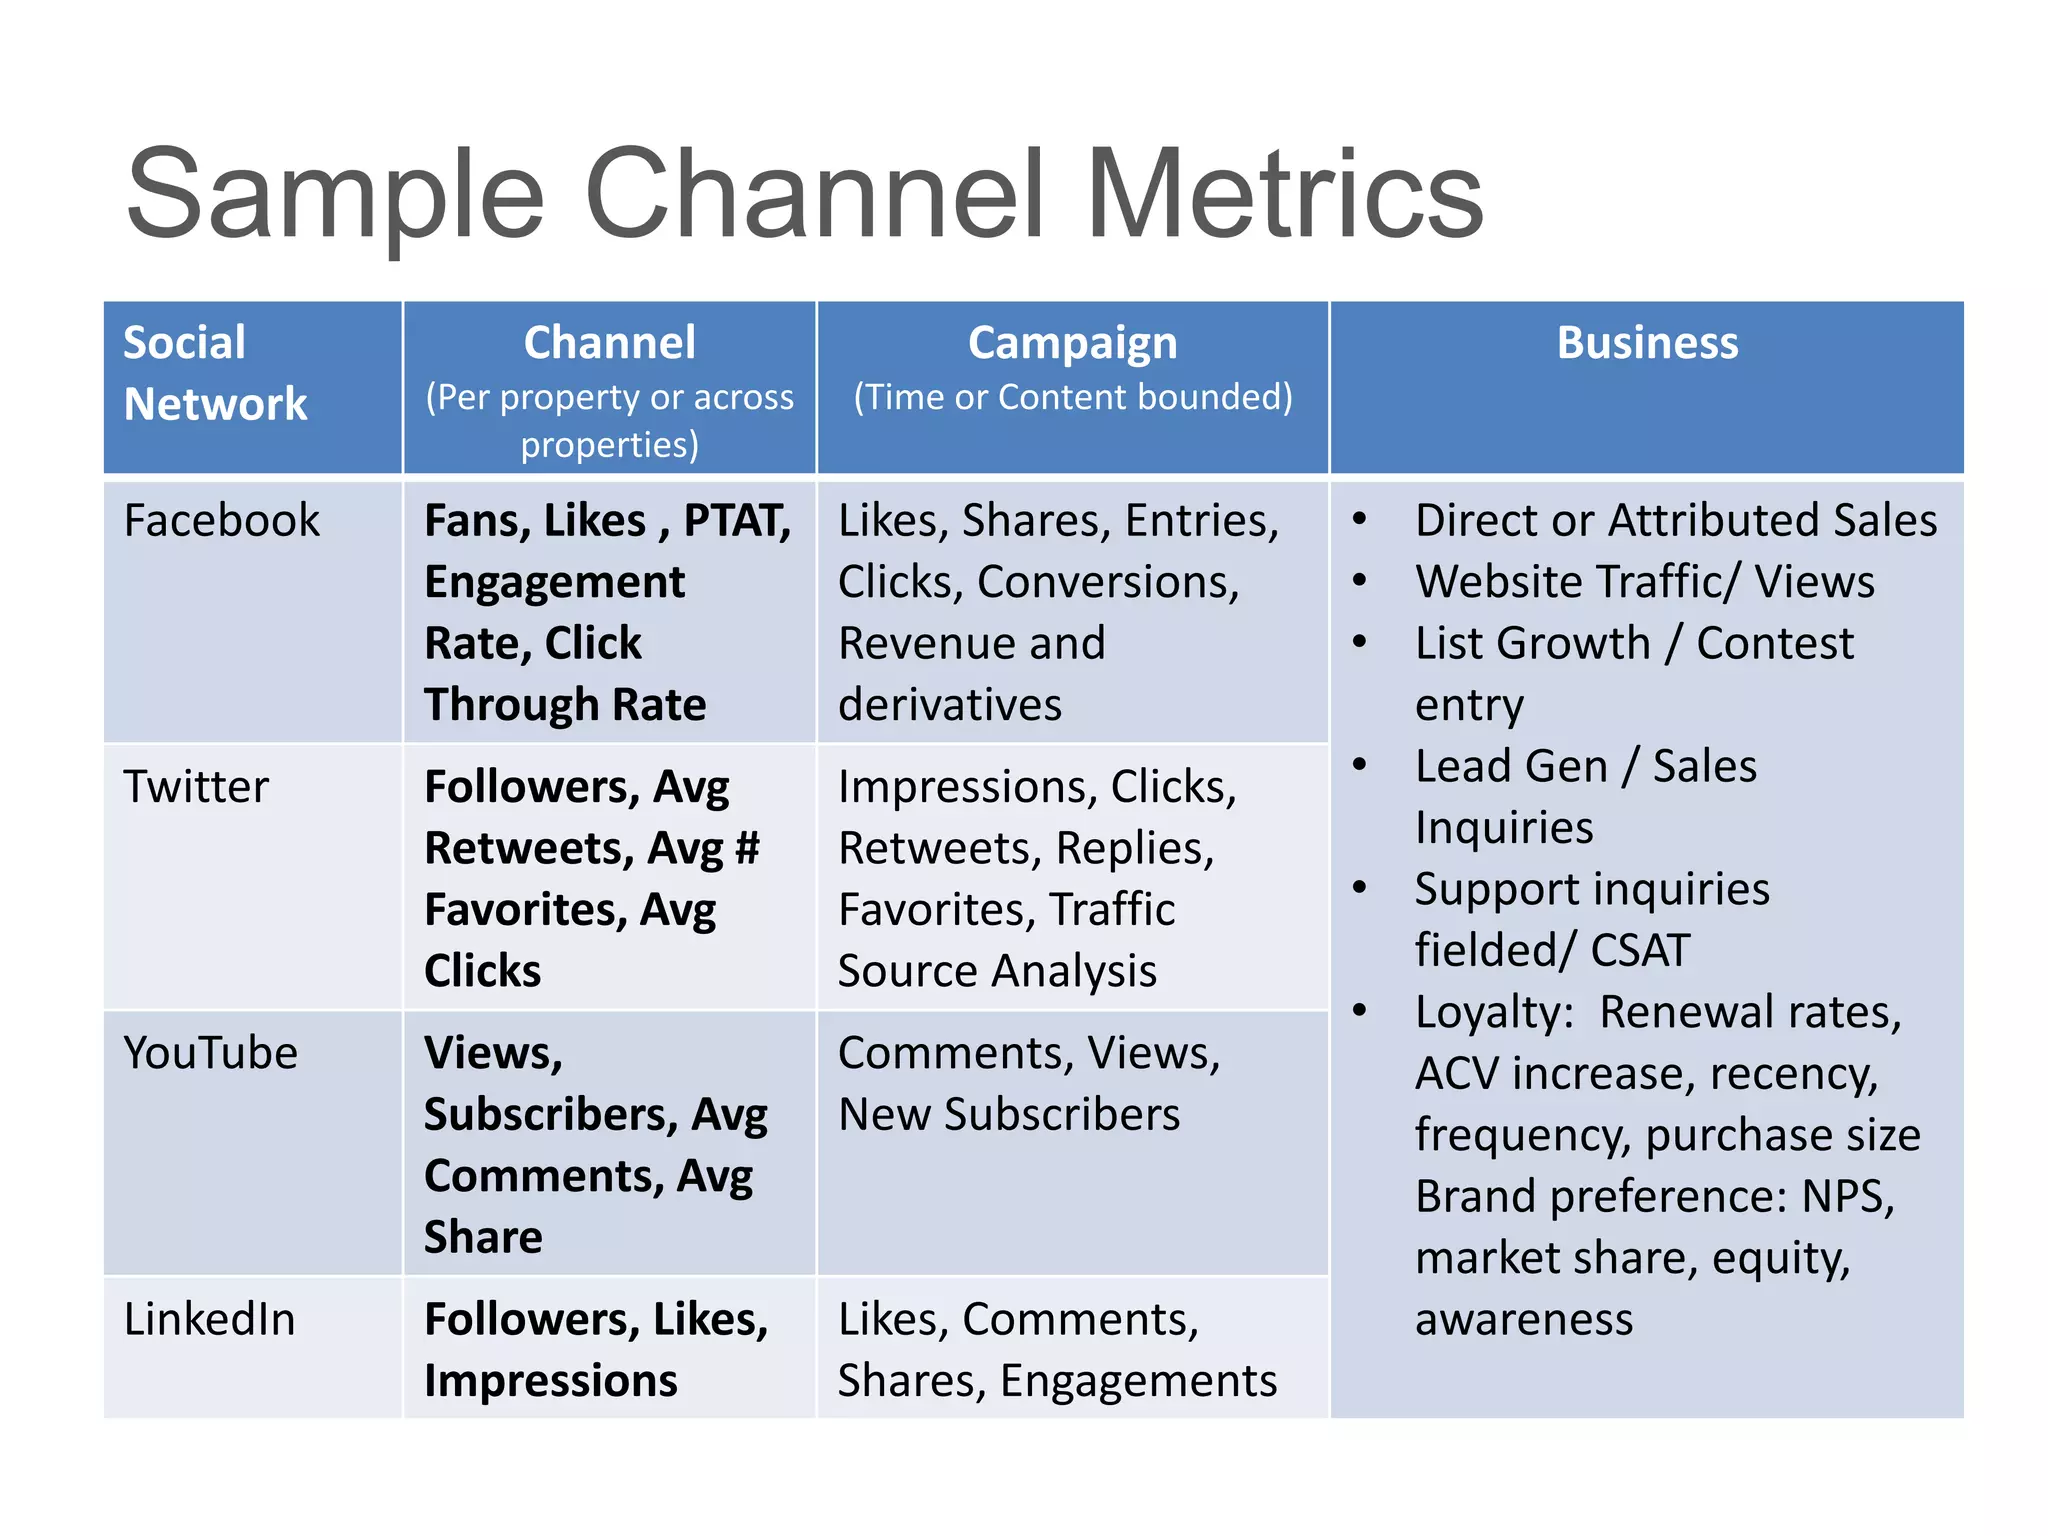
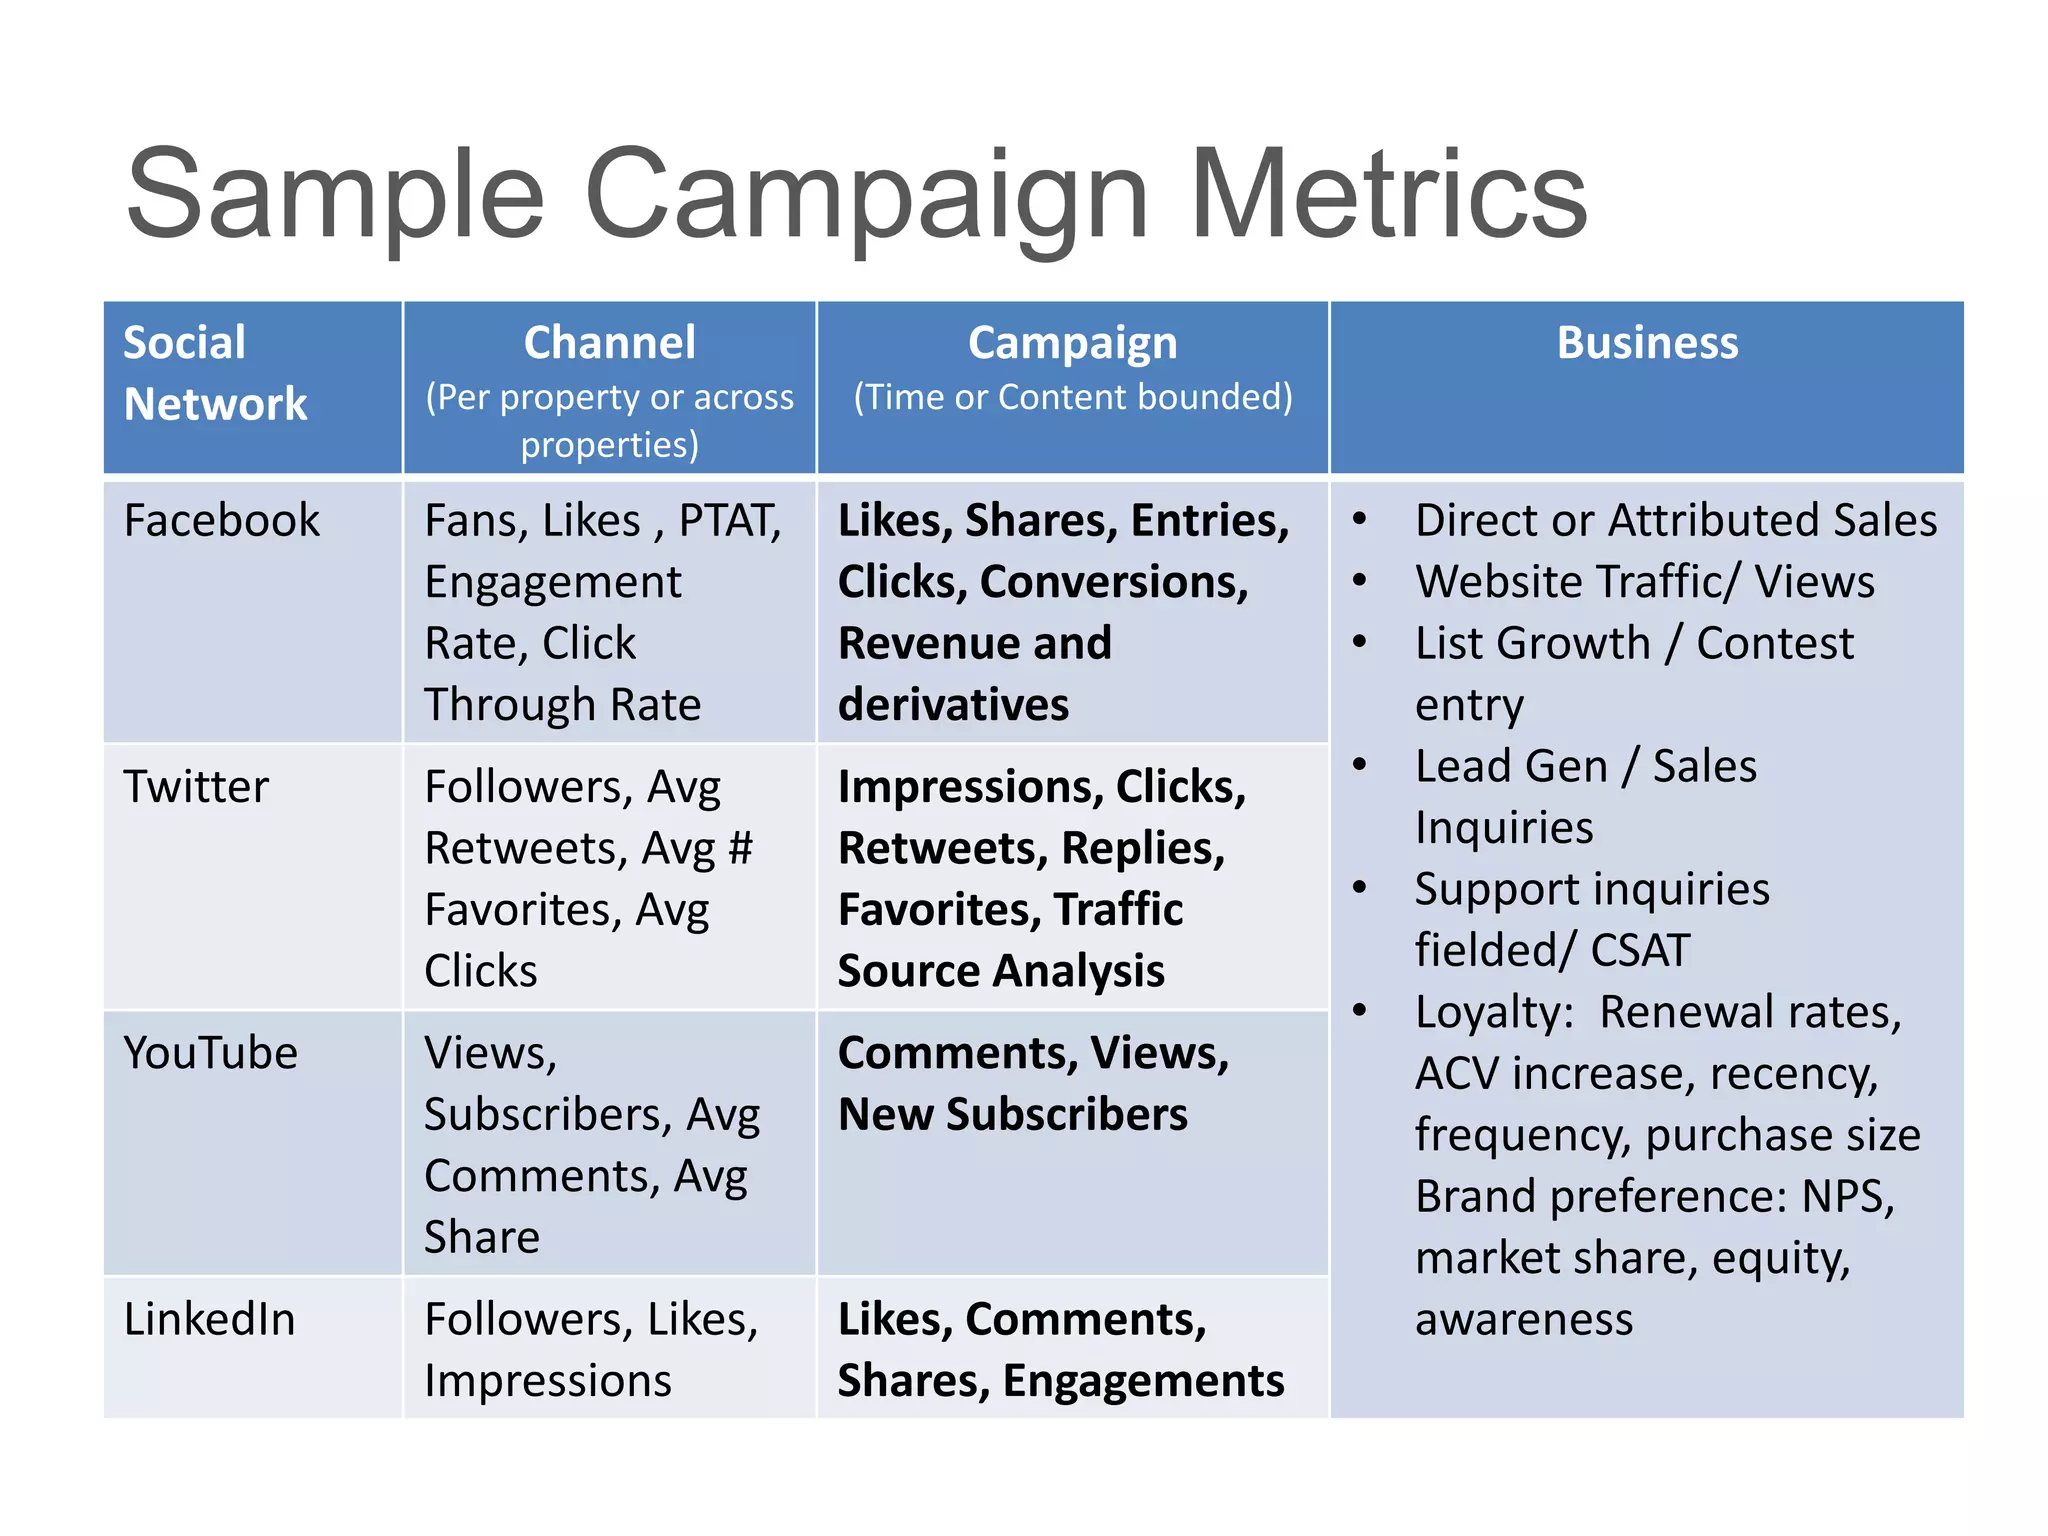
Sample Channel Metrics
Social           Channel                   Campaign                       Business
Network    (Per property or across   (Time or Content bounded)
                 properties)
Facebook   Fans, Likes , PTAT,       Likes, Shares, Entries,     • Direct or Attributed Sales
           Engagement                Clicks, Conversions,        • Website Traffic/ Views
           Rate, Click               Revenue and                 • List Growth / Contest
           Through Rate              derivatives                   entry
Twitter    Followers, Avg            Impressions, Clicks,        • Lead Gen / Sales
           Retweets, Avg #           Retweets, Replies,            Inquiries
           Favorites, Avg            Favorites, Traffic          • Support inquiries
           Clicks                    Source Analysis               fielded/ CSAT
                                                                 • Loyalty: Renewal rates,
YouTube    Views,                    Comments, Views,              ACV increase, recency,
           Subscribers, Avg          New Subscribers               frequency, purchase size
           Comments, Avg                                           Brand preference: NPS,
           Share                                                   market share, equity,
LinkedIn   Followers, Likes,         Likes, Comments,              awareness
           Impressions               Shares, Engagements
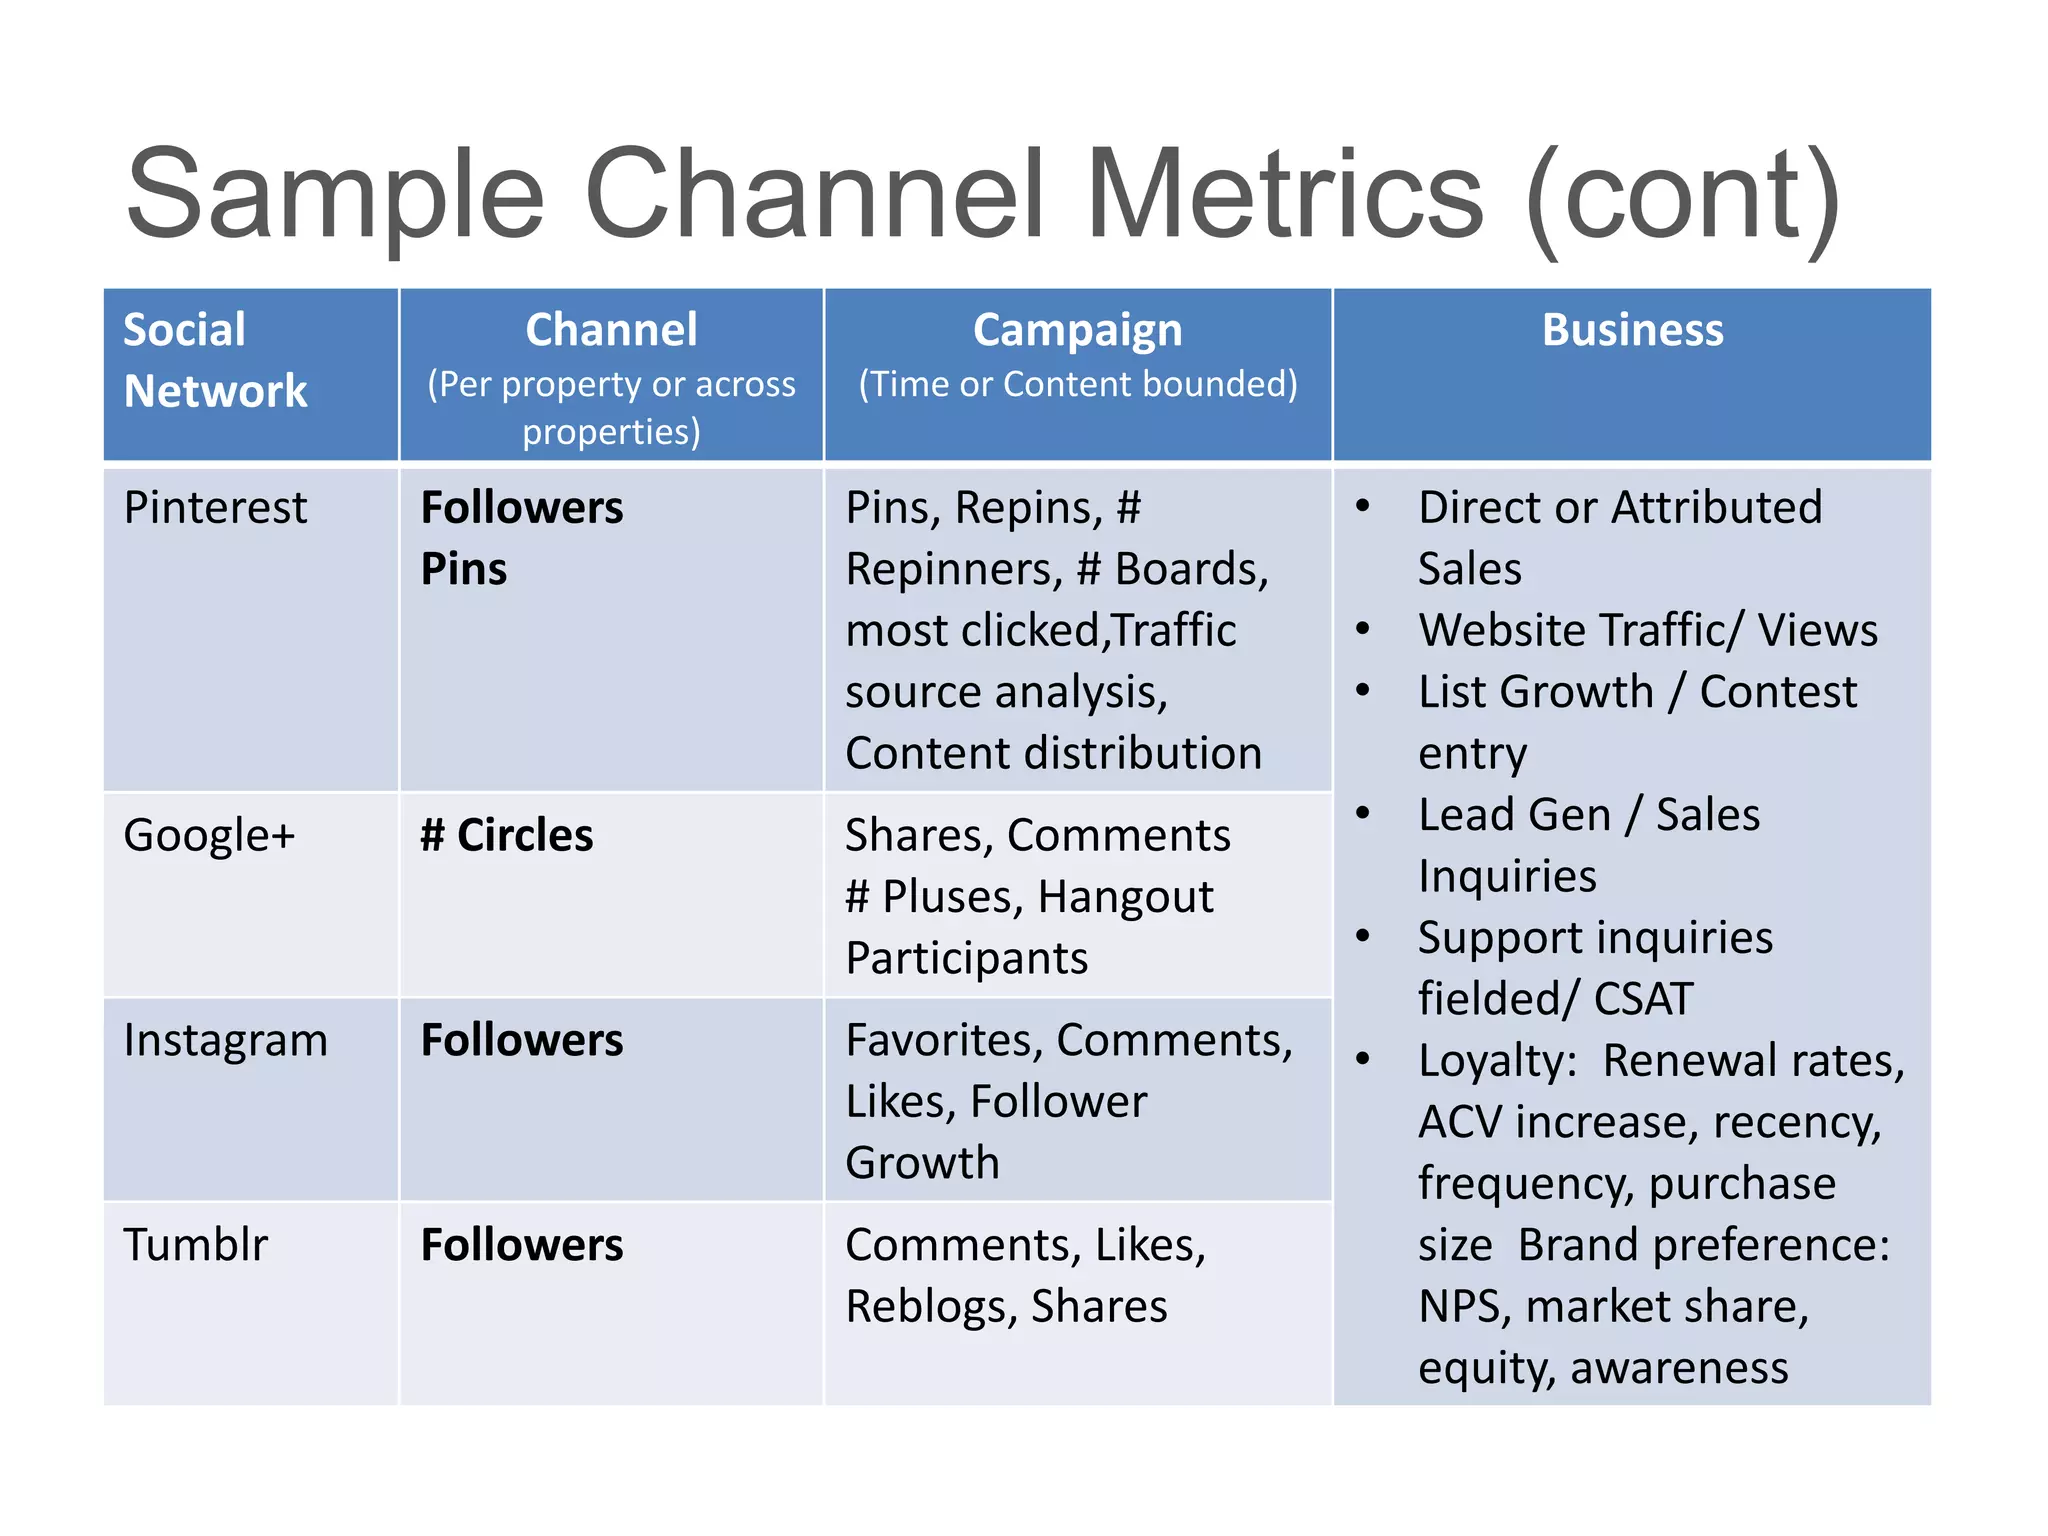
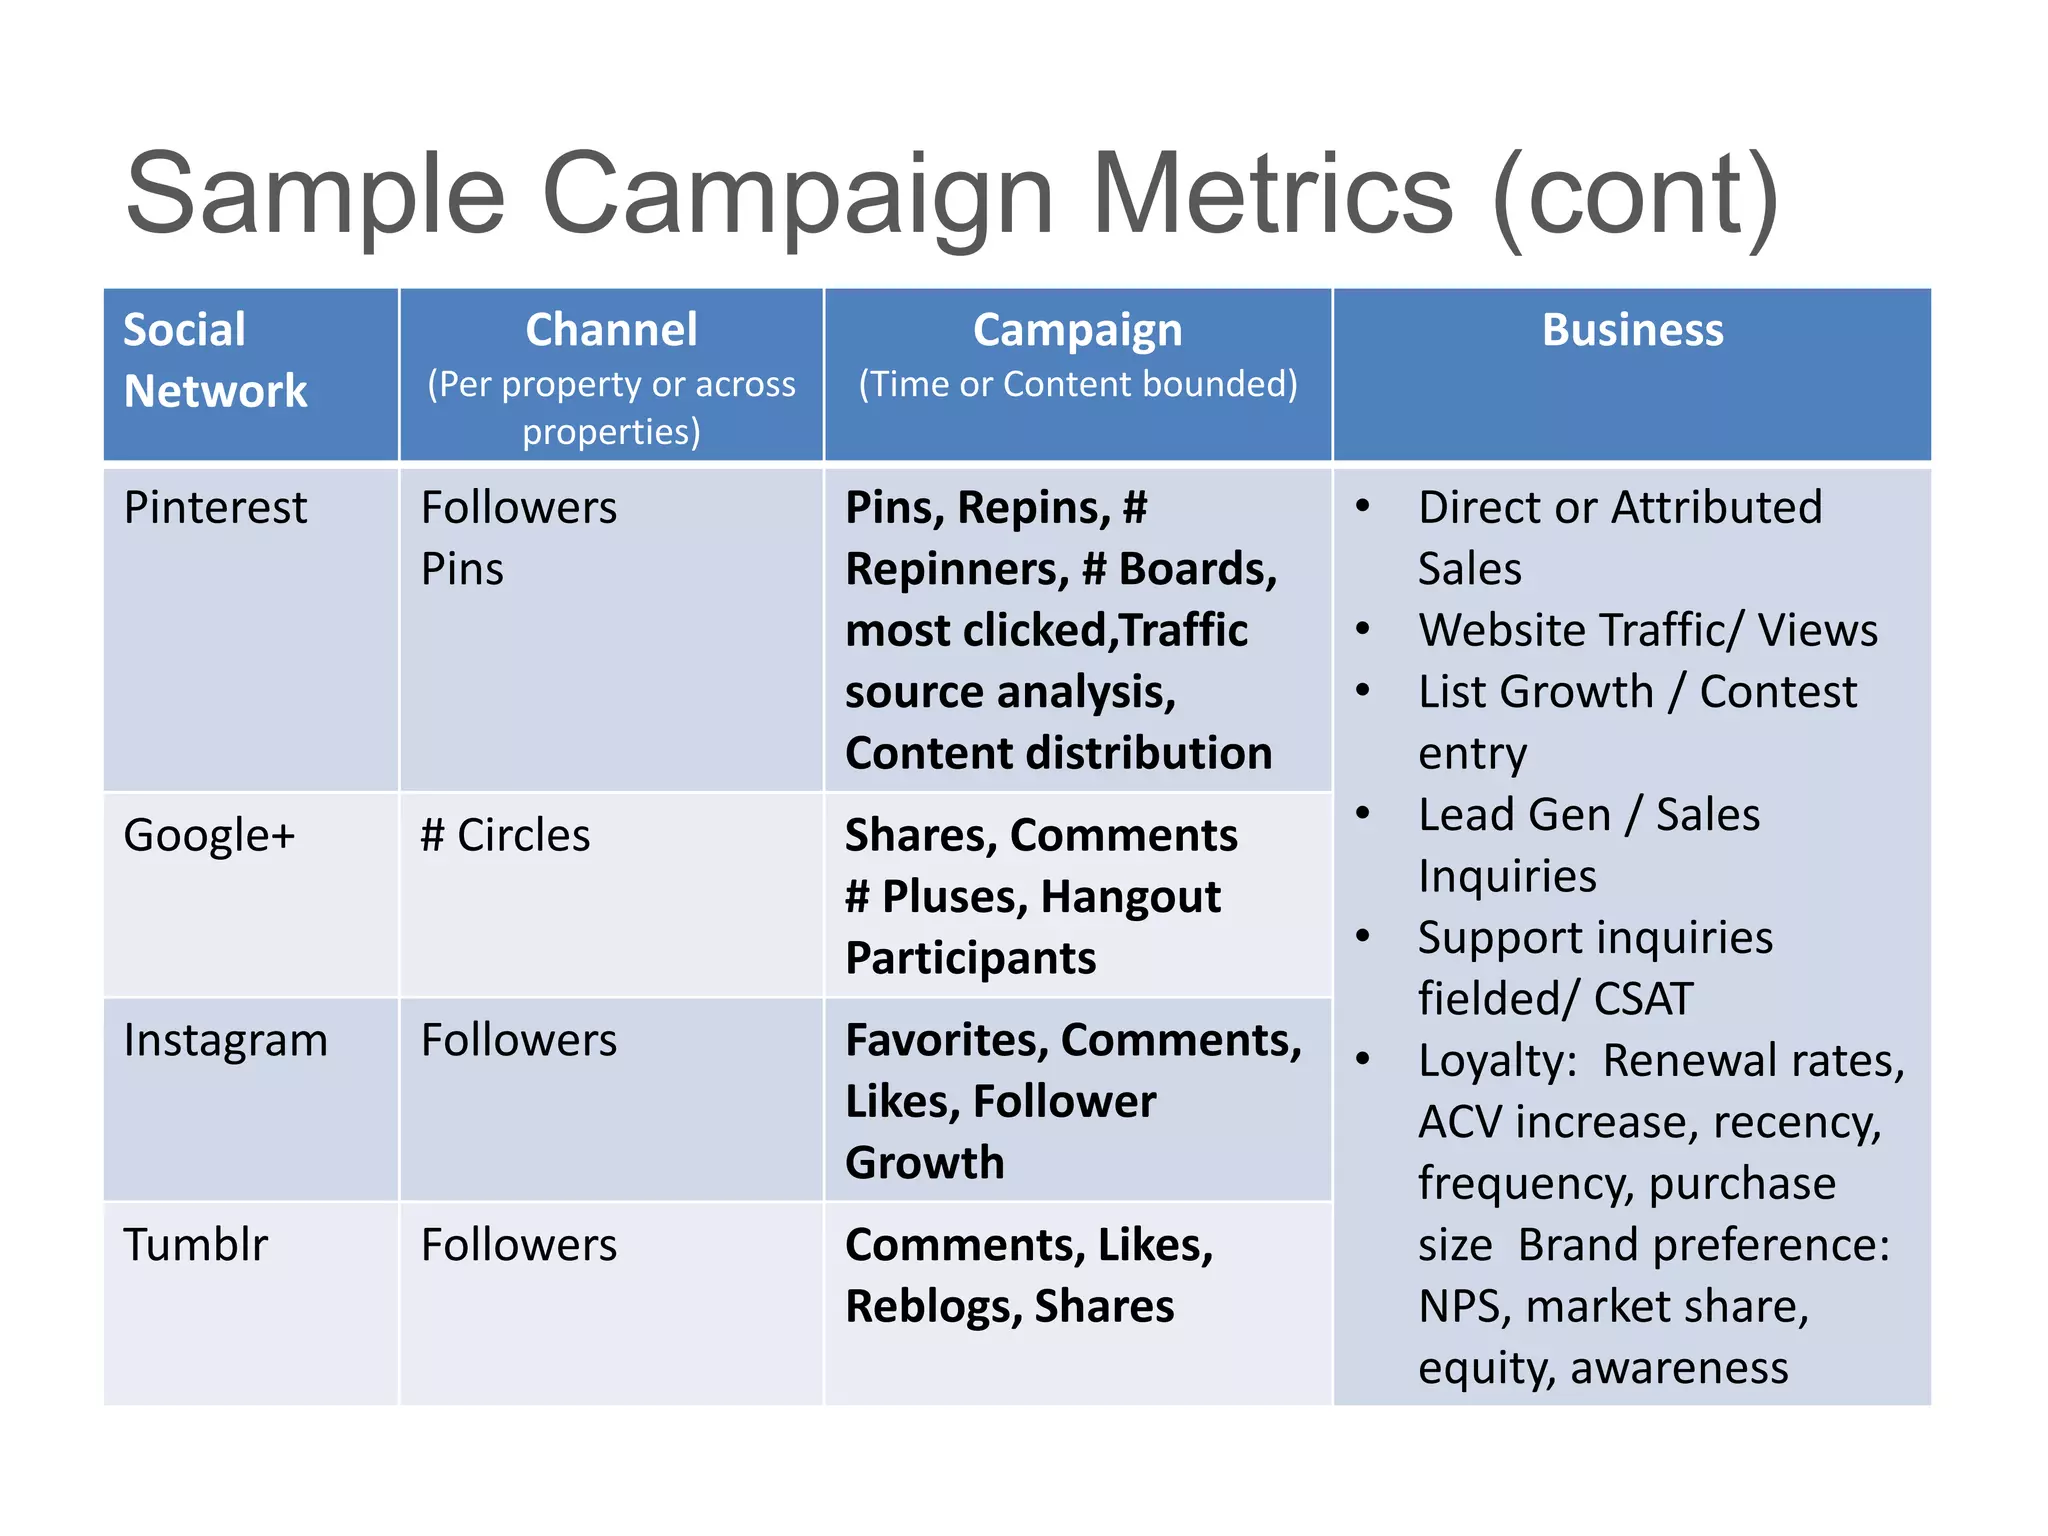
Sample Channel Metrics (cont)
Social            Channel                   Campaign                      Business
Network     (Per property or across   (Time or Content bounded)
                  properties)
Pinterest   Followers                 Pins, Repins, #             • Direct or Attributed
            Pins                      Repinners, # Boards,          Sales
                                      most clicked,Traffic        • Website Traffic/ Views
                                      source analysis,            • List Growth / Contest
                                      Content distribution          entry
Google+     # Circles                 Shares, Comments            • Lead Gen / Sales
                                      # Pluses, Hangout             Inquiries
                                      Participants                • Support inquiries
                                                                    fielded/ CSAT
Instagram   Followers                 Favorites, Comments,        • Loyalty: Renewal rates,
                                      Likes, Follower               ACV increase, recency,
                                      Growth                        frequency, purchase
Tumblr      Followers                 Comments, Likes,              size Brand preference:
                                      Reblogs, Shares               NPS, market share,
                                                                    equity, awareness
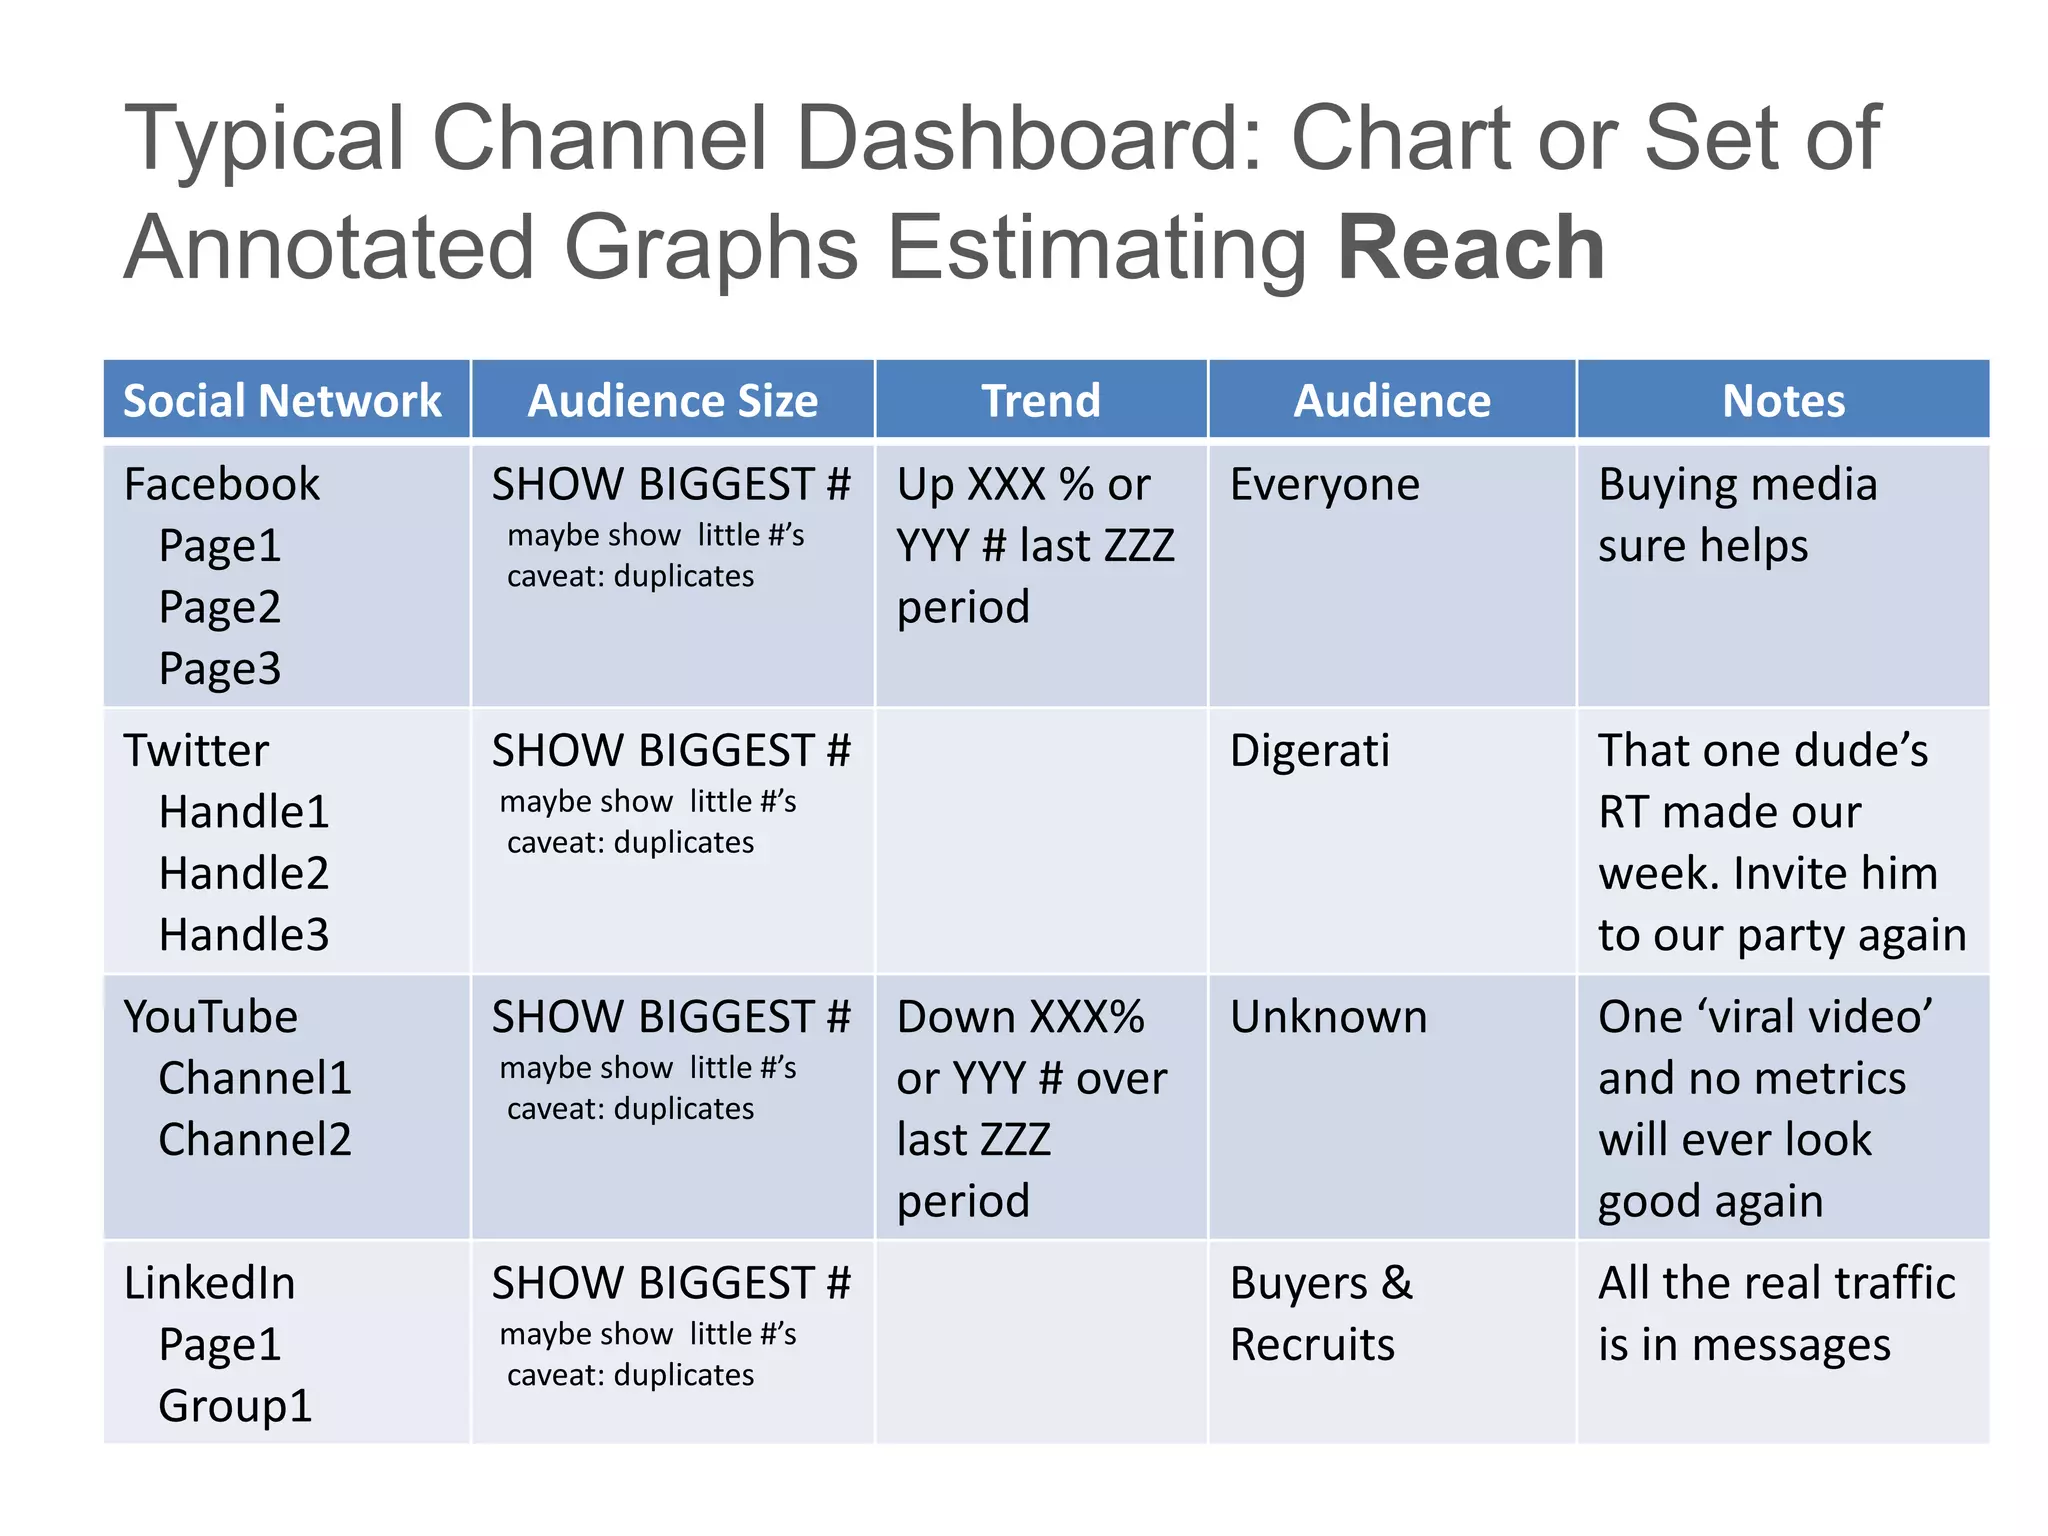
Typical Channel Dashboard: Chart or Set of
Annotated Graphs Estimating Reach
Social Network    Audience Size            Trend            Audience         Notes
Facebook         SHOW BIGGEST # Up XXX % or              Everyone      Buying media
  Page1           maybe show little #’s YYY # last ZZZ                 sure helps
                  caveat: duplicates
  Page2                                 period
  Page3
Twitter          SHOW BIGGEST #                          Digerati      That one dude’s
 Handle1         maybe show little #’s                                 RT made our
                 caveat: duplicates
 Handle2                                                               week. Invite him
 Handle3                                                               to our party again
YouTube          SHOW BIGGEST # Down XXX%                Unknown       One ‘viral video’
  Channel1       maybe show little #’s or YYY # over                   and no metrics
                  caveat: duplicates
  Channel2                             last ZZZ                        will ever look
                                       period                          good again
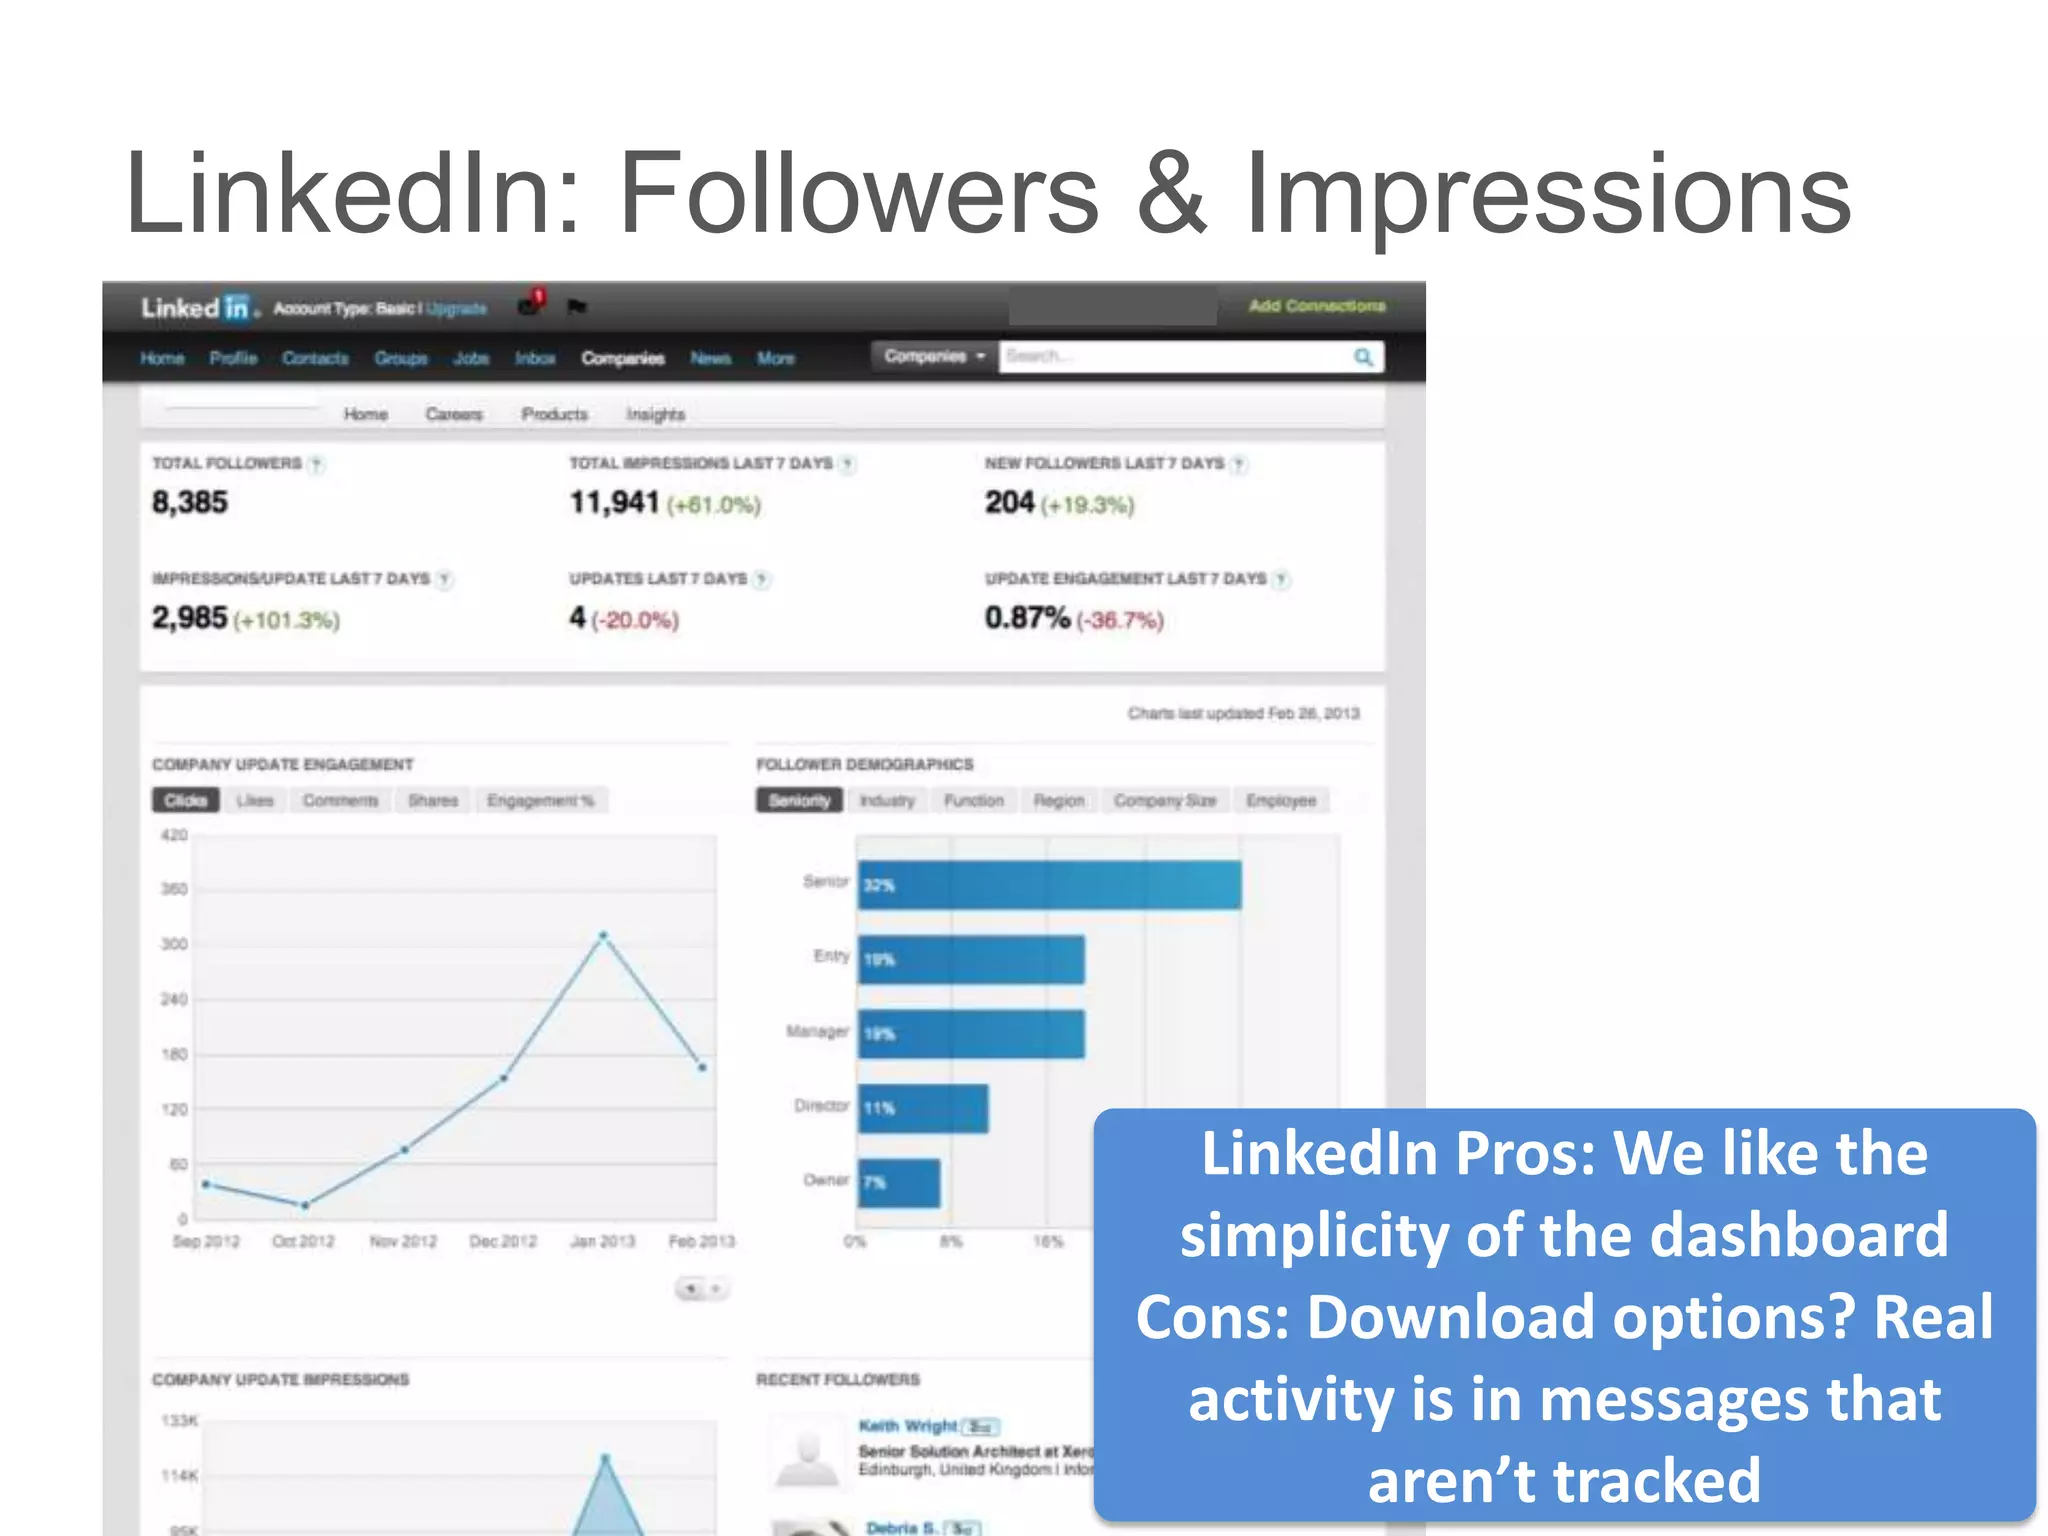
LinkedIn         SHOW BIGGEST #                          Buyers &      All the real traffic
  Page1          maybe show little #’s                   Recruits      is in messages
                 caveat: duplicates
  Group1
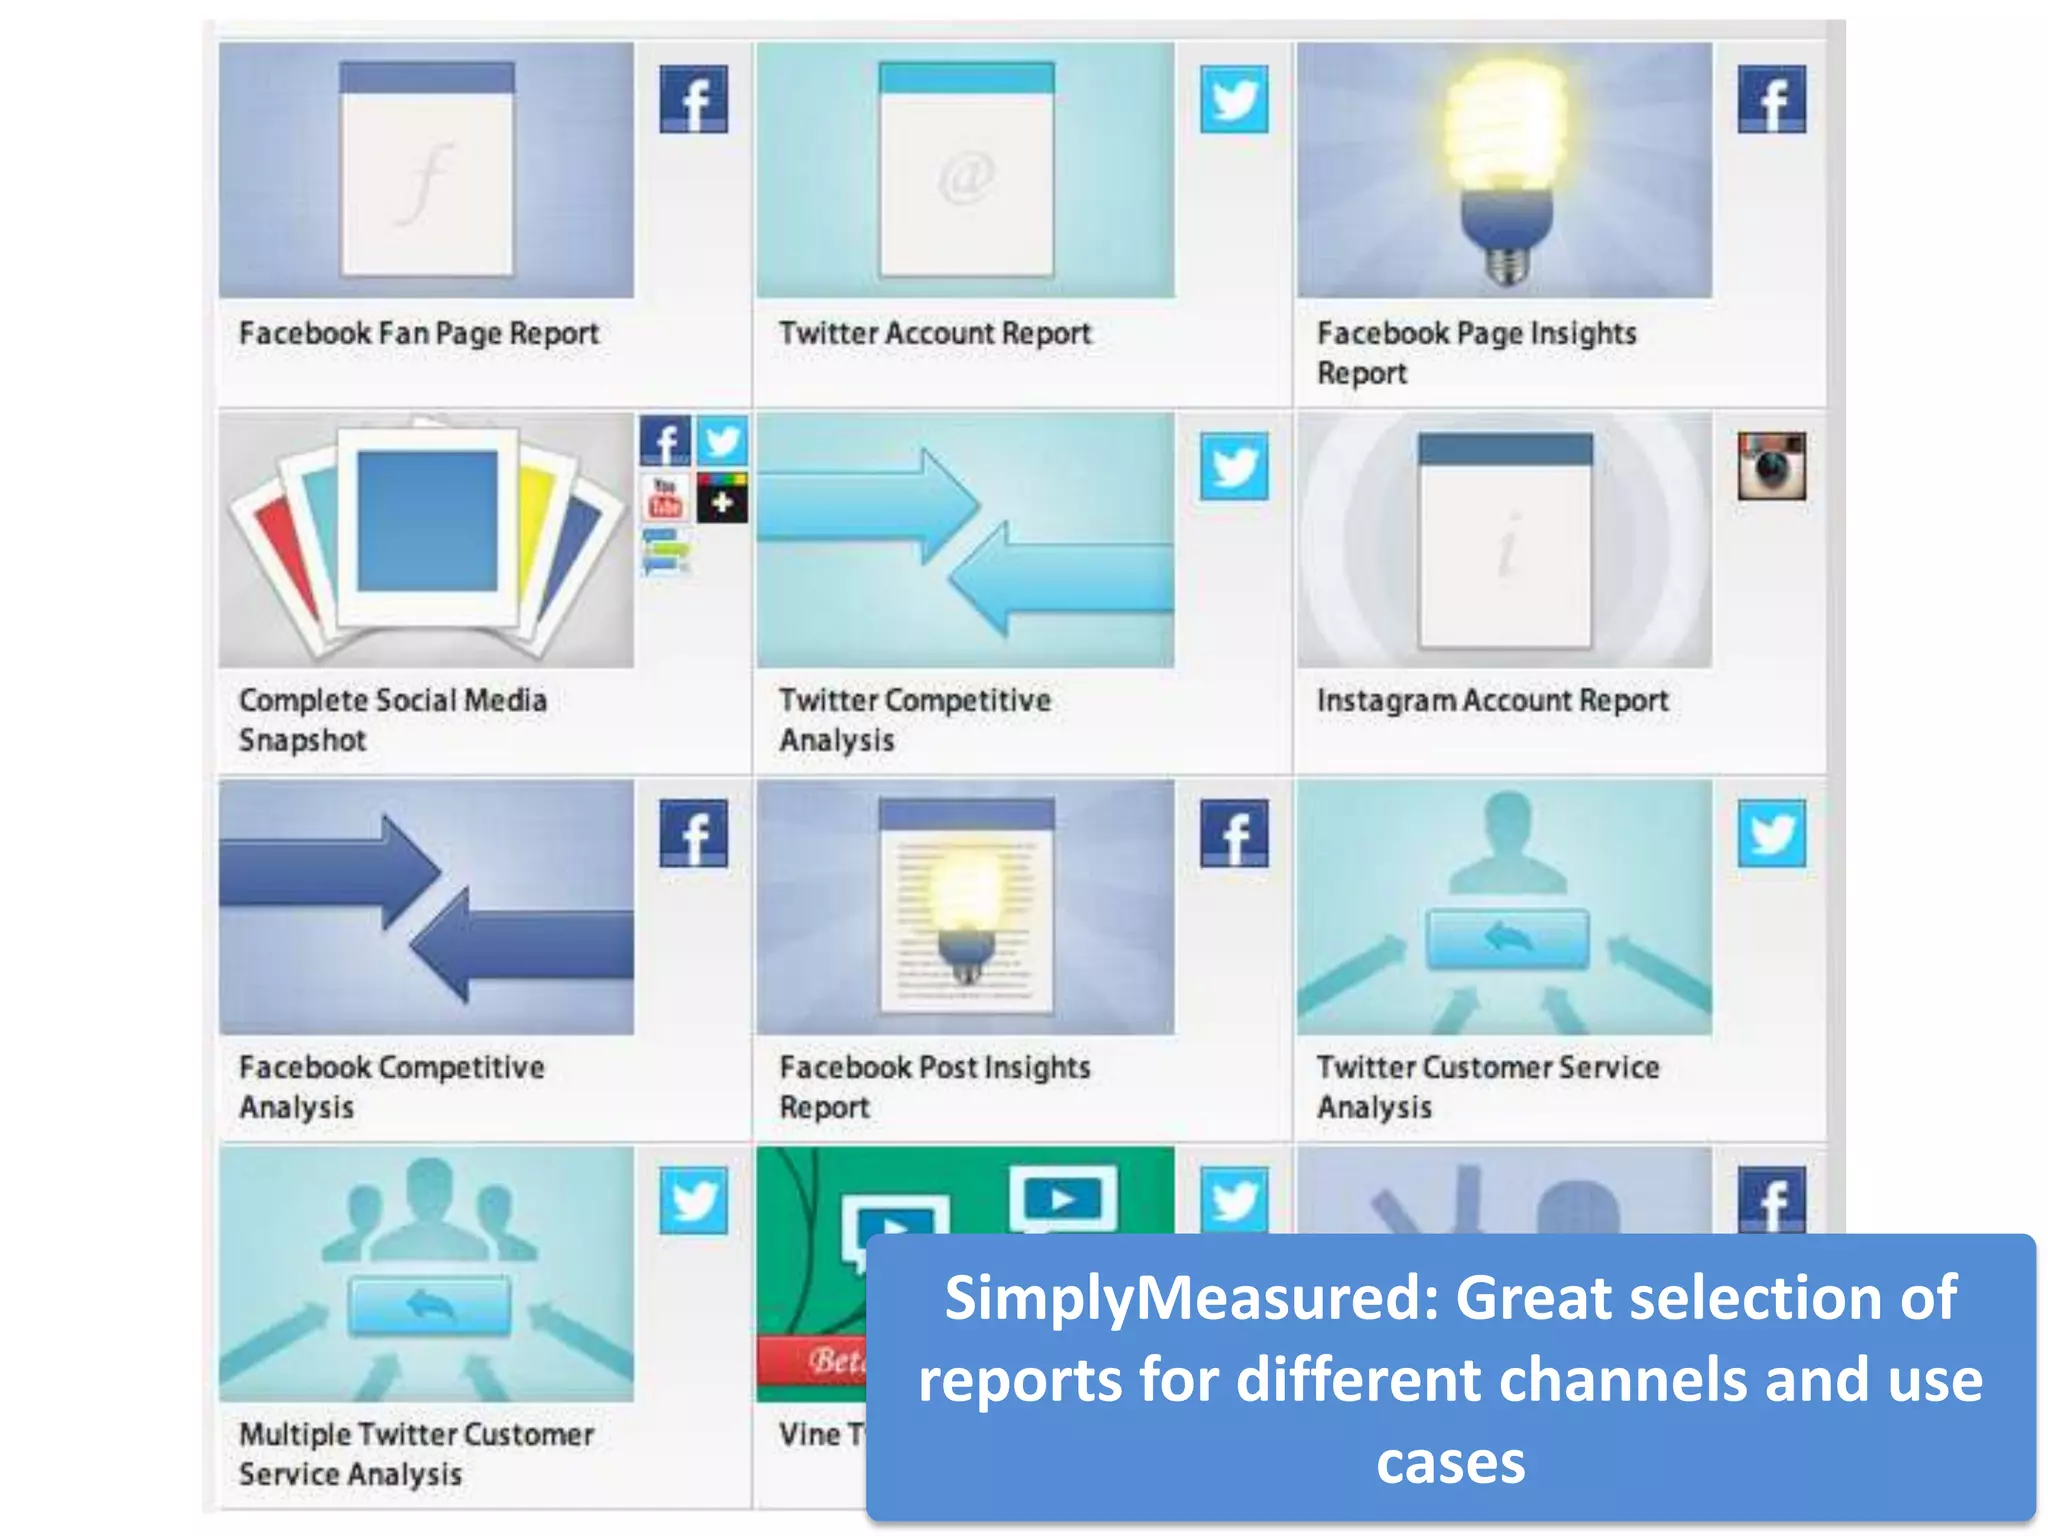
SimplyMeasured: Great selection of
reports for different channels and use
                 cases
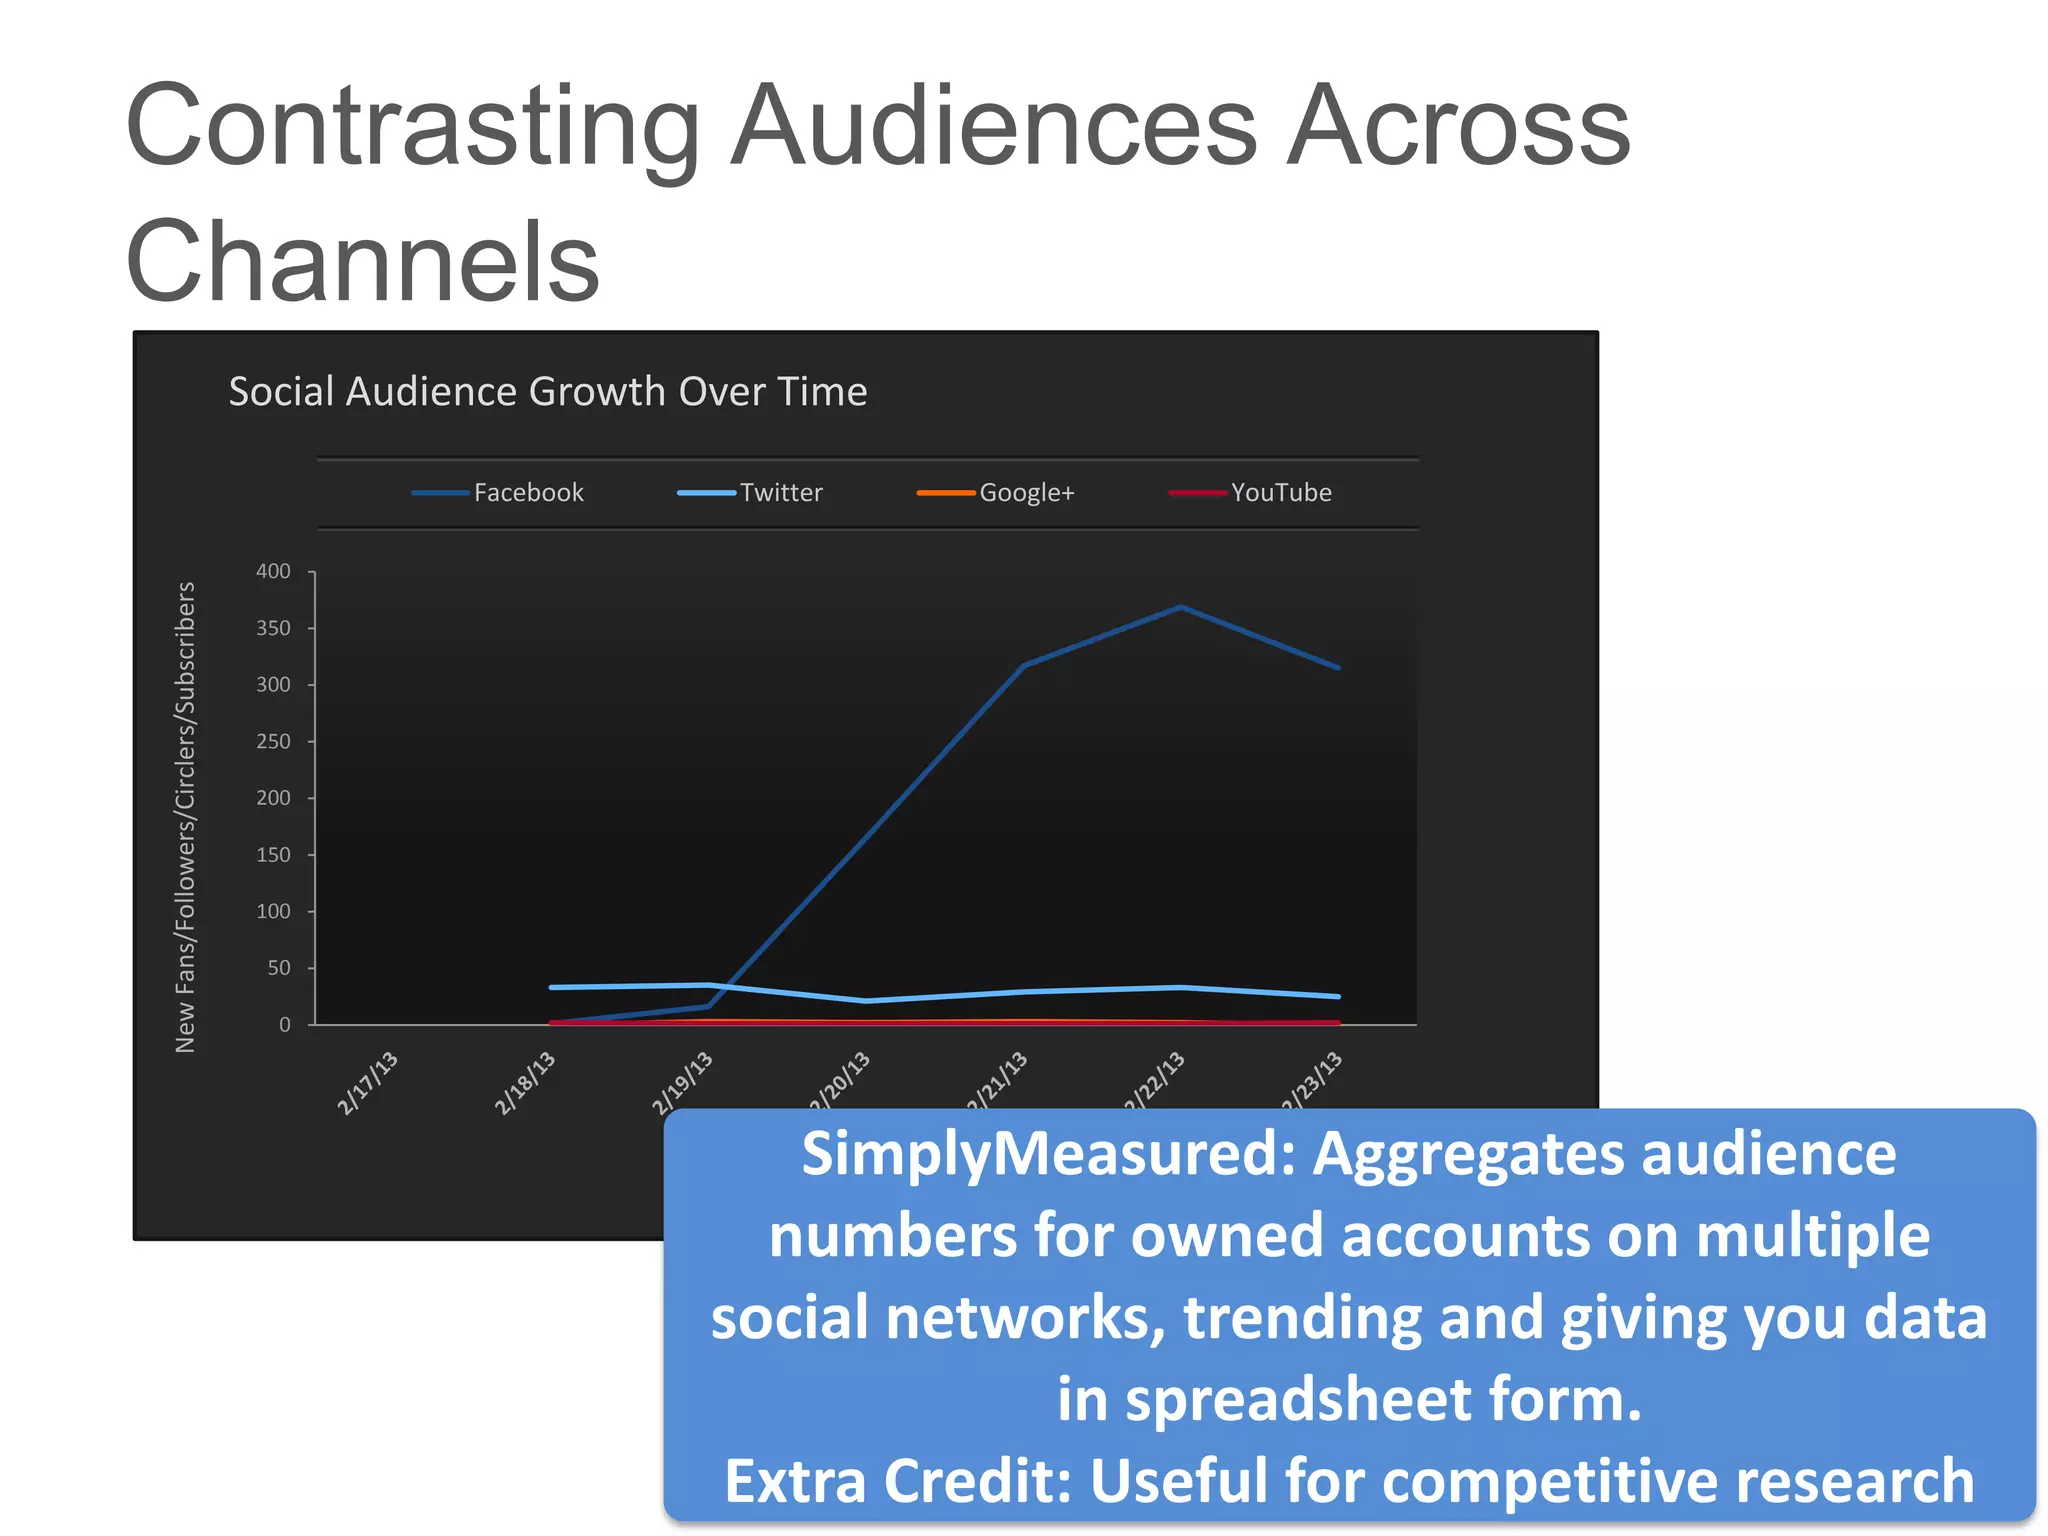
Contrasting Audiences Across
Channels
                                          Social Audience Growth Over Time

                                                      Facebook     Twitter   Google+   YouTube

                                           400
New Fans/Followers/Circlers/Subscribers


                                           350

                                           300

                                           250

                                           200

                                           150

                                           100

                                           50

                                            0


                                                                     SimplyMeasured: Aggregates audience
                                                                    numbers for owned accounts on multiple
                                                                  social networks, trending and giving you data
                                                                              in spreadsheet form.
                                                                  Extra Credit: Useful for competitive research
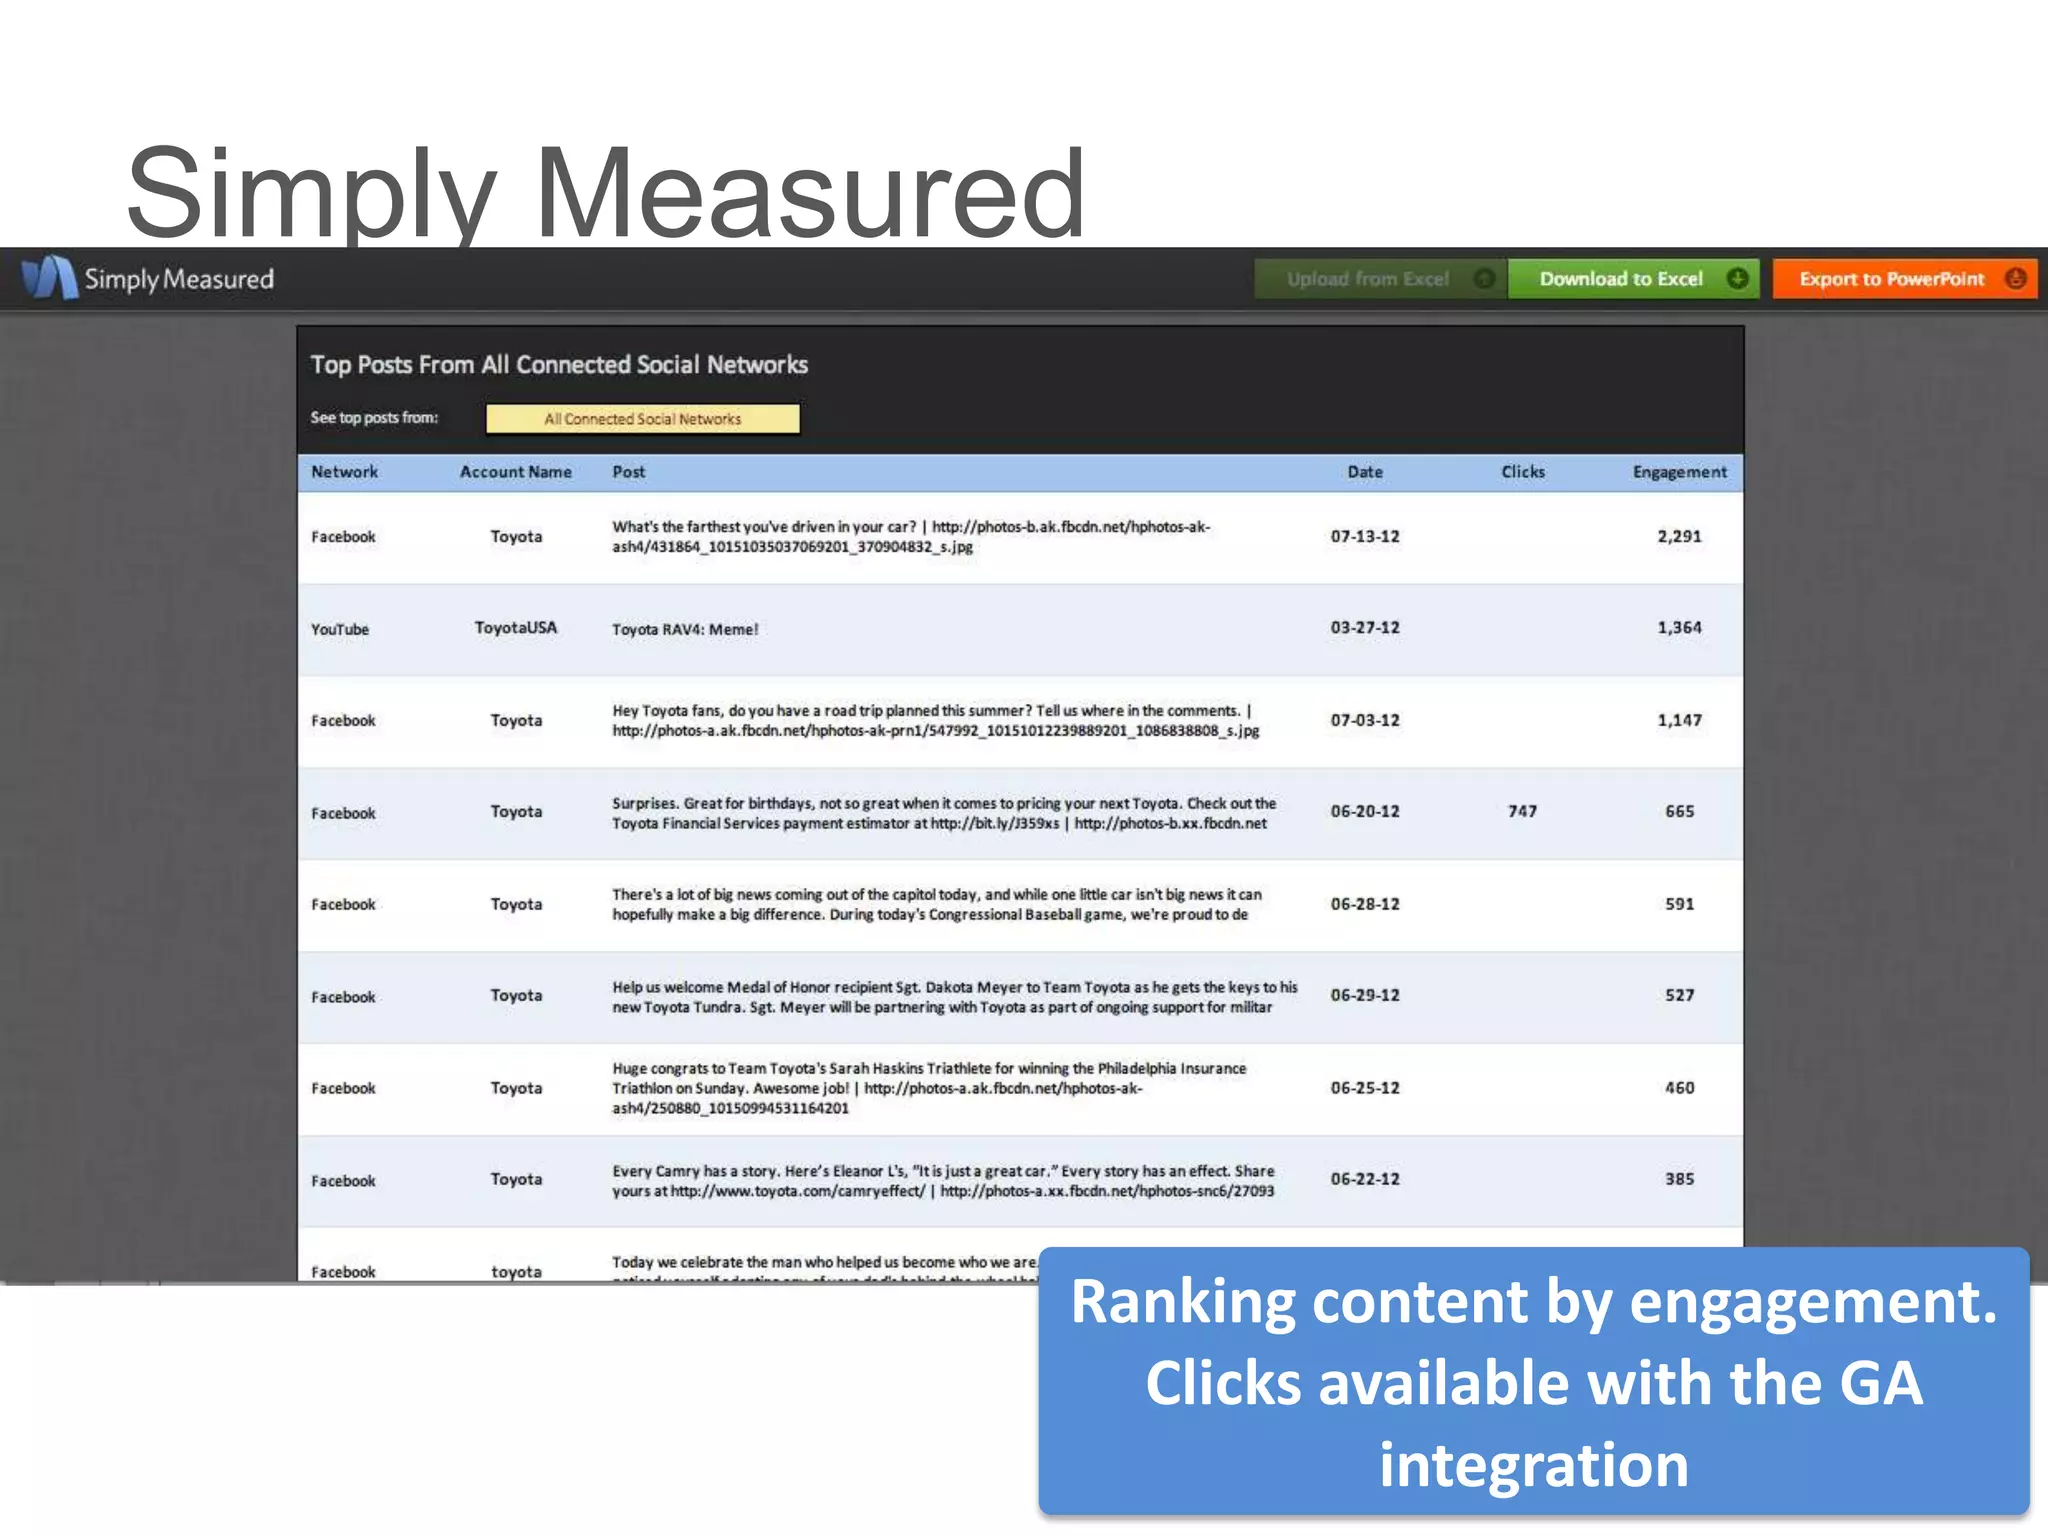
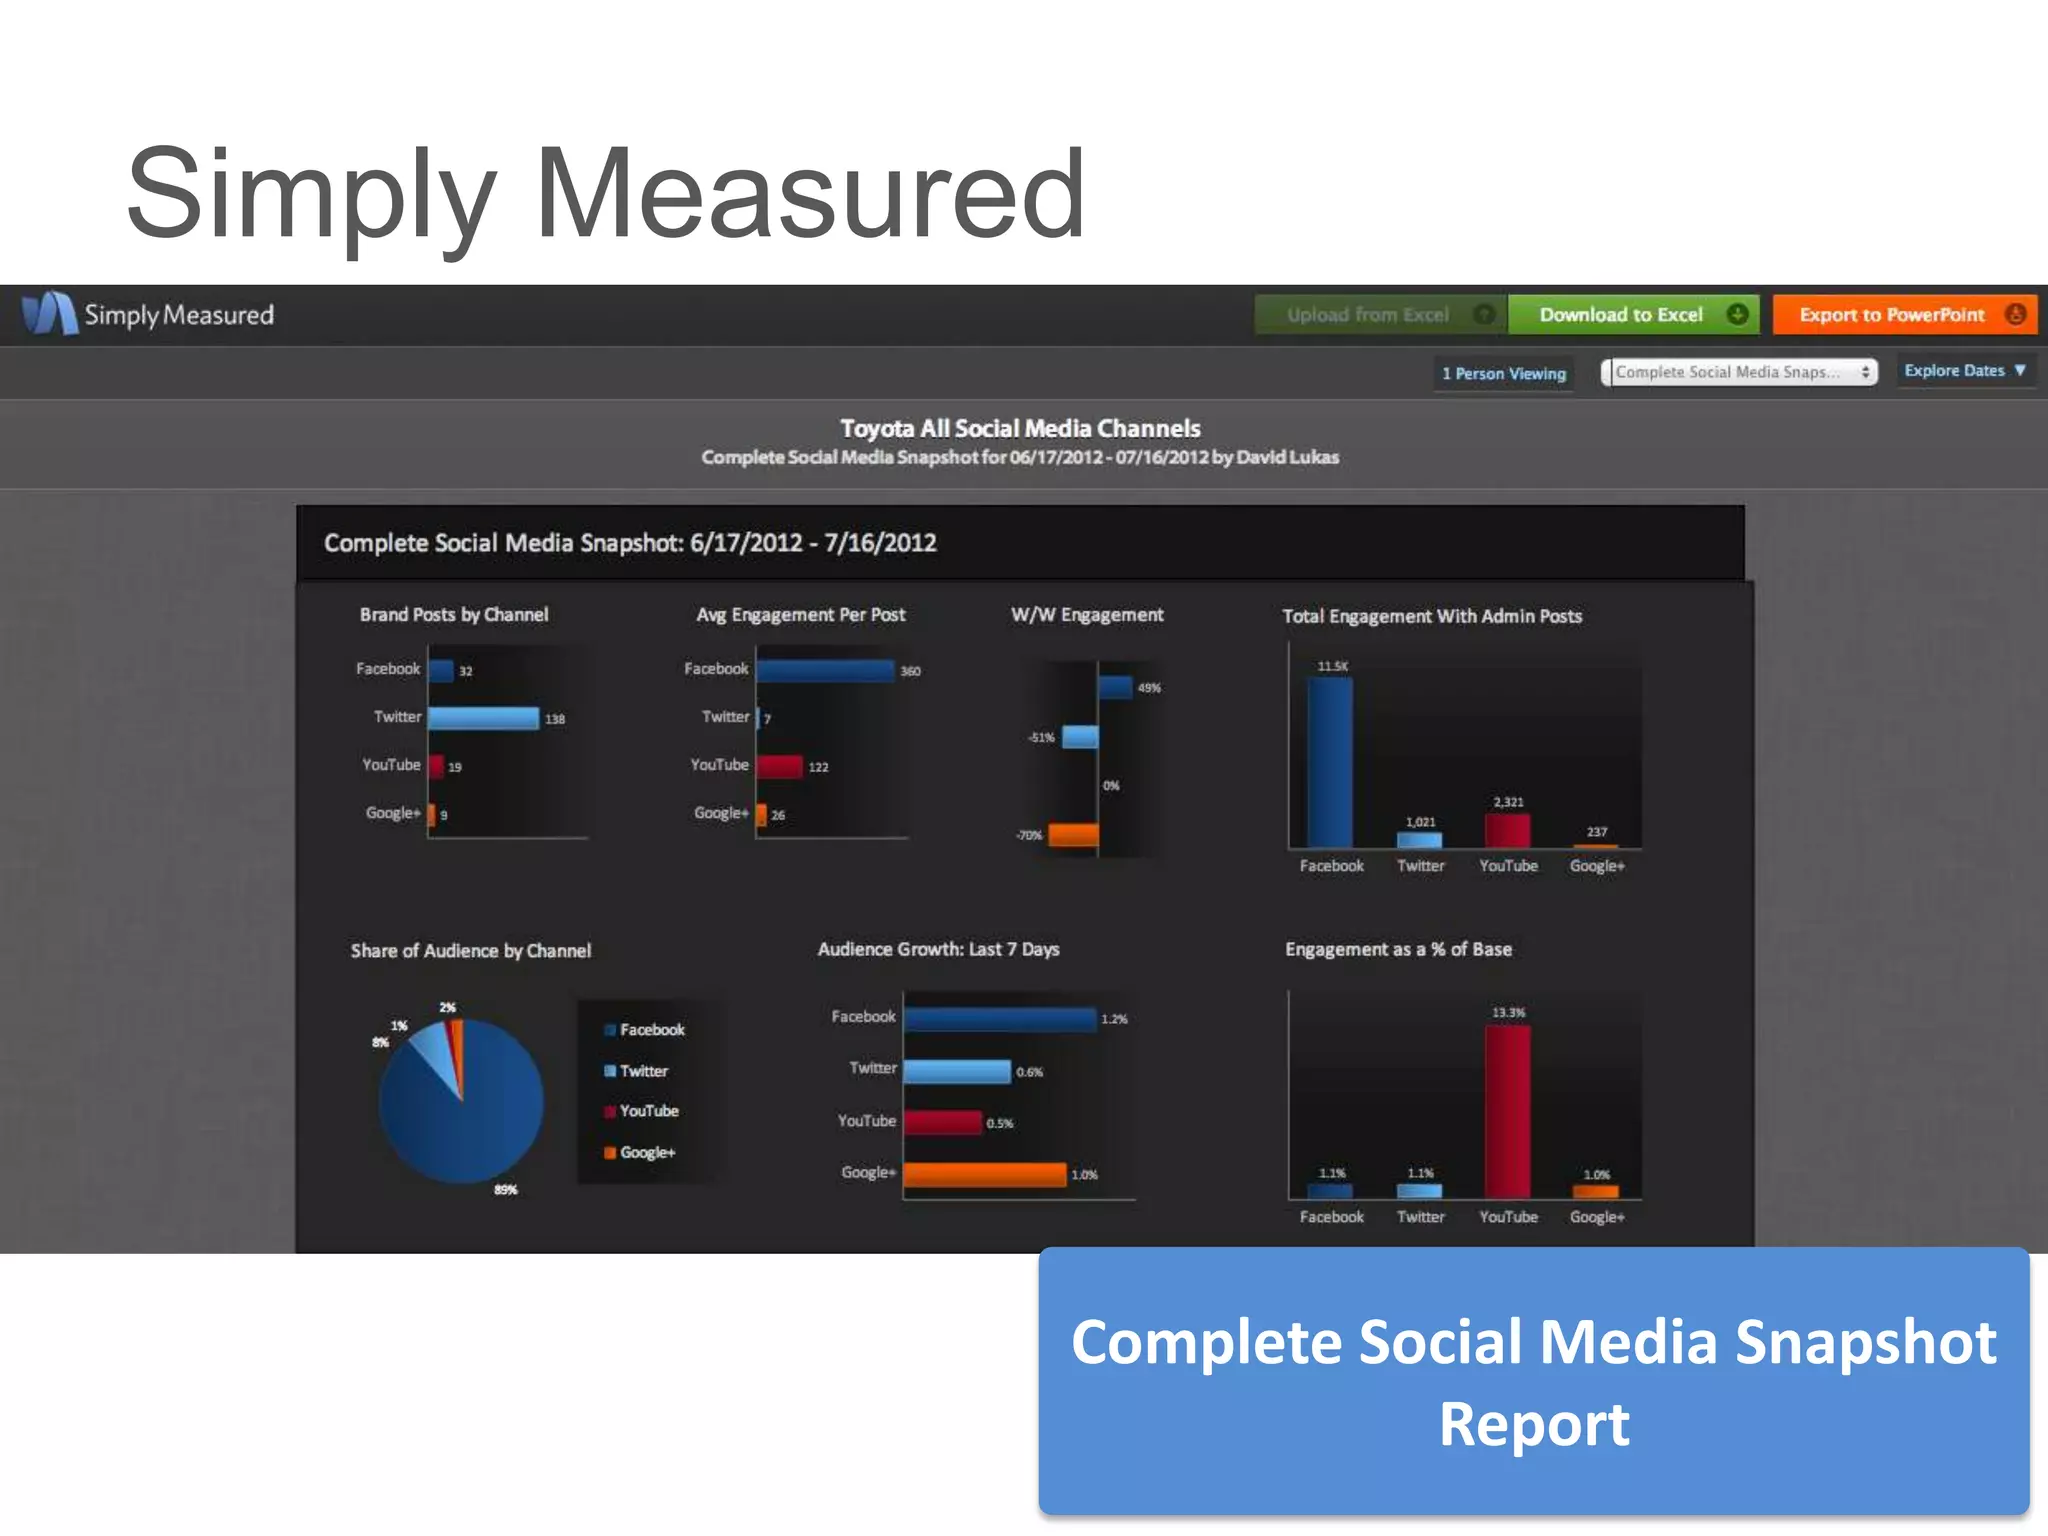
Simply Measured


              Complete Social Media Snapshot
                         Report
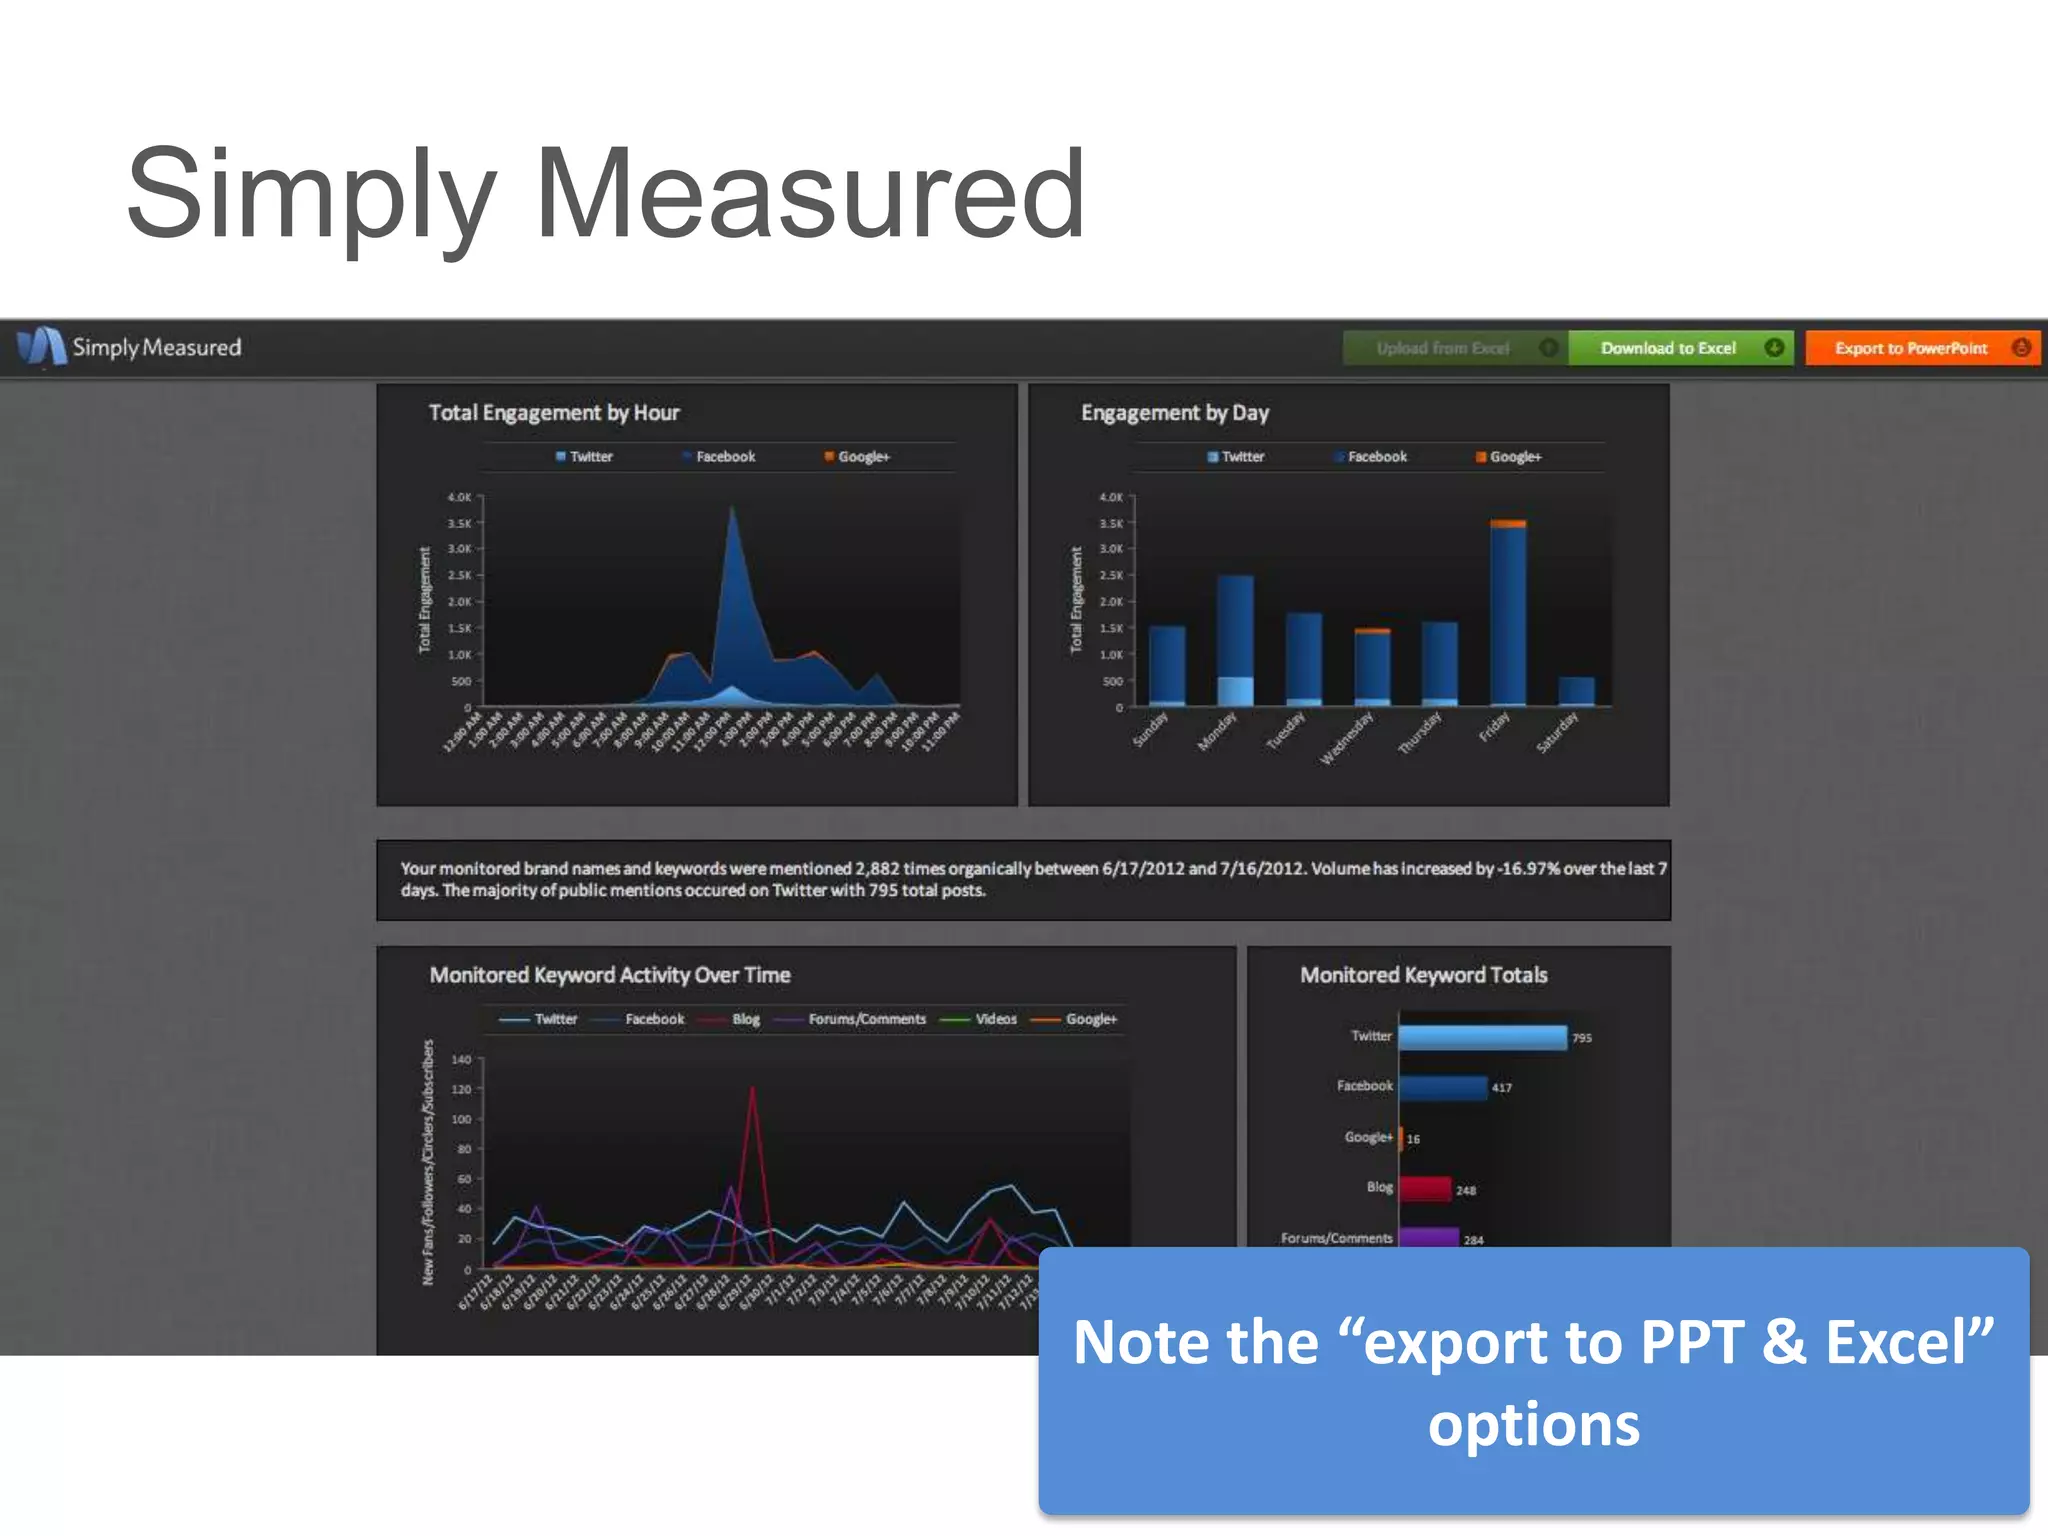
Simply Measured


              Note the “export to PPT & Excel”
                          options
Simply Measured


              Ranking content by engagement.
                Clicks available with the GA
                         integration