Downloaded 11 times


![Library of Congress Cataloging-in-Publication Data
Smith, Denise L.
Advanced cardiovascular exercise physiology / Denise L. Smith and Bo Fernhall.
p. ; cm. -- (Advanced exercise physiology series)
Includes bibliographical references and index.
ISBN-13: 978-0-7360-7392-9 (hard cover)
ISBN-10: 0-7360-7392-2 (hard cover)
1. Cardiovascular system--Physiology 2. Exercise--Physiological aspects. I.
Fernhall, Bo. II. Title. III. Series: Advanced exercise physiology series.
[DNLM: 1. Exercise--physiology. 2. Cardiovascular Physiological Phenomena. 3.
Cardiovascular System--anatomy & histology. 4. Resistance Training. WE 103]
QP114.E9S65 2011
612.1--dc22
2010032221
ISBN-10: 0-7360-7392-2 (print)
ISBN-13: 978-0-7360-7392-9 (print)
Copyright © 2011 by Denise L. Smith and Bo Fernhall
All rights reserved. Except for use in a review, the reproduction or utilization of this work in any
form or by any electronic, mechanical, or other means, now known or hereafter invented, including
xerography, photocopying, and recording, and in any information storage and retrieval system, is
forbidden without the written permission of the publisher.
The Web addresses cited in this text were current as of May 2010, unless otherwise noted.
Acquisitions Editors: Michael S. Bahrke, PhD, and Amy N. Tocco; Developmental Editor: Kevin
Matz; Assistant Editors: Melissa J. Zavala and Brendan Shea; Copyeditor: Joyce Sexton; Indexer:
Betty Frizzell; Permission Manager: Dalene Reeder; Graphic Designer: Joe Buck; Graphic Artist:
Denise Lowry; Cover Designer: Keith Blomberg; Photographs (interior): © Denise L. Smith and Bo
Fernhall, unless otherwise noted.; Photo Production Manager: Jason Allen; Art Manager: Kelly
Hendren; Associate Art Manager: Alan L. Wilborn; Printer: Thomson-Shore, Inc.
Printed in the United States of America 10 9 8 7 6 5 4 3 2 1
The paper in this book is certified under a sustainable forestry program.
Human Kinetics
Web site: www.HumanKinetics.com
United States: Human Kinetics, P.O. Box 5076, Champaign, IL 61825-5076
800-747-4457
e-mail: humank@hkusa.com
Canada: Human Kinetics, 475 Devonshire Road Unit 100, Windsor, ON N8Y 2L5
800-465-7301 (in Canada only)
e-mail: info@hkcanada.com
Europe: Human Kinetics, 107 Bradford Road, Stanningley, Leeds LS28 6AT, United Kingdom
+44 (0) 113 255 5665
e-mail: hk@hkeurope.com
Australia: Human Kinetics, 57A Price Avenue, Lower Mitcham, South Australia 5062
08 8372 0999
e-mail: info@hkaustralia.com
New Zealand: Human Kinetics, P.O. Box 80, Torrens Park, South Australia 5062
0800 222 062
e-mail: info@hknewzealand.com
E4414](https://image.slidesharecdn.com/advancedcardiovascularexercites-220106230013/75/Advanced-cardiovascular-exercites-4-2048.jpg)


![The Heart as a Pump 17
decrease as blood in the ventricles is ejected from the heart. Systolic function is the
general term given to the ability of the heart to adequately produce the force needed
to eject blood from the ventricle. We can calculate the amount of blood ejected from
each ventricle, called stroke volume (SV), by subtracting the amount of blood that
is in the ventricles after contraction (end-systolic volume, ESV) from the volume of
blood that filled the ventricles at the end of ventricular filling (end-diastolic volume,
EDV). That is,
SV (ml) = EDV (ml) − ESV (ml).
The percentage of blood ejected from the ventricle is called the ejection fraction
(EF) and is calculated as
EF (%) = [SV (ml) / EDV (ml)] 3 100.
Isovolumetric Relaxation Period
As the ventricles relax (following the T wave on the ECG), ventricular pressure quickly
decreases. Once pressure in the ventricles is less than pressure in the aorta, the semi-
lunar valves close. At this point, the AV valves are also closed. Because the ventricles
are relaxing and there is no change in ventricular volume, this period is aptly named
the isovolumetric relaxation period. This, however, is a brief period; as soon as the
pressure in the atria exceeds the pressure in the ventricles, the AV valves are forced
open, and blood begins to fill the ventricles. This starts the ventricular filling period
and the cycle repeats—approximately 75 times per minute at rest!
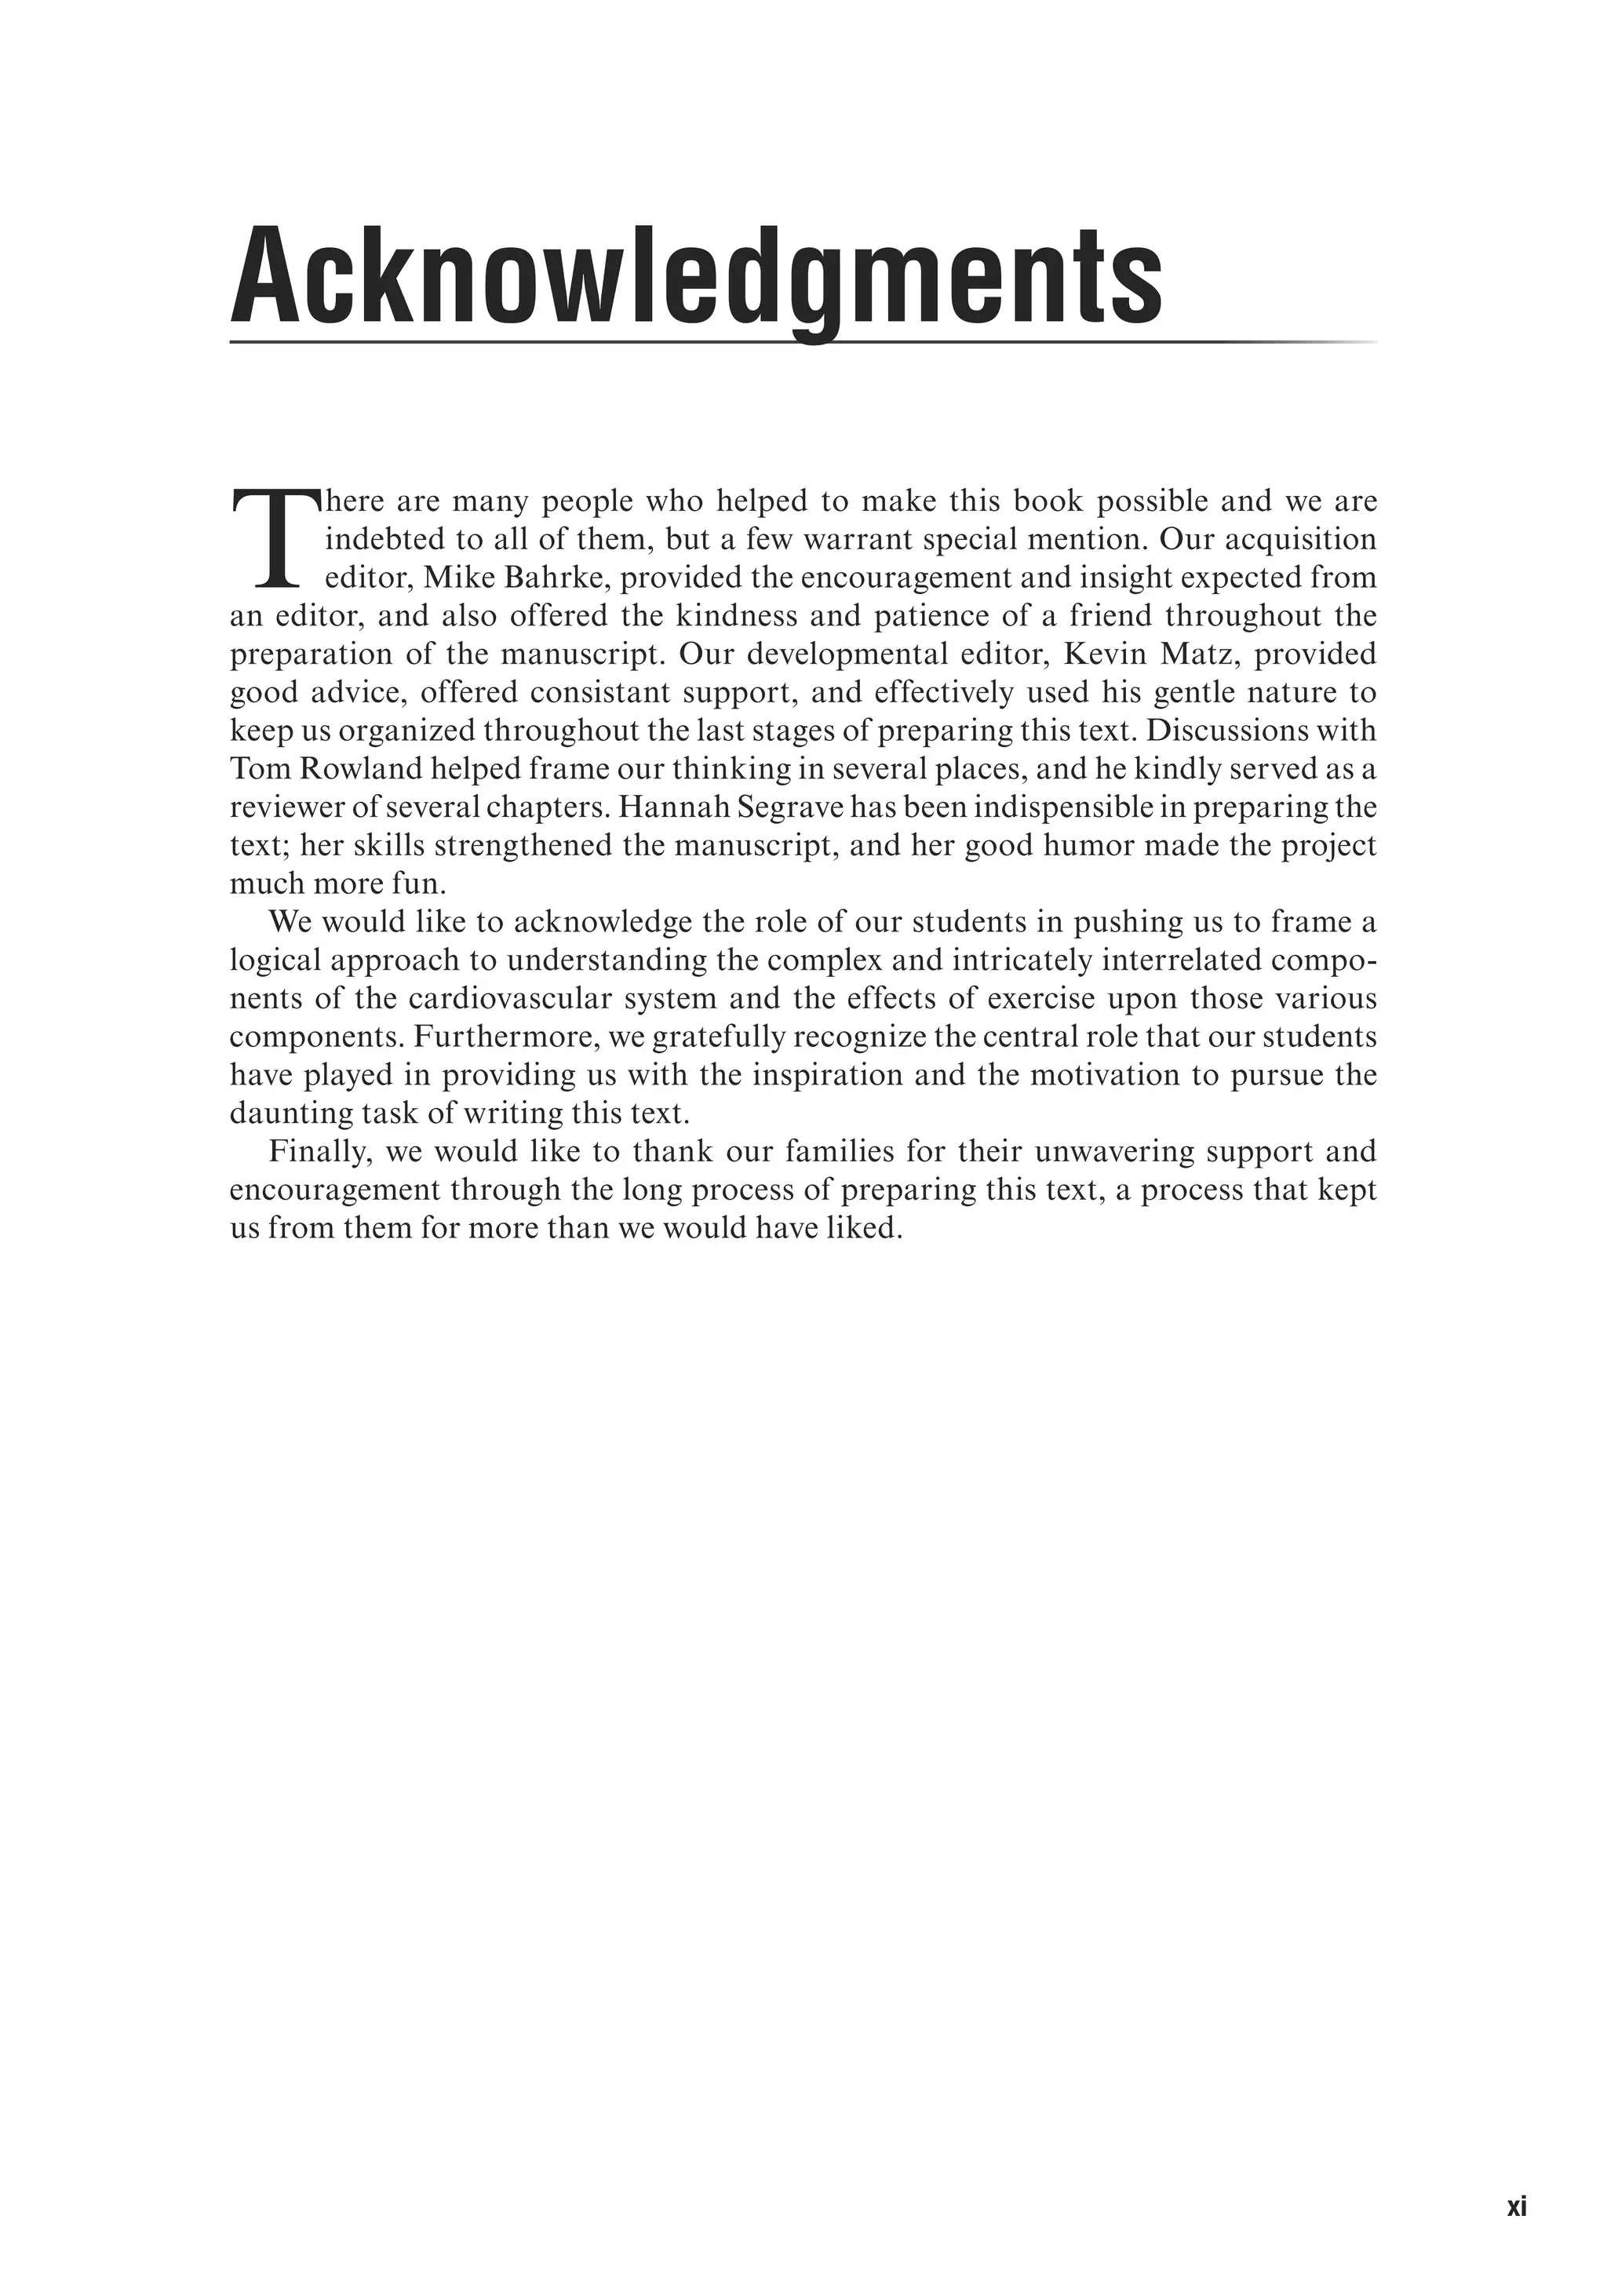
The Ventricular Pressure–Volume Loop
The relationship between ventricular pressure and volume throughout the cardiac
cycle can be represented in the pressure–volume loop (figure 2.4). This graph presents
volume of blood in the ventricles on the x-axis and left ventricular pressure on the
y-axis. The four periods of the cardiac cycle each represent one side of the closed loop
E4414/Smith/fig2.4a/349903/alw/r1
Ventricular
pressure
(mmHg)
100
0
Ventricular volume (ml)
a
d
b
c
4
1
2
3
ESV EDV
SV =
EDV-ESV
Figure 2.4 Pressure–volume loop of left ventricle (a) at rest and (b) during aerobic exercise.
E4414/Smith/fig2.4b/349904/alw/r4
Ventricular
pressure
(mmHg)
100
0
Ventricular volume (ml)
a
d
b
c
4
1
2
3
b
a b](https://image.slidesharecdn.com/advancedcardiovascularexercites-220106230013/75/Advanced-cardiovascular-exercites-31-2048.jpg)

![The Heart as a Pump 19
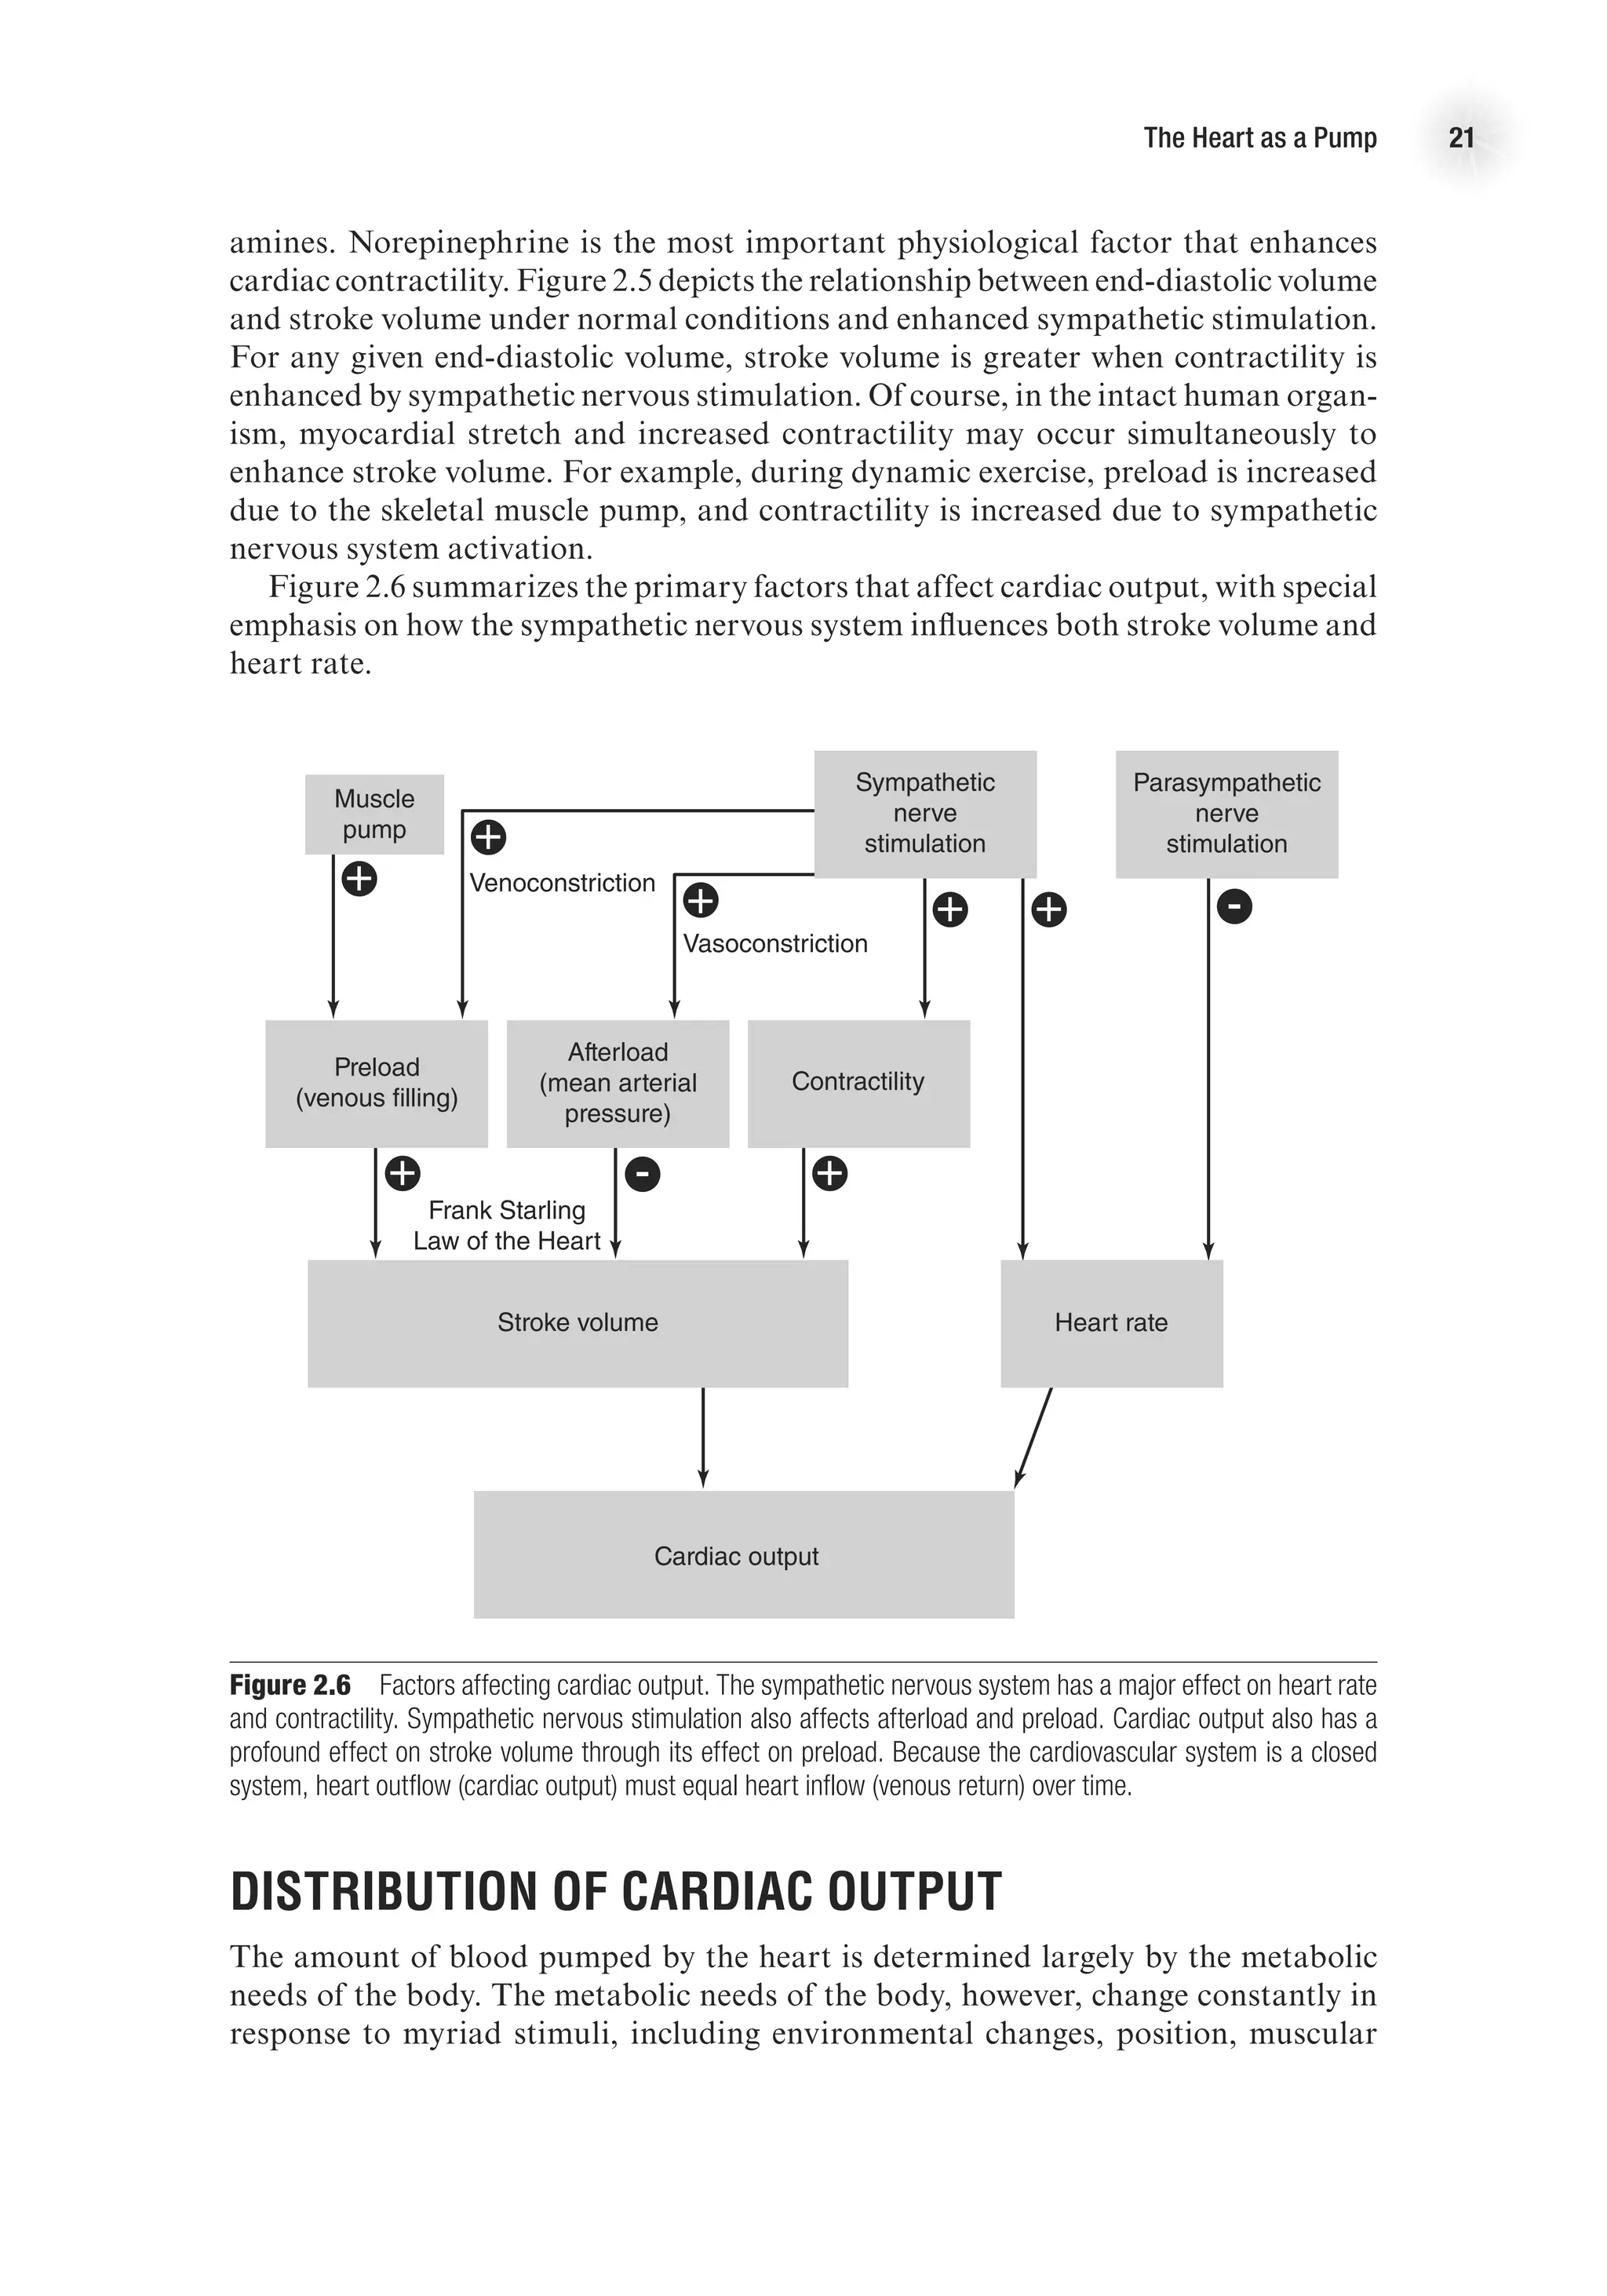
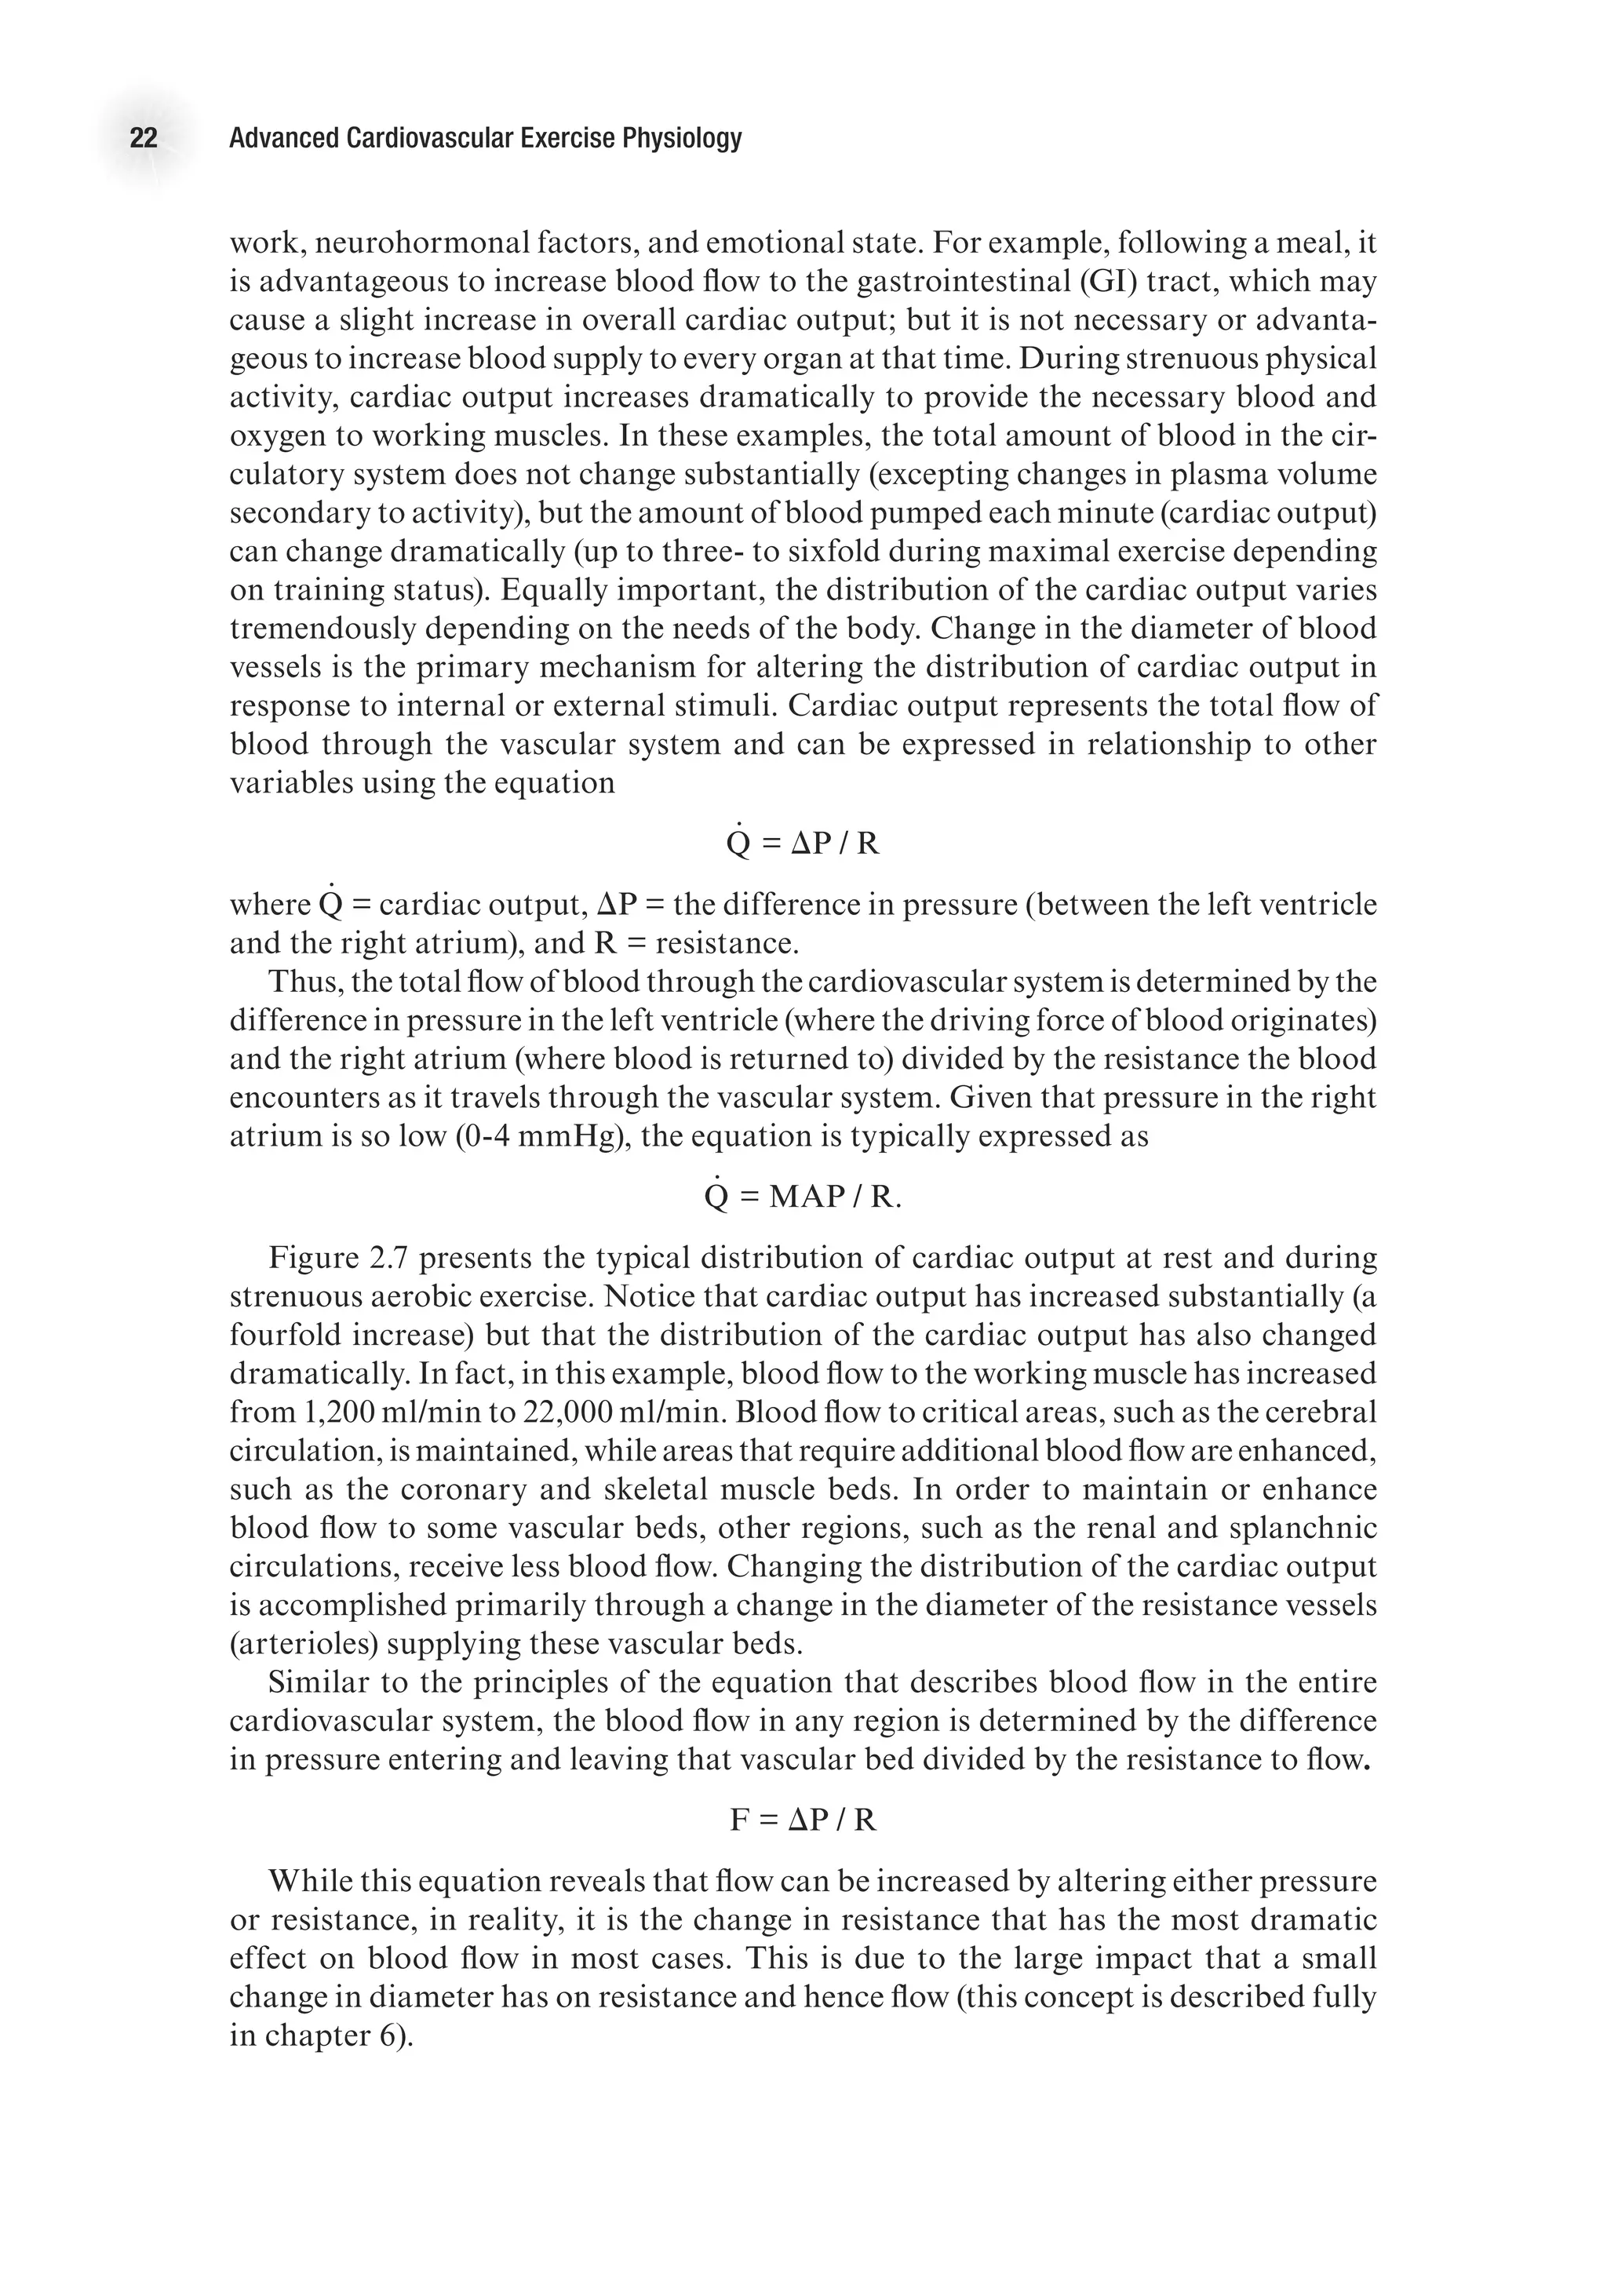
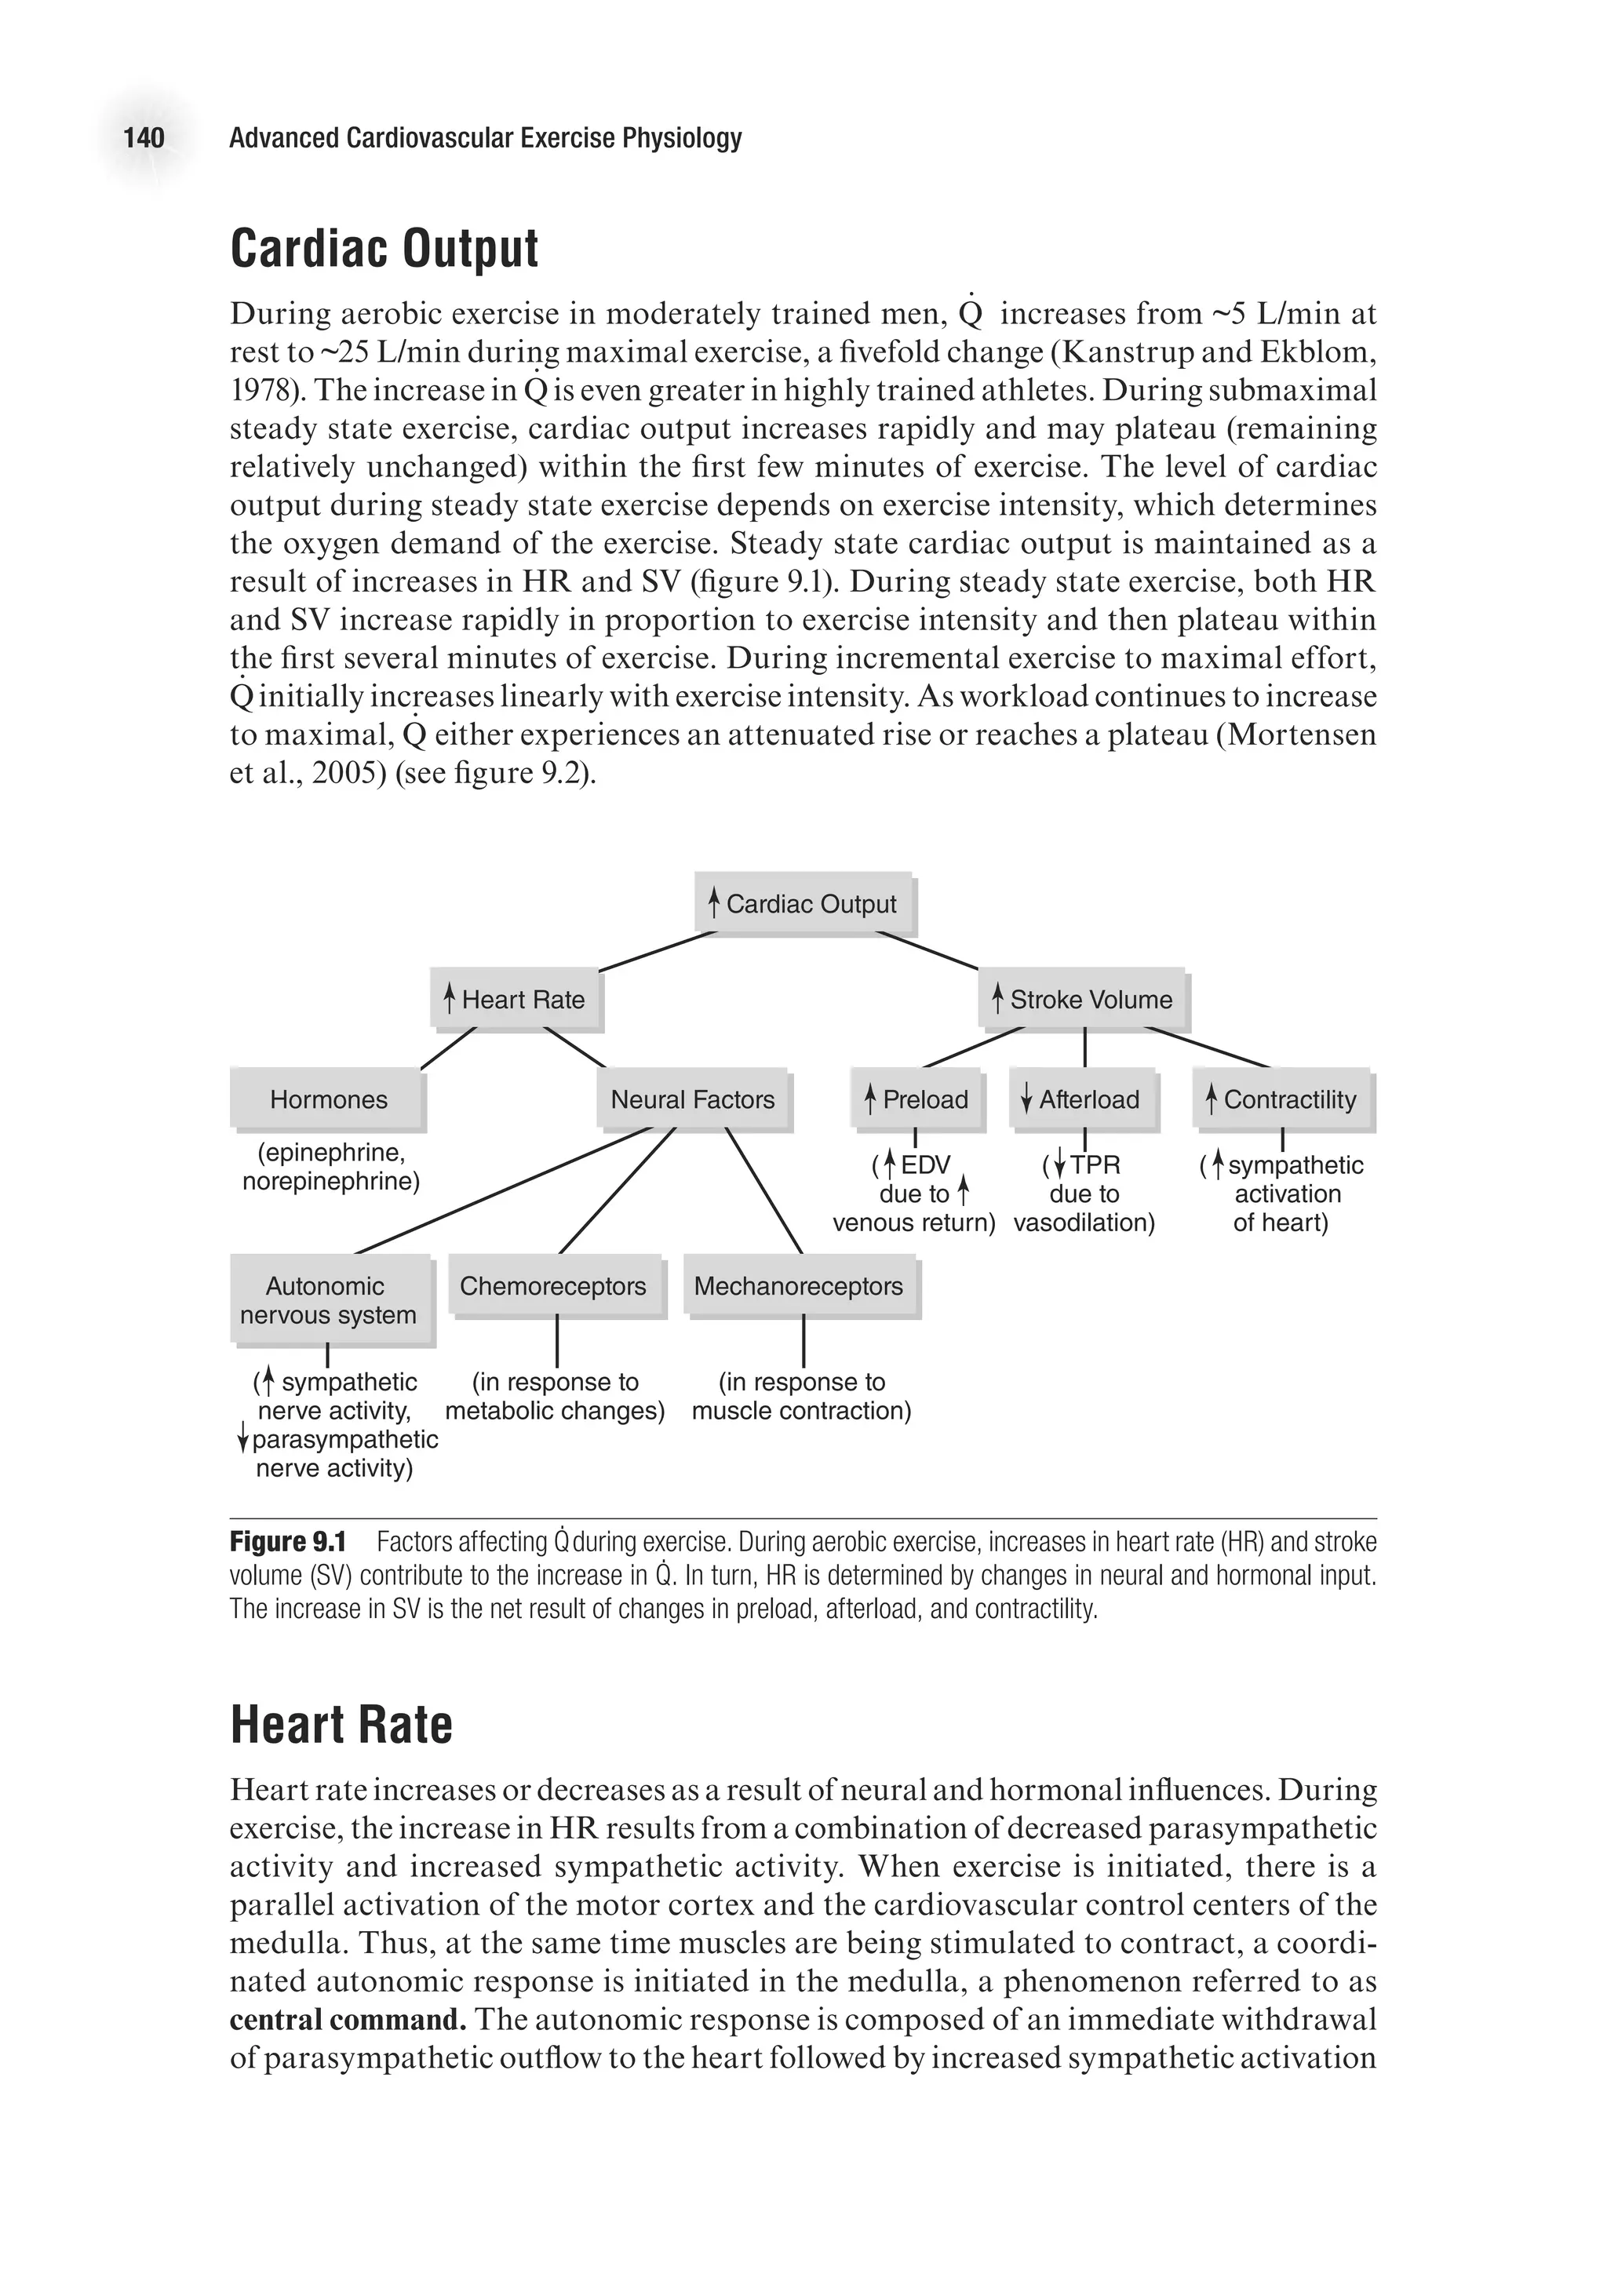
needs of the body. For instance, during strenuous physical activity, cardiac output
may increase more than fivefold to meet the needs of the skeletal muscle for increased
blood flow. Cardiac output (Q
.
) is the product of stroke volume (the amount of blood
pumped by each ventricle with each beat) and heart rate (the number of times the
heart beats per minute), that is,
Q
.
(L/min) = HR (beats/min) 3 SV (ml/beat).
In order for cardiac output to adjust to the metabolic demands of the body, there
must be a change in one or both of these variables.
Heart Rate
Factors affecting heart rate do so by changing the depolarization and repolarization
characteristics of the pacemaker cells of the conduction system (see chapter 4 for
full discussion). Heart rate is affected primarily by autonomic nervous stimulation:
Sympathetic nervous stimulation increases heart rate (positive chronotropic effect),
whereas parasympathetic stimulation decreases heart rate (negative chronotropic
effect). Neural influences have immediate effects on heart rate and therefore can cause
very rapid adjustments in cardiac output.
Stroke Volume
Stroke volume is the amount of blood ejected from each ventricle with each beat of
the heart. It is determined by three primary factors:
1. Preload
2. Afterload
3. Contractility
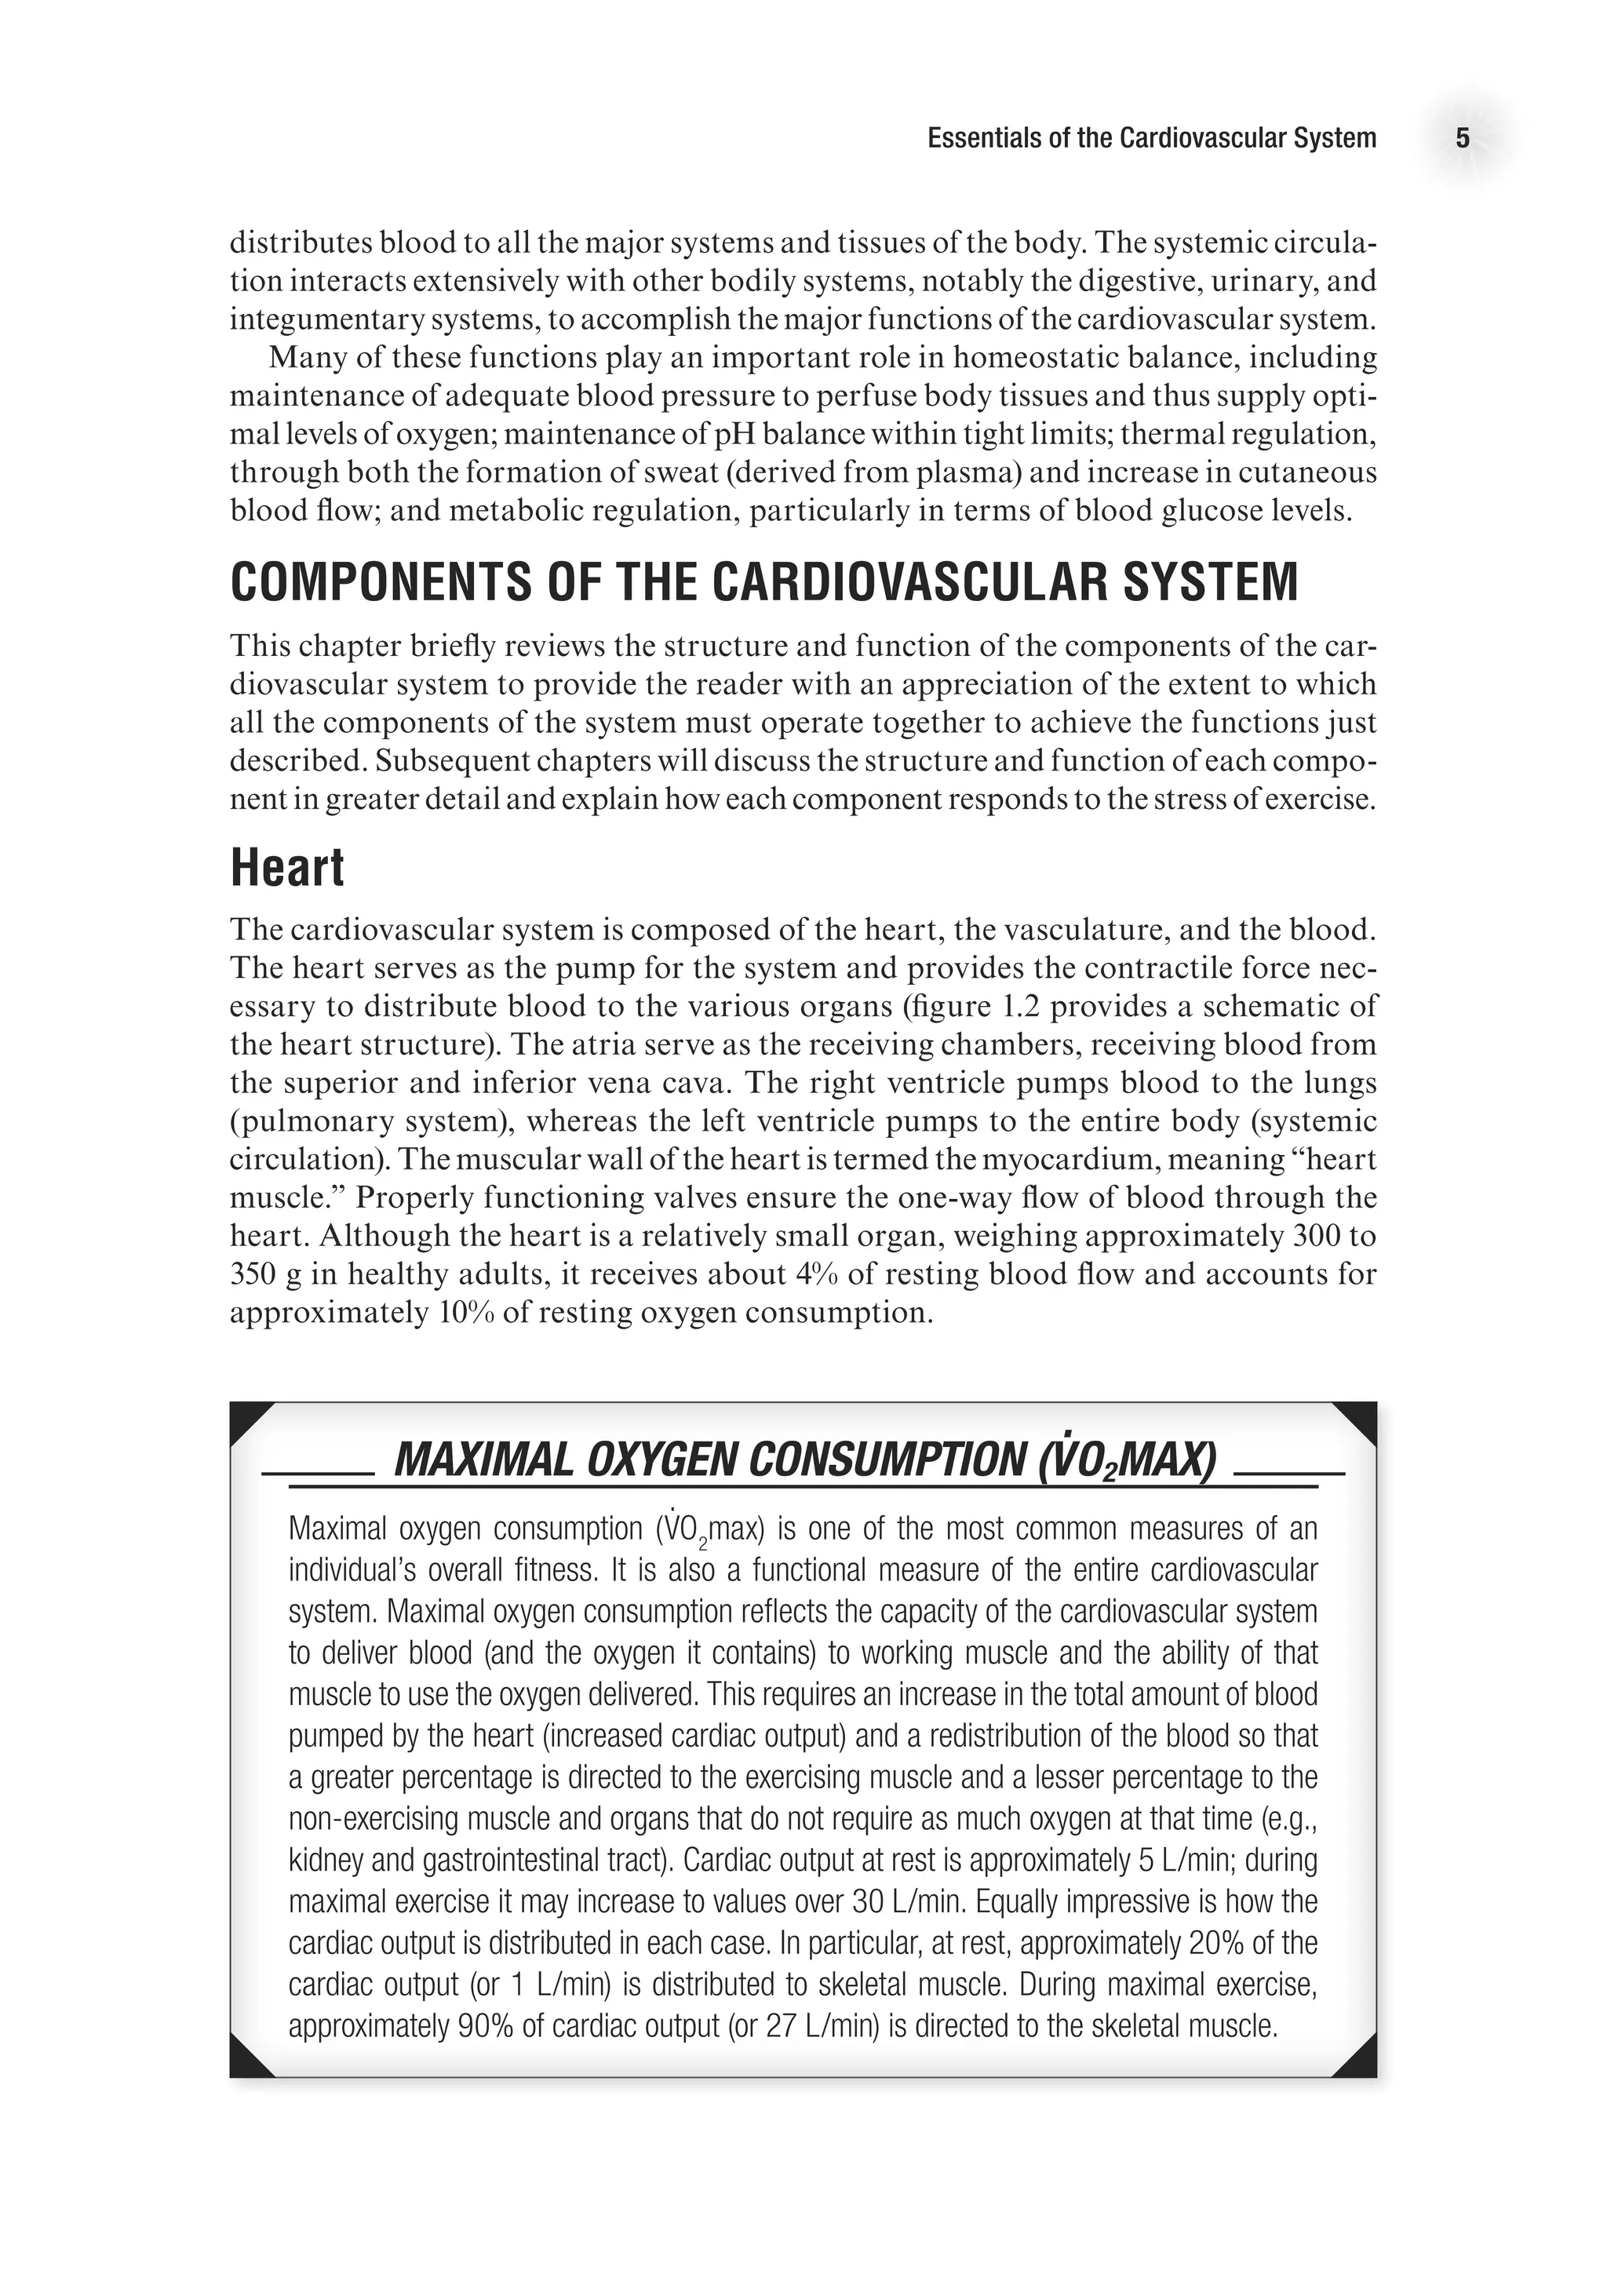
Preload
Preload is the amount of blood returned to the heart during diastole. As more blood
is returned to the heart, more blood is ejected from the heart—up to a point. The
relationship between ventricular volume and stroke volume is described by the Frank-
Starling law of the heart, which states that an increased stretch of the myocardium
(reflected in increased end-diastolic volume or pressure) enhances the contractile
force of the myocardium and, therefore, causes more blood to be ejected. In short,
the more the ventricle is stretched in diastole, the greater the force of contraction in
systole. Thus, greater venous return leads to greater cardiac output—reinforcing the
dynamic interplay between the circulation and heart function—and vice versa. Figure
2.5 presents a ventricular function curve with end-diastolic volume (an index of muscle
fiber length) on the x-axis and stroke volume (a measure of contractile energy) on the
y-axis (other ventricular function curves use ventricular filling pressure on the x-axis
and stroke work (SV 3 MAP [mean arterial pressure]) on the y-axis).
Preload is determined by the amount of blood in the ventricle; this is a function of
venous return and filling time (heart rate, HR). Preload is dependent on venous return of
blood and can be affected by any factor that alters venous return. For example, during
rhythmical exercise, the skeletal muscle pump causes increased venous return, which
leads to increased stroke volume. Conversely, immediately upon standing, there is a
temporary decrease in venous return that results in a transient decrease in stroke volume.](https://image.slidesharecdn.com/advancedcardiovascularexercites-220106230013/75/Advanced-cardiovascular-exercites-33-2048.jpg)


![26 Advanced Cardiovascular Exercise Physiology
ventricular wall thickness. The law of Laplace applied to a spherical structure (such
as a ventricle) states the following:
Wall tension =
Transmural pressure 3 Vessel radius
2 3 Wall thickness
T =
(P 3 r)
2h
On the basis of this mathematical relationship, it can be seen that an increase in
ventricular wall thickness (ventricular hypertrophy) leads to a reduction in wall ten-
sion. On the other hand, an increase in ventricular cavity size (an increase in r) leads
to an increase in wall tension. An increase in wall tension means that the myocardium
must work harder, and this is reflected in a greater energy cost. In the case of heart
failure, the ventricular cavity may be enlarged at the same time there is significant
thinning of the ventricular wall, thus leading to a considerable increase in the energy
required to eject blood from the ventricle (Shepherd and Vanhoutte, 1980).
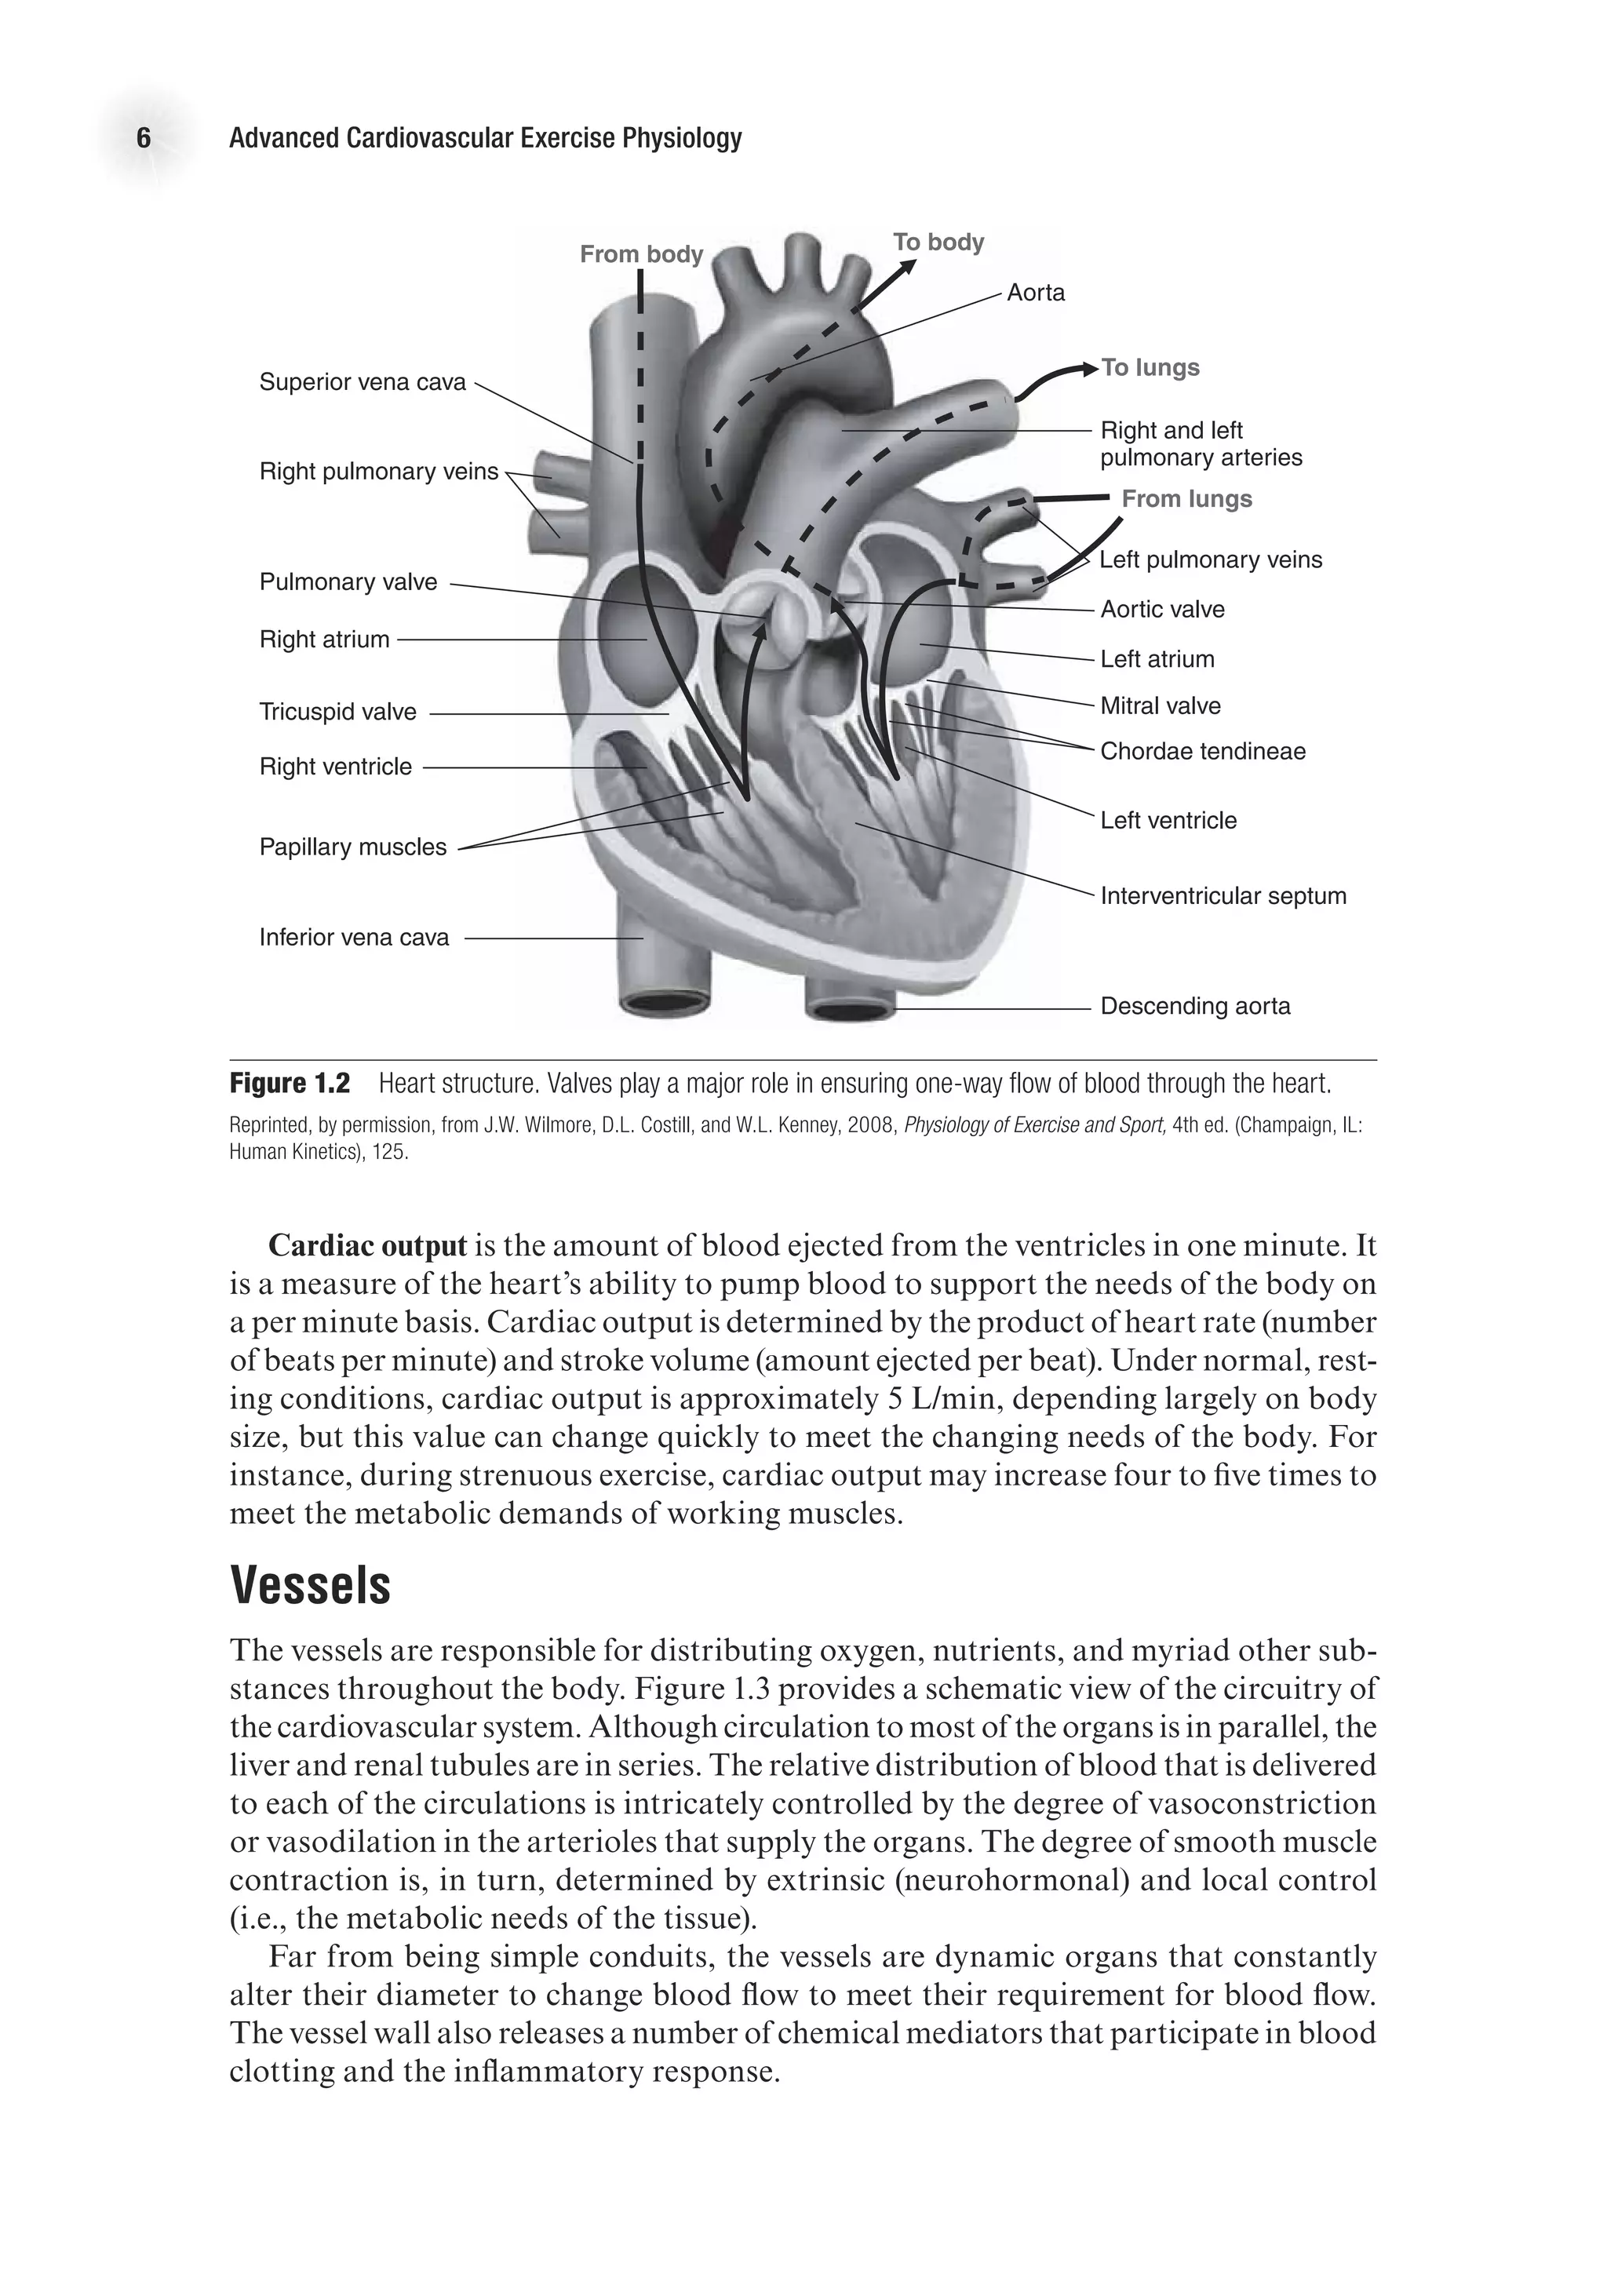
Measuring Cardiac Function
Cardiac function is routinely assessed in hospital and clinical settings in order to
diagnose disease and guide treatment. Cardiac function is also commonly measured
in exercise physiology laboratories in order to understand the effect of exercise and
exercise training on cardiovascular parameters. One of the most powerful and versa-
tile tools for assessing cardiac function is a Doppler ultrasound machine (figure 2.9).
Cardiac Output
Cardiac output is a measure of the ability of the heart to pump the blood needed to
meet the metabolic demands of the body. It is determined by the product of heart
rate and stroke volume. Measuring heart rate is relatively easy (by palpitation, use
of electronic measuring devices [such as an HR watch] or use of ECG equipment).](https://image.slidesharecdn.com/advancedcardiovascularexercites-220106230013/75/Advanced-cardiovascular-exercites-40-2048.jpg)

![28 Advanced Cardiovascular Exercise Physiology
During exercise, stroke volume must be measured by different methods because of
movement artifact that limits the validity of the method just described. Under exercise
conditions, it is more appropriate to calculate SV using Doppler echocardiography.
Stroke volume is equal to the product of aortic cross-sectional area and the time–
velocity integral of blood flowing in the ascending aorta. The cross-sectional area of
the aorta is imaged using ultrasound, and the time–velocity integral of blood in the
ascending aorta is measured using a Doppler probe.
Systolic Function
Systolic function is a term used to express the ability of the heart to contract forcefully
enough to effectively eject blood. Several echocardiography variables can be used as
an expression of systolic function (or contractility), including fractional shortening,
ejection fraction, and regional wall motion analysis. Fractional shortening is the
percentage change in left ventricle dimensions with each contraction (FS = [(LVED
− LVES) / LVED] 3 100). The most common expression of global left ventricular
function is the left ventricular ejection fraction. Ejection fraction, the ratio of blood
volume ejected from the heart to the volume of blood in the heart at the end of diastole,
SV/EDV, is a widely used index of contractility. Regional wall motion is determined
by dividing the left ventricle into 16 discrete segments, and a numeric scoring system
is used to score the contractility of each segment (1 = normal; 2 = hypokinesis; 3 =
akinesis; 4 = dyskinesis). A wall motion score index (WMSI) is derived by dividing
the sum of the wall motion scores by the number of segments visualized during the
echocardiography examination, and reflects the extent of regional wall motion abnor-
mality (Oh, Seward, and Tajik, 2007).
Diastolic Function
Diastolic function is a measure of the ability of the myocardium to relax and allow
adequate ventricular filling. It is now well appreciated that diastolic function is inte-
gral to the health and function of the heart. Many individuals with heart disease have
Figure 2.11 Mitral inflow velocities. The mitral inflow velocity is obtained by a pulsed wave Doppler recording
with samples taken at the mitral valve. The E wave represents the inflow pattern during early diastole (when the
ventricle is recoiling and relaxing). The A wave represents the inflow pattern during late filling after atrial contraction.](https://image.slidesharecdn.com/advancedcardiovascularexercites-220106230013/75/Advanced-cardiovascular-exercites-42-2048.jpg)


![43
4
Chapter
Electrical Activity
of the Heart
F
or the heart to contract, an electrical event must occur first and must stimulate
the muscle fibers to shorten. These electrical events are very important, as
under normal circumstances they make the heart contract in a rhythmical
manner. Disturbances in the electrical system of the heart can cause dysrhythmias
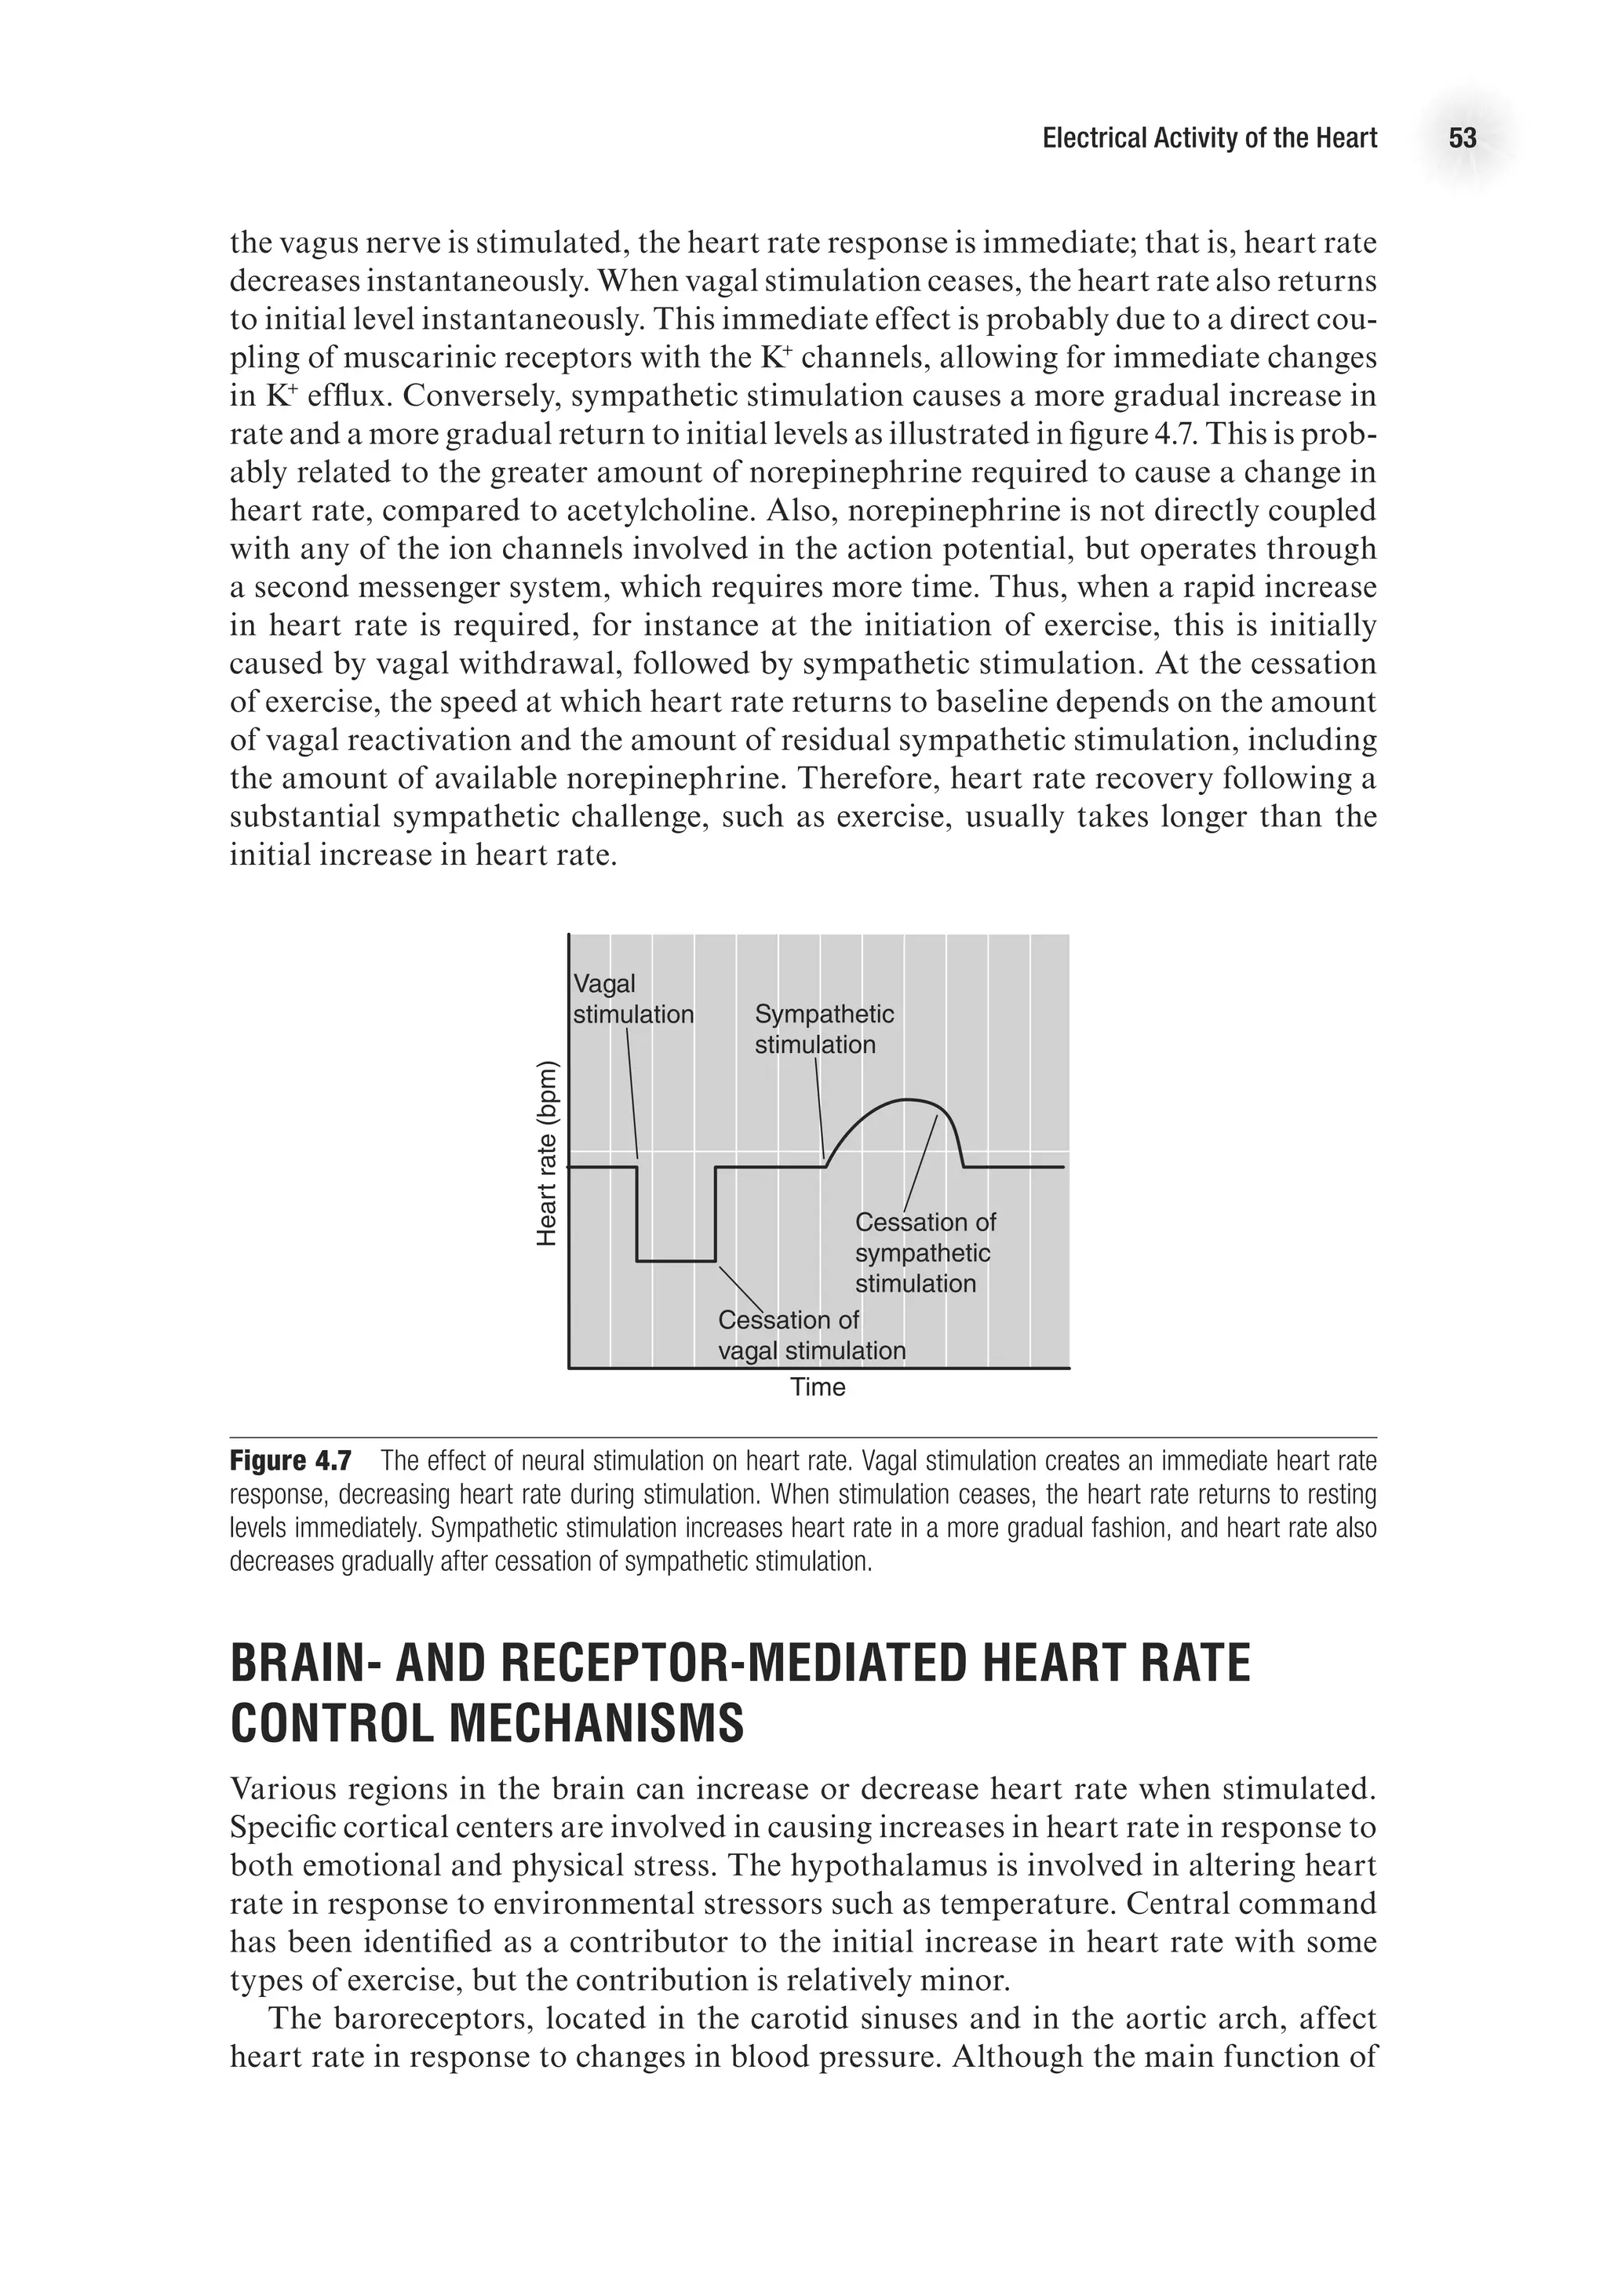
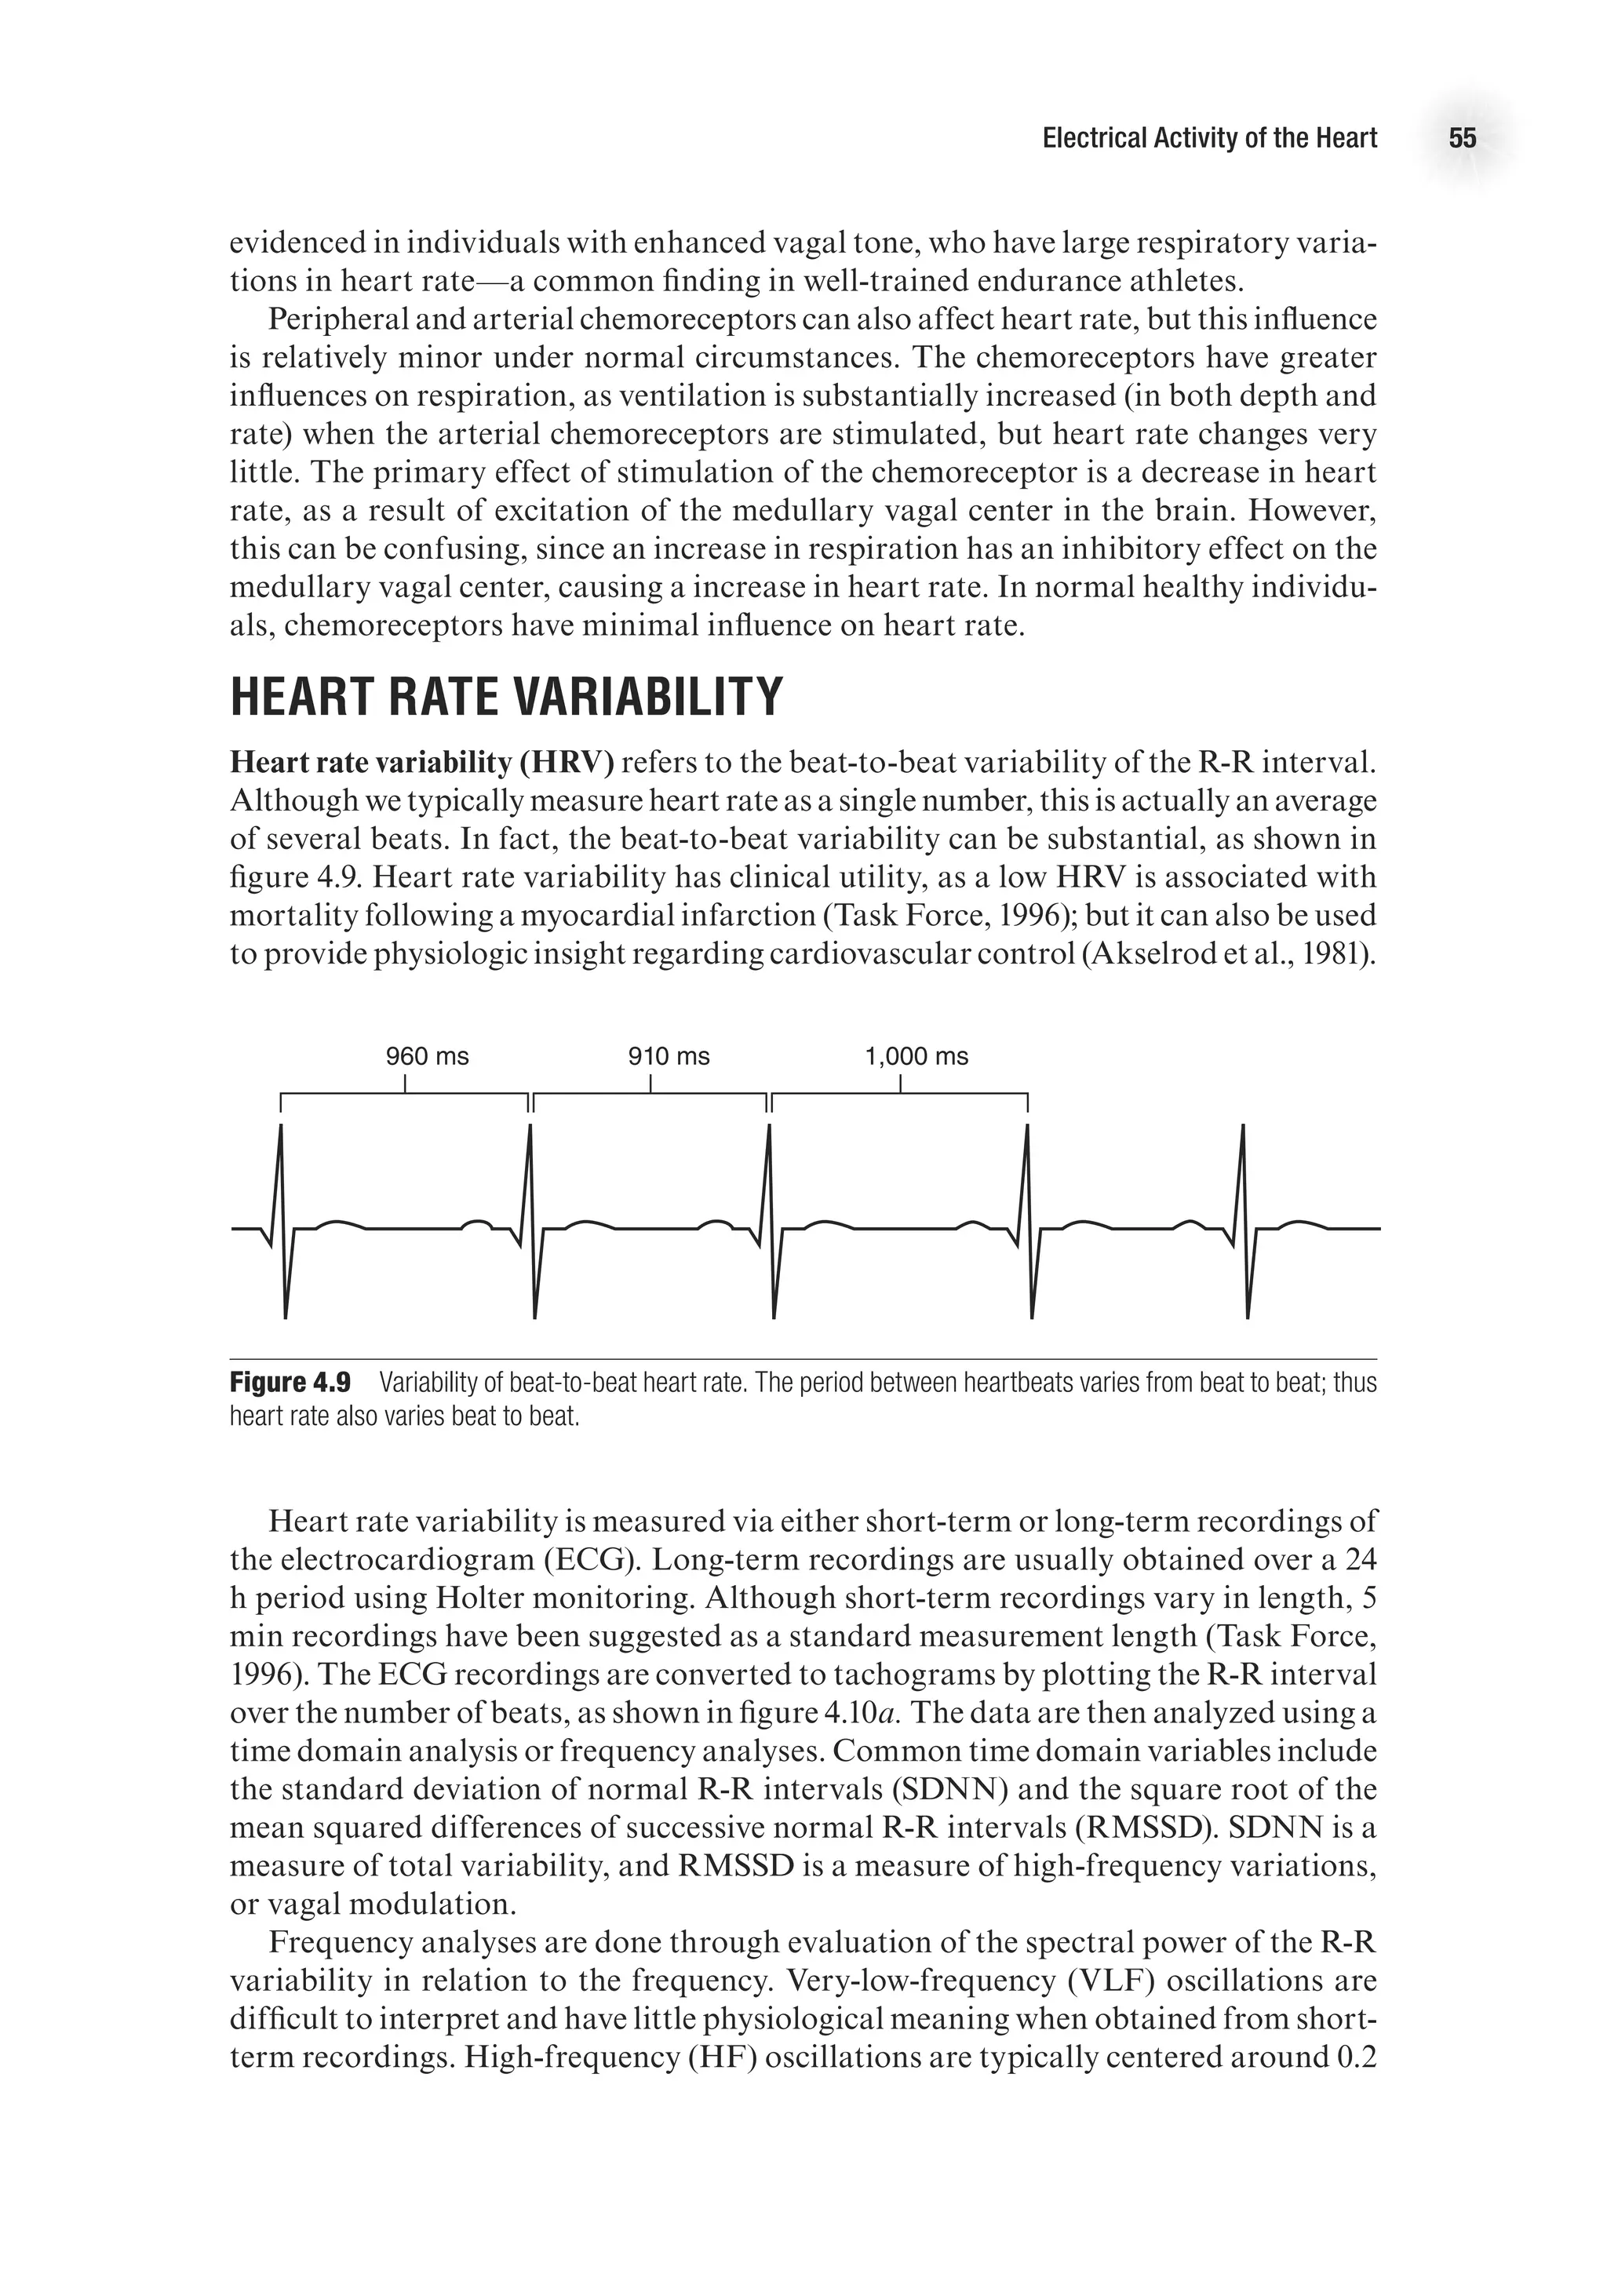
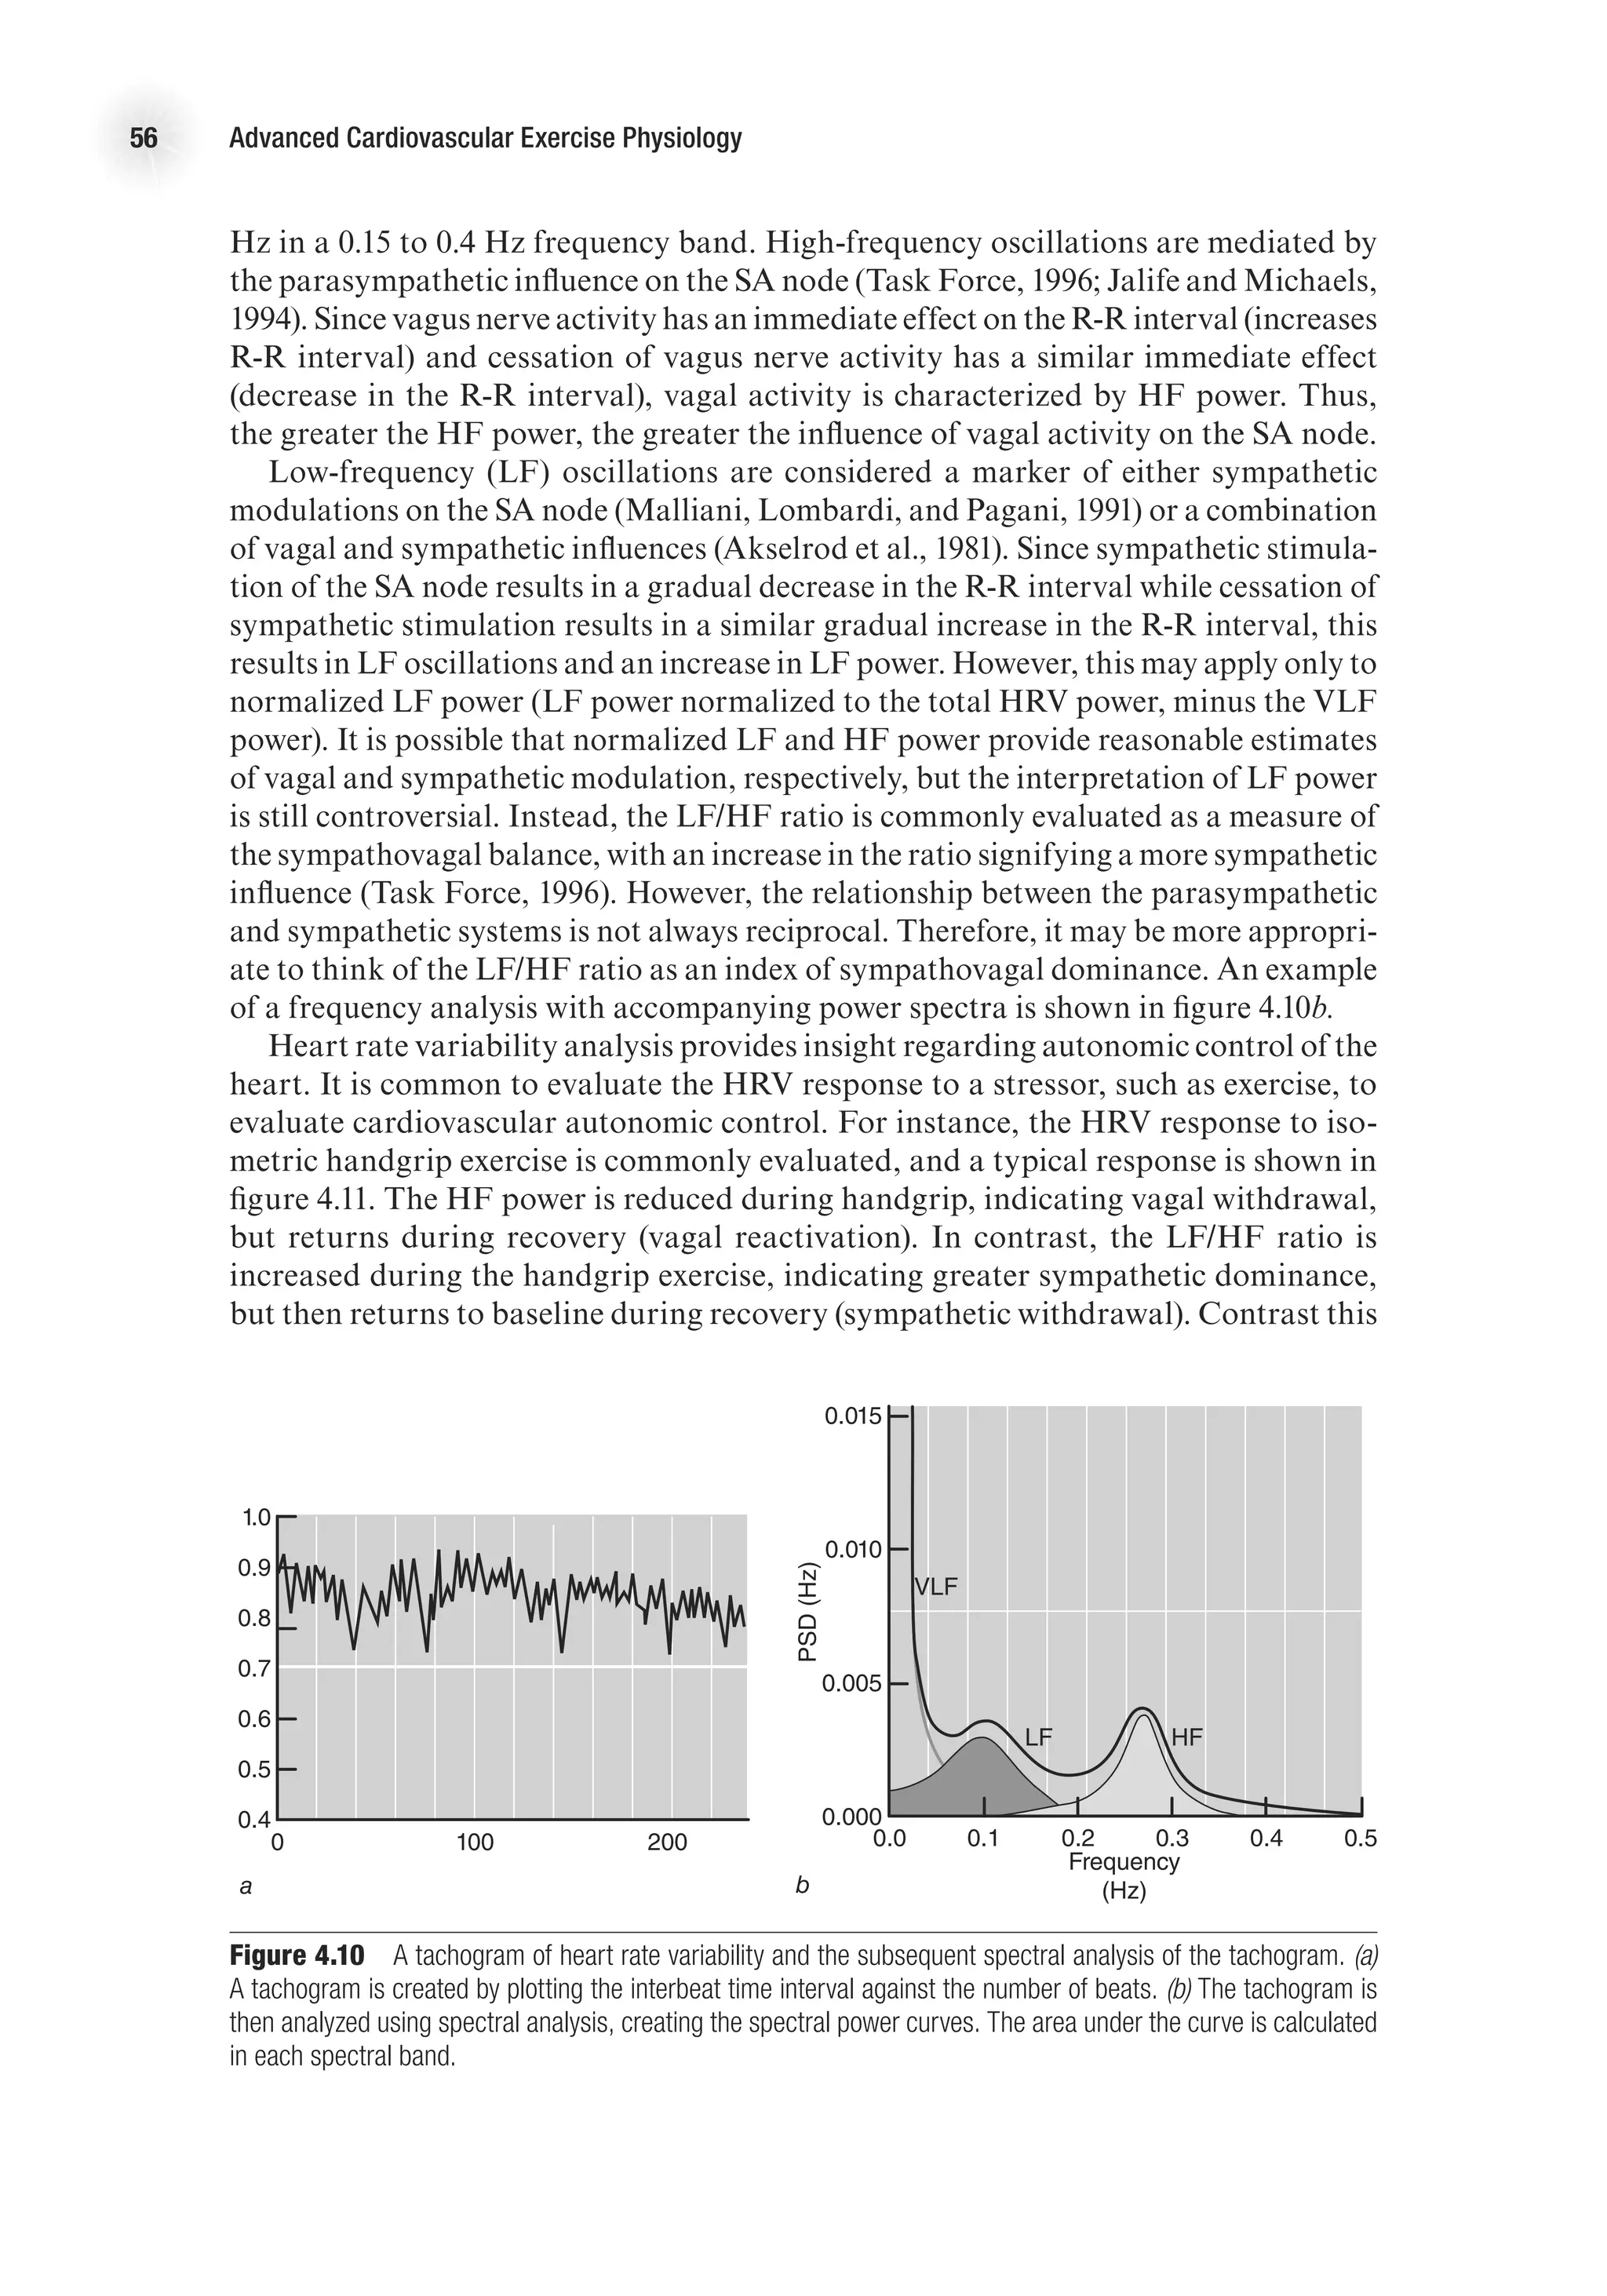
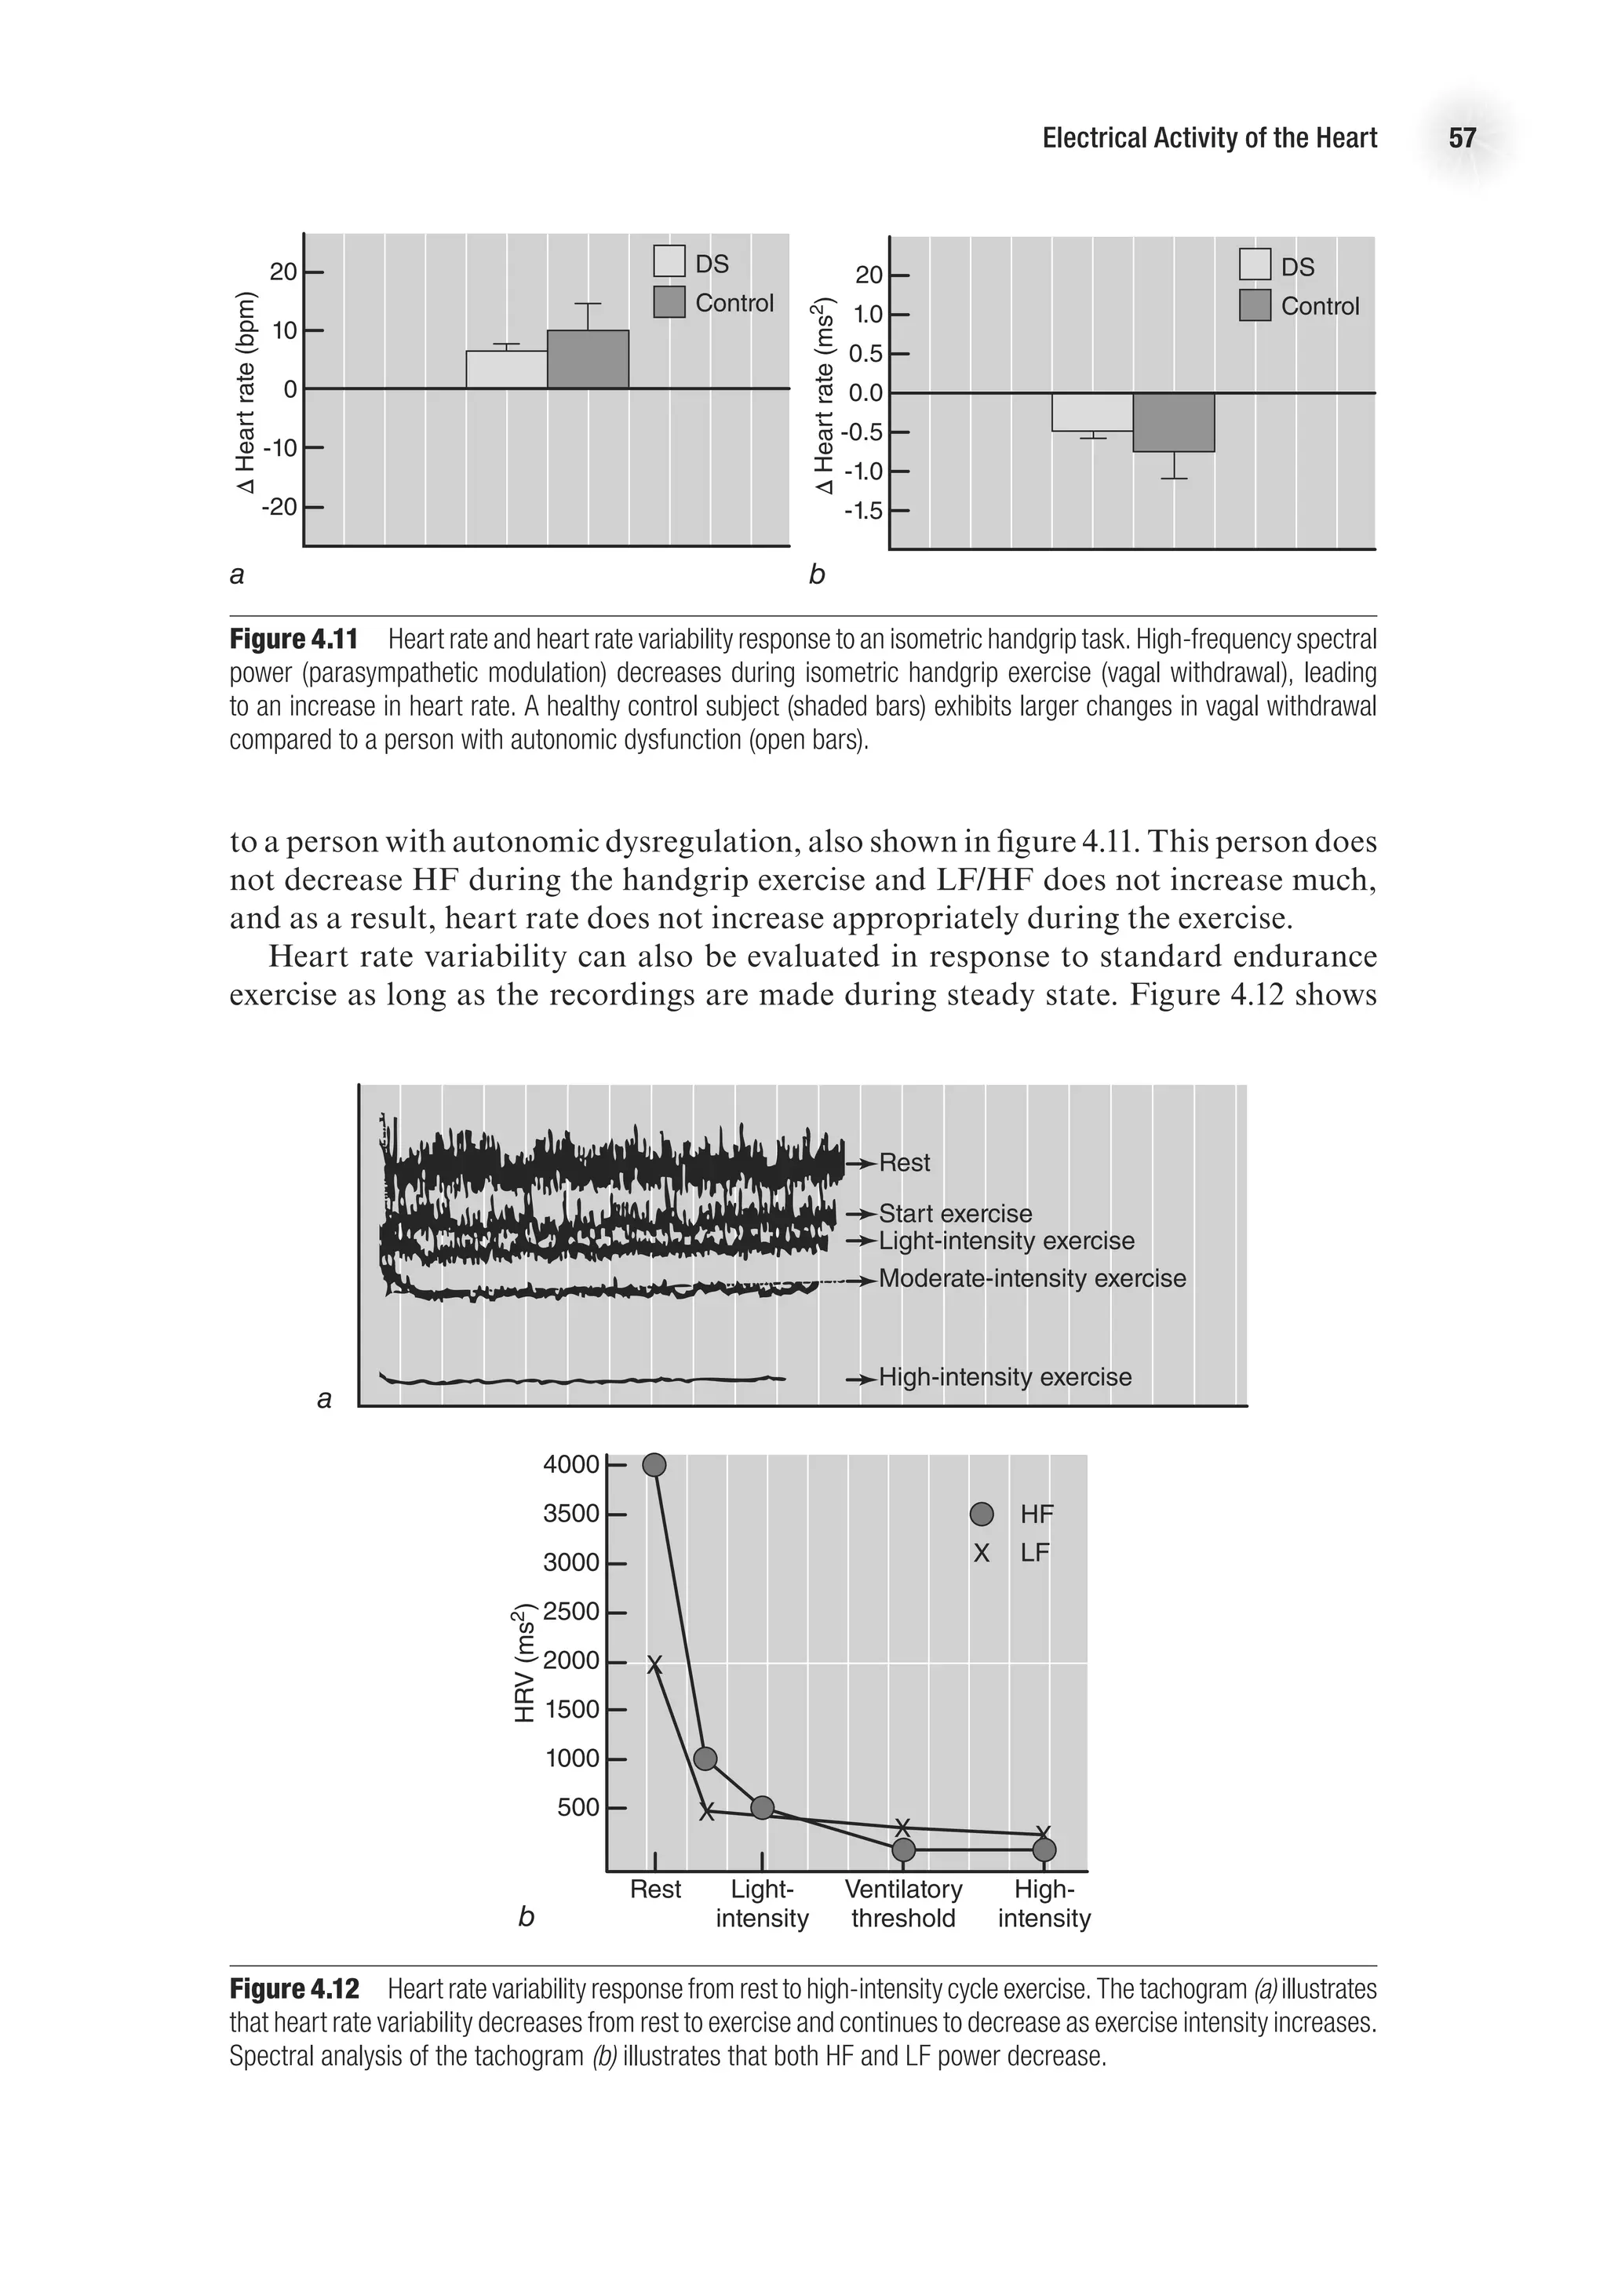
that may become life threatening. This chapter examines the factors that contribute
to the electrical events in the heart, discusses how the electrical signal is transmit-
ted throughout the heart, and explains how the electrical activity of the heart is
measured. The chapter also examines how heart rate is controlled and how this is
measured.
Ion Basis of Electrical Activity
Many human cells, but especially those of neurons, skeletal muscle, and heart muscle,
have an electrical charge compared to their surroundings. This charge is caused
by separation of ion pairs, leading to a difference in the ion concentration inside
compared to outside the cell. The cell membrane functions as a gatekeeper, allowing
some ions to move through it and stopping or greatly reducing the flow of other ions.
A cardiac muscle cell has a greater extracellular than intracellular concentration of
Na+
, whereas the intracellular K+
concentration is much greater than the extracellular
concentration. Since ions have a natural tendency to diffuse across the membrane to
create equal concentrations on the two sides, it is clear that the cell membrane is not
freely permeable to Na+
and K+
.
The separation of ion pairs creates an electrical force, and the balance between
the electrical and chemical forces is called the electrochemical equilibrium potential
(Em
). This potential can be described by the Nernst equation as
Em
= −61.5 3 log
intracellular [ion]
extracellular [ion]](https://image.slidesharecdn.com/advancedcardiovascularexercites-220106230013/75/Advanced-cardiovascular-exercites-57-2048.jpg)
![44 Advanced Cardiovascular Exercise Physiology
To calculate the Em
for potassium, simply substitute K+
in the equation as follows:
EK+ = −61.5 3 log
intracellular [K+
]
extracellular [K+
]
Because the concentrations of potassium and sodium ions on the inside and the
outside of the cell differ vastly, there is a difference between the electrical charge inside
of the cell membrane and that outside of it. This difference in charge is referred to as
the membrane potential. The resting membrane potential is approximately −90 mV
in myocardial cells.
Resting Membrane Potential
The rate of ion transfer across the cell membrane is determined by the concentration
difference and the permeability of the membrane to each specific ion. The permeability
to an ion is in turn determined by the opening and closing of ion gates or channels.
These gates are specific to each ion. Under normal circumstances there is always some
“leakage” of ions across the cell membrane, since the inherent electrochemical forces
work toward establishing an equilibrium. Thus, there is always some K+
crossing
from inside to outside the cell, while the reverse is true for Na+
. This means that the
membrane potential would be gradually altered if the ion balance were not restored.
In fact, the inward movement of Na+
would eventually cause membrane depolariza-
tion unless these ions were transported back to outside the cell. The ions are moved
outside the cell through active transport, a form of a metabolic sodium-potassium
pump, involving the membrane enzyme Na+
, K+
-ATPase. As with any pump, energy
is required in order for it to work, and the energy is provided by the phosphorylation
of adenosine triphosphate (ATP). The active transport of K+
back into and Na+
out
of the cell maintains the resting membrane potential at close to −90 mV.
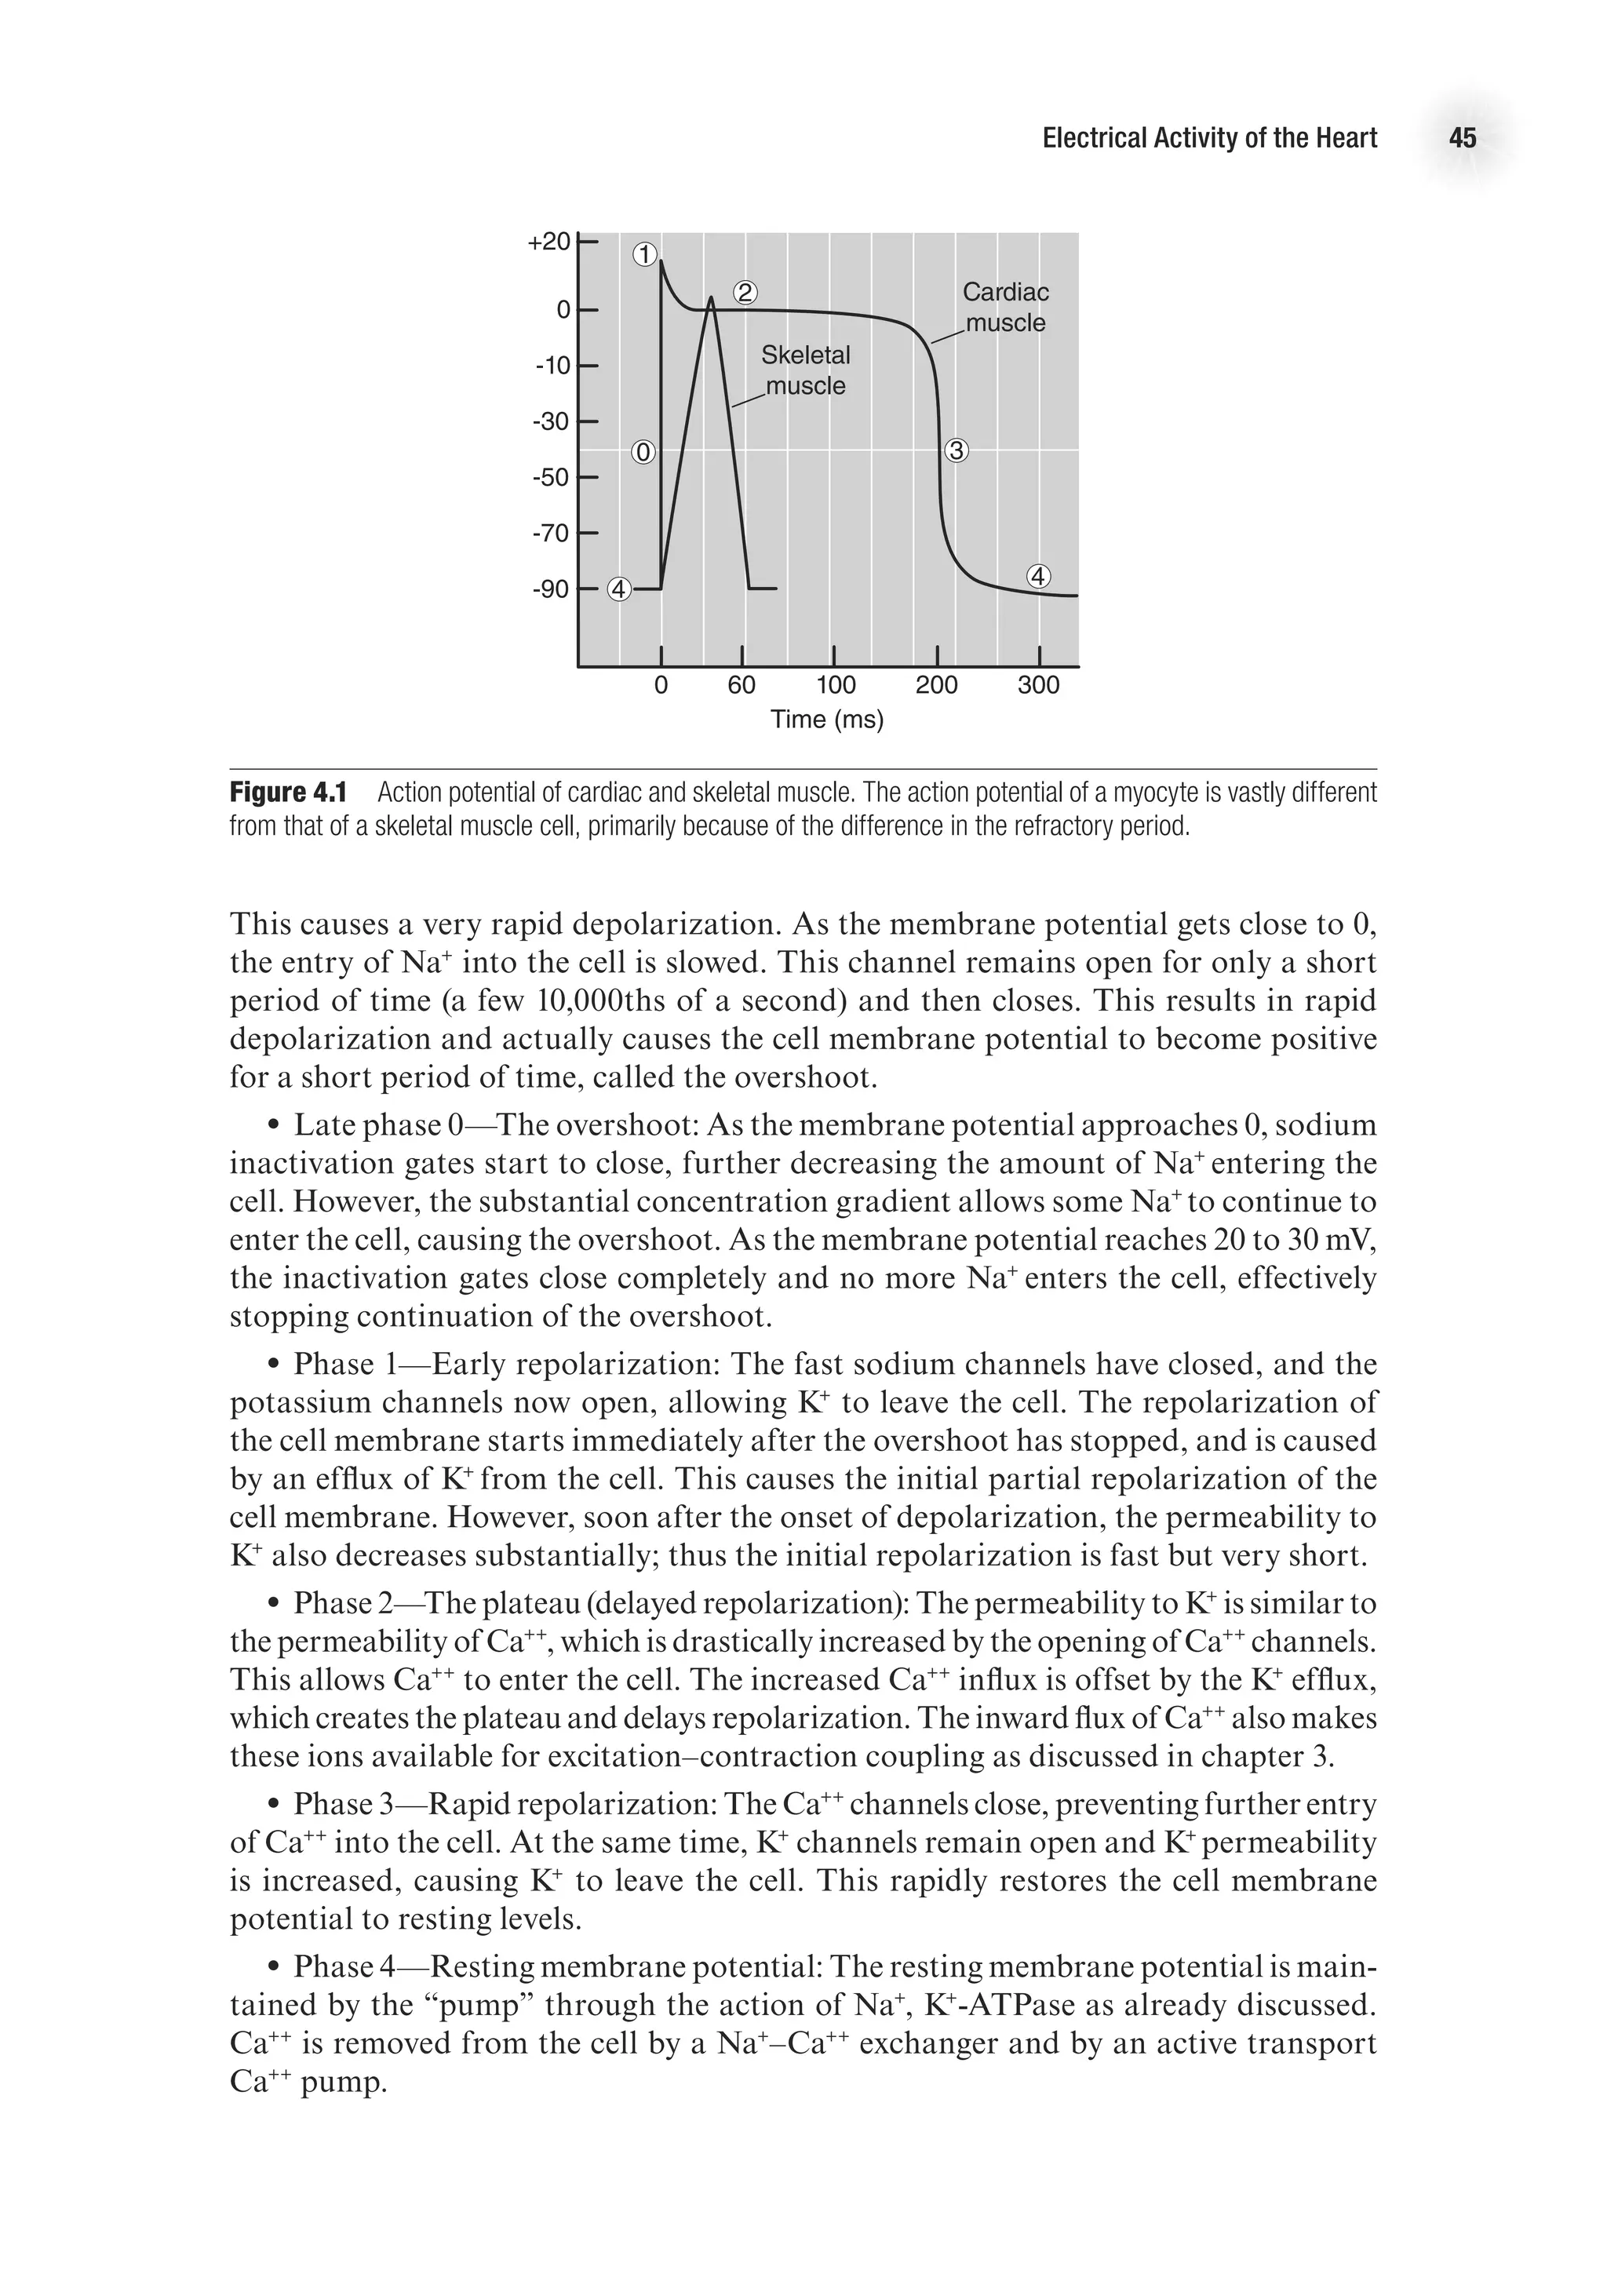
Action Potential
Just as with skeletal muscle, for a myocardial muscle fiber to contract, an action
potential must be generated. A typical ventricular action potential is depicted in figure
4.1. The action potential looks slightly different depending on whether it is from a
conducting cell or a contracting cell (shown in figure 4.3, p. 47), and the following
description applies to the contracting cell. There are five distinct phases of the cardiac
action potential, labeled in the figure as phases 0 through 4 (phases are labeled 0
through 4 by convention). In general, the myocardial action potential is characterized
by a rapid depolarization (0), followed by a slight overshoot (1); a delay or plateau in
the membrane potential, referred to as the refractory period (2), which then proceeds
to a rapid repolarization (also part of the refractory period) (3); and a return to rest-
ing membrane potential (4). The myocardial action potential lasts much longer than
that of the skeletal muscle, and the delay before rapid depolarization causes a refrac-
tory period during which another depolarization is not possible. Figure 4.1 shows
a comparison of a typical skeletal muscle action potential compared to the typical
action potential from a ventricular myocyte. The lengthening of the myocyte action
potential is caused by Ca++
entry into the cell, which does not happen in the skeletal
muscle. The specific events causing the myocardial action potential are described next.
•
• Phase 0—Depolarization: Fast, voltage-gated sodium channels, also called m
gates, on the cell membrane open and allow small amounts of Na+
to enter the cell.](https://image.slidesharecdn.com/advancedcardiovascularexercites-220106230013/75/Advanced-cardiovascular-exercites-58-2048.jpg)


![The Electrocardiogram 61
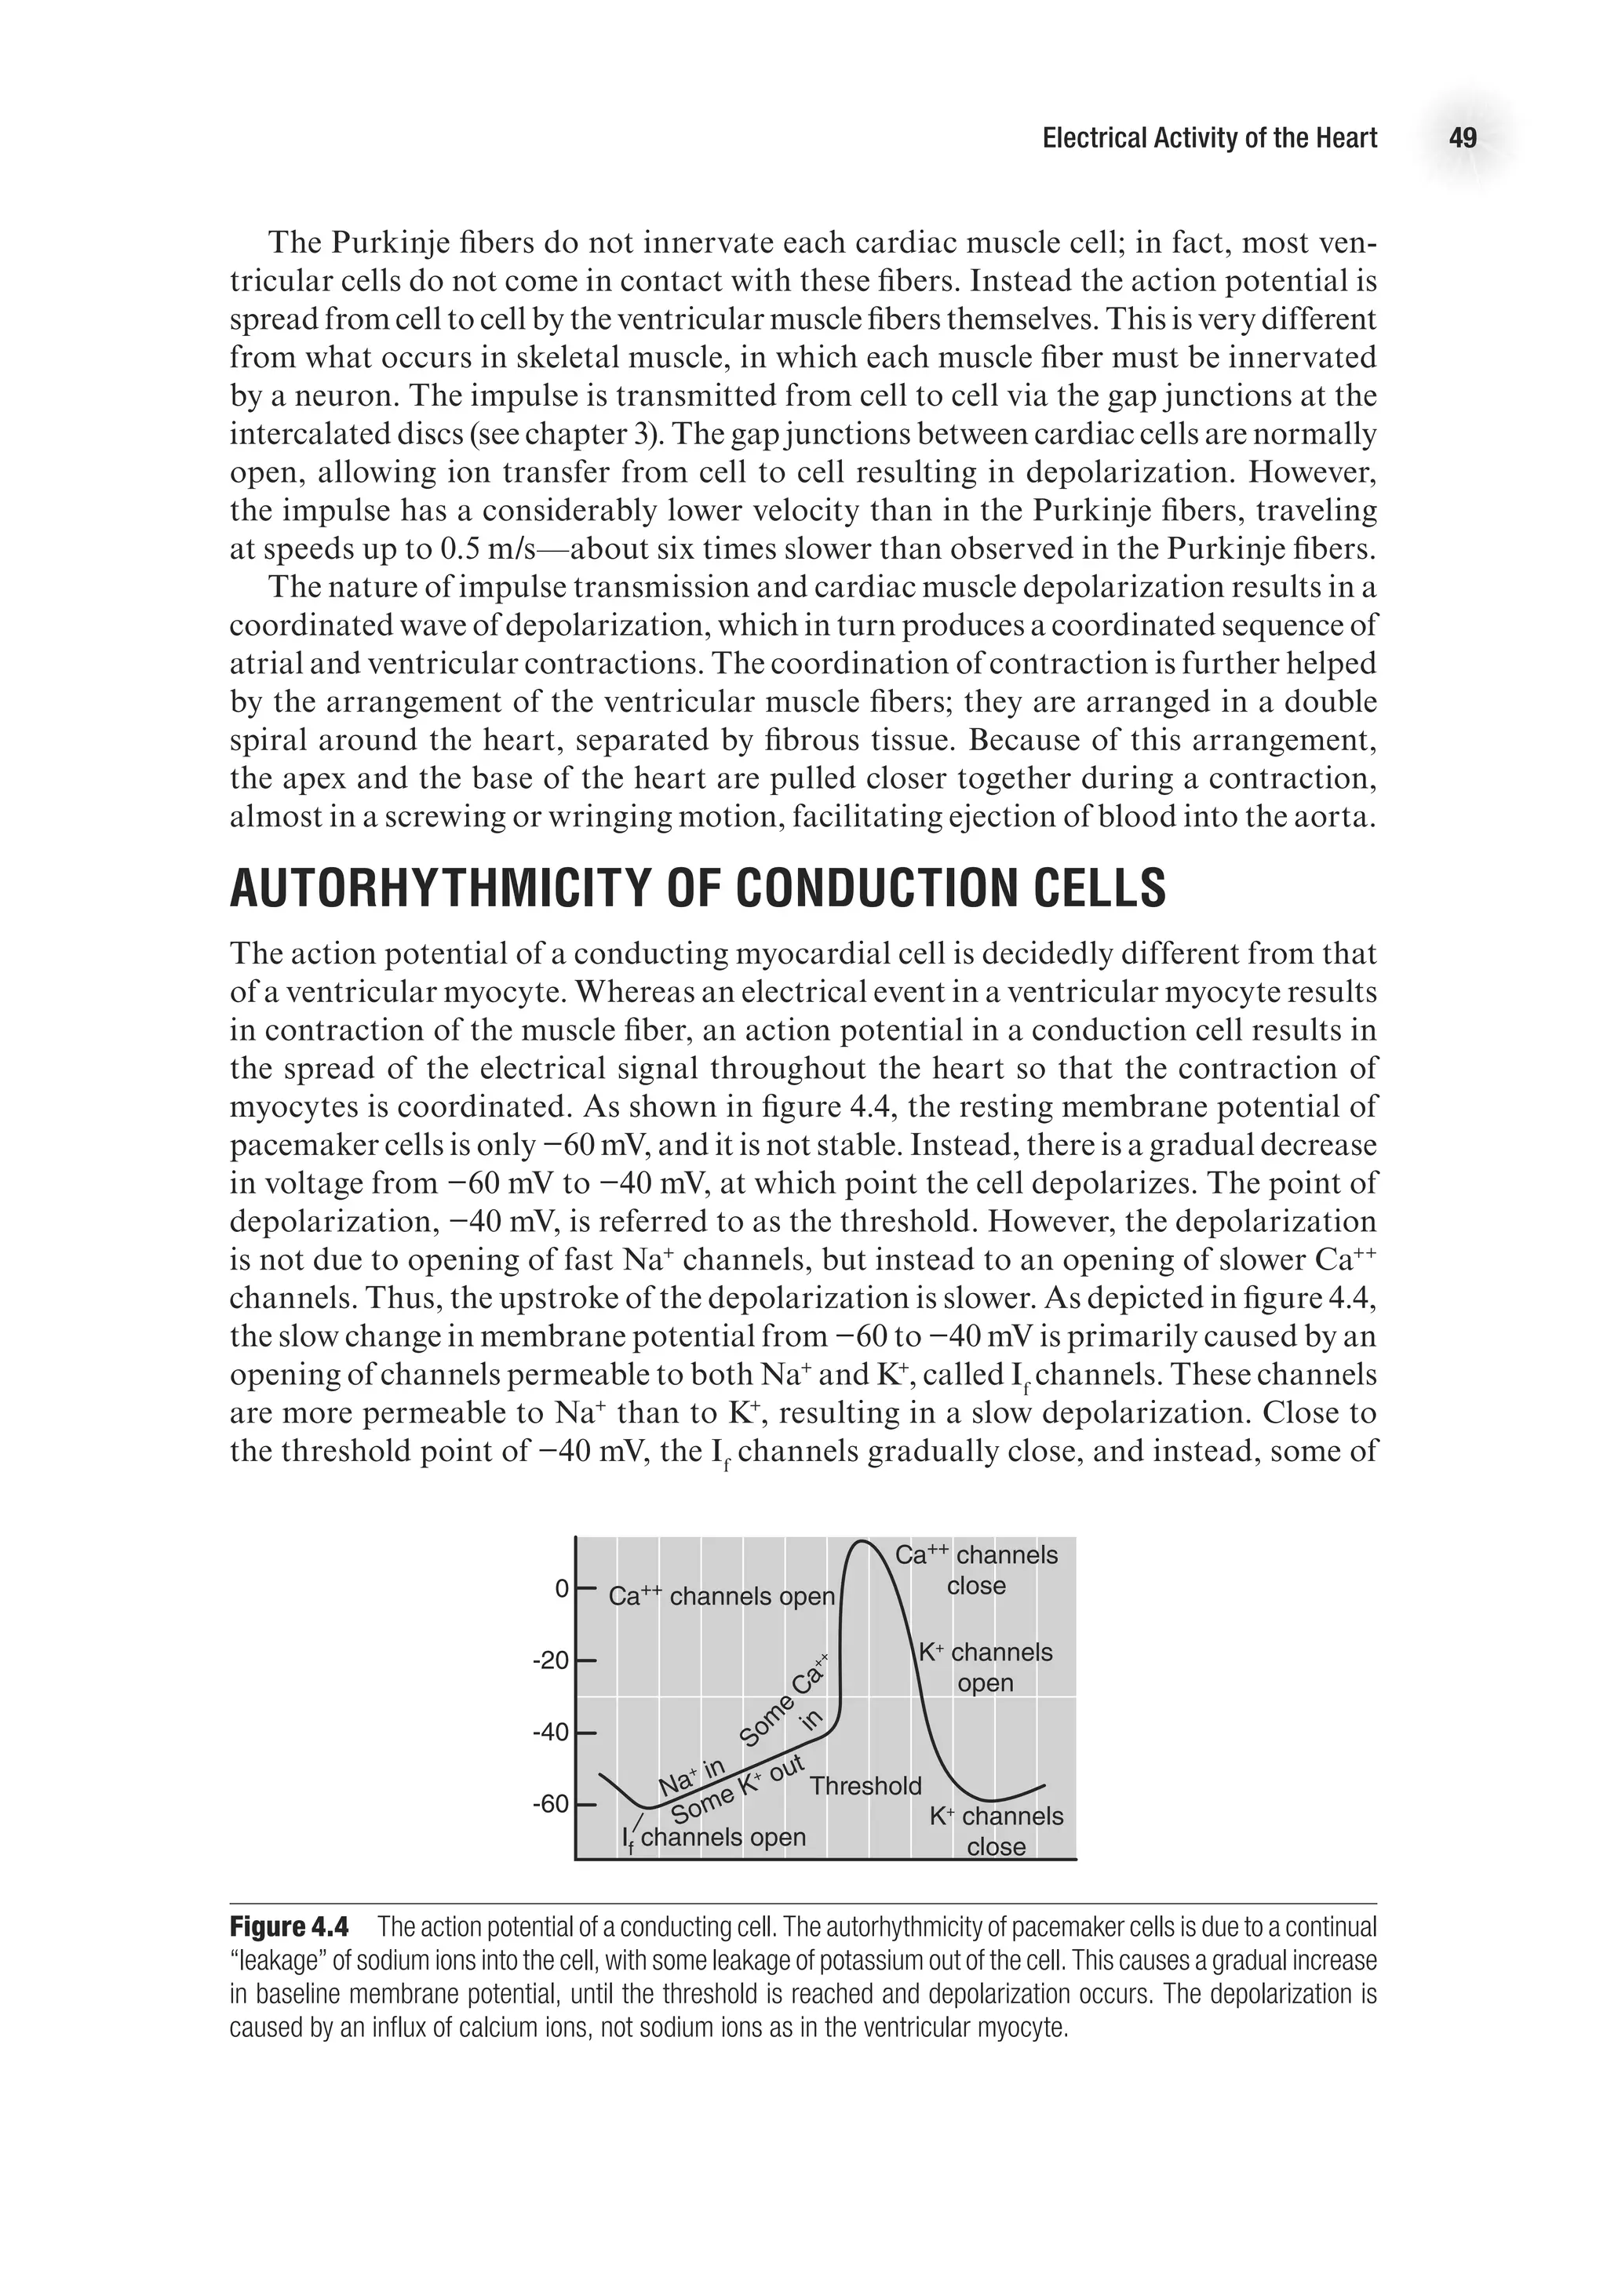
•
• T wave. The T wave depicts ventricular repolarization. It is the upward deflection
following the QRS. It can vary in length and size but is usually rounded and modest in
height. The T wave should generally go in the same direction as the R wave. Deviations
in the T wave may be indicative of myocardial ischemia, ventricular hypertrophy, or
electrolyte disturbances.
•
• There is no recorded wave for atrial repolarization. The atrial repolarization
wave is hidden in the QRS complex.
Segments and Intervals
Segments and intervals are isoelectric (in the normal heart) portions of the ECG. They
denote either a delay (atrioventricular [AV] node) of the impulse, or repolarization.
•
• The P-R segment—from the end of the P wave to the beginning of the Q wave
(or R wave if Q is absent). This segment represents the delay in the impulse in the AV
node, before it continues down the bundles to depolarize the ventricles.
•
• The P-R interval—from the beginning of the P wave to the beginning of the Q
wave. This represents the atrial depolarization and the delay in the AV node. The
P-R interval is normally between 0.12 and 0.2 s. A shorter interval may denote a pre-
excitation syndrome, and a longer interval may denote a block in the AV node.
•
• The Q-T interval—from the beginning of the Q wave to the end of the T wave.
This interval denotes the depolarization and repolarization of the ventricles. The
Q-T interval will vary with heart rate, as a higher heart rate decreases the Q-T inter-
val. Both short and long Q-T interval syndromes tend be associated with genetic
variations that are linked to higher risk of sudden death, presumably from cardiac
dysrhythmias.
•
• The ST segment—from the end of the QRS complex to the beginning of the T
wave. This segment denotes the early repolarization of the ventricles. The ST segment
is evaluated as isoelectric or for deviations up or down from baseline. A significant
deviation is indicative of myocardial ischemia.
•
• There may be a U wave after the T wave; however, this is very uncommon and
not usually observed. The U wave (if it is present) may represent the repolarization
of the papillary muscles.
Measuring the ECG
The ECG is measured through the use of surface electrodes connected to an ECG
machine, which is really a sophisticated galvanometer. The placement of the electrodes
is standardized, which is important for uniformity and interpretation. In general, the
ECG leads can be thought of as limb leads or chest leads. As shown in figure 5.3, the
limb leads are attached to the arms and legs, usually close to the wrists and ankles.
The chest leads are attached to the chest area (see figure 5.2) in standardized locations
(Guyton and Hall, 2000).
The standard limb leads are named leads I, II, and III, and these are the leads
originally used by Einthoven. These leads are bipolar, which means they use two
electrodes, one originating electrode and one sensing electrode. Thus, an electrode
is not the same as a lead. Although there are a total of four limb electrodes, one on
each arm and one on each leg (figure 5.3), only three electrodes are used for leads.](https://image.slidesharecdn.com/advancedcardiovascularexercites-220106230013/75/Advanced-cardiovascular-exercites-75-2048.jpg)


![88 Advanced Cardiovascular Exercise Physiology
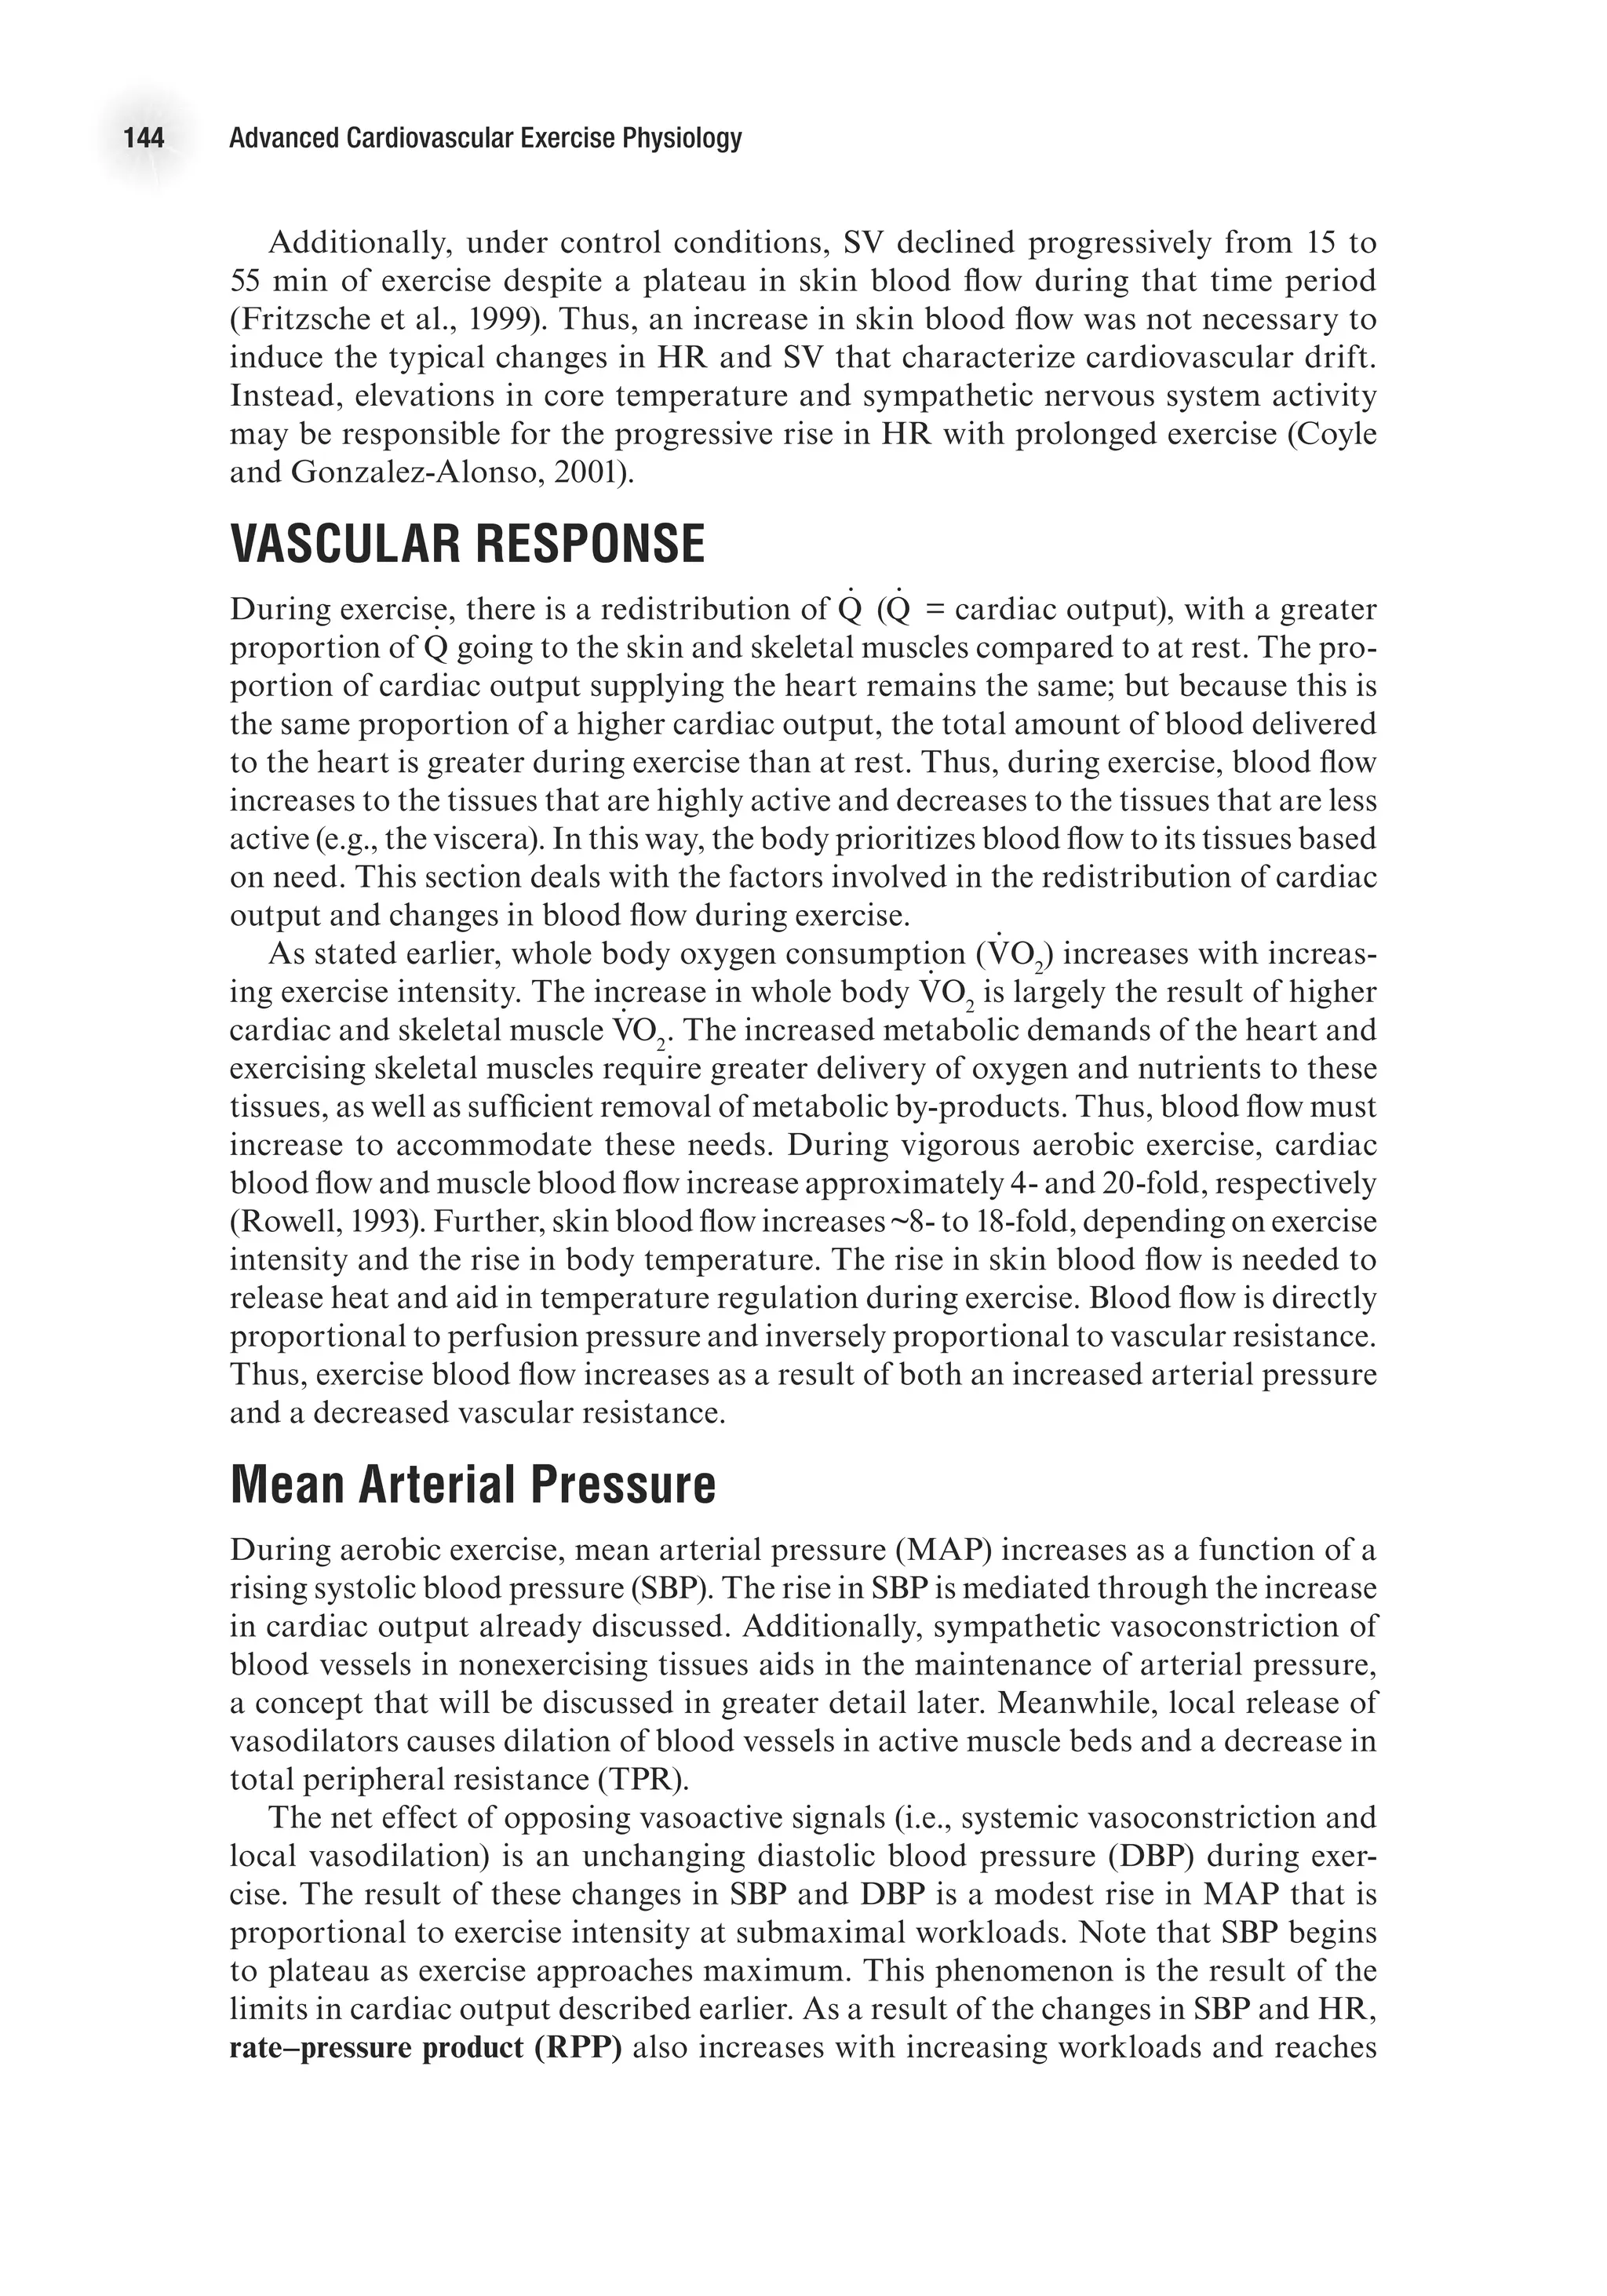
Viscosity
Viscosity refers to the friction between fluid layers as they slide past each other in
conditions of laminar flow. This friction affects flow by impeding the movement
of the individual fluid layers. The viscosity is measured as the ratio between shear
stress and shear rate. Shear stress is loss of energy due to internal resistance, or the
force applied to a segment of the laminar flow, divided by the area in contact with
the fluid. Shear stress then is the relative velocity of the adjacent fluid. As the coef-
ficient of viscosity increases, it takes more energy to move the fluid. The viscosity is
measured in poise, which equals 1 dyne second/cm2
. However, direct measurement
is very difficult, so viscosity is often measured as relative viscosity, where the fluid
in question is compared to water. A higher relative number indicates a more viscous
fluid. For example, human blood has a relative viscosity of 3 to 4, but human plasma
has a lower viscosity of around 1.8 (Little, 1985).
The viscosity of blood is also related to the diameter of the tube, called the
Fahraeus-Lindqvist effect. In general, in conditions of laminar flow, the red blood
cells are concentrated in the center of the vessel, leaving a relatively cell-free layer of
plasma near the vessel wall. This layer becomes proportionally greater as the size of
the vessel lumen decreases, creating the appearance that the viscosity is reduced (see
figure 6.4). It is likely that this effect decreases the resistance to flow in the arterioles
compared to larger arteries, but not in the capillaries. In the capillaries, the red blood
cells flow through the vessel lumen one at a time, thus preventing continuity of plasma
flow (since the plasma is now located between the red blood cells, not between the
cells and the vessel wall).
E4414/Smith/fig6.4/349969/alw/r2
Hematocrit (%)
14
10
6
2
Viscosity
(poise)
20 40 60
Small
diameter
vessel
Medium
diameter
vessel
Large
diameter
vessel
Figure 6.4 Effect of hematocrit concentration on viscosity in different-size blood vessels. The hematocrit
concentration has little effect on blood viscosity in smaller vessels, but has a substantial effect in larger vessels.
In blood, viscosity is altered primarily by via alterations in the hematocrit (per-
centage of blood that is composed of red blood cells [RBC]). In the normal hema-
tocrit range, a change in the hematocrit level produces an equal change in viscosity.
As hematocrits increase above 50%, the viscosity increases in a nonlinear manner.
This has implications for exercise, because dehydration increases hematocrit levels](https://image.slidesharecdn.com/advancedcardiovascularexercites-220106230013/75/Advanced-cardiovascular-exercites-102-2048.jpg)


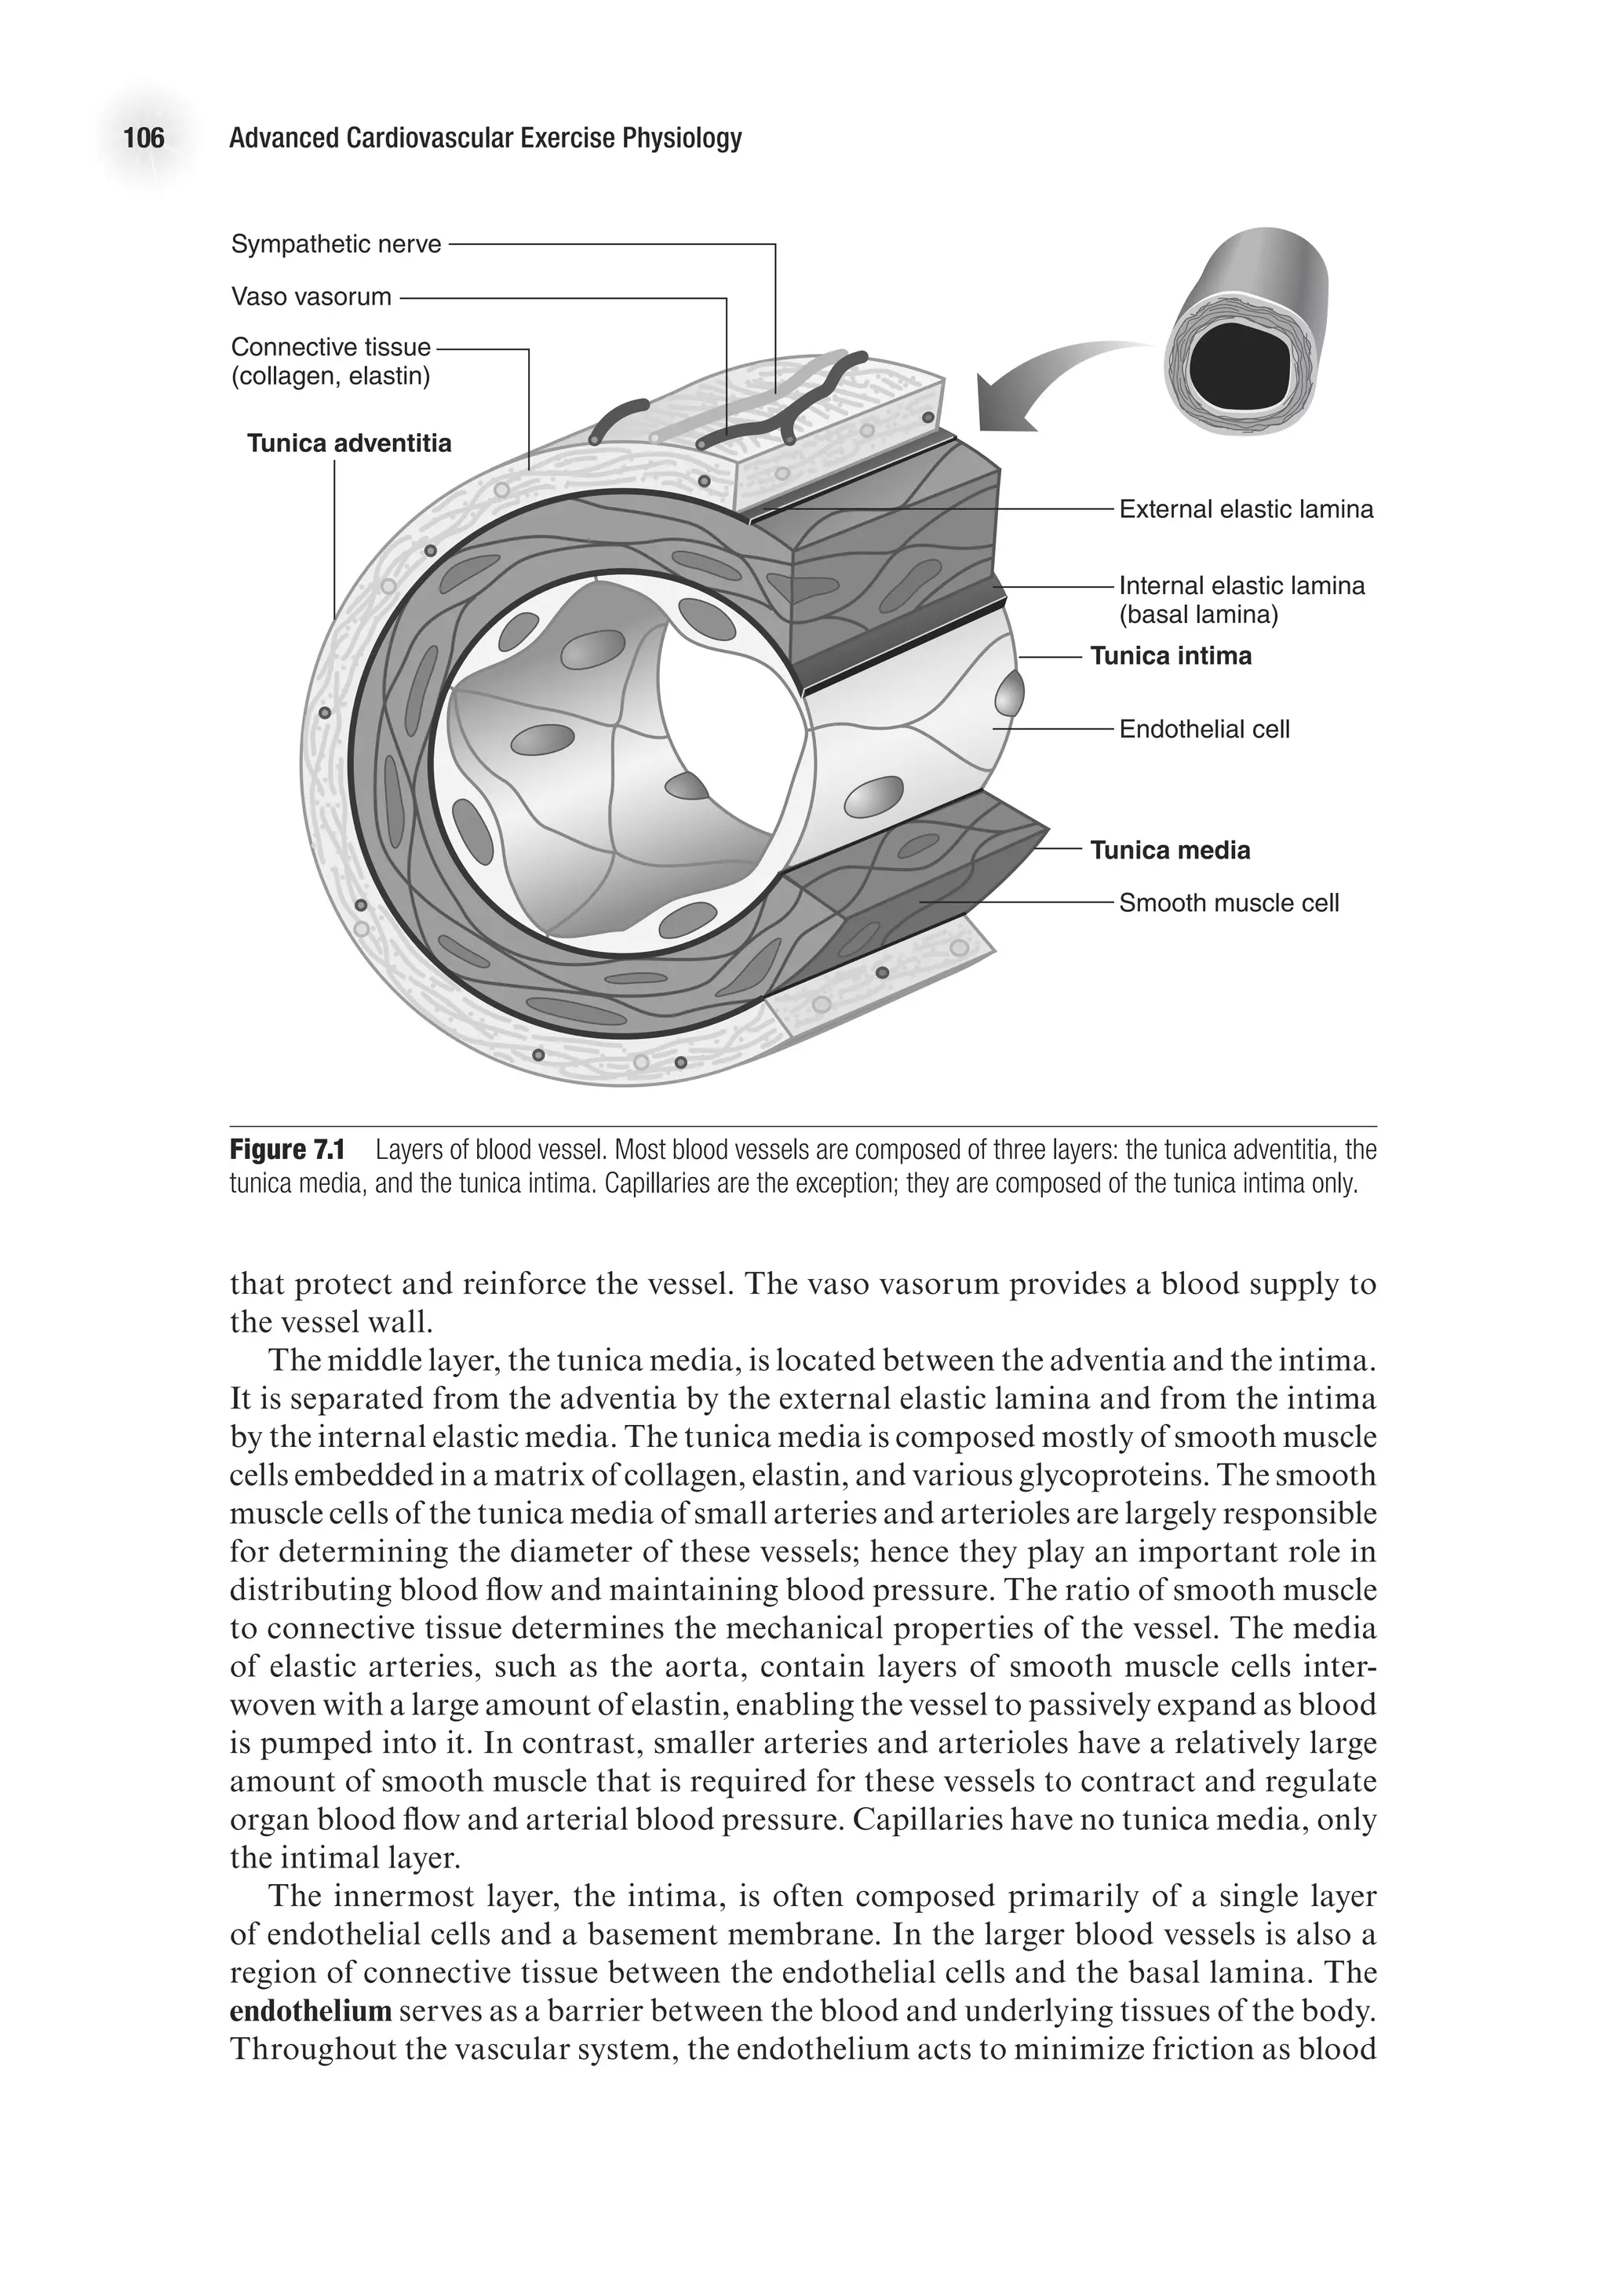
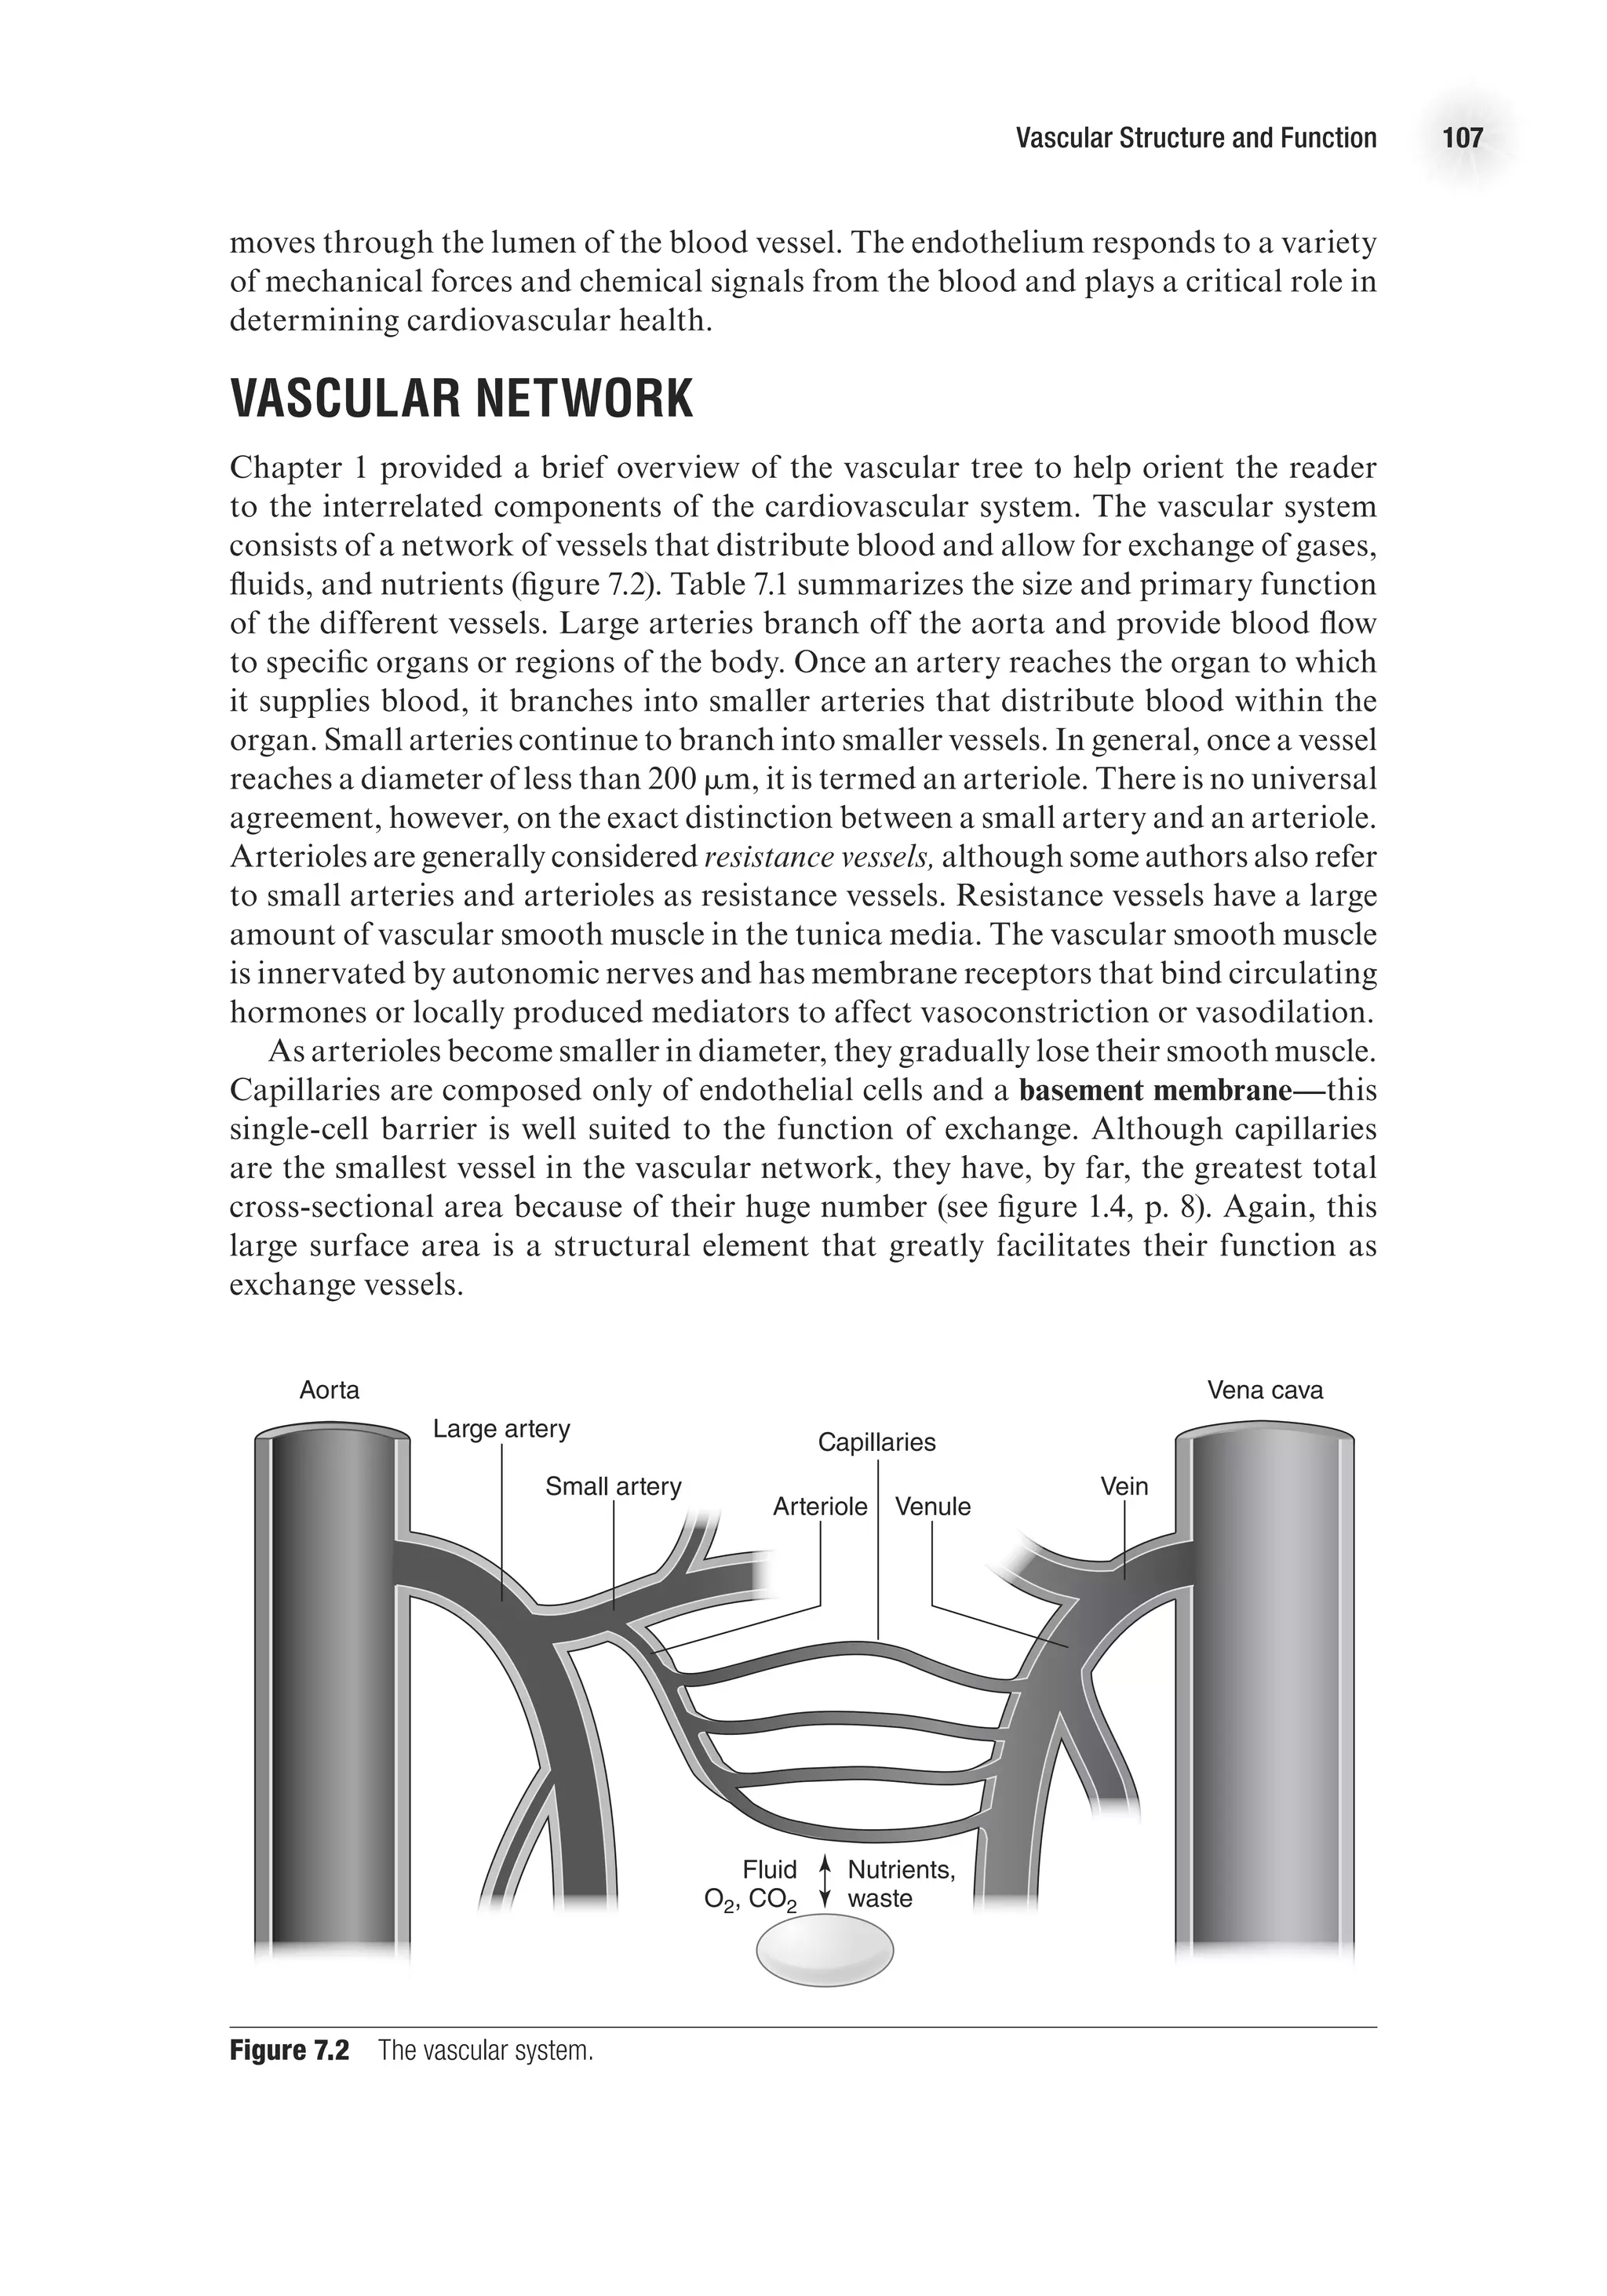
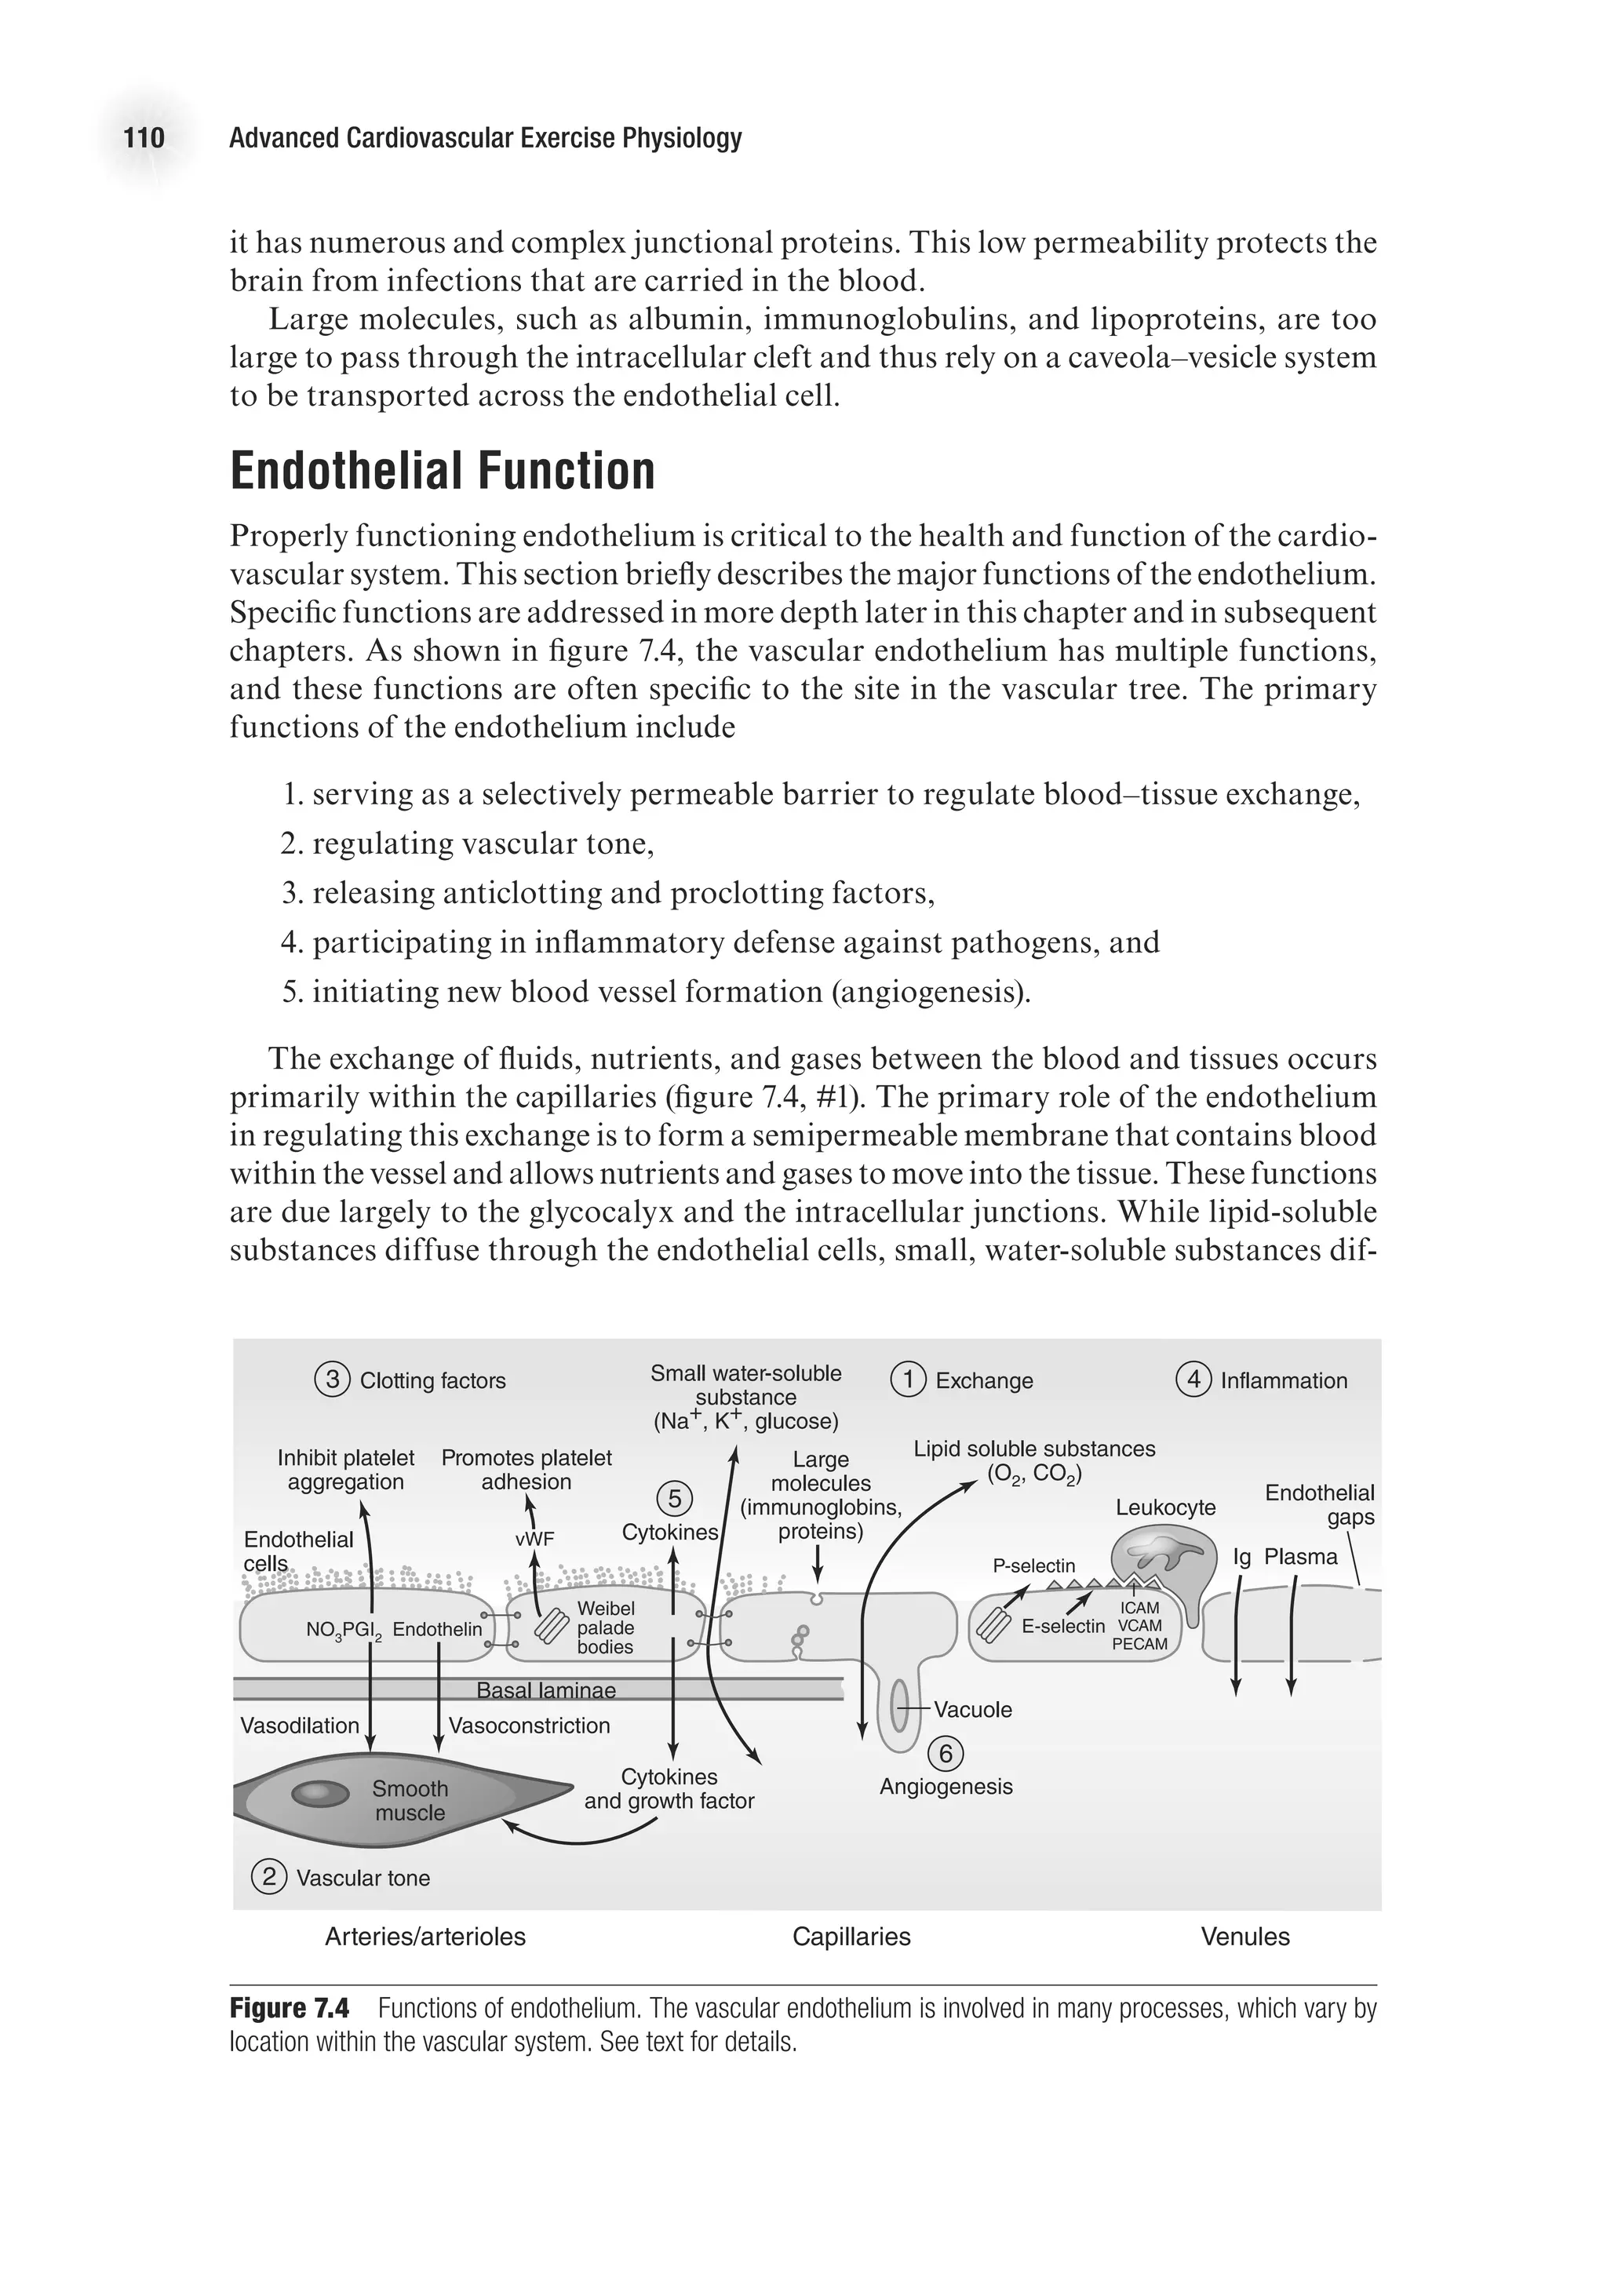


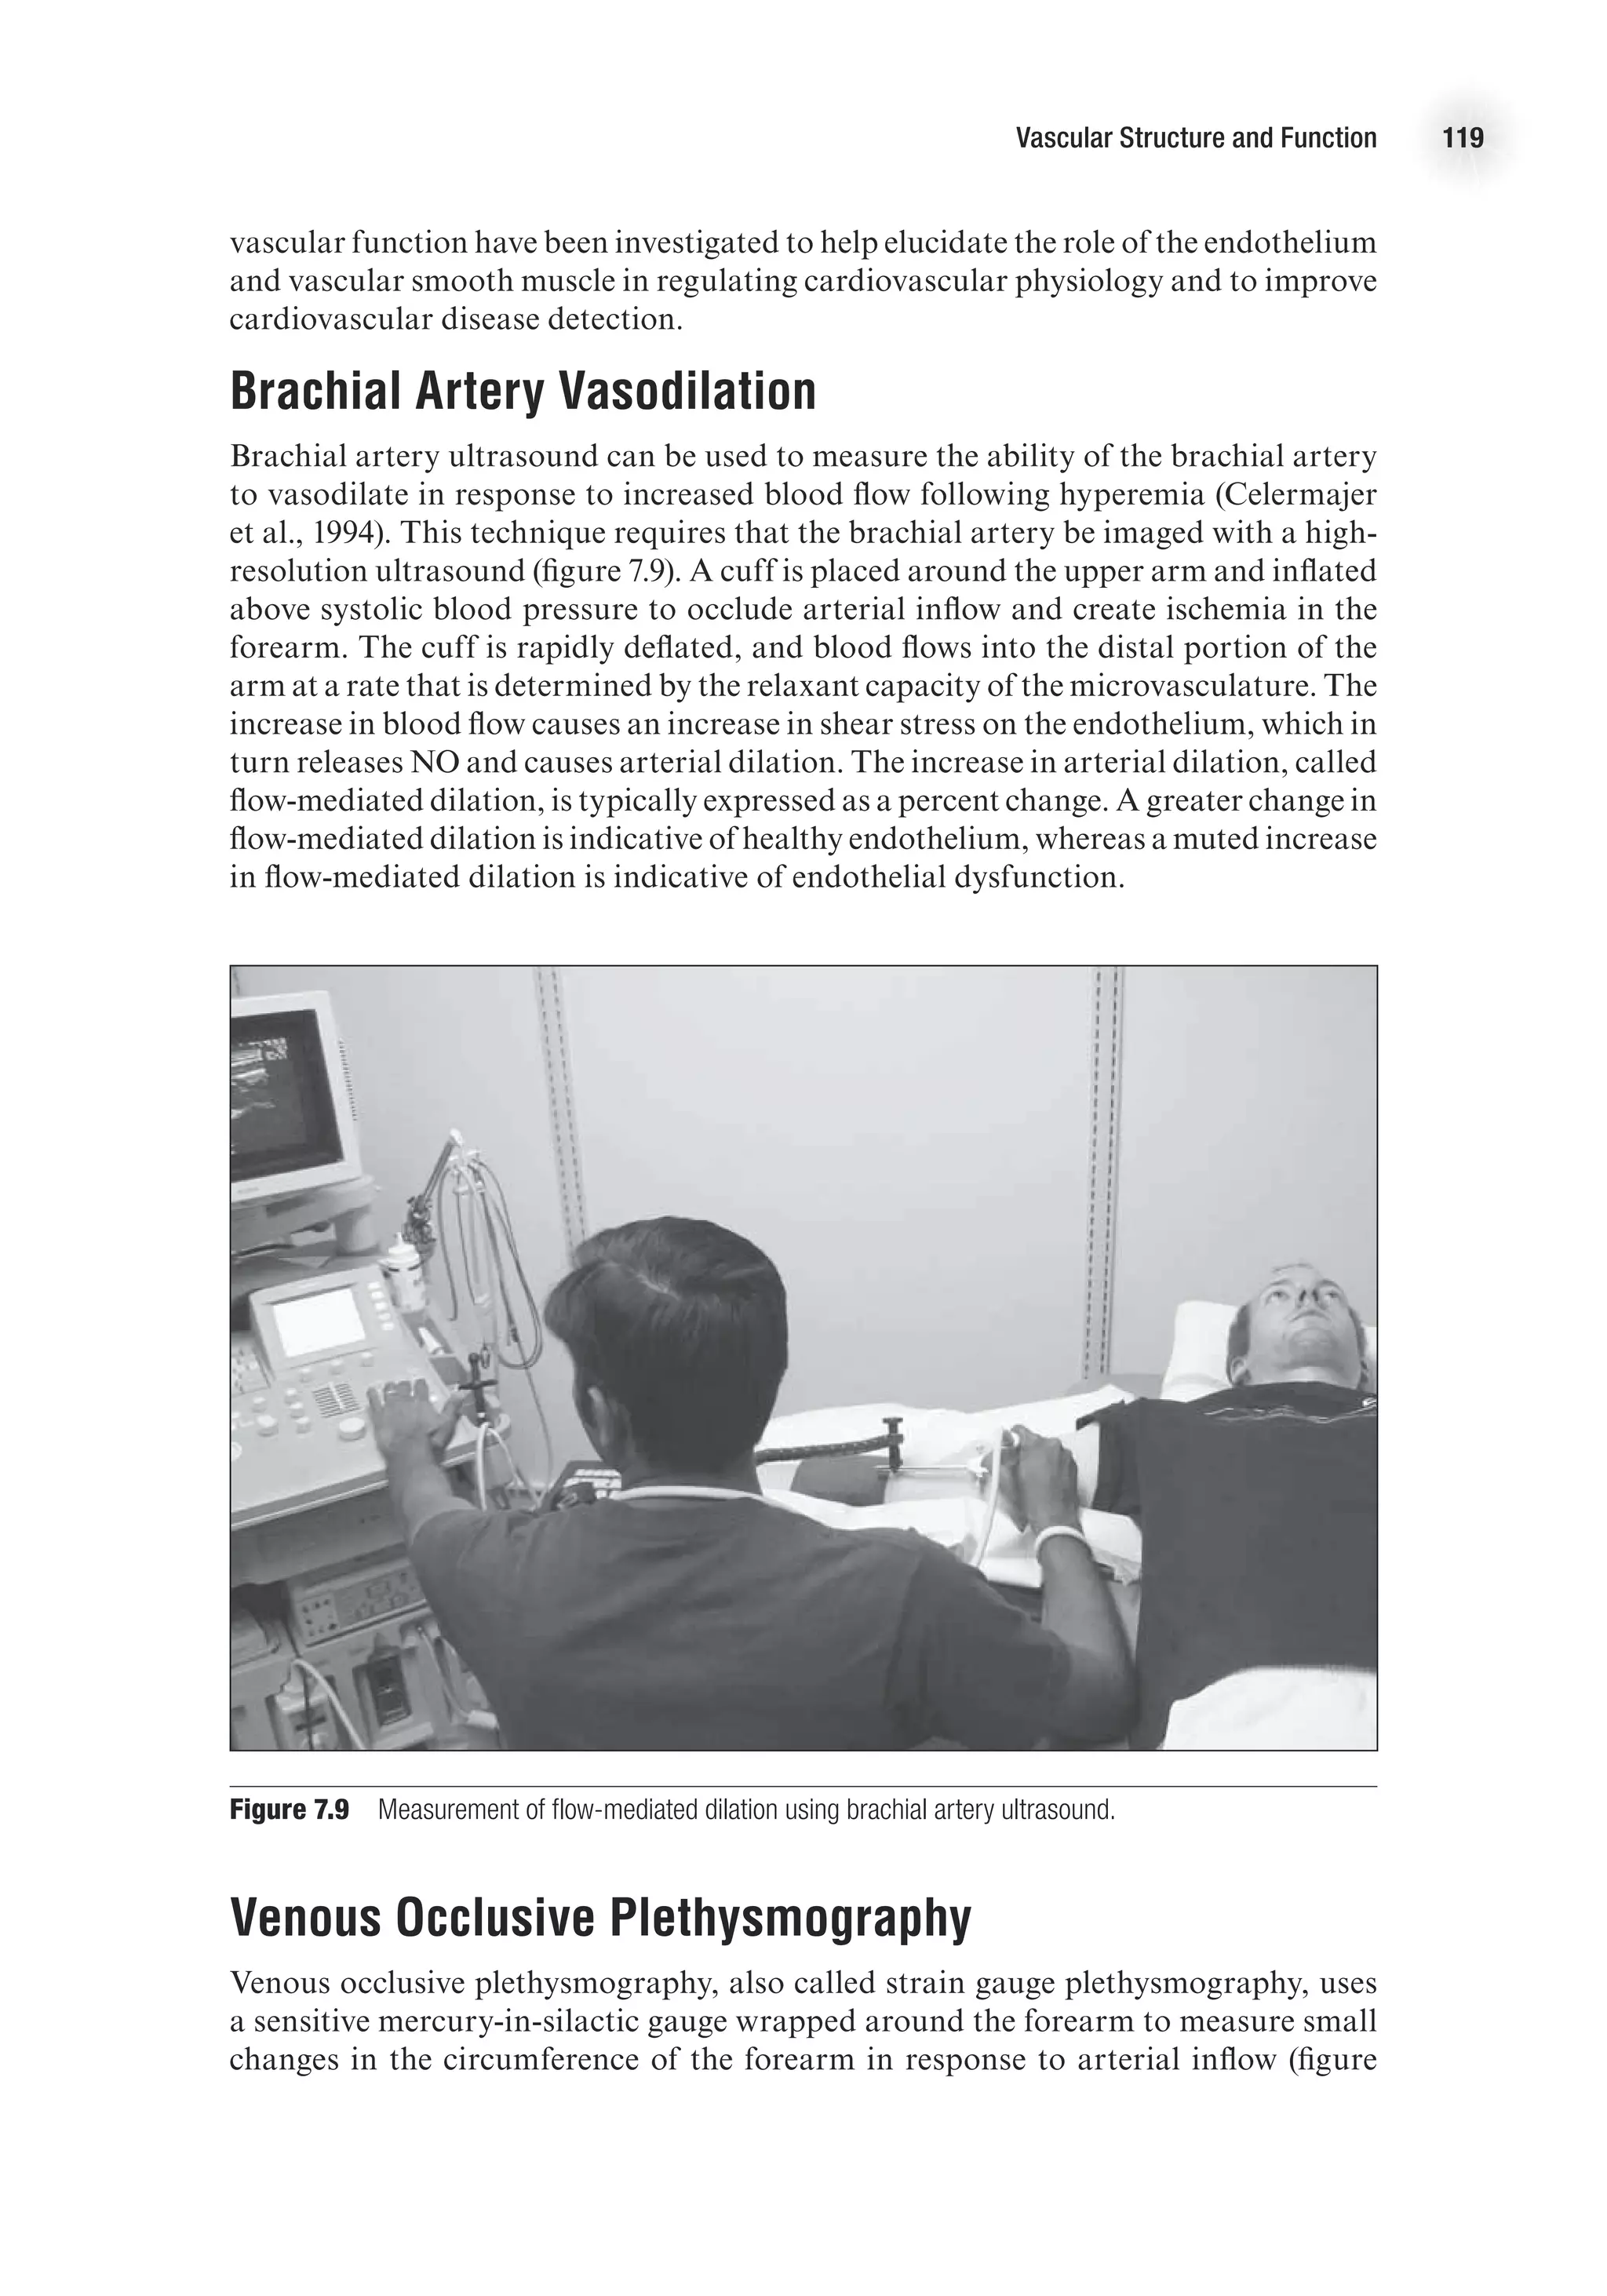
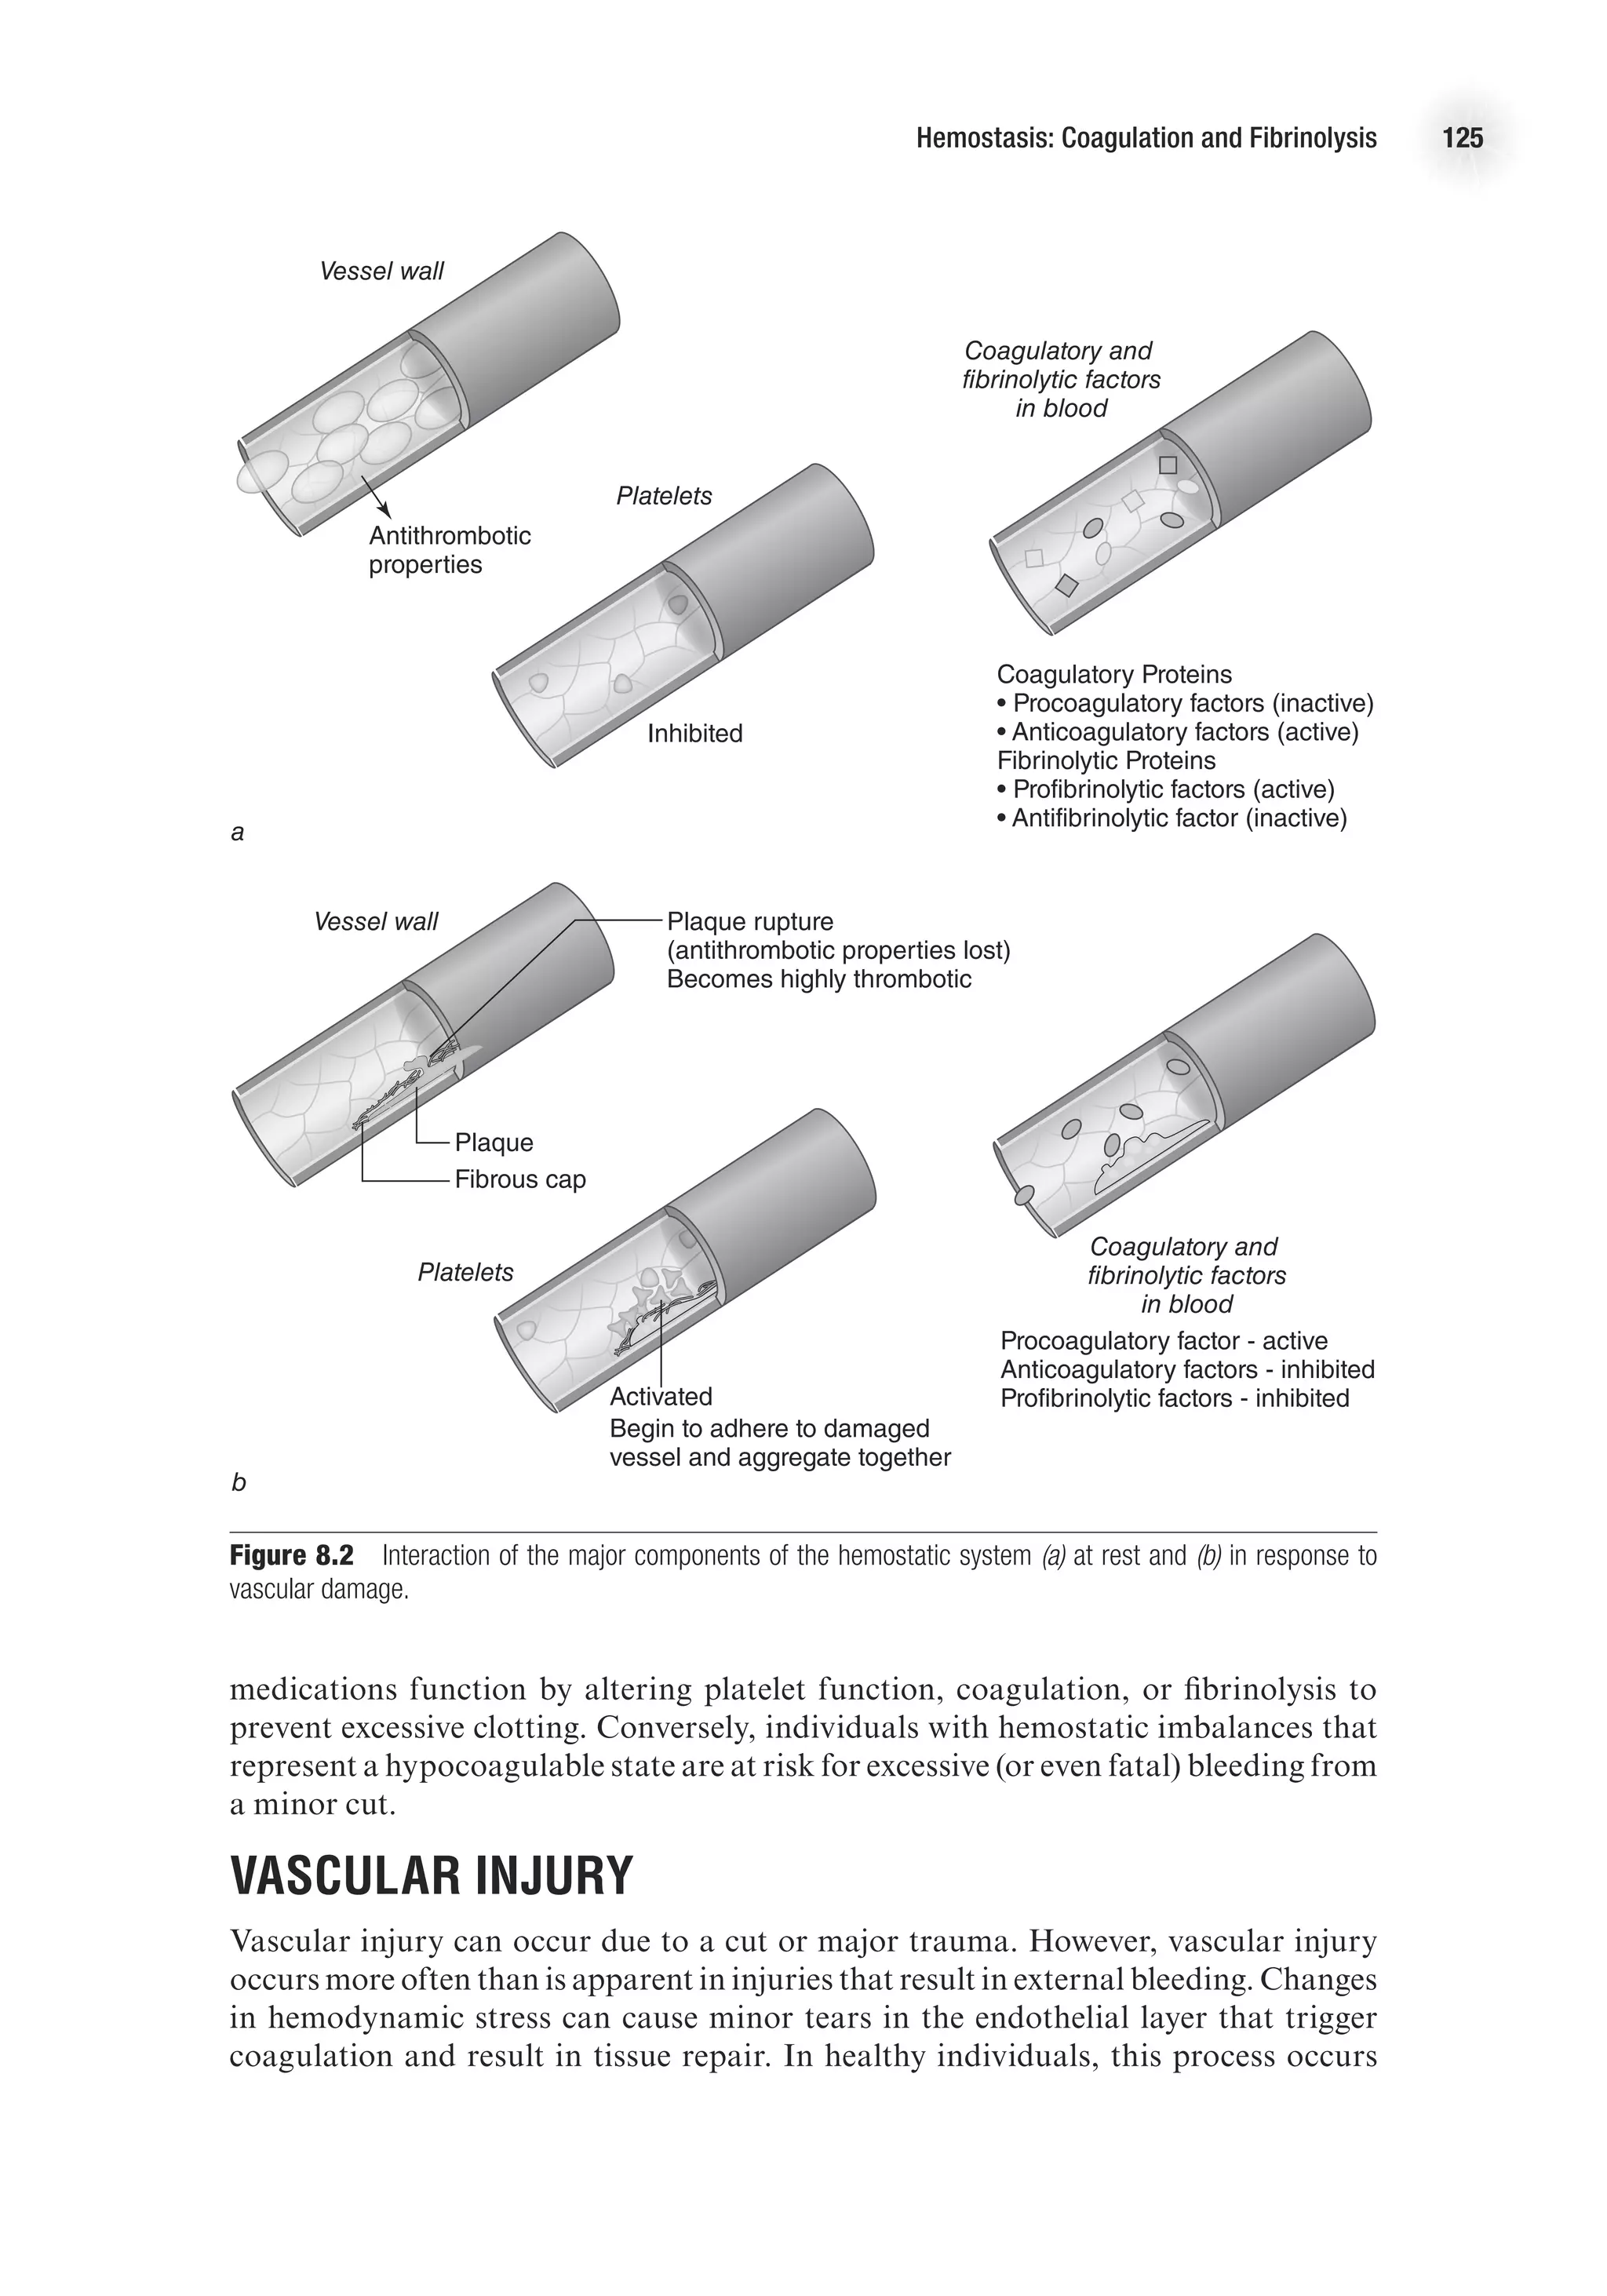
![Vascular Structure and Function 115
in small vessels. Prostacyclin (PGI2
) also contributes to smooth muscle relaxation.
Prostacyclin production is initiated by agonist binding to endothelial receptors and
is not as sustained as NO production.
Endothelin is a potent vasoconstrictor released from the endothelium, causing a
sustained vasoconstriction (2-3 h). There are many isoforms of endothelin in the human
body; endothelin-1 (ET-1) is the most prevalent. Under normal conditions, endothelin
is synthesized at low basal rates. Endothelin release is stimulated by angiotensin II,
antidiuretic hormone, thrombin, cytokines, reactive oxygen species, and shear stress-
induced integrin stimulation. Conversely, prostacylin and atrial natriuretic peptide
inhibit ET-1 release. Endothelin levels are often elevated in patients with cardiovas-
cular disease (Levick, 2003).
There are complex interactions between NO and endothelin in the regulation of vas-
cular smooth muscle tone. The binding of endothelin to its receptor stimulates eNOS,
and it appears that NO modulates the endothelin-mediated contraction of vascular
smooth muscle. Furthermore, NO inhibits endothelin activity. Thus, endothelin and
NO are continuously acting on vascular smooth muscle cells in a coordinated way to
produce finely tuned changes in vessel diameter (figure 7.6).
E4414/Smith/Fig.7.06/349997/ARecher/R2
Angiotensin II
ADH
Thrombin
Reactive oxygen species
Endothelin
(ET-1)
L-arginine
Arachidonic acid
Prostaglandin (PG 2)
Citrulline
NO EDHF
Relaxation
Relaxation
Relaxation
Constriction
Figure 7.6 Regulation of vascular tone by endothelial factors. Vascular tone represents a balance of influence
from vasodilatory and vasoconstrictor mediators released from the endothelium.
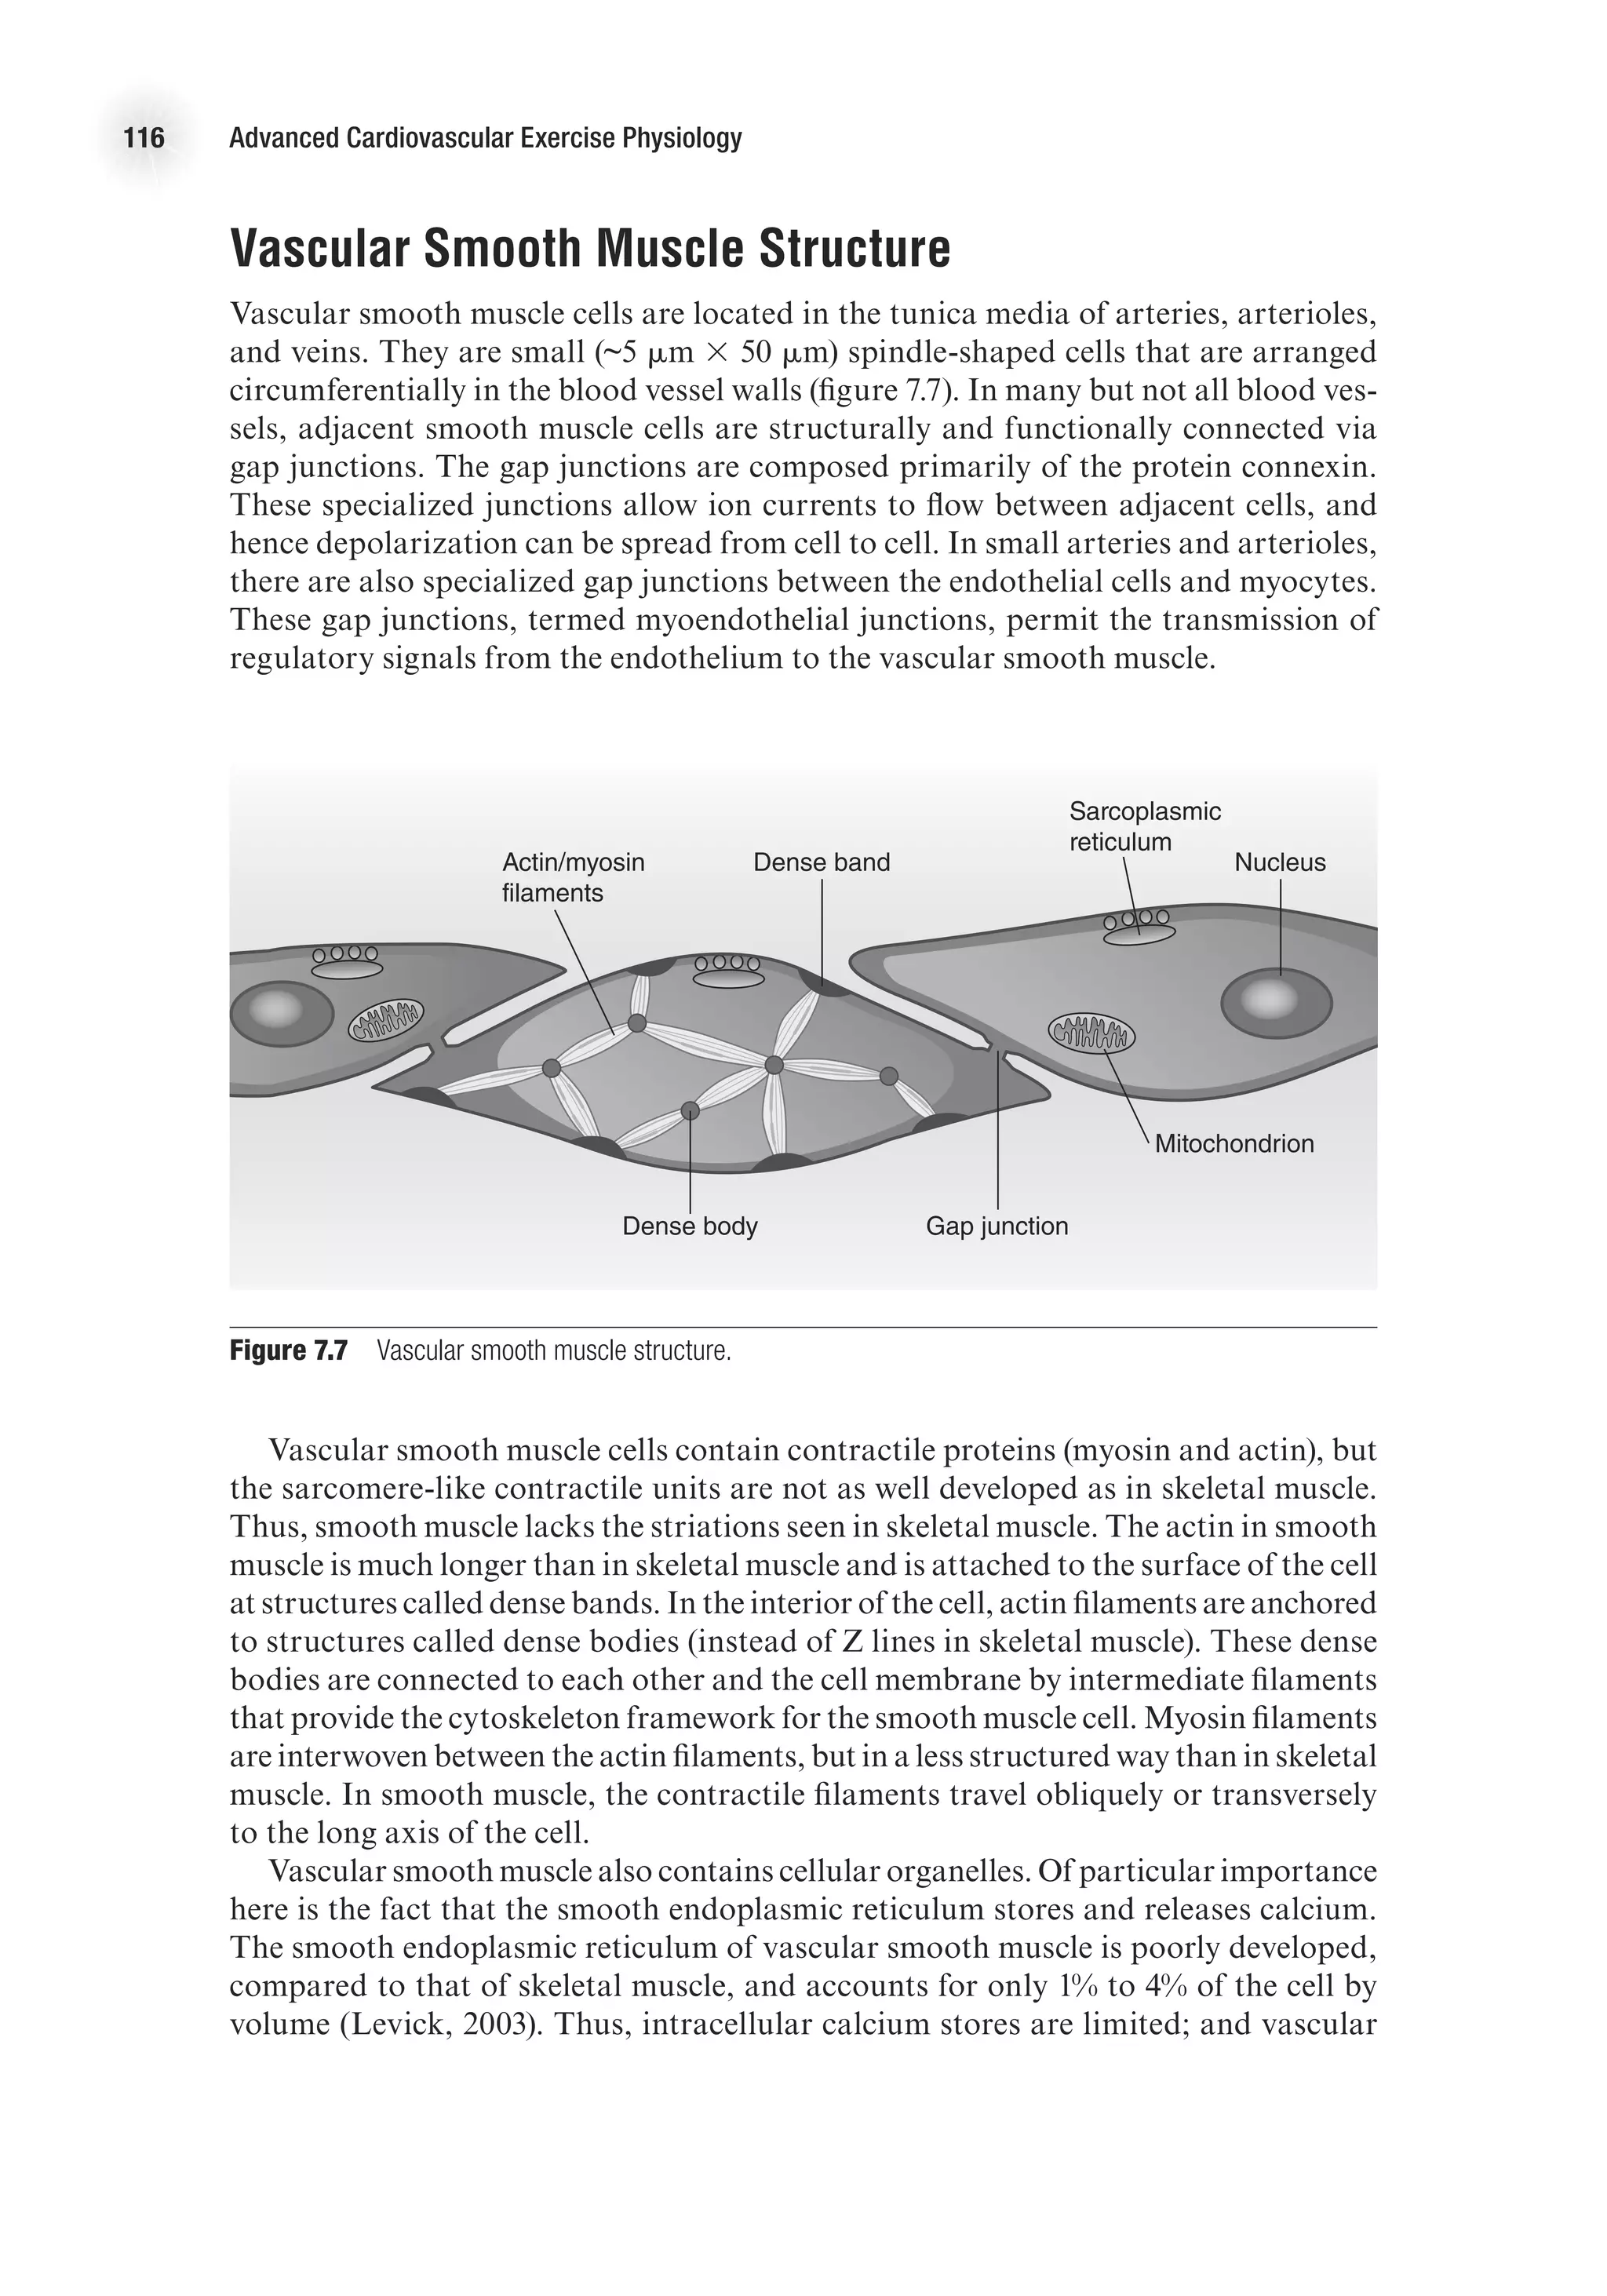
Vascular Smooth Muscle
It is the degree of contraction of smooth muscle that determines vessel diameter and
blood flow to an organ. Furthermore, the extent of smooth muscle contraction deter-
mines total peripheral resistance and has a large influence on blood pressure. (Recall
that mean arterial pressure equals cardiac output times total peripheral resistance
[MAP = Q
.
3 TPR]). To provide a better understanding of vascular smooth muscle,
a review of the structure of smooth muscle follows.](https://image.slidesharecdn.com/advancedcardiovascularexercites-220106230013/75/Advanced-cardiovascular-exercites-129-2048.jpg)
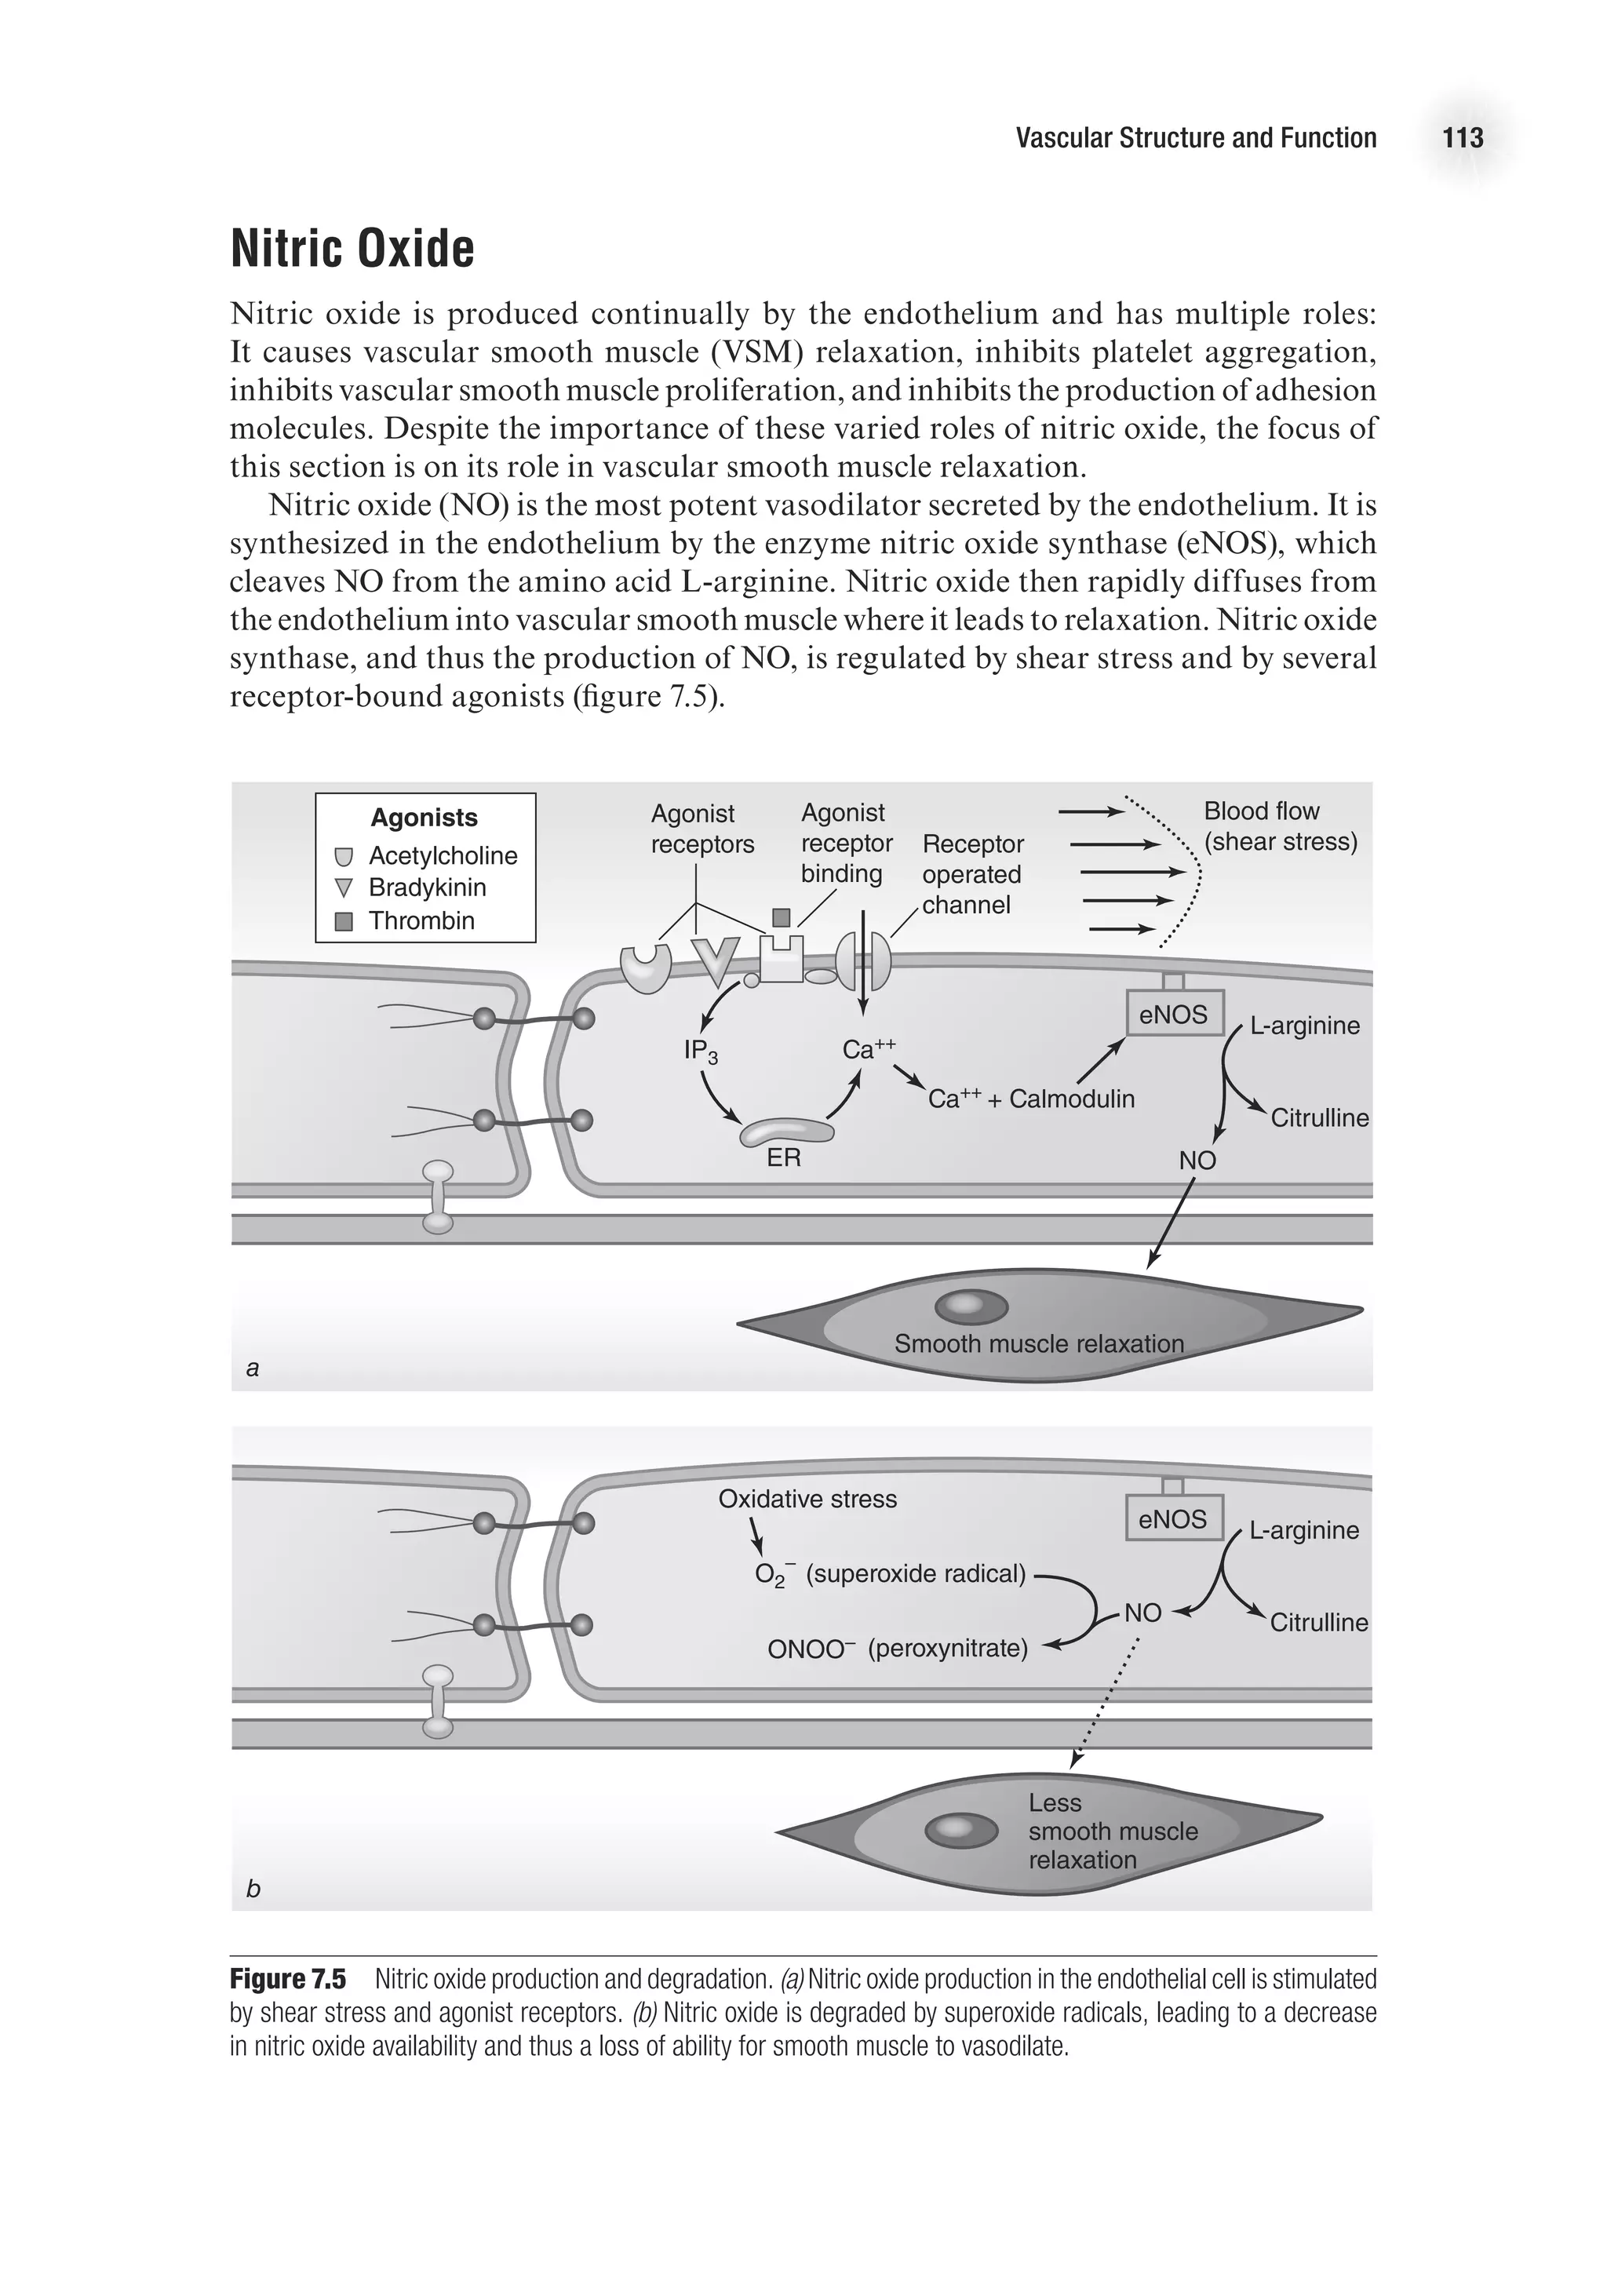
![118 Advanced Cardiovascular Exercise Physiology
the second messenger cyclic adenosine monophosphate (cAMP) or cyclic guanosine
monophosphate (cGMP). Nitric oxide, the primary signal for vascular smooth muscle
relaxation, initiates relaxation via the cGMP pathway. Nitric oxide stimulates the
enzyme guanylyl cyclase, which converts guanosine triphosphate (GTP) to cGMP.
Cyclic GMP then activates several kinases. These kinases stimulate calcium pump
activity, which decreases sarcoplasmic calcium levels, thus decreasing cross-bridge
formation and leading to muscle relaxation.
Measuring Endothelial
and Vascular Function
Endothelial dysfunction and impairment in vasodilation is an early indicator of
cardiovascular disease and a predictor of cardiovascular events. Thus, assessing
vascular function is of great interest to researchers and clinicians. Clinicians are
especially motivated by the desire to detect vulnerable individuals before the onset
of symptoms. Given that sudden cardiac death or myocardial infarction is the first
presentation of cardiovascular disease over 50% of the time, it is critically important
to be able to identify those at greatest risk (Zipes, 1998). The traditional approach
of measuring the number and extent of traditional risk factors, as is done with the
Framingham risk score, and categorizing individuals based on a 10-year risk of
myocardial infarction, is popular but problematic. In one study of adults under 65
years who had had a myocardial infarct, only 25% met the criteria for preventive
treatment the day before their event (Akosah et al., 2003). Therefore, measures of
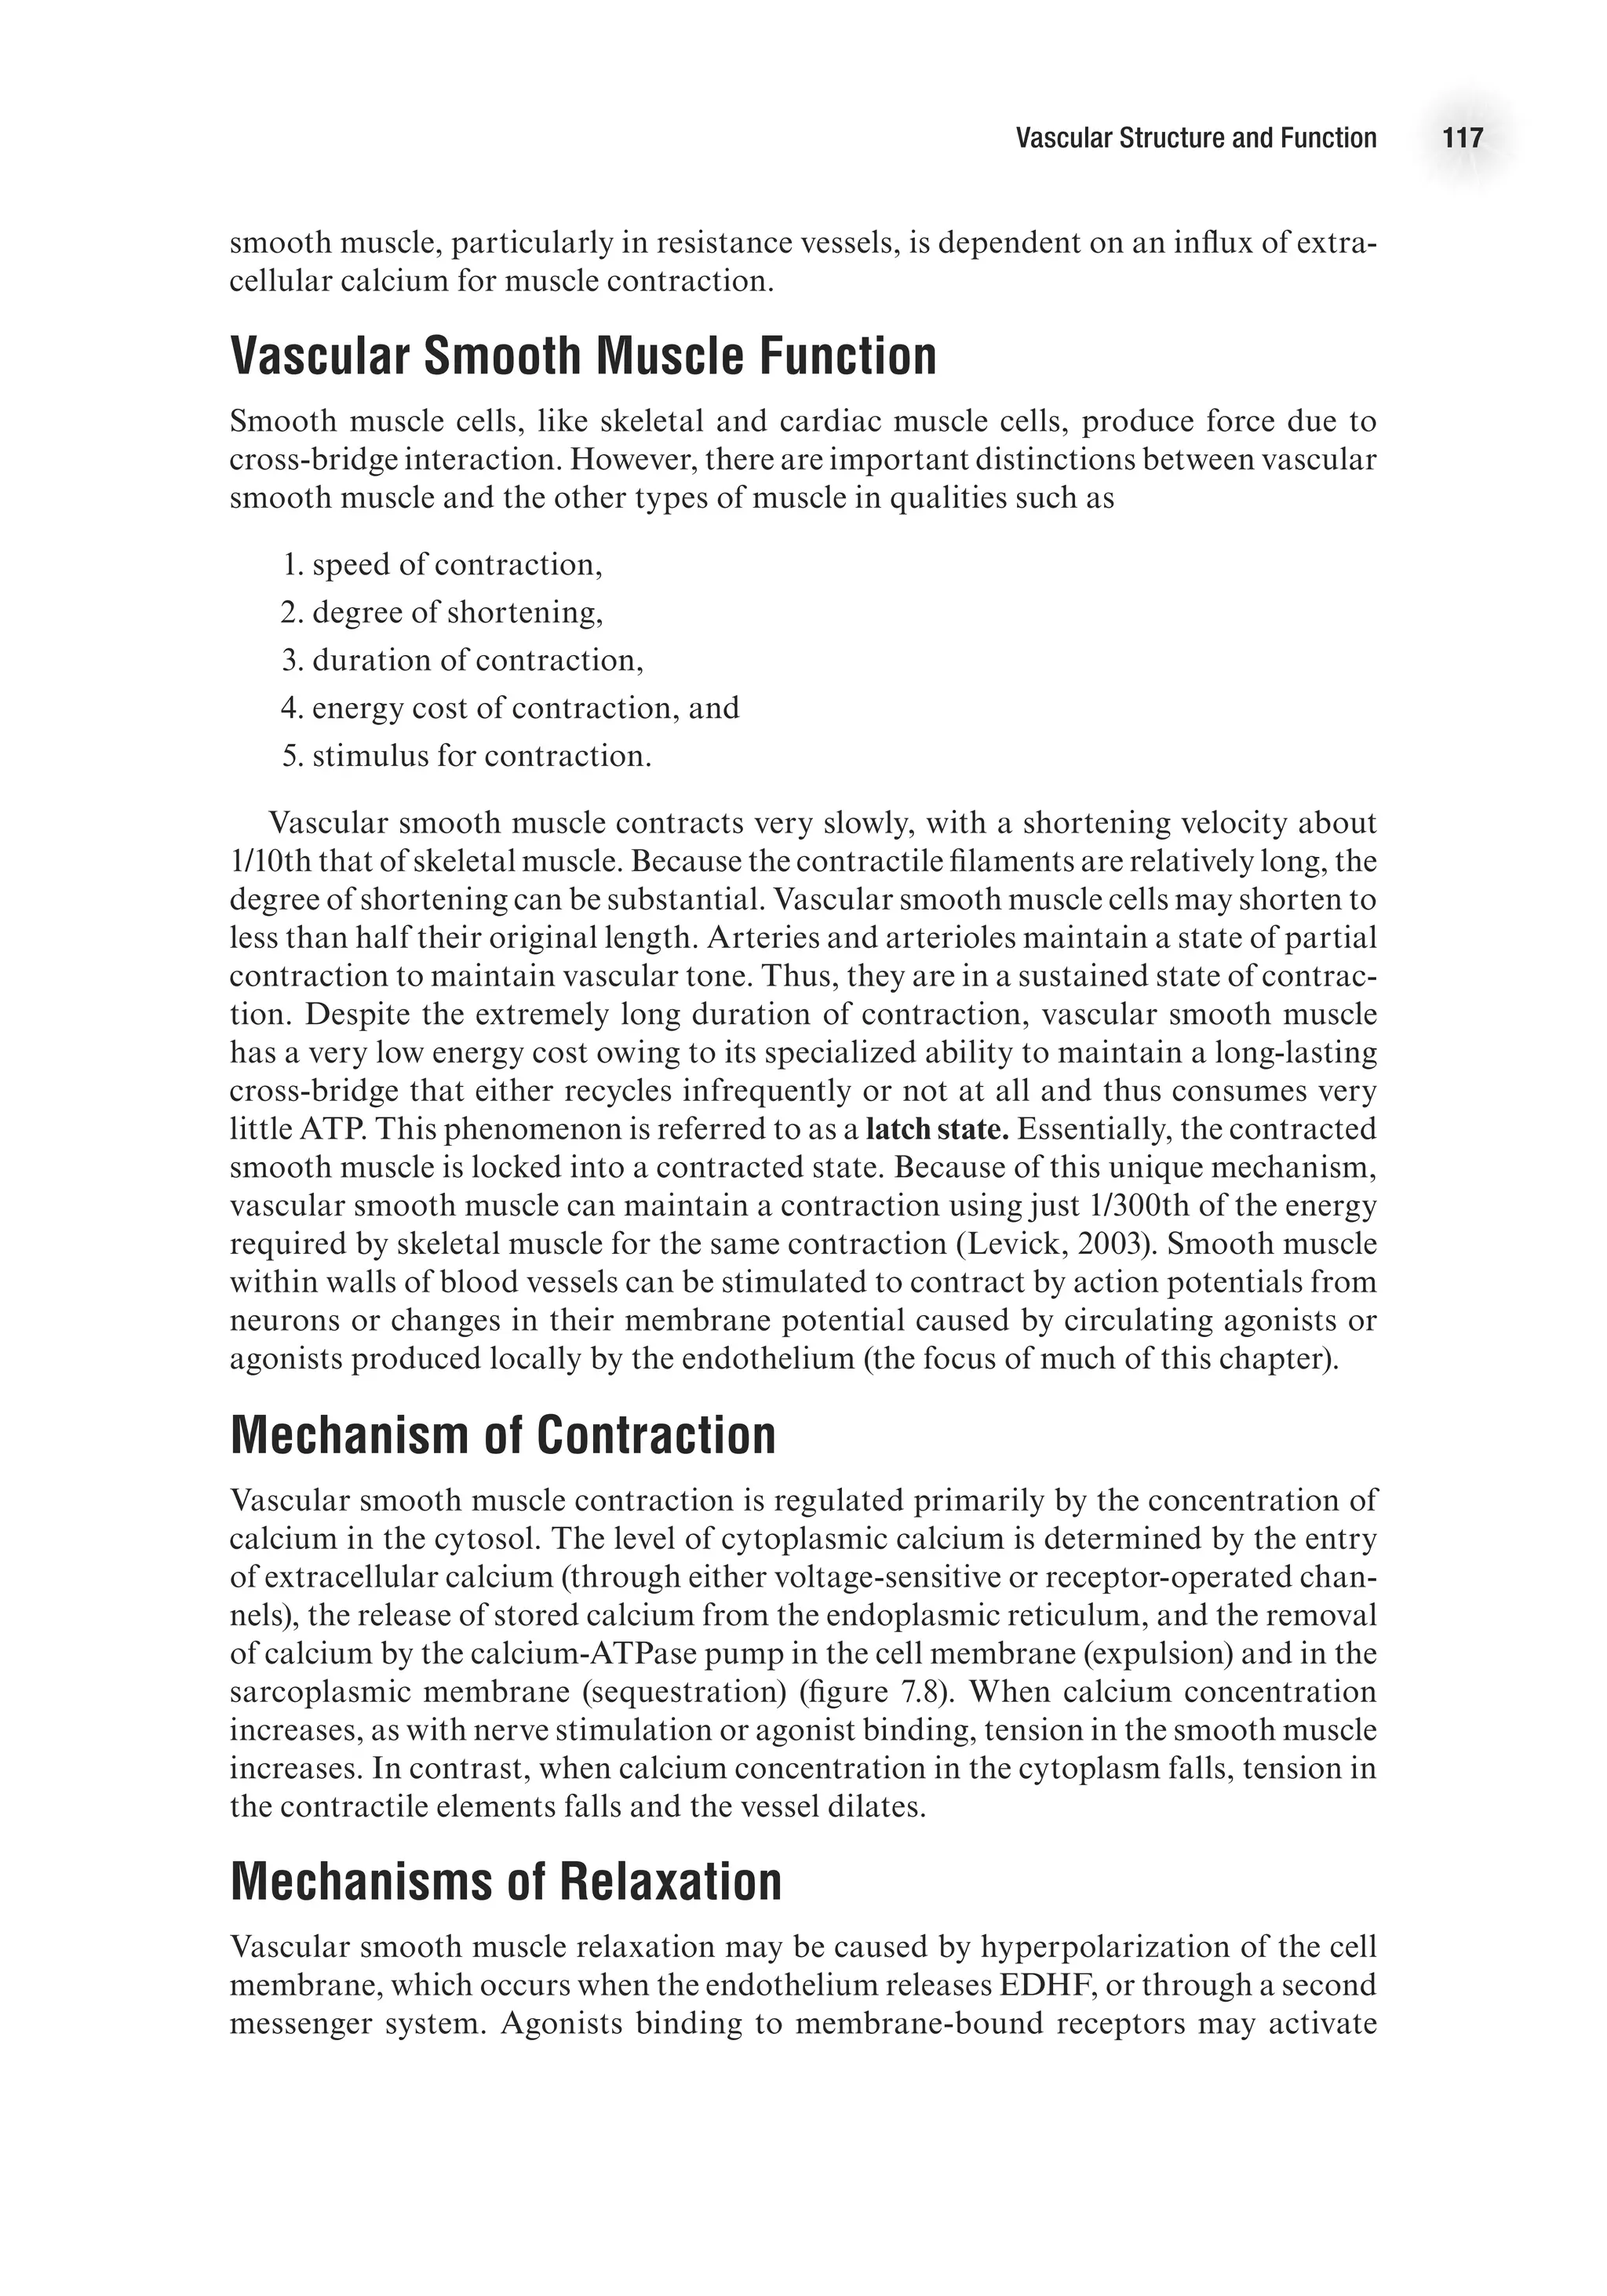
E4414/Smith/Fig.7.08/349999/ARecher/R2
Sarcoplasmic
reticulum
Sarcoplasmic
reticulum
Receptor
operated
channel
Voltage
operated
channel
IP3
Ca++
Ca++
Ca++
expulsion
Ca++
sequestering
Ca++
-ATPase pump
Vascular
smooth
muscle
Ca++
[Ca++]
Receptor
Vasoconstricting
agonist
G protein
Figure 7.8 Vascular smooth muscle contraction. Vascular smooth muscle tone is primarily determined by
intracellular calcium levels.](https://image.slidesharecdn.com/advancedcardiovascularexercites-220106230013/75/Advanced-cardiovascular-exercites-132-2048.jpg)


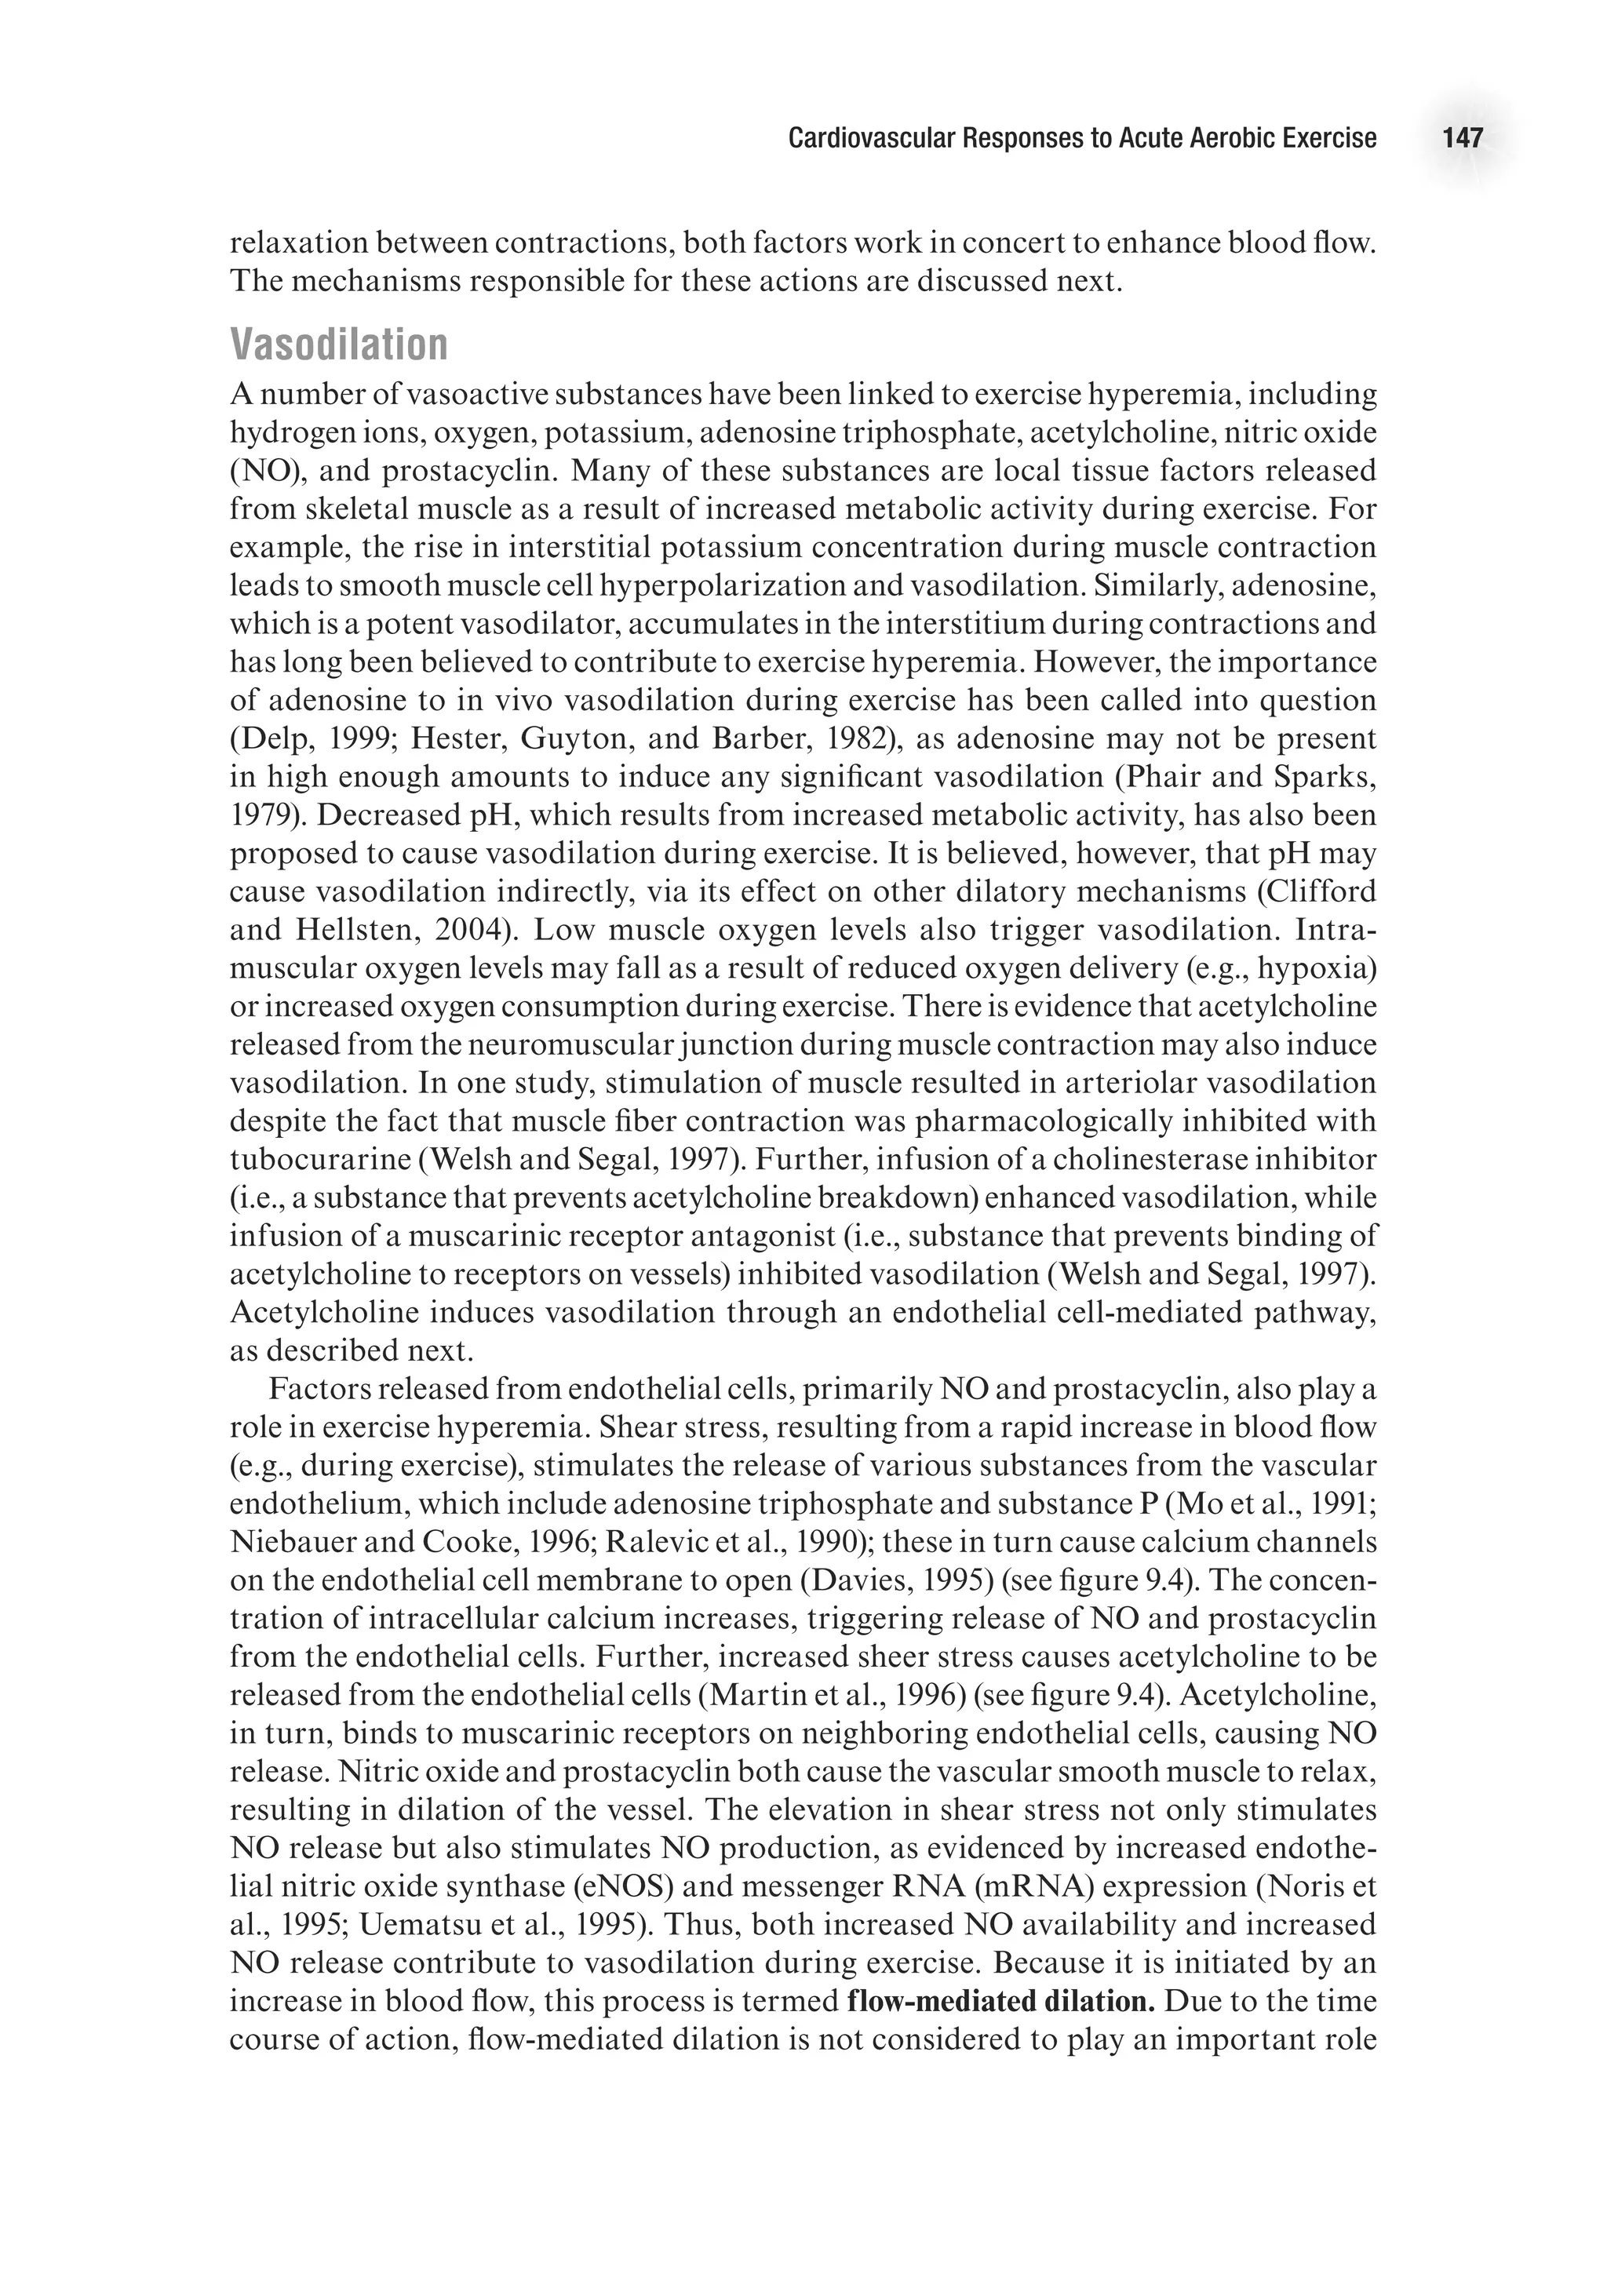


![Cardiovascular Responses to Acute Aerobic Exercise 151
decreased speed, or increased speed and decreased grade), muscle blood flow changes
were coupled to changes in speed (or contraction frequency) rather than changes in
grade. These observations are consistent with the muscle pump theory that it is the
repetitive contraction–relaxation cycle that aids blood flow.
Other investigators argue against the role of a muscle pump in exercise hyperemia
and suggest that rapid vasodilation is responsible for the initial hyperemic response
during exercise. Support for this theory comes from studies in which blood flow at
the onset of exercise was observed to be related to contraction intensity (Shoemaker,
Tschakovsky, and Hughson, 1998), even under conditions in which the contribution
of a potential muscle pump was minimized experimentally (Tschakovsky et al., 2004).
Also, studies in which maximal vasodilation is induced pharmacologically, prior
to exercise, show no additional rise in blood flow upon commencement of exercise
(Hamann et al., 2003), which would be expected if a muscle pump contributed to the
rise in blood flow. It is possible, however, that under high flow conditions, venous filling
is too rapid to take advantage of a muscle pump. Further support of the vasodilatory
theory comes from observations in stimulated animal muscle of
1. rapid dilation of terminal arterioles (~2 s within start of exercise [Marshall and
Tandon, 1984]) and
2. loss of initial hyperemia when smooth muscle cell hyperpolarization, and
therefore vasodilation, is experimentally inhibited (Hamann, Buckwalter, and
Clifford, 2004).
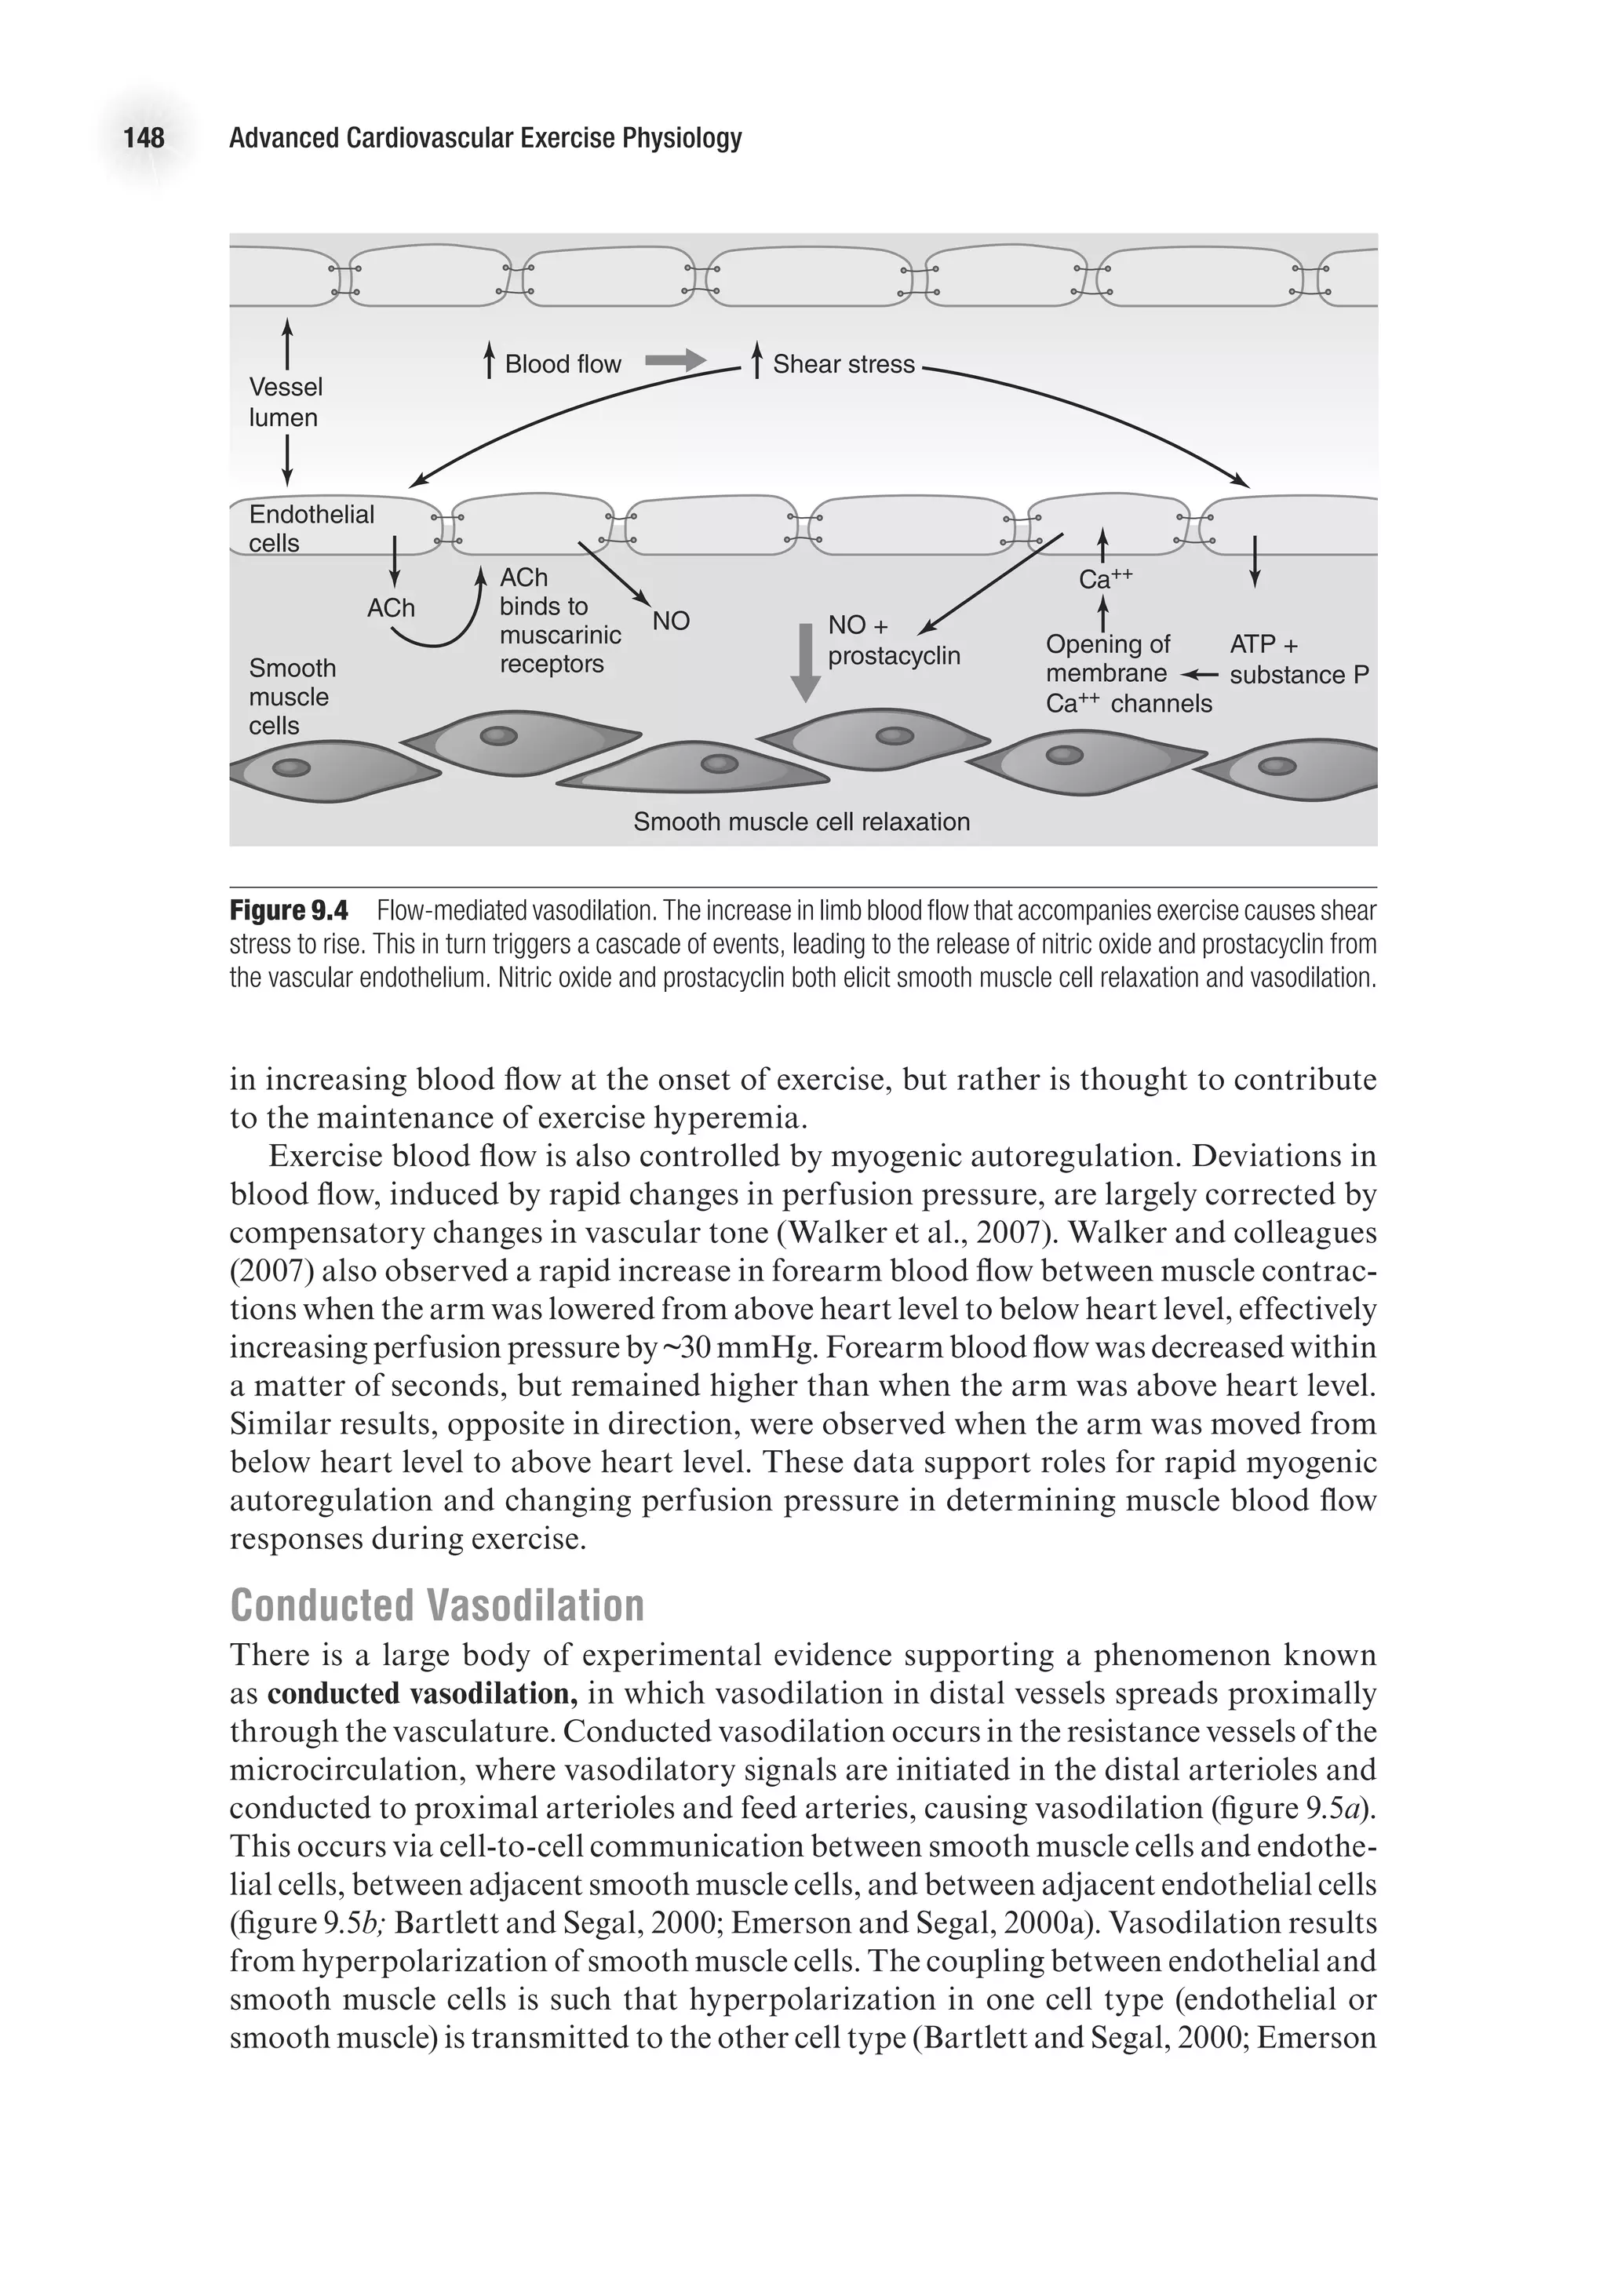
Matching Perfusion to Muscle Activity
There is a tight coupling between muscle perfusion and metabolic activity, which
causes an increase in perfusion to active muscle that is proportional to exercise
intensity. As muscle activity increases, more vasoactive substances are released from
the muscle and endothelial cells, resulting in a greater reduction in resistance and
increased blood flow. Thus, the muscle facilitates an increase in oxygen delivery to
meet the rising metabolic demands of the muscle during exercise. From this scenario,
it would appear that individual muscle fibers regulate their own flow; the picture,
however, is not that simple. This section details what happens in the microcirculation
during exercise and how this affects the coupling of muscle activity and perfusion.
Arterioles branch into capillaries, which are the site for gas exchange between the
blood and the muscle fibers. The smallest and most distal of the arterioles are referred
to as terminal arterioles, and they control which capillaries are perfused. Each ter-
minal arteriole and the capillaries it supplies is called a microvascular unit. Dilation
of a terminal arteriole causes the capillaries in that microvascular unit to become
perfused. Capillary perfusion here is defined as the number of capillaries receiving
blood flow, rather than the rate of flow through the capillaries.
During exercise, capillary perfusion increases in proportion to the amount of active
muscle mass. Vasoactive signals released from active muscle fibers will cause dilation
of adjacent terminal arterioles and perfusion of microvascular units. This would
appear to be a good system for tightly matching capillary perfusion to individual
muscle fiber metabolic demand. The organization of microvascular and motor units
in skeletal muscle, however, precludes this arrangement. Microvascular units are
aligned such that capillaries in one microvascular unit are all close together (figure](https://image.slidesharecdn.com/advancedcardiovascularexercites-220106230013/75/Advanced-cardiovascular-exercites-165-2048.jpg)


![Cardiovascular Adaptations to Aerobic Training 169
increase in SBP and a slight decrease in DBP at maximal exercise, such that MAP is
unchanged (Wilmore et al., 2001).
Mean arterial pressure is the product of cardiac output and vascular resistance
(MAP = Q
.
3 TPR [total peripheral resistance]). Vascular remodeling, enhanced vaso-
dilatory capacity, and changes in autonomic tone with training contribute to a greater
ability to reduce vascular resistance at rest and during exercise. The mechanisms by
which vascular tone is altered with training are discussed in the next section. The
lower vascular resistance and unchanged Q
.
at rest explain the slight decrease in resting
arterial pressure following endurance training. The greater Q
.
maxfollowing training
contributes to the higher SBP at peak exercise, while the lower DBP at peak exercise
is likely the result of the lower TPR associated with training.
Muscle Blood Flow
The change in muscle blood flow following a period of endurance exercise train-
ing varies by condition. Resting muscle blood flow is unaffected by training status
(Dinenno et al., 2001). During moderate exercise (75% V
.
O2
max), muscle blood flow
at a given absolute submaximal intensity is either unchanged or reduced following
training (Delp, 1998; Proctor et al., 2001; Putman et al., 1998). Further, animal data
E4414/Smith/fig10.2b/350039/alw/r3
DBP
(mmHg)
Post-training
Pre-training
90
70
50
0 50
%VO2
max
100
·
b
E4414/Smith/fig10.2c/350040/alw/r4
MAP
(mmHg)
Pre-training
Post-training
140
120
100
80
60
0 50
%VO2
max
100
·
c
Figure 10.2 The effect of aerobic training on systolic blood pressure, diastolic blood pressure, and mean arterial
pressure during incremental exercise to maximum.
E4414/Smith/fig10.2a/350038/alw/r3
SBP
(mmHg)
Post-training
Pre-training
200
180
160
140
120
0 50
%VO2
max
100
·
a
E4414/Smith/fig10.2c/350040/alw/r4
MAP
(mmHg)
Pre-training
Post-training
140
120
100
80
60
0 50
%VO2
max
100
·
c](https://image.slidesharecdn.com/advancedcardiovascularexercites-220106230013/75/Advanced-cardiovascular-exercites-183-2048.jpg)


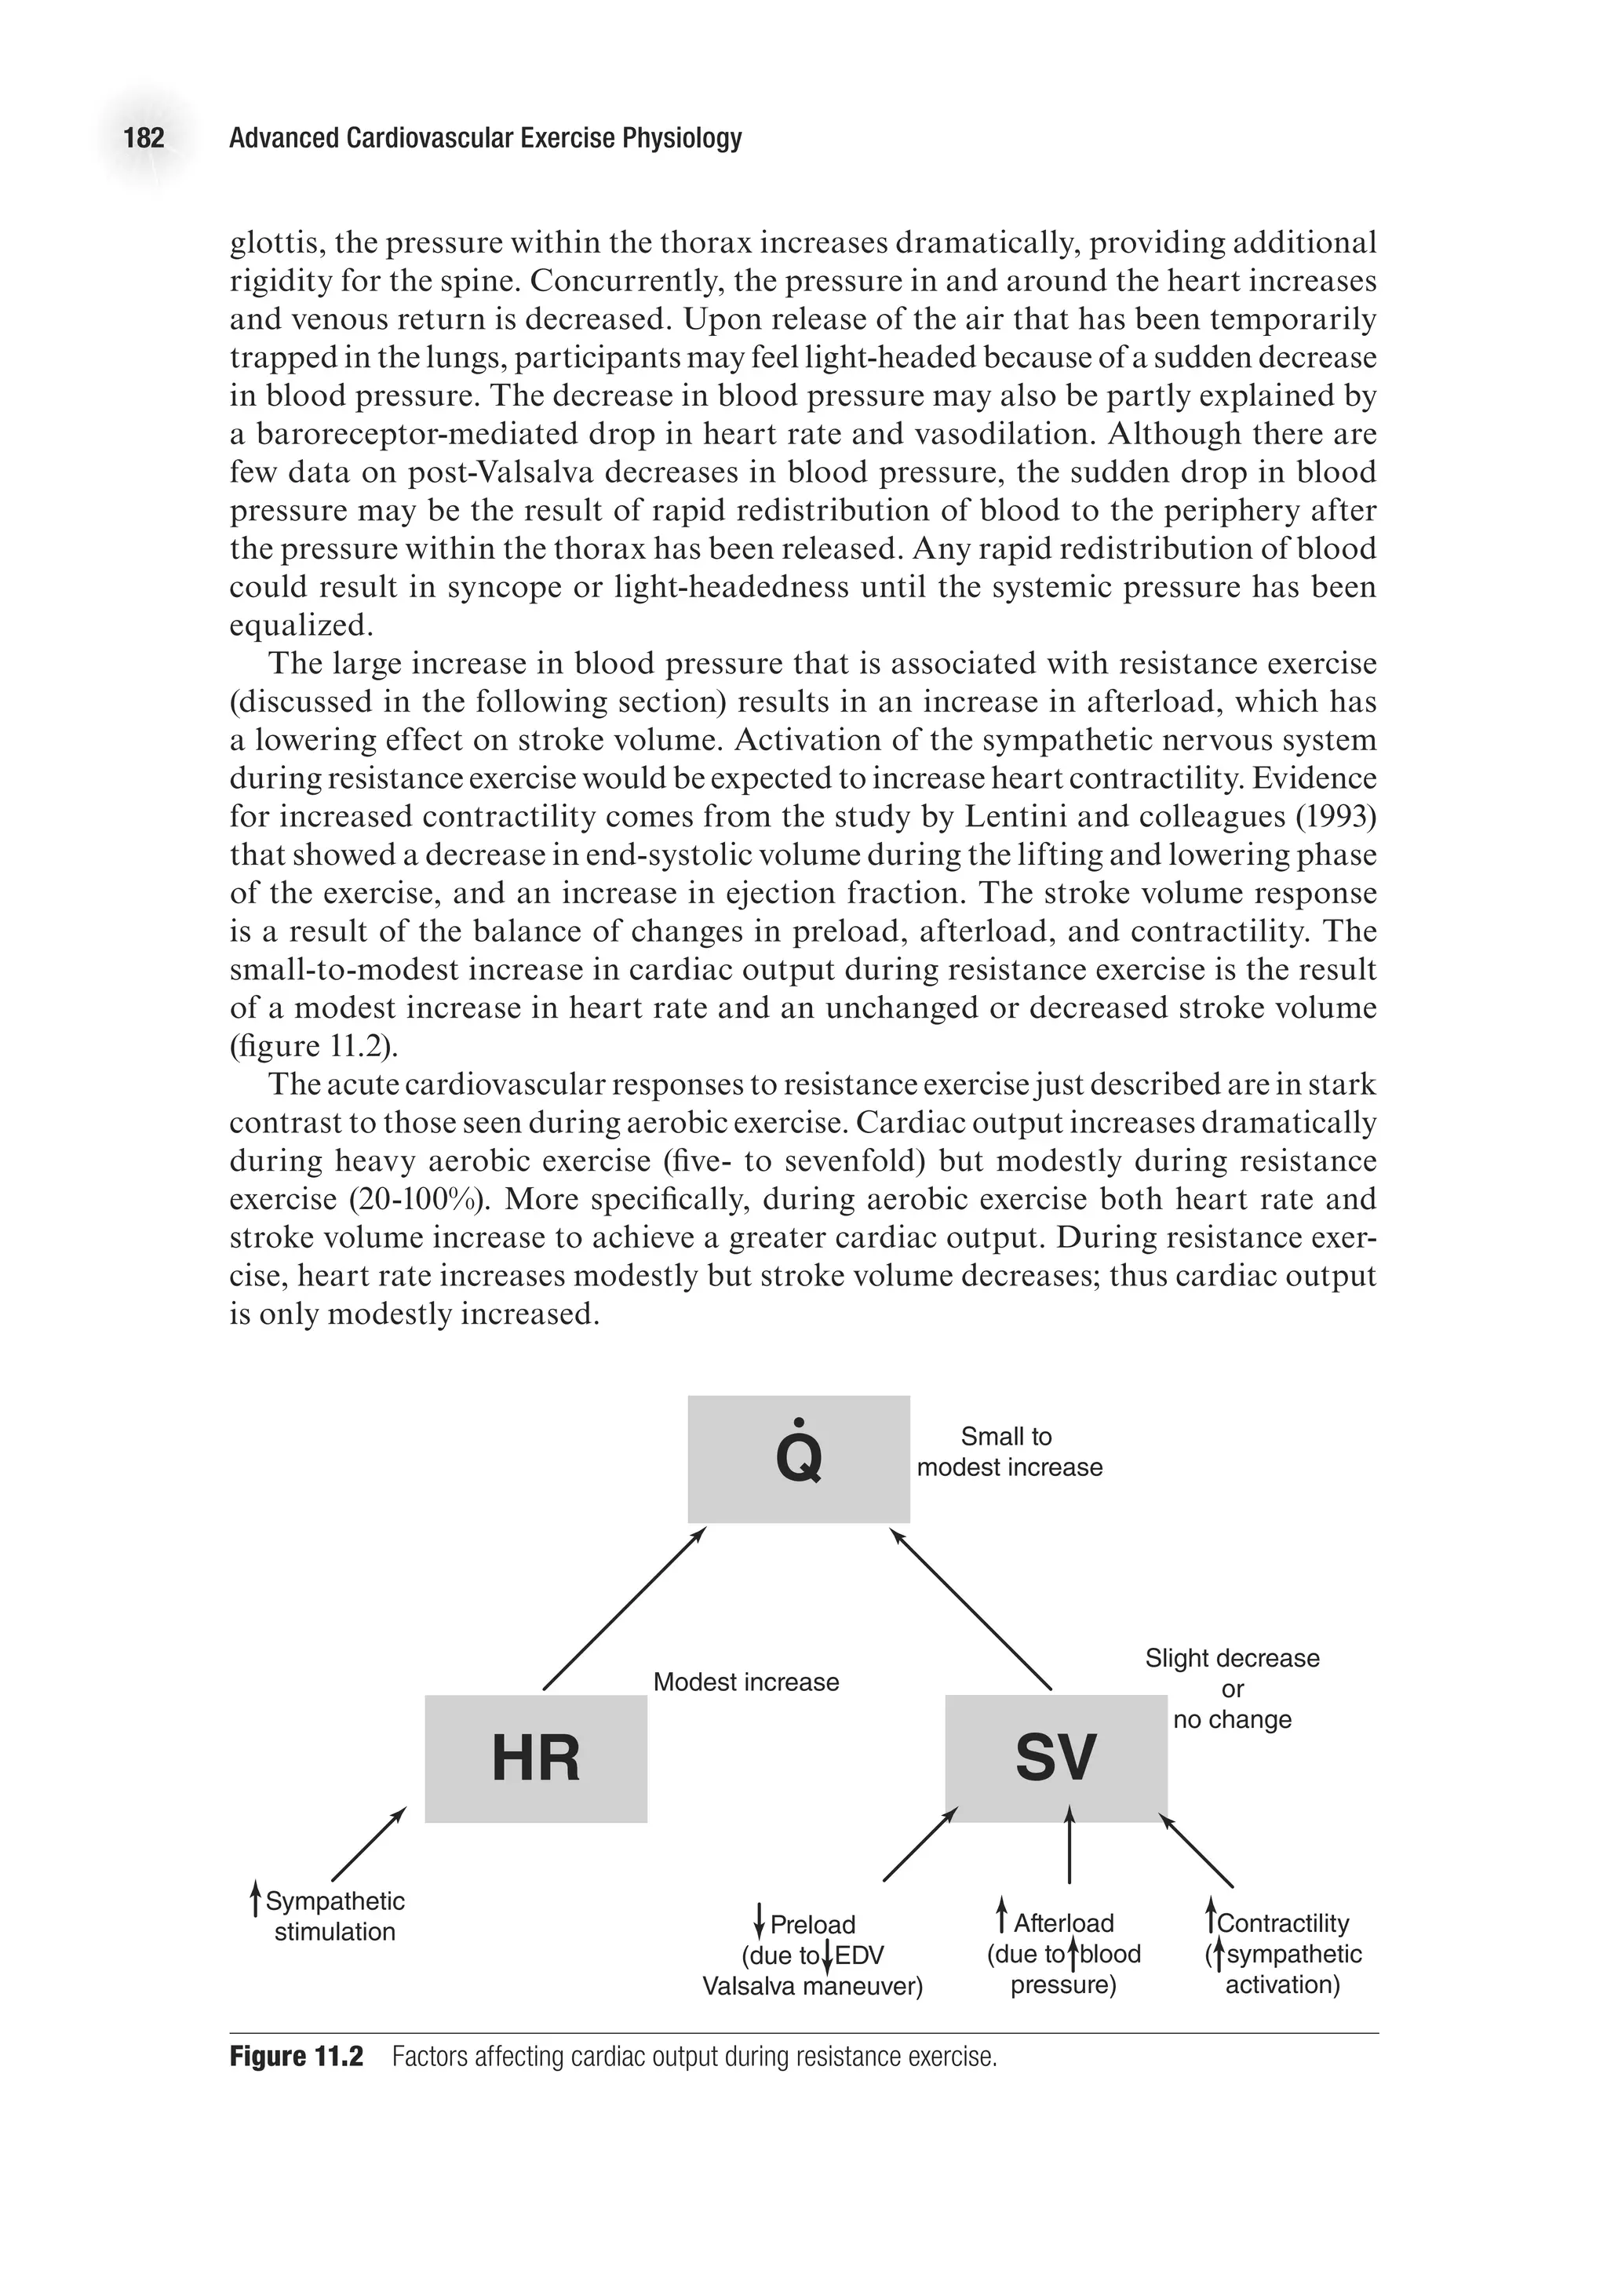
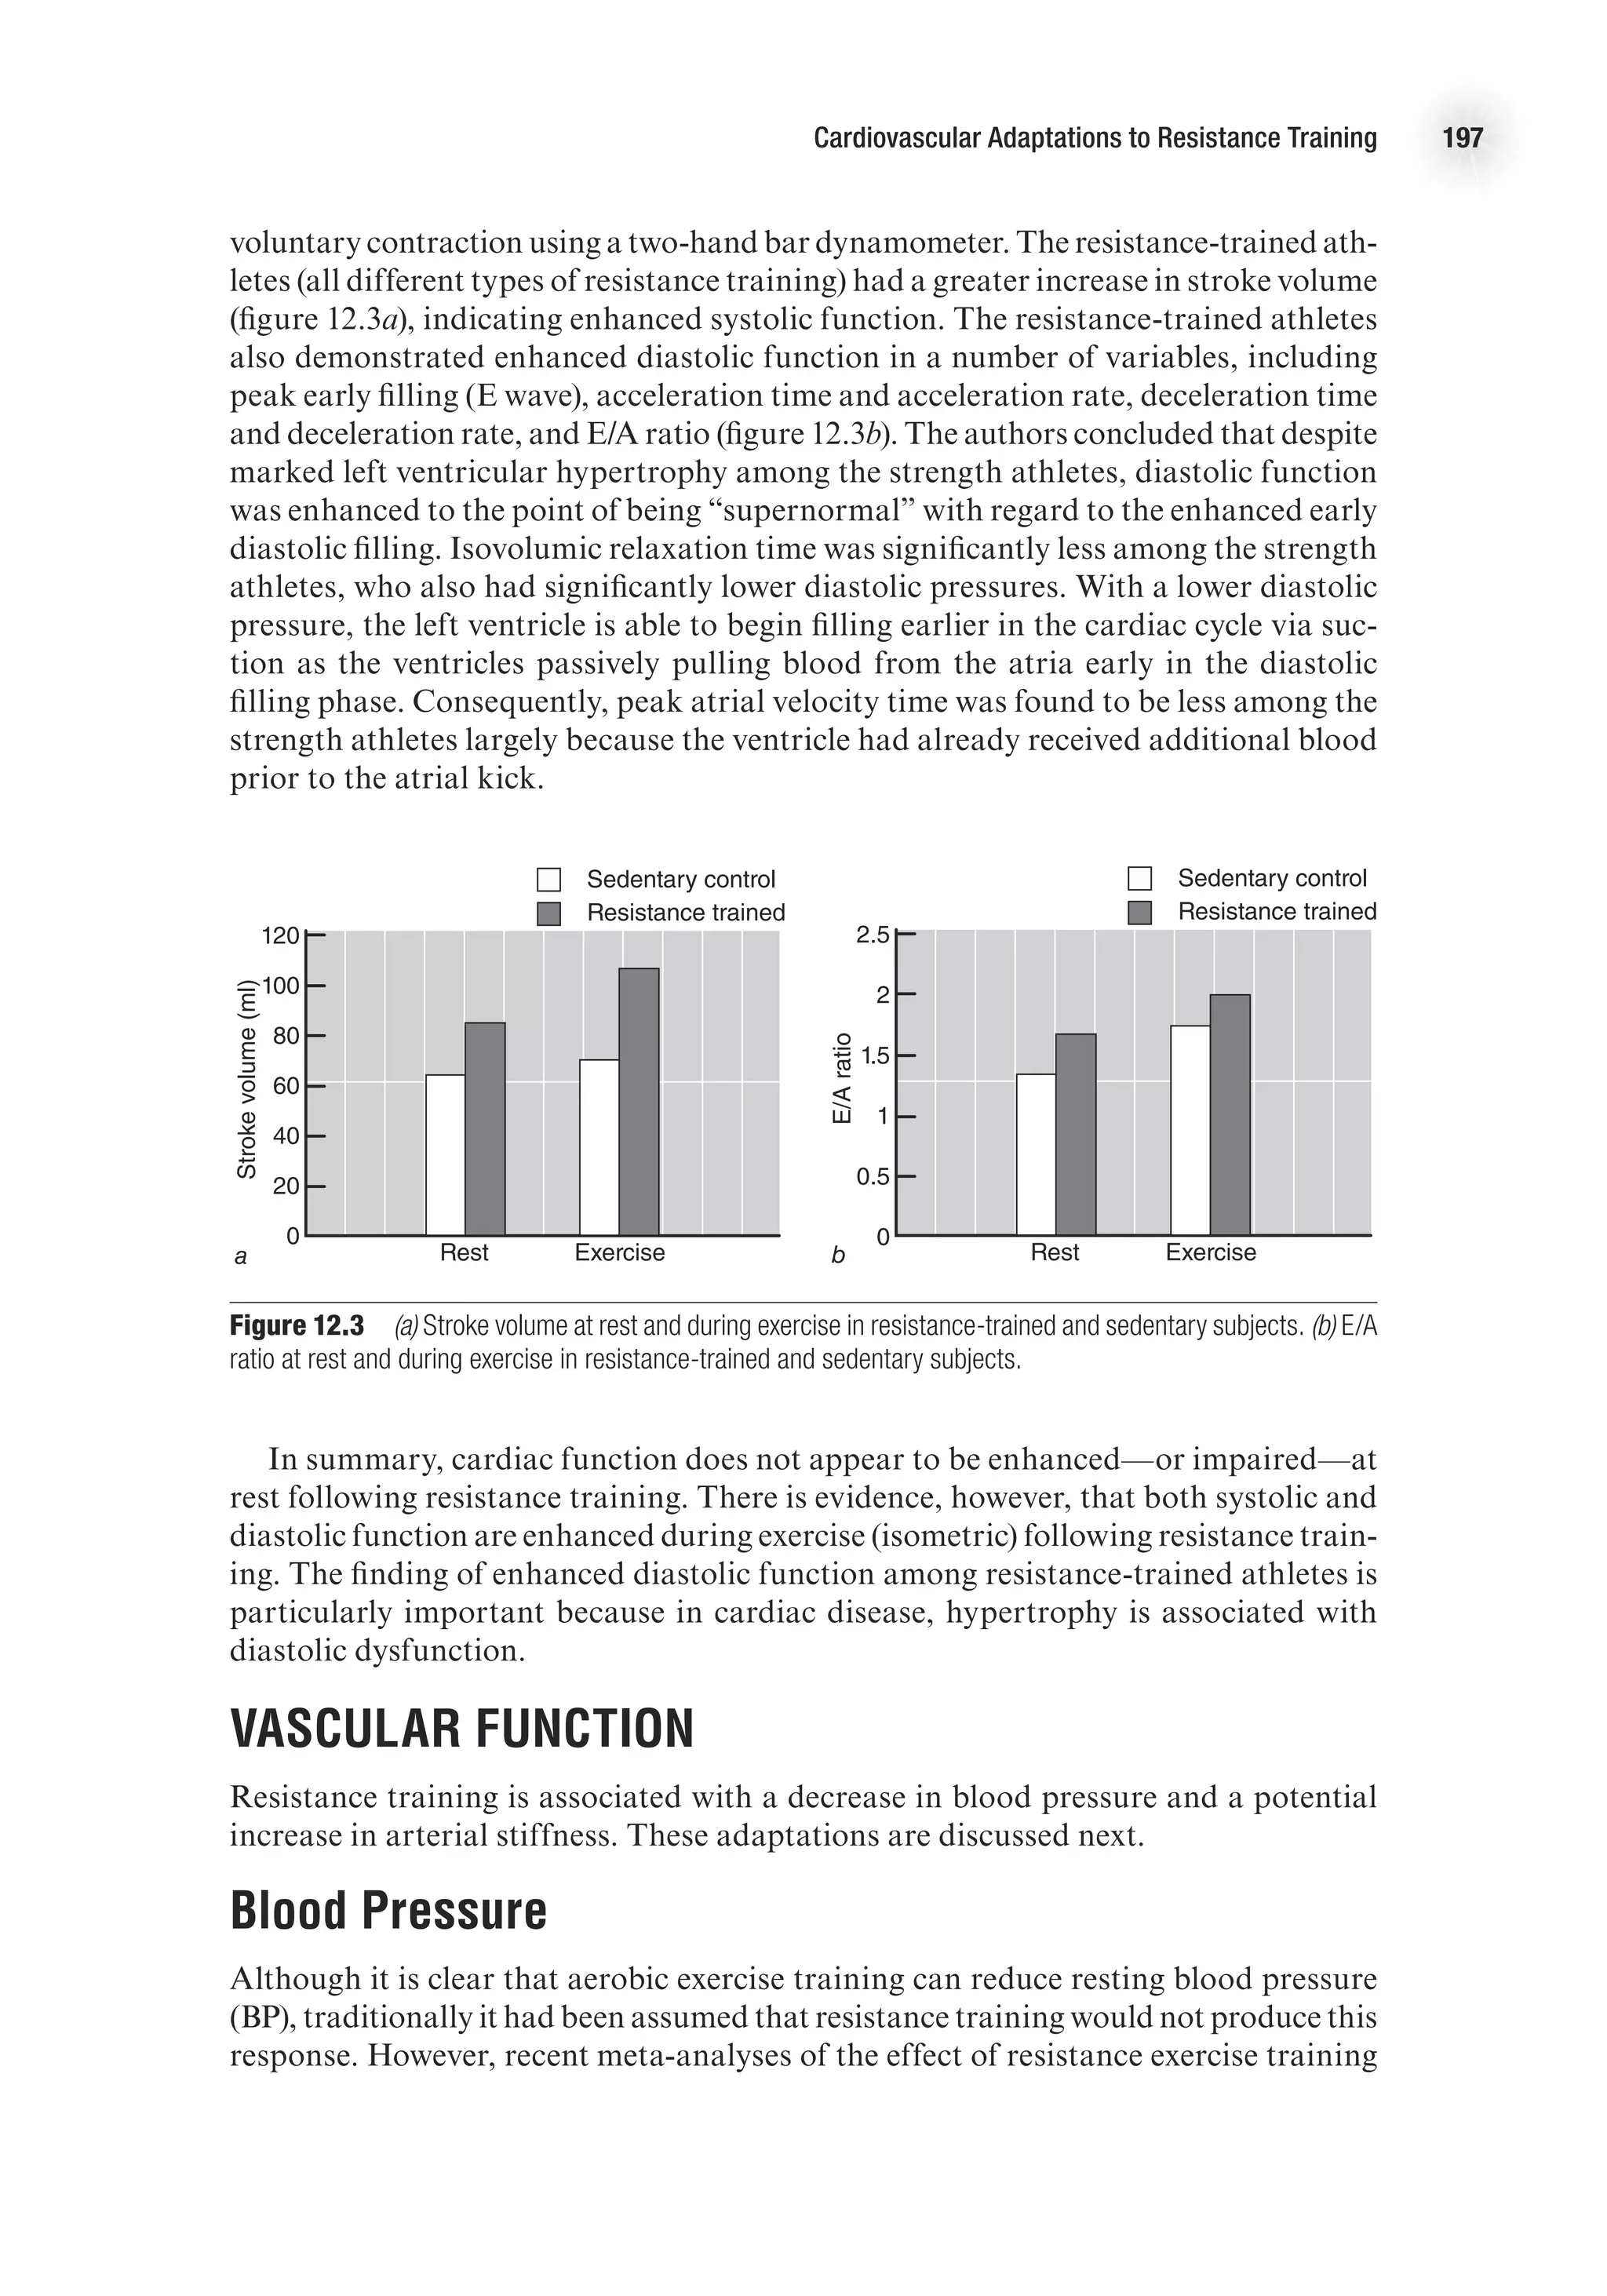
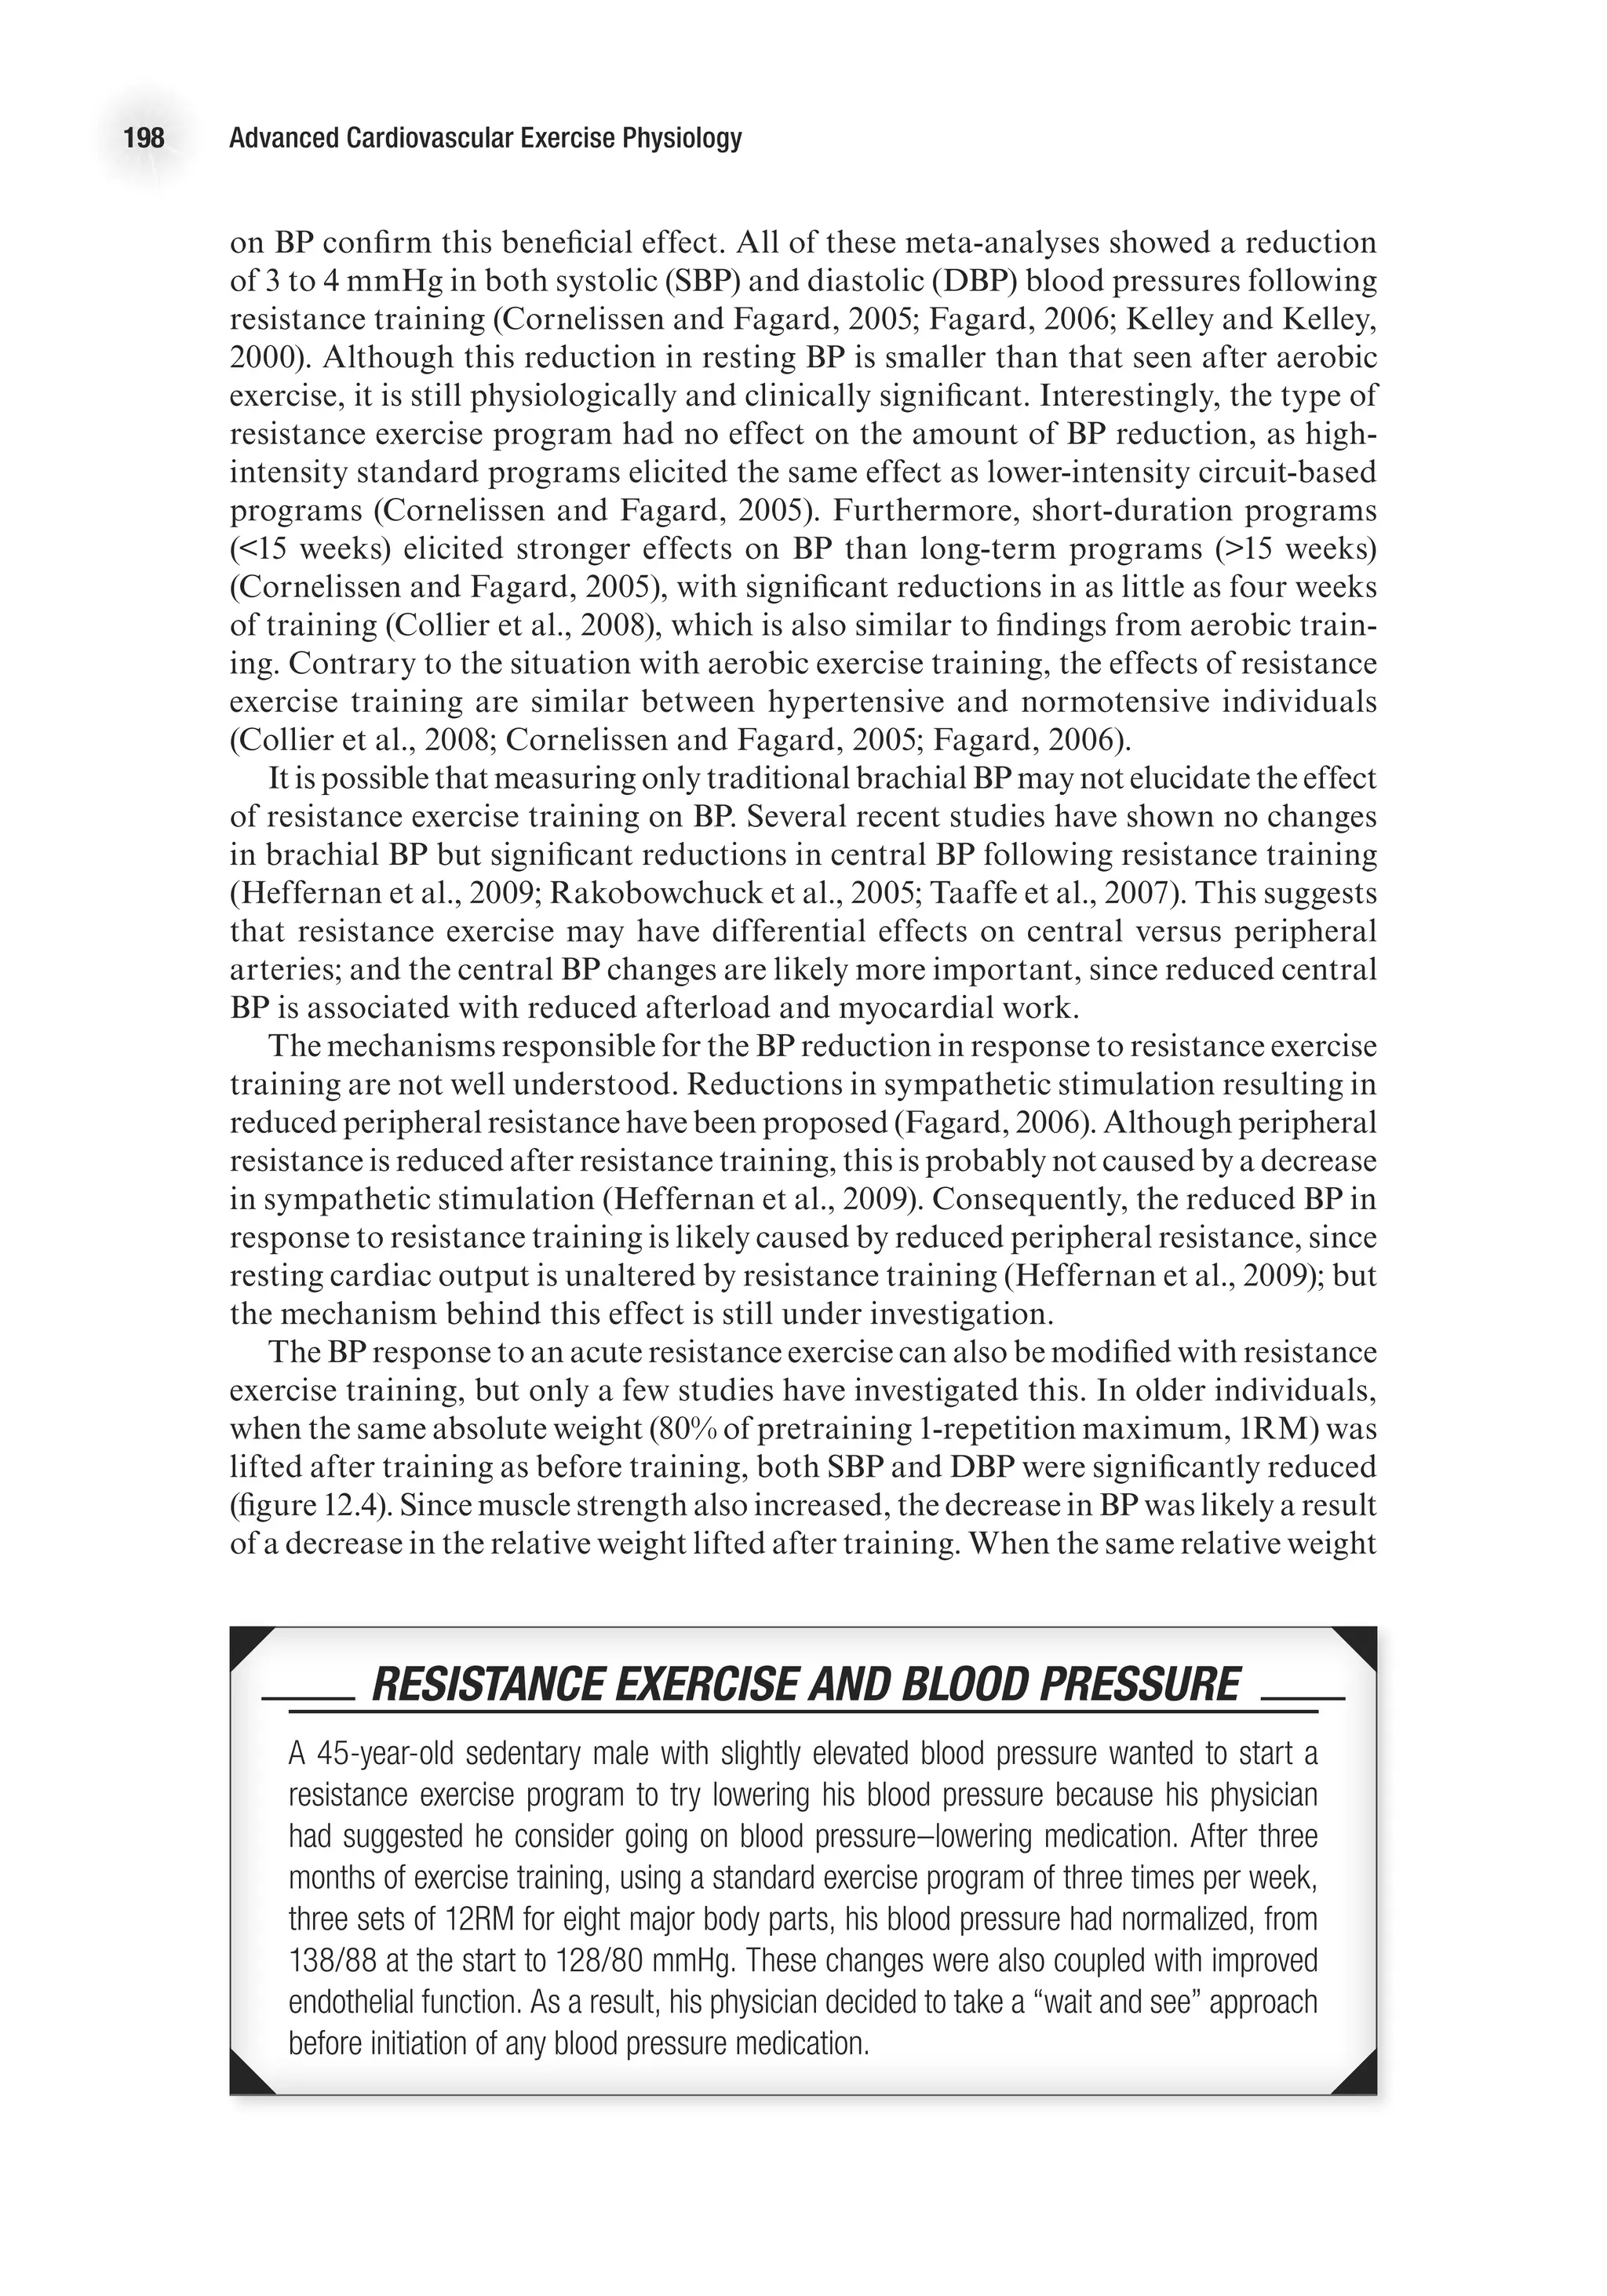
![Cardiovascular Responses to Acute Resistance Exercise 183
Myocardial Oxygen Consumption
The rate–pressure product (RPP) or double product ([HR 3 SBP]/100) has been used
as an indirect measure of myocardial oxygen consumption. The RPP has been shown
to correlate well with myocardial oxygen consumption under both static and dynamic
exercise conditions (Nelson et al., 1974). Because of increases in both heart rate and
systolic blood pressure, the RPP can rise to high levels during intense resistance
exercise (MacDougall et al., 1985). However, many authors have found that RPP does
not reach extremely high levels because heart rate increases are generally modest.
Fleck and Dean (1987) assessed heart rate and blood pressure responses to one-knee
extension exercises performed to volitional fatigue in trained bodybuilders, novice
bodybuilders, and sedentary controls. In this study, the subjects achieved a RPP less
than 250 3 102
. Furthermore, the results indicated that the trained bodybuilders had
a lower RPP than novice lifters or sedentary controls.
Historically, the high RPP was a primary reason that intense resistance exercise was
considered contraindicated for persons with known cardiovascular disease (McCart-
ney, 1999). However, revised guidelines from the American Heart Association suggest
that resistance training may indeed be beneficial for those with known cardiovascular
disease if contemporary prescriptive guidelines are employed with close supervision
(Thompson et al., 2007). In a statement published by the American Heart Associa-
tion (Braith and Stewart, 2006) regarding the use of resistance exercise in those with
and without cardiovascular disease, the authors detail what is currently known about
the safety of resistance exercise. They acknowledge that “excessive” blood pressure
elevations have been documented with high-intensity resistance exercise (80-100%
of 1RM performed to exhaustion), but note that such elevations are generally not a
concern with low- to moderate-intensity resistance training performed with correct
breathing technique and avoidance of the Valsalva maneuver. Furthermore, there
From P.D. Thompson et al., 2007, “Exercise and acute cardiovascular events placing the risks into perspective: A Scientific statement from
the American heart association council on nutrition, physical activity, and metabolism and the council on clinical cardiology,” Circulation
114(17): 2358-68.](https://image.slidesharecdn.com/advancedcardiovascularexercites-220106230013/75/Advanced-cardiovascular-exercites-197-2048.jpg)


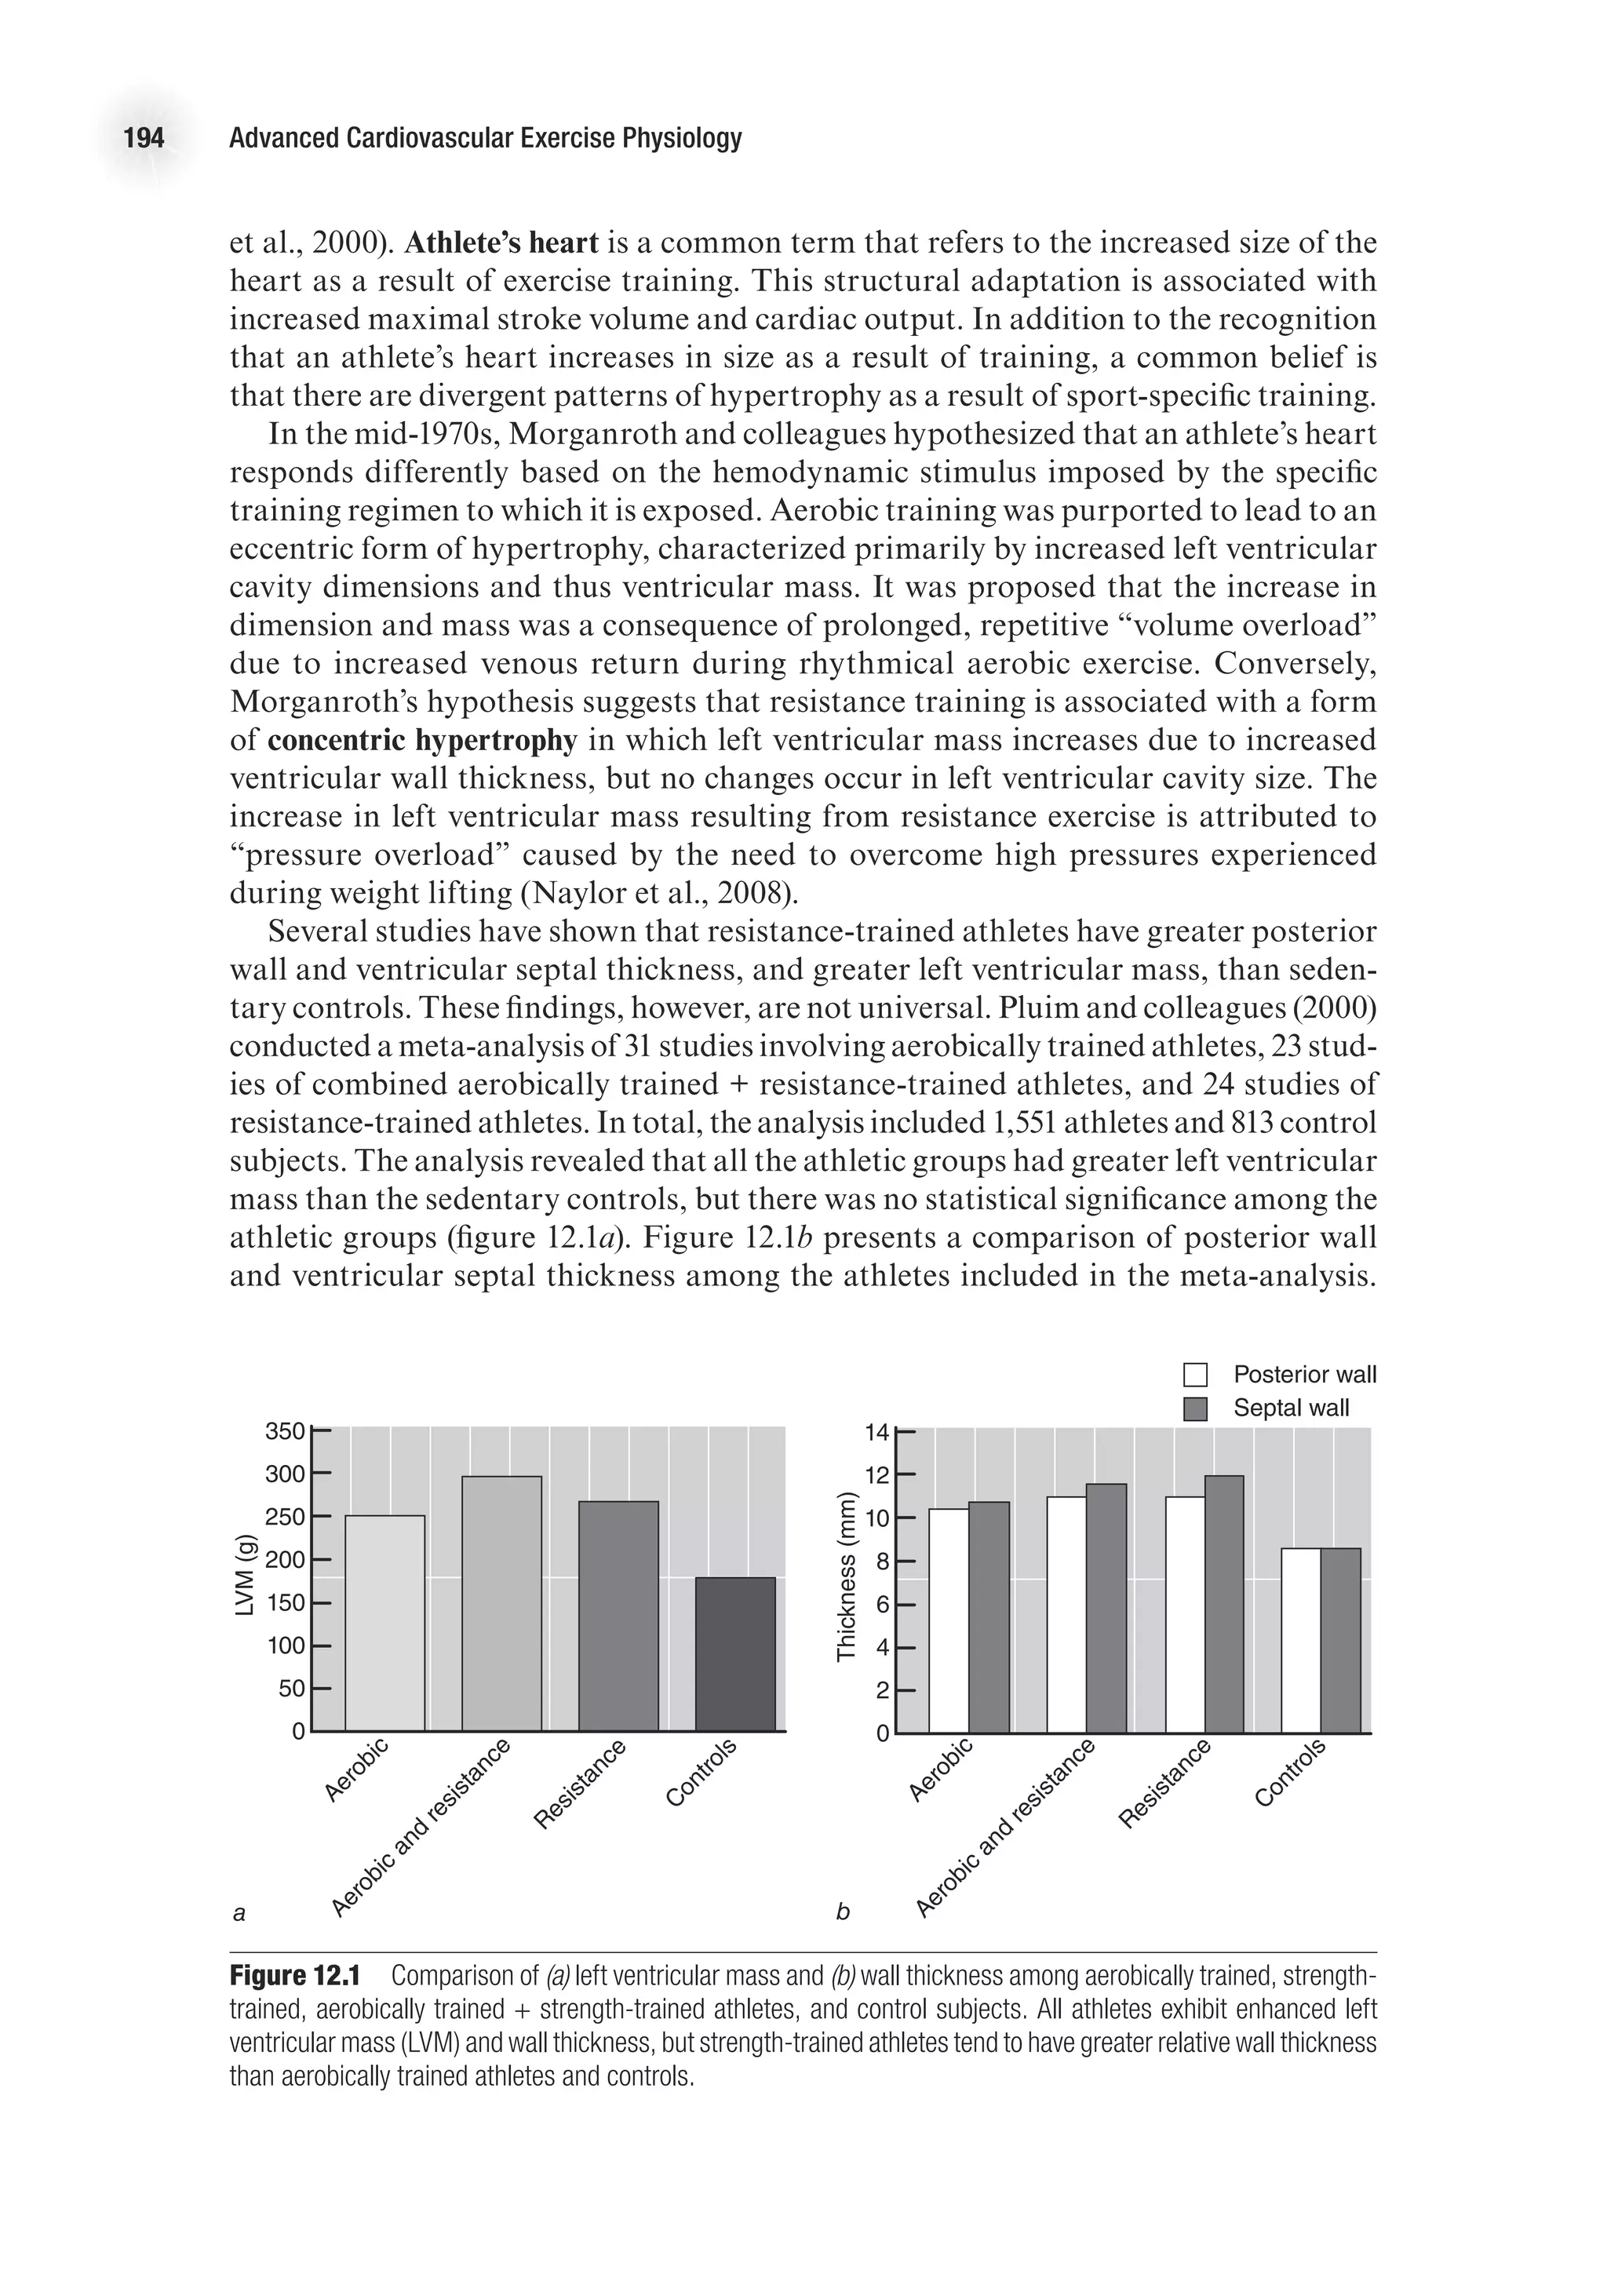
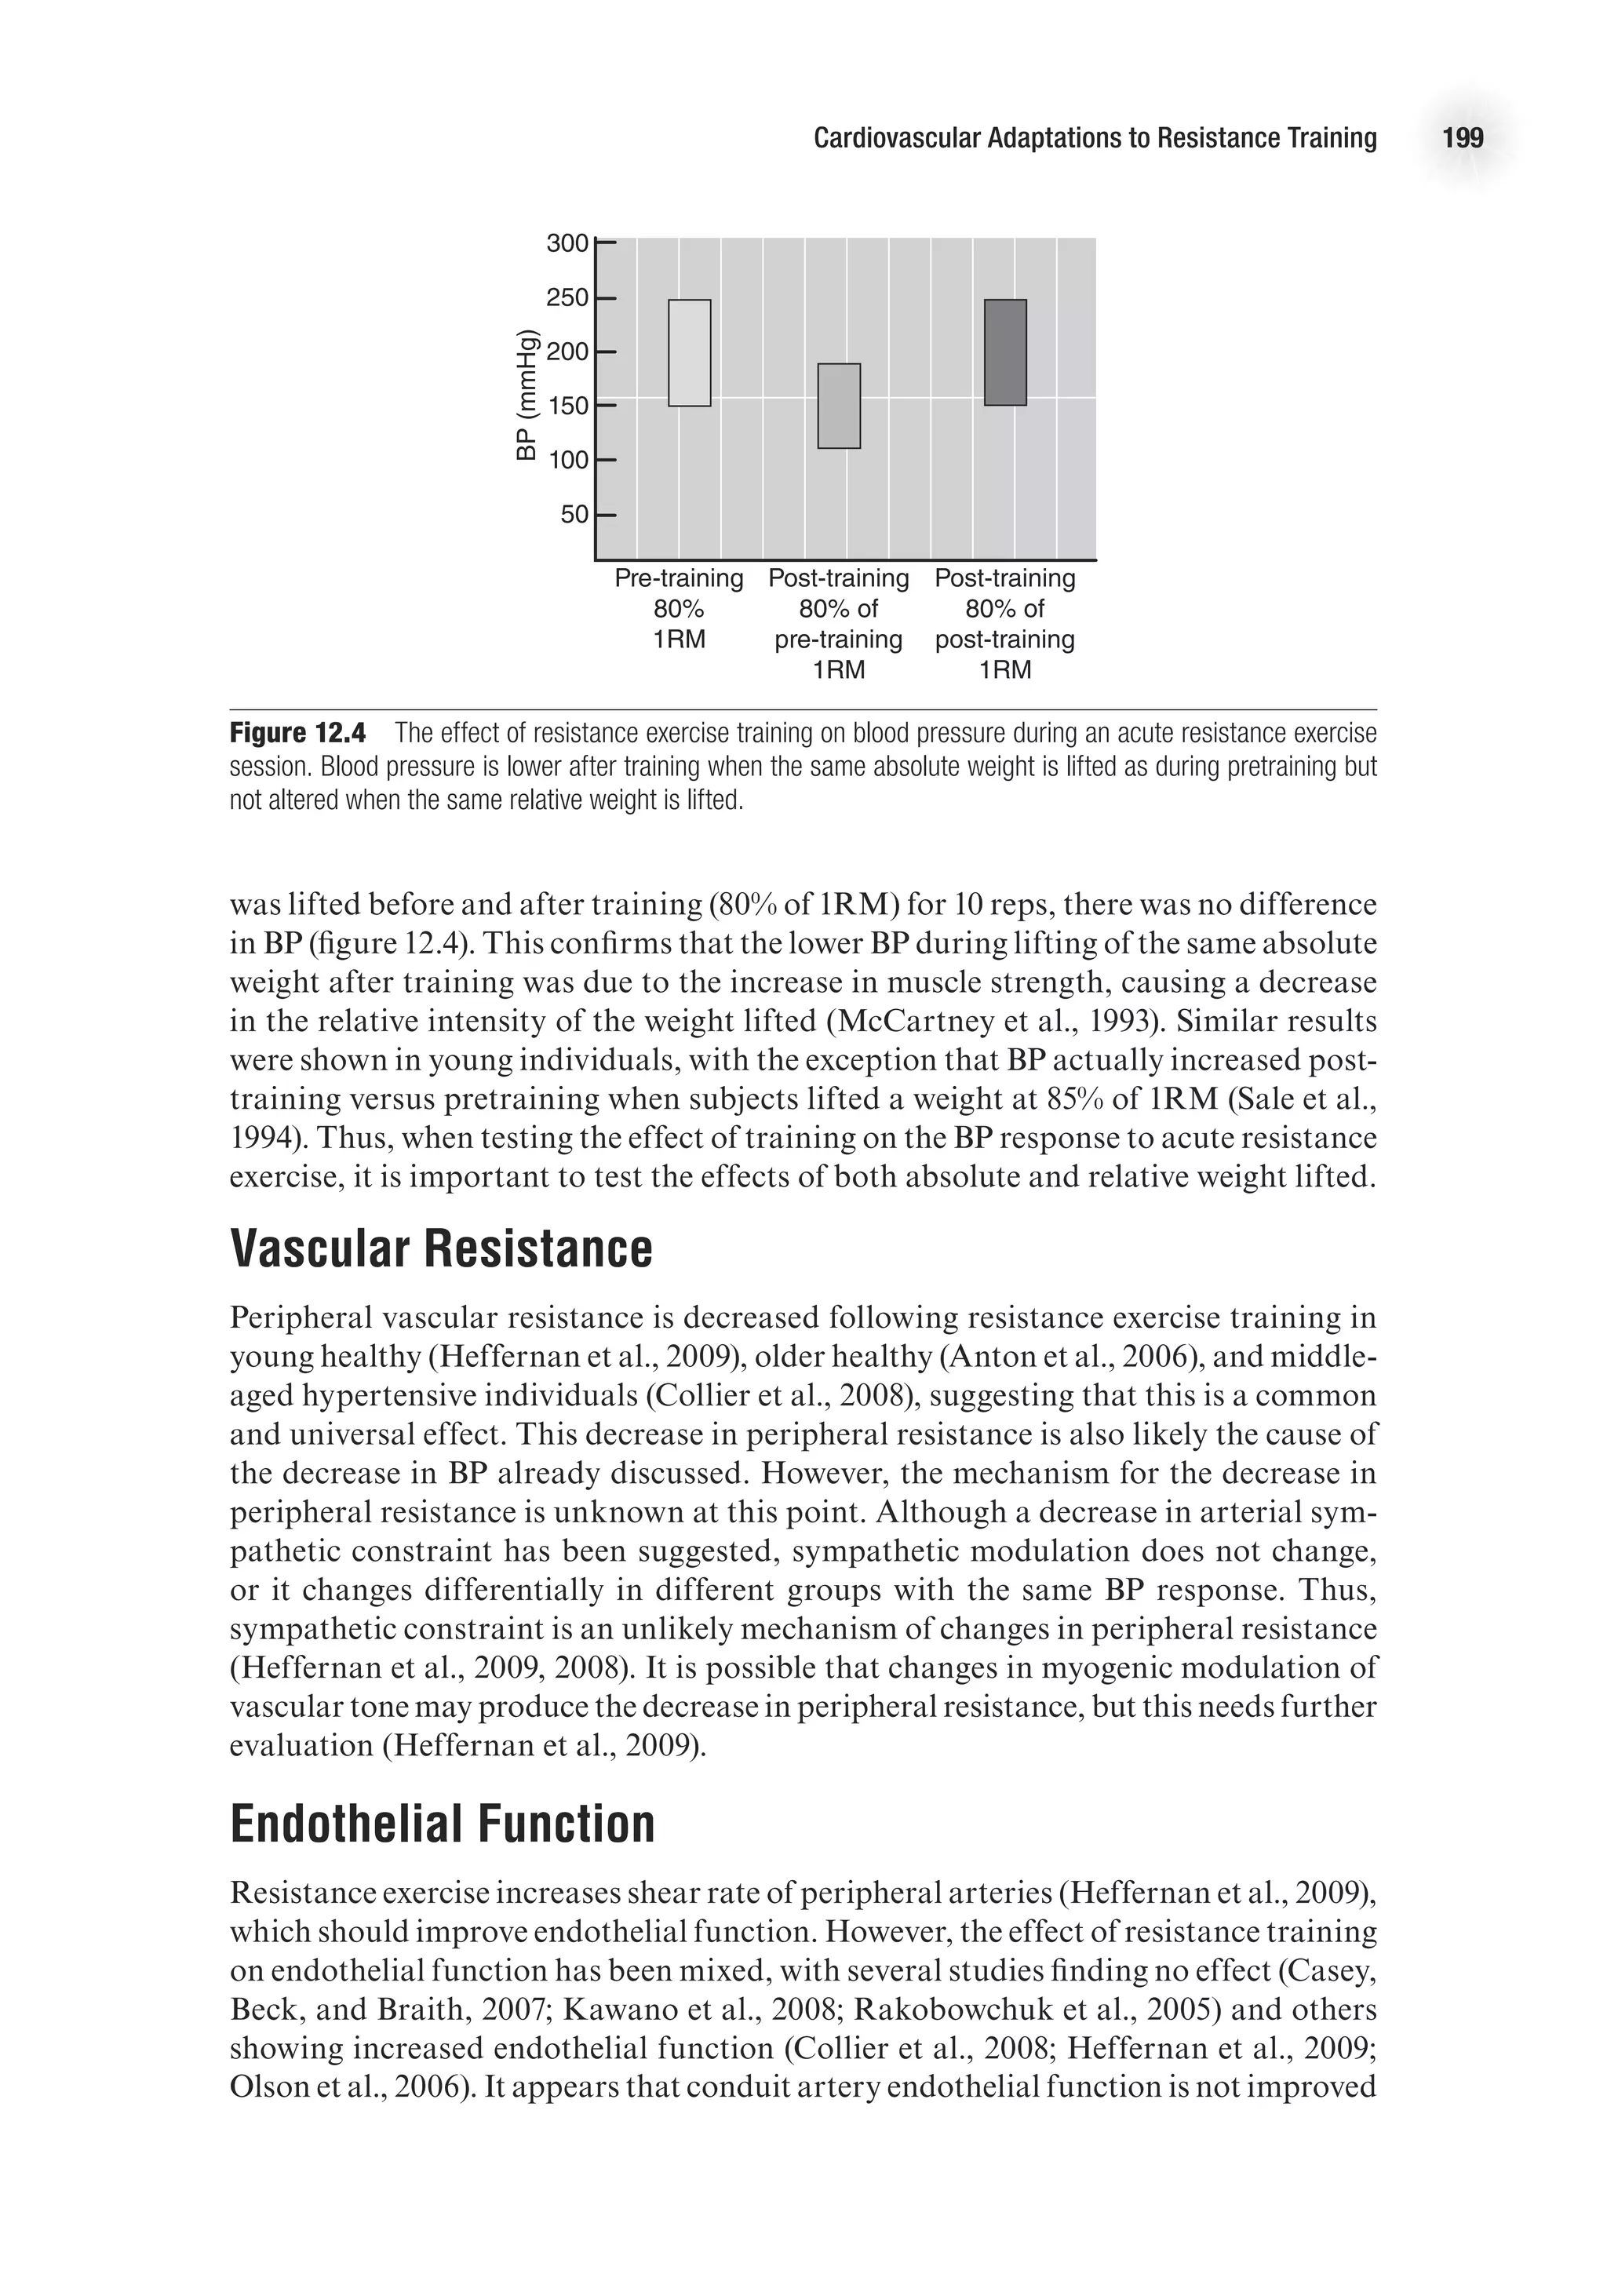
![Cardiovascular Adaptations to Resistance Training 195
Ventricular septal wall thickness was significantly higher in the resistance-trained
athletes versus the aerobically trained athletes. Some studies indicating that wall
thickness is greater in resistance-trained athletes have shown no difference in wall
thickness when it is reported relative to body size. In the meta-analysis conducted by
Pluim and coworkers, the mean relative wall thickness (not shown) was significantly
lower in the control subjects (0.36 mm) versus the aerobically trained (0.39 mm), the
aerobically trained + resistance-trained (0.40 mm), or the resistance-trained (0.44 mm)
subjects. Furthermore, the relative wall thickness of the resistance-trained subjects was
significantly greater than for the aerobically trained athletes. In addition to greater
wall thickness, the meta-analysis revealed that left ventricular internal diameter was
significantly greater for the athletes than for the sedentary controls, with aerobically
trained athletes tending to have a larger diameter than the resistance-trained athletes
(53.7 mm vs. 52.1 mm, respectively).
The studies included in the meta-analysis were primarily cross-sectional stud-
ies. Inherently, the findings of these studies are limited based on the predilection
of athletes to be drawn to certain training methods (aerobic or anaerobic) and also
partially based on genetically determined factors. Further confounding this issue is
the tendency for many athletes to train using both aerobic and resistance training
components. Despite the challenges with cross-sectional studies, the majority of such
studies comparing athletes to sedentary controls report that both aerobic training
and resistance training lead to increased left ventricular mass.
Although resistance athletes have been shown to have increased left ventricular
wall thickness as compared to controls, this is not a universal finding. Several authors
have failed to find significant differences in normalized ventricular wall thickness
with resistance exercise (Haykowsky et al., 2001; George et al., 1995; Pearson et al.,
1986; Snoeckx et al., 1982). A review by Haykowsky and colleagues (2002) suggests
that resistance training does not lead to an obligatory increase in left ventricular
wall thickness or mass. These authors note that alteration in left ventricle geometry
with resistance training may be dependent on the specific type of resistance training,
such as Olympic-style weightlifting, powerlifting, or bodybuilding. In their review,
they found that 37.5% of resistance-trained athletes exhibited normal left ventricular
geometry; another 37.5% exhibited concentric hypertrophy (an increase in both left
ventricular mass [LVM] and relative wall thickness); and 25% exhibited eccentric
hypertrophy (increased LVM with preserved relative wall thickness). Interestingly,
only bodybuilders and weightlifters (serious weightlifters, but not classified in one
of the other categories) exhibited eccentric hypertrophy similar to what might be
observed in aerobically trained athletes. Those athletes with normal geometry were
either powerlifters or Olympic weightlifters, while those with concentric hypertrophy
were 80% weightlifters and 20% Olympic weightlifters. These data might suggest
that the type of resistance training may influence cardiac structure; however, no lon-
gitudinal studies exist to confirm this. Furthermore, the authors note that anabolic
steroids are known to cause left ventricular hypertrophy and that underlying steroid
use may influence the data.
Longitudinal studies assessing the effect of resistance training on cardiac struc-
ture are relatively sparse and have produced conflicting results (Naylor et al., 2008).
However, there is some agreement regarding adaptations in previously sedentary
individuals. In general, previously sedentary individuals who engage in resistance
training respond by increasing cavity size (eccentric hypertrophy) or increasing wall
thickness (Naylor, 2008; Haykowsky et al., 2005), but rarely both. Thus, additional](https://image.slidesharecdn.com/advancedcardiovascularexercites-220106230013/75/Advanced-cardiovascular-exercites-209-2048.jpg)


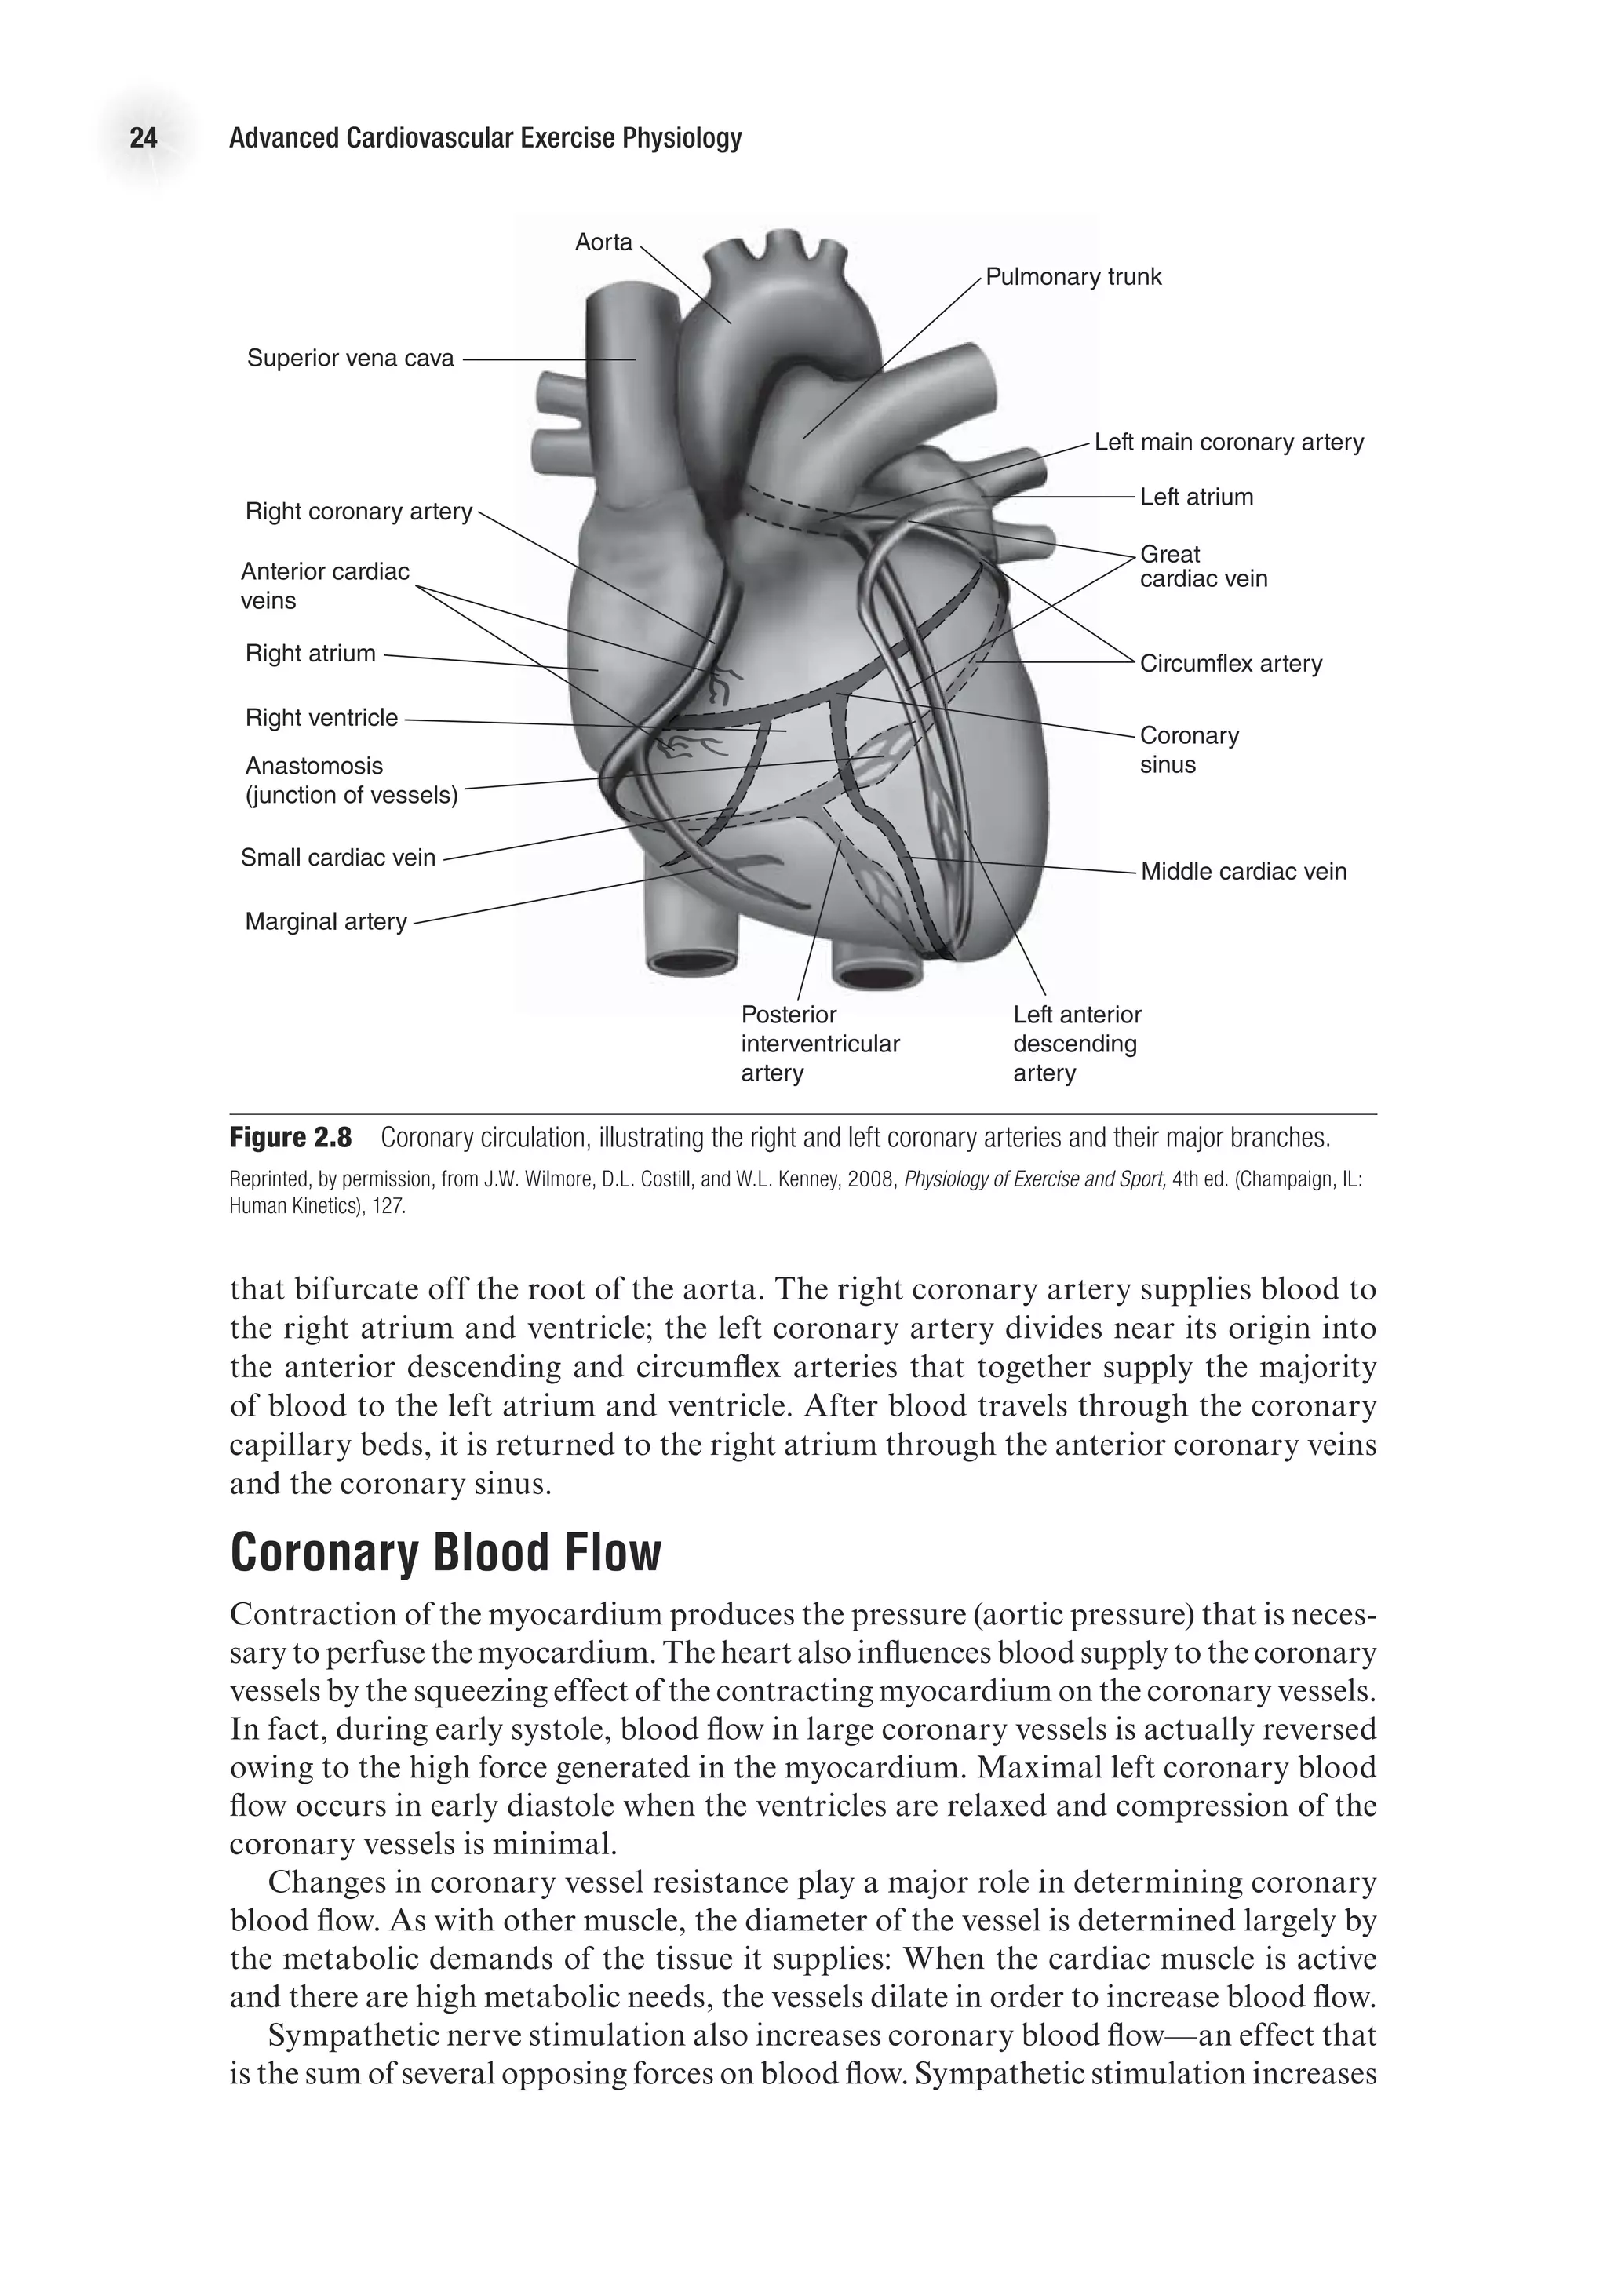
This document provides bibliographic information and copyright details for the book "Advanced Cardiovascular Exercise Physiology" by Denise L. Smith and Bo Fernhall. It lists the book's authors, publisher, subject headings, International Standard Book Number, and copyright information. The book is part of the Advanced Exercise Physiology Series published by Human Kinetics and focuses on cardiovascular system physiology and exercise physiology.


