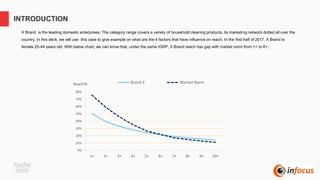
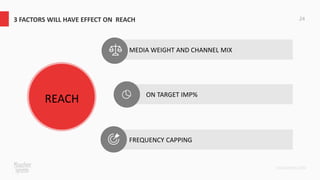
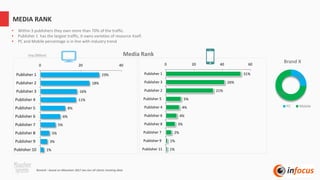
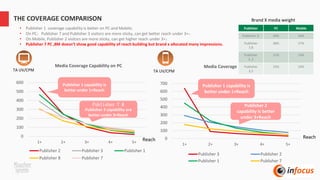
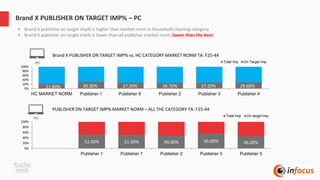
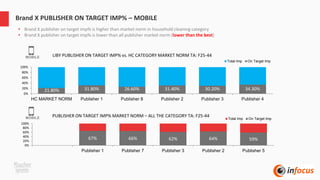
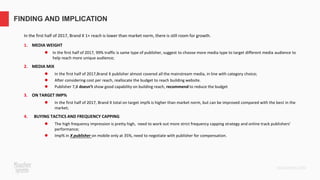
HOW TO ACHIEVE THE REACH GOAL?
CASE STUDY:
X Brand is the leading domestic enterprises, The category range covers a variety of household cleaning products, its marketing network dotted all over the
country. In this deck, we will use this case to give example on what are the 4 factors that have influence on reach. In the first half of 2017, X Brand is
female 25-44 years old. With below chart, we can know that, under the same IGRP, X Brand reach has gap with market norm from 1+ to 6+.
INTRODUCTION
0%
10%
20%
30%
40%
50%
60%
70%
80%
1+ 2+ 3+ 4+ 5+ 6+ 7+ 8+ 9+ 10+
Reach% Brand X Market Norm
MEDIA WEIGHT AND CHANNEL MIX
ON TARGET IMP%
FREQUENCY CAPPING
3 FACTORS WILL HAVE EFFECT ON REACH 24
REACH
MEDIA WEIGHT AND CHANNEL MIX
MEDIA RANK
23%
18%
16%
11%
8%
6%
5%
5%
3%
1%
0 20 40
Publisher 1
Publisher 2
Publisher 3
Publisher 4
Publisher 5
Publisher 6
Publisher 7
Publisher 8
Publisher 9
Publisher 10
Remark : based on Miaozhen 2017 Jan-Jun all clients tracking data
31%
26%
21%
5%
4%
4%
3%
2%
1%
1%
0 20 40 60
Publisher 1
Publisher 3
Publisher 2
Publisher 5
Publisher 4
Publisher 6
Publisher 8
Publisher 7
Publisher 9
Publisher 11
Imp.(Billion) Media Rank
• Within 3 publishers they own more than 70% of the traffic.
• Publisher 1 has the largest traffic, it owns varieties of resource itself.
• PC and Mobile percentage is in line with industry trend
26%
74%
Brand X
PC Mobile
Brand X MEDIA WEIGHT AND CHANNEL MIX
⚫ In the first half of 2017, Brand X got more than 25 billion impression with 28 campaigns. More than 60% impression from Publisher 1 and Publisher 8 PC
and Publisher 7 of mobile which is not in line with the media rank
⚫ IMP FRE (avg.) is more than 4 of each publisher, also find Publisher 3 CTR is too low
PUBLISHER TOTAL IMP UV
IMP FRE
(avg.)
IMP% TOTAL CLK Clicker
CLK FRE
(avg.)
CLK% CTR
Publisher 1 848,305,400 168,336,570 5.04 33% 18,106,670 12,037,109 1.50 35% 2.13%
Publisher 8,7 770,518,907 141,457,744 5.45 30% 18,671,914 8,757,092 2.13 36% 2.42%
Publisher 2,3 466,377,259 106,932,276 4.36 18% 10,497,354 6,796,153 1.54 20% 2.25%
Publisher 3,2 361,504,628 78,038,578 4.63 14% 537,743 463,885 1.16 1% 0.15%
Publisher 4 ,5 135,949,297 23,702,010 5.74 5% 3,704,211 2,210,855 1.68 7% 2.72%
THE COVERAGE COMPARISON
0
100
200
300
400
500
600
1+ 2+ 3+ 4+ 5+
Media Coverage Capability on PC
Publisher 2 Publisher 3 Publisher 1
Publisher 8 Publisher 7
0
100
200
300
400
500
600
700
1+ 2+ 3+ 4+ 5+
Media Coverage Capability on Mobile
Publisher 3 Publisher 2
Publisher 1 Publisher 7
Reach
Reach
TA UV/CPM
Publisher 1 capability is
better under 1+Reach
Publisher 1 capability is
better under 1+Reach
Publisher 2
capability is better
under 3+Reach
Publisher 7 &
Publisher 3 capability are
better under 3+Reach
• Publisher 1 coverage capability is better on PC and Mobile;
• On PC,Publisher 7 and Publisher 3 visitors are more sticky, can get better reach under 3+;
• On Mobile, Publisher 2 visitors are more sticky, can get higher reach under 3+;
• Publisher 7 PC ,8M doesn’t show good capability of reach building but brand x allocated many impressions.
TA UV/CPM
Publisher PC Mobile
Publisher 1I 29% 34%
Publisher
7,8
38% 27%
Publisher
3 ,2
15% 14%
Publisher
3,2
15% 19%
Brand X media weight
ON TARGET IMP%
21.80% 30.30% 27.30% 26.70% 27.20% 28.60%0%
20%
40%
60%
80%
100%
HC MARKET NORM Publisher 1 Publisher 8 Publisher 2 Publisher 3 Publisher 4
Total Imp On Target Imp
Brand X PUBLISHER ON TARGET IMP% – PC
52.00% 51.00% 49.00% 56.00% 46.00%
0%
20%
40%
60%
80%
100%
Publisher 1 Publisher 7 Publisher 2 Publisher 3 Publisher 5
Total Imp On target Imp
PC
• Brand X publisher on target imp% is higher than market norm in household cleaning category
• Brand X publisher on target imp% is lower than all publisher market norm (lower than the best)
PC
PUBLISHER ON TARGET IMP% MARKET NORM – ALL THE CATEGORY TA: F25-44
Brand X PUBLISHER ON TARGET IMP% vs. HC CATEGORY MARKET NORM TA: F25-44
67% 66% 62% 64% 59%
0%
20%
40%
60%
80%
100%
Publisher 1 Publisher 7 Publisher 3 Publisher 2 Publisher 5
Total Imp On Target Imp
Brand X PUBLISHER ON TARGET IMP% – MOBILE
21.80% 31.80% 26.60% 31.40% 30.20% 34.30%
0%
20%
40%
60%
80%
100%
HC MARKET NORM Publisher 1 Publisher 8 Publisher 2 Publisher 3 Publisher 4
Total Imp On Target Imp
MOBILE
• Brand X publisher on target imp% is higher than market norm in household cleaning category
• Brand X publisher on target imp% is lower than all publisher market norm (lower than the best)
MOBILE
LIBY PUBLISHER ON TARGET IMP% vs. HC CATEGORY MARKET NORM TA: F25-44
PUBLISHER ON TARGET IMP% MARKET NORM – ALL THE CATEGORY TA: F25-44
FREQUENCY CAPPING
47%
26%
44%
35%
40%
35%
26%
35% 36%
49%
16%
17%
19%
17%
16%
16%
15%
16%
21%
18%
13%
37%
15%
10%
12%
13% 34% 18%
14%
16%
7%
2% 4%
14% 12% 12%
5%
11%
2% 4%
0%
10%
20%
30%
40%
50%
60%
70%
80%
90%
100%
Publisher 1 Publisher 2 Publisher 3 Publisher 4 Publisher 5 Publisher 6 Publisher 7 Publisher 8 Publisher 9 Publisher 10
Brand X Campaign frequency
1 2 3 4 5 6 7 8 9 10%
FREQUENCY ANALYSIS
• The audience would be more stable and sticky with Hot Program, which there are higher frequency audience
• Regular Buy should bring more unique visitors,but some campaign showed pretty high imp% in high frequency, it result in waste of
resources, so need to control the frequency
In the first half of 2017, Brand X 1+ reach is lower than market norm, there is still room for growth.
1. MEDIA WEIGHT
⚫ In the first half of 2017, 99% traffic is same type of publisher, suggest to choose more media type to target different media audience to
help reach more unique audience;
2. MEDIA MIX
⚫ In the first half of 2017,Brand X publisher almost covered all the mainstream media, in line with category choice;
⚫ After considering cost per reach, reallocate the budget to reach building website.
⚫ Publisher 7,8 doesn’t show good capability on building reach, recommend to reduce the budget
3. ON TARGET IMP%
⚫ In the first half of 2017, Brand X total on target imp% is higher than market norm, but can be improved compared with the best in the
market;
4. BUYING TACTICS AND FREQUENCY CAPPING
⚫ The high frequency impression is pretty high, need to work out more strict frequency capping strategy and online track publishers’
performance;
⚫ Imp% in X publisher on mobile only at 35%, need to negotiate with publisher for compensation.
FINDING AND IMPLICATION
http://www.ifmresearch.com/en/
Ricardo Glenn
ricardo.glenn@infocusmekong.com
T: (84) 909 680 530
M: (84) 909 680 530
Want to Learn More
Ad monitor case study

Ad monitor case study

  • 1.
    HOW TO ACHIEVETHE REACH GOAL? CASE STUDY:
  • 2.
    X Brand isthe leading domestic enterprises, The category range covers a variety of household cleaning products, its marketing network dotted all over the country. In this deck, we will use this case to give example on what are the 4 factors that have influence on reach. In the first half of 2017, X Brand is female 25-44 years old. With below chart, we can know that, under the same IGRP, X Brand reach has gap with market norm from 1+ to 6+. INTRODUCTION 0% 10% 20% 30% 40% 50% 60% 70% 80% 1+ 2+ 3+ 4+ 5+ 6+ 7+ 8+ 9+ 10+ Reach% Brand X Market Norm
  • 3.
    MEDIA WEIGHT ANDCHANNEL MIX ON TARGET IMP% FREQUENCY CAPPING 3 FACTORS WILL HAVE EFFECT ON REACH 24 REACH
  • 4.
    MEDIA WEIGHT ANDCHANNEL MIX
  • 5.
    MEDIA RANK 23% 18% 16% 11% 8% 6% 5% 5% 3% 1% 0 2040 Publisher 1 Publisher 2 Publisher 3 Publisher 4 Publisher 5 Publisher 6 Publisher 7 Publisher 8 Publisher 9 Publisher 10 Remark : based on Miaozhen 2017 Jan-Jun all clients tracking data 31% 26% 21% 5% 4% 4% 3% 2% 1% 1% 0 20 40 60 Publisher 1 Publisher 3 Publisher 2 Publisher 5 Publisher 4 Publisher 6 Publisher 8 Publisher 7 Publisher 9 Publisher 11 Imp.(Billion) Media Rank • Within 3 publishers they own more than 70% of the traffic. • Publisher 1 has the largest traffic, it owns varieties of resource itself. • PC and Mobile percentage is in line with industry trend 26% 74% Brand X PC Mobile
  • 6.
    Brand X MEDIAWEIGHT AND CHANNEL MIX ⚫ In the first half of 2017, Brand X got more than 25 billion impression with 28 campaigns. More than 60% impression from Publisher 1 and Publisher 8 PC and Publisher 7 of mobile which is not in line with the media rank ⚫ IMP FRE (avg.) is more than 4 of each publisher, also find Publisher 3 CTR is too low PUBLISHER TOTAL IMP UV IMP FRE (avg.) IMP% TOTAL CLK Clicker CLK FRE (avg.) CLK% CTR Publisher 1 848,305,400 168,336,570 5.04 33% 18,106,670 12,037,109 1.50 35% 2.13% Publisher 8,7 770,518,907 141,457,744 5.45 30% 18,671,914 8,757,092 2.13 36% 2.42% Publisher 2,3 466,377,259 106,932,276 4.36 18% 10,497,354 6,796,153 1.54 20% 2.25% Publisher 3,2 361,504,628 78,038,578 4.63 14% 537,743 463,885 1.16 1% 0.15% Publisher 4 ,5 135,949,297 23,702,010 5.74 5% 3,704,211 2,210,855 1.68 7% 2.72%
  • 7.
    THE COVERAGE COMPARISON 0 100 200 300 400 500 600 1+2+ 3+ 4+ 5+ Media Coverage Capability on PC Publisher 2 Publisher 3 Publisher 1 Publisher 8 Publisher 7 0 100 200 300 400 500 600 700 1+ 2+ 3+ 4+ 5+ Media Coverage Capability on Mobile Publisher 3 Publisher 2 Publisher 1 Publisher 7 Reach Reach TA UV/CPM Publisher 1 capability is better under 1+Reach Publisher 1 capability is better under 1+Reach Publisher 2 capability is better under 3+Reach Publisher 7 & Publisher 3 capability are better under 3+Reach • Publisher 1 coverage capability is better on PC and Mobile; • On PC,Publisher 7 and Publisher 3 visitors are more sticky, can get better reach under 3+; • On Mobile, Publisher 2 visitors are more sticky, can get higher reach under 3+; • Publisher 7 PC ,8M doesn’t show good capability of reach building but brand x allocated many impressions. TA UV/CPM Publisher PC Mobile Publisher 1I 29% 34% Publisher 7,8 38% 27% Publisher 3 ,2 15% 14% Publisher 3,2 15% 19% Brand X media weight
  • 8.
  • 9.
    21.80% 30.30% 27.30%26.70% 27.20% 28.60%0% 20% 40% 60% 80% 100% HC MARKET NORM Publisher 1 Publisher 8 Publisher 2 Publisher 3 Publisher 4 Total Imp On Target Imp Brand X PUBLISHER ON TARGET IMP% – PC 52.00% 51.00% 49.00% 56.00% 46.00% 0% 20% 40% 60% 80% 100% Publisher 1 Publisher 7 Publisher 2 Publisher 3 Publisher 5 Total Imp On target Imp PC • Brand X publisher on target imp% is higher than market norm in household cleaning category • Brand X publisher on target imp% is lower than all publisher market norm (lower than the best) PC PUBLISHER ON TARGET IMP% MARKET NORM – ALL THE CATEGORY TA: F25-44 Brand X PUBLISHER ON TARGET IMP% vs. HC CATEGORY MARKET NORM TA: F25-44
  • 10.
    67% 66% 62%64% 59% 0% 20% 40% 60% 80% 100% Publisher 1 Publisher 7 Publisher 3 Publisher 2 Publisher 5 Total Imp On Target Imp Brand X PUBLISHER ON TARGET IMP% – MOBILE 21.80% 31.80% 26.60% 31.40% 30.20% 34.30% 0% 20% 40% 60% 80% 100% HC MARKET NORM Publisher 1 Publisher 8 Publisher 2 Publisher 3 Publisher 4 Total Imp On Target Imp MOBILE • Brand X publisher on target imp% is higher than market norm in household cleaning category • Brand X publisher on target imp% is lower than all publisher market norm (lower than the best) MOBILE LIBY PUBLISHER ON TARGET IMP% vs. HC CATEGORY MARKET NORM TA: F25-44 PUBLISHER ON TARGET IMP% MARKET NORM – ALL THE CATEGORY TA: F25-44
  • 11.
  • 12.
    47% 26% 44% 35% 40% 35% 26% 35% 36% 49% 16% 17% 19% 17% 16% 16% 15% 16% 21% 18% 13% 37% 15% 10% 12% 13% 34%18% 14% 16% 7% 2% 4% 14% 12% 12% 5% 11% 2% 4% 0% 10% 20% 30% 40% 50% 60% 70% 80% 90% 100% Publisher 1 Publisher 2 Publisher 3 Publisher 4 Publisher 5 Publisher 6 Publisher 7 Publisher 8 Publisher 9 Publisher 10 Brand X Campaign frequency 1 2 3 4 5 6 7 8 9 10% FREQUENCY ANALYSIS • The audience would be more stable and sticky with Hot Program, which there are higher frequency audience • Regular Buy should bring more unique visitors,but some campaign showed pretty high imp% in high frequency, it result in waste of resources, so need to control the frequency
  • 13.
    In the firsthalf of 2017, Brand X 1+ reach is lower than market norm, there is still room for growth. 1. MEDIA WEIGHT ⚫ In the first half of 2017, 99% traffic is same type of publisher, suggest to choose more media type to target different media audience to help reach more unique audience; 2. MEDIA MIX ⚫ In the first half of 2017,Brand X publisher almost covered all the mainstream media, in line with category choice; ⚫ After considering cost per reach, reallocate the budget to reach building website. ⚫ Publisher 7,8 doesn’t show good capability on building reach, recommend to reduce the budget 3. ON TARGET IMP% ⚫ In the first half of 2017, Brand X total on target imp% is higher than market norm, but can be improved compared with the best in the market; 4. BUYING TACTICS AND FREQUENCY CAPPING ⚫ The high frequency impression is pretty high, need to work out more strict frequency capping strategy and online track publishers’ performance; ⚫ Imp% in X publisher on mobile only at 35%, need to negotiate with publisher for compensation. FINDING AND IMPLICATION
  • 14.