Download to read offline

![17-Nov-18IER University of Stuttgart 17
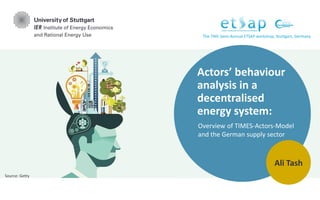
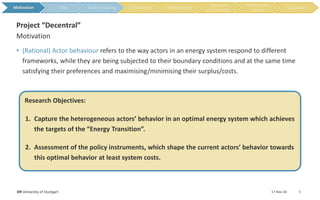
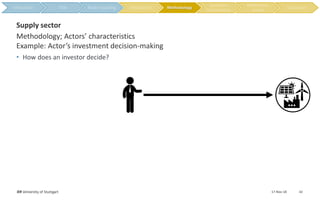
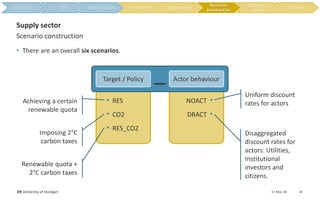
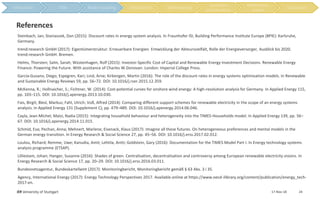
Preliminary results & discussion
Supply sector
Gross electricity generation by different energy carriers
0
100
200
300
400
500
600
Base-Year
RES_DRACT
RES_NOACT
CO2_DRACT
CO2_NOACT
RES_CO2_DRACT
RES_CO2_NOACT
RES_DRACT
RES_NOACT
CO2_DRACT
CO2_NOACT
RES_CO2_DRACT
RES_CO2_NOACT
RES_DRACT
RES_NOACT
CO2_DRACT
CO2_NOACT
RES_CO2_DRACT
RES_CO2_NOACT
RES_DRACT
RES_NOACT
CO2_DRACT
CO2_NOACT
RES_CO2_DRACT
RES_CO2_NOACT
RES_DRACT
RES_NOACT
CO2_DRACT
CO2_NOACT
RES_CO2_DRACT
RES_CO2_NOACT
2013 2020 2030 2040 2050 2060
Generation[TWh]
Hard Coal Hard Coal_CCS Lignite Lignite_CCS Nuclear Oil
Gas Gas_CCS Biomass Biomass_CCS Non-Ren Waste Ren Waste
Hydrogen Geothermal Hydro Wind_On Wind_Off Solar
Preliminary
results](https://image.slidesharecdn.com/1stpresentationintrosupplyalitash-181121064156/85/Actors-behaviour-analysis-in-a-decentralised-energy-system-Overview-of-TIMES-Actors-Model-and-the-German-supply-sector-17-320.jpg)
![17-Nov-18IER University of Stuttgart 18
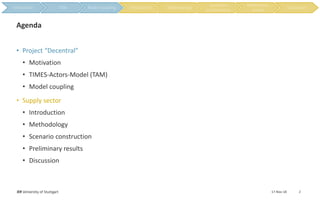
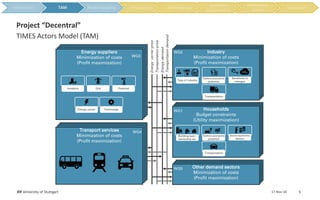
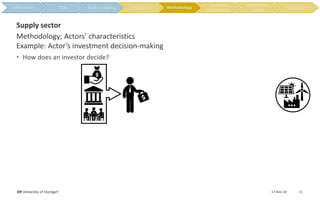
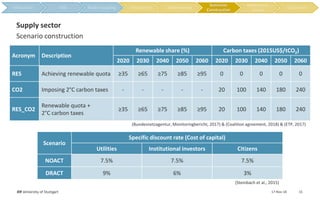
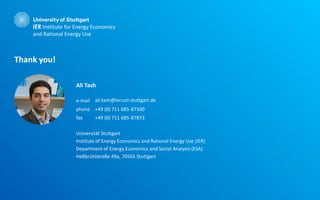
Preliminary results
Supply sector
0
50
100
150
200
250
300
350
400
450
500
Base-Year
RES_DRACT
RES_NOACT
CO2_DRACT
CO2_NOACT
RES_CO2_DRACT
RES_CO2_NOACT
RES_DRACT
RES_NOACT
CO2_DRACT
CO2_NOACT
RES_CO2_DRACT
RES_CO2_NOACT
RES_DRACT
RES_NOACT
CO2_DRACT
CO2_NOACT
RES_CO2_DRACT
RES_CO2_NOACT
RES_DRACT
RES_NOACT
CO2_DRACT
CO2_NOACT
RES_CO2_DRACT
RES_CO2_NOACT
RES_DRACT
RES_NOACT
CO2_DRACT
CO2_NOACT
RES_CO2_DRACT
RES_CO2_NOACT
2013 2020 2030 2040 2050 2060
Generation[TWh]
Biomass Biomass_CCS Ren Waste Geothermal Hydro Wind_On Wind_Off Solar
Gross electricity generation by renewables
Preliminary
results](https://image.slidesharecdn.com/1stpresentationintrosupplyalitash-181121064156/85/Actors-behaviour-analysis-in-a-decentralised-energy-system-Overview-of-TIMES-Actors-Model-and-the-German-supply-sector-18-320.jpg)
![0
50
100
150
200
250
300
350
Base-Year
RES_DRACT
RES_NOACT
CO2_DRACT
CO2_NOACT
RES_CO2_DRACT
RES_CO2_NOACT
RES_DRACT
RES_NOACT
CO2_DRACT
CO2_NOACT
RES_CO2_DRACT
RES_CO2_NOACT
RES_DRACT
RES_NOACT
CO2_DRACT
CO2_NOACT
RES_CO2_DRACT
RES_CO2_NOACT
RES_DRACT
RES_NOACT
CO2_DRACT
CO2_NOACT
RES_CO2_DRACT
RES_CO2_NOACT
RES_DRACT
RES_NOACT
CO2_DRACT
CO2_NOACT
RES_CO2_DRACT
RES_CO2_NOACT
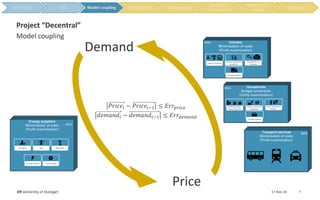
2013 2020 2030 2040 2050 2060
Emission[1000kt]
17-Nov-18IER University of Stuttgart 19
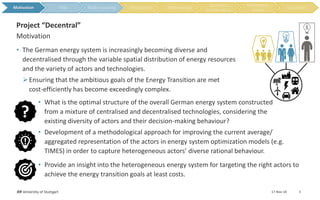
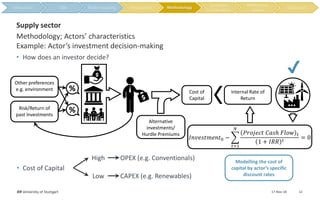
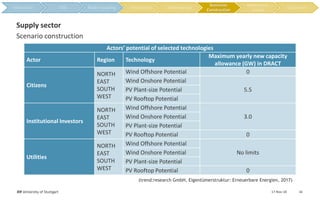
Preliminary results & discussion
Supply sector
Yearly CO2 emissions
Preliminary
results](https://image.slidesharecdn.com/1stpresentationintrosupplyalitash-181121064156/85/Actors-behaviour-analysis-in-a-decentralised-energy-system-Overview-of-TIMES-Actors-Model-and-the-German-supply-sector-19-320.jpg)
![WEST
SOUTH
EAST
NORTH
0%
20%
40%
60%
80%
100%
120%
140%
160%
Base-Year
RES_DRACT
RES_NOACT
CO2_DRACT
CO2_NOACT
RES_CO2_DRACT
RES_CO2_NOACT
RES_DRACT
RES_NOACT
CO2_DRACT
CO2_NOACT
RES_CO2_DRACT
RES_CO2_NOACT
RES_DRACT
RES_NOACT
CO2_DRACT
CO2_NOACT
RES_CO2_DRACT
RES_CO2_NOACT
RES_DRACT
RES_NOACT
CO2_DRACT
CO2_NOACT
RES_CO2_DRACT
RES_CO2_NOACT
RES_DRACT
RES_NOACT
CO2_DRACT
CO2_NOACT
RES_CO2_DRACT
RES_CO2_NOACT
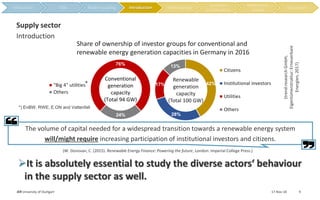
2013 2020 2030 2040 2050 2060
Regions
Share[%]
17-Nov-18IER University of Stuttgart 20
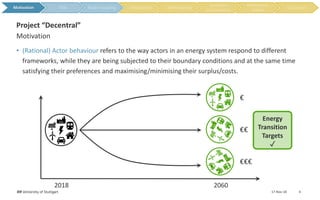
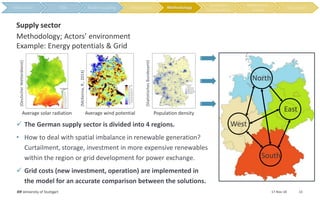
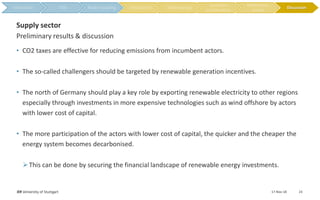
Preliminary results & discussion
Supply sector
Regional share of renewables in gross electricity consumption
Preliminary
results](https://image.slidesharecdn.com/1stpresentationintrosupplyalitash-181121064156/85/Actors-behaviour-analysis-in-a-decentralised-energy-system-Overview-of-TIMES-Actors-Model-and-the-German-supply-sector-20-320.jpg)
![0
200
400
600
800
1000
1200
1400
1600
1800
2000
RES_DRACT
RES_NOACT
CO2_DRACT
CO2_NOACT
RES_CO2_DRACT
RES_CO2_NOACT
RES_DRACT
RES_NOACT
CO2_DRACT
CO2_NOACT
RES_CO2_DRACT
RES_CO2_NOACT
Export Import
Exchange[TWh]
WEST
SOUTH
EAST
NORTH
17-Nov-18IER University of Stuttgart 21
Preliminary results & discussion
Supply sector
Cumulative (2020 – 2060) net electricity exchange between regions
Preliminary
results](https://image.slidesharecdn.com/1stpresentationintrosupplyalitash-181121064156/85/Actors-behaviour-analysis-in-a-decentralised-energy-system-Overview-of-TIMES-Actors-Model-and-the-German-supply-sector-21-320.jpg)
![0%
10%
20%
30%
40%
50%
60%
70%
80%
90%
100%
RES_DRACT
CO2_DRACT
RES_CO2_DRACT
RES_DRACT
CO2_DRACT
RES_CO2_DRACT
RES_DRACT
CO2_DRACT
RES_CO2_DRACT
RES_DRACT
CO2_DRACT
RES_CO2_DRACT
NORTH EAST SOUTH WEST
Share[%]
Utilities
Institutional investors
Citizens
17-Nov-18IER University of Stuttgart 22
Preliminary results & discussion
Supply sector
Regional share of actors in the existing renewable capacity of the year 2050
Preliminary
results](https://image.slidesharecdn.com/1stpresentationintrosupplyalitash-181121064156/85/Actors-behaviour-analysis-in-a-decentralised-energy-system-Overview-of-TIMES-Actors-Model-and-the-German-supply-sector-22-320.jpg)

The document discusses the analysis of actors' behavior in Germany's decentralised energy system, focusing on the Times-Actors-Model (TAM) to optimize energy system performance and meet energy transition targets effectively. It highlights the complexity of ensuring cost-efficient energy transitions due to the diverse spatial distribution of resources and actor decision-making behavior. The study evaluates various policy instruments and scenarios impacting investments and renewable energy adoption to facilitate a quicker and cheaper decarbonization of the energy system.


