
Recommended
Recommended
More Related Content
More from ericka770707
More from ericka770707 (10)
Recently uploaded
Recently uploaded (20)
Actividad excel 270711 (competitiva 1)
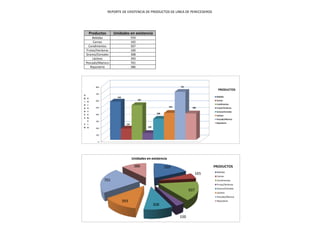
- 1. REPORTE DE EXISTENCIA DE PRODUCTOS DE LINEA DE PERECEDEROS Productos Unidades en existencia Bebidas 559 Carnes 165 Condimentos 507 Frutas/Verduras 100 Granos/Cereales 308 Lácteos 393 Pescado/Marisco 701 Repostería 386 800 701 PRODUCTOS 700 U 559 Bebidas N E 600 507 Carnes I X D I Condimentos 500 393 386 A S Frutas/Verduras D T Granos/Cereales 308 E E 400 Lácteos S N Pescado/Marisco C 300 Repostería E I 165 N A 100 200 100 0 Unidades en existencia 386 559 PRODUCTOS Bebidas 165 Carnes 701 Condimentos Frutas/Verduras Granos/Cereales 507 Lácteos Pescado/Marisco 393 Repostería 308 100
- 2. REPORTE DE PERECEDEROS SEMANAL 800 700 600 500 UNIDADES 400 300 200 100 0 Bebidas Carnes Condimentos Frutas/Verduras Granos/Cereales Lácteos Pescado/Marisco Repostería Unidades en existencia 559 165 507 100 308 393 701 386
- 3. REPORTE DE PERECEDEROS SEMANAL Repostería 386 Bebidas 12% 559 18% Carnes 165 Pescado/Marisco 5% 701 23% Condimentos 507 16% Lácteos Frutas/Verduras 393 100 13% Granos/Cereales 3% 308 10%
- 4. Empleado Abril Mayo Junio Buchanan, Steven $3,918.71 $4,937.57 $6,418.85 Callahan, Laura $7,487.88 $9,434.73 $12,265.15 Davolio, Nancy $8,836.64 $11,134.17 $14,474.42 Dodsworth, Anne $3,326.26 $3,958.25 $5,145.72 Fuller, Andrew $8,696.41 $10,348.73 $13,453.35 King, Robert $6,665.44 $7,931.87 $10,311.44 Leverling, Janet $10,884.74 $12,299.76 $15,989.68 Peacock, Margaret $11,346.14 $12,821.14 $16,667.48 Suyama, Michael $3,780.47 $4,271.93 $5,553.51 REPORTE DE VENTAS POR EJECUTIVO MENSUAL ABRIL-JUNIO $45,000.00 $40,000.00 $35,000.00 CANTIDAD DE VENTAS $30,000.00 $25,000.00 $20,000.00 $15,000.00 $10,000.00 $5,000.00 $0.00 Buchanan, Steven Callahan, Laura Davolio, Nancy Dodsworth, Anne Fuller, Andrew King, Robert Leverling, Janet Peacock, Margaret Suyama, Michael Junio $6,418.85 $12,265.15 $14,474.42 $5,145.72 $13,453.35 $10,311.44 $15,989.68 $16,667.48 $5,553.51 Mayo $4,937.57 $9,434.73 $11,134.17 $3,958.25 $10,348.73 $7,931.87 $12,299.76 $12,821.14 $4,271.93 Abril $3,918.71 $7,487.88 $8,836.64 $3,326.26 $8,696.41 $6,665.44 $10,884.74 $11,346.14 $3,780.47 REPORTE DE VENTAS MENSUAL $18,000.00 $16,000.00 $14,000.00 Buchanan, Steven $12,000.00 Callahan, Laura Davolio, Nancy CANTIDAD $10,000.00 Dodsworth, Anne $8,000.00 Fuller, Andrew King, Robert $6,000.00 Leverling, Janet $4,000.00 Peacock, Margaret Suyama, Michael $2,000.00 $0.00 Abril Mayo Junio MESES
- 5. No. País Trimestre 1 2011 1 Argentina $598.58 1 Brasil $4,880.19 1 México $1,122.78 1 Venezuela $2,735.18 2 Canadá $2,198.09 2 EstadosUnidos $13,783.33 3 Alemania $11,283.28 3 Austria $7,391.50 3 Bélgica $1,280.14 3 Dinamarca $1,396.19 3 España $861.89 3 Finlandia $943.27 3 Francia $4,205.46 3 Irlanda $2,755.24 3 Italia $864.44 3 Noruega $275.50 3 Polonia $163.70 3 Portugal $643.53 3 Reino Unido $2,943.31 3 Suecia $3,248.56 3 Suiza $1,368.53
- 6. Trimestre 2 2011 $742.24 $6,051.44 Título del Gráfico: Ventas Trimestrales Compañía “Compañía X” $1,392.25 Calcula las Ventas del Trimestre 2 considerando lo siguiente: $3,391.62 $2,879.50 - Las ventas en los países de América Latina se incrementaron en $18,056.16 - Canadá y EEUU un 31% $13,652.77 - Países de Europa 21% $8,943.72 $1,548.97 $1,689.39 $1,042.89 $1,141.36 $5,088.61 $3,333.84 $1,045.97 $333.36 $198.08 $778.67 $3,561.41 $3,930.76 $1,655.92
- 7. mpañía “Compañía X” rando lo siguiente: érica Latina se incrementaron en un 24%
- 8. VENTAS TRIMESTRALES DE LA COMPAÑIA LIBRERIA INTERAMERICANA $20,000.00 $18,000.00 $16,000.00 $14,000.00 CANTIDAD EN DOLARES $12,000.00 $10,000.00 Trimestre 1 2011 $8,000.00 Trimestre 2 2011 $6,000.00 $4,000.00 $2,000.00 $0.00 PRESENCIA DE LAS LIBRERIAS INTERAMERICANA
- 9. $35,000.00 $30,000.00 $25,000.00 CANTIDAD EN DOLARES $20,000.00 $15,000.00 $10,000.00 $5,000.00 $0.00 Estado Argenti Venezu Aleman Dinama Finland Norueg Portug Reino Brasil México Canadá sUnido Austria Bélgica España Francia Irlanda Italia Polonia Suecia na ela ia rca ia a al Unido s Trimestre 2 2011 $742.2 $6,051 $1,392 $3,391 $2,879 $18,05 $13,65 $8,943 $1,548 $1,689 $1,042 $1,141 $5,088 $3,333 $1,045 $333.3 $198.0 $778.6 $3,561 $3,930 Trimestre 1 2011 $598.5 $4,880 $1,122 $2,735 $2,198 $13,78 $11,28 $7,391 $1,280 $1,396 $861.8 $943.2 $4,205 $2,755 $864.4 $275.5 $163.7 $643.5 $2,943 $3,248